Embed Size (px)
Citation preview

ARTICLE OPEN
Disruption of nucleocytoplasmic trafficking as a cellularsenescence driverJi-Hwan Park1,14, Sung Jin Ryu2,13,14, Byung Ju Kim3,13,14, Hyun-Ji Cho3, Chi Hyun Park4, Hyo Jei Claudia Choi2, Eun-Jin Jang3,Eun Jae Yang5, Jeong-A Hwang5, Seung-Hwa Woo5, Jun Hyung Lee5, Ji Hwan Park5, Kyung-Mi Choi6, Young-Yon Kwon6,Cheol-Koo Lee6, Joon Tae Park7, Sung Chun Cho3, Yun-Il Lee3, Sung Bae Lee 8, Jeong A. Han9, Kyung A. Cho10, Min-Sik Kim 5✉,Daehee Hwang11✉, Young-Sam Lee3,5✉ and Sang Chul Park3,12✉
© The Author(s) 2021
Senescent cells exhibit a reduced response to intrinsic and extrinsic stimuli. This diminished reaction may be explained by thedisrupted transmission of nuclear signals. However, this hypothesis requires more evidence before it can be accepted as amechanism of cellular senescence. A proteomic analysis of the cytoplasmic and nuclear fractions obtained from young andsenescent cells revealed disruption of nucleocytoplasmic trafficking (NCT) as an essential feature of replicative senescence (RS) atthe global level. Blocking NCT either chemically or genetically induced the acquisition of an RS-like senescence phenotype, namednuclear barrier-induced senescence (NBIS). A transcriptome analysis revealed that, among various types of cellular senescence, NBISexhibited a gene expression pattern most similar to that of RS. Core proteomic and transcriptomic patterns common to both RS andNBIS included upregulation of the endocytosis-lysosome network and downregulation of NCT in senescent cells, patterns alsoobserved in an aging yeast model. These results imply coordinated aging-dependent reduction in the transmission of extrinsicsignals to the nucleus and in the nucleus-to-cytoplasm supply of proteins/RNAs. We further showed that the aging-associateddecrease in Sp1 transcription factor expression was critical for the downregulation of NCT. Our results suggest that NBIS is amodality of cellular senescence that may represent the nature of physiological aging in eukaryotes.
Experimental & Molecular Medicine (2021) 53:1092–1108; https://doi.org/10.1038/s12276-021-00643-6
INTRODUCTIONCellular senescence is characterized by the arrest of cell proliferation,which can be induced by various intrinsic and extrinsic stress factors;according to these factors, cellular senescence can be categorized asreplicative senescence (RS), which is caused by long-term celldivision; oncogene-induced senescence (OIS); DNA damage-inducedsenescence (DDIS); and oxidative stress-induced senescence (OSIS).All these types of senescence share common senescent hallmarks,such as permanent growth arrest, genomic instability, senescence-associated β-galactosidase (SA-β-gal) expression, the senescence-associated secretory phenotype, and heterochromatin foci forma-tion1 in addition to common transcriptomic signatures of cellularsenescence2. However, several differential senescence-associatedfeatures unique to these individual modalities lead to the questionof the nature of physiological aging. The shared and distinctivefeatures of the individual cellular senescence models have beenextensively reviewed3–6.
An increasing amount of evidence has indicated a novelsenescence-associated feature, i.e., resistance to intrinsic and extrinsicsignals7–9. This resistance can be explained by a novel concept, i.e.,dysfunctional transmission of signals between the cytoplasm andnucleus10–13. Under normal conditions, nucleocytoplasmic trafficking(NCT) proteins14 select signals that can pass through the nuclearmembrane through a process called selective permeability duringsignal transduction. For example, NCT is activated by the Ran proteingradient across a nuclear pore13. Disruption of the Ran gradient isfrequently observed in senescent cells, including DDIS models15, andin fibroblasts of patients with Hutchinson-Gilford progeria syn-drome16. Correspondingly, depletion of the Ran protein in mouseembryonic fibroblasts accelerates cellular senescence17. Aged yeastcells also show decreased transport across the nuclear membrane18.Moreover, the nuclear entry of Sp1, a key transcription factor thatinduces the expression of NCT-related genes, is decreased insenescent cells19. Furthermore, secondary mitotic and apoptotic
Received: 13 October 2020 Revised: 20 April 2021 Accepted: 10 May 2021Published online: 29 June 2021
1Korea Bioinformation Center, Korea Research Institute of Bioscience & Biotechnology, Daejeon 34141, Republic of Korea. 2Samsung Advanced Institute of Technology, SamsungElectronics Co., Ltd., Suwon 16677, Republic of Korea. 3Present address: Well Aging Research Center, Division of Biotechnology, DGIST, Daegu 42988, Republic of Korea.4Department of Computer Science and Engineering, Kangwon National University, Chuncheon 24341, Republic of Korea. 5Department of New Biology, DGIST, Daegu 42988,Republic of Korea. 6Department of Biotechnology, College of Life Sciences and Biotechnology, Korea University, Seoul 02841, Republic of Korea. 7Division of Life Sciences, Collegeof Life Sciences and Bioengineering, Incheon National University, Incheon 22012, Republic of Korea. 8Department of Brain & Cognitive Science, DGIST, Daegu 42988, Republic of Korea.9Department of Biochemistry and Molecular Biology, Kangwon National University School of Medicine, Chuncheon 24341, Republic of Korea. 10Department of Biochemistry, ChonnamNational University, Medical School, Gwangju 61469, Republic of Korea. 11Department of Biological Sciences, Seoul National University, Seoul 08826, Republic of Korea. 12The Future Life& Society Research Center, Advanced Institute of Aging Science, Chonnam National University, Gwangju 61469, Republic of Korea. 13Present address: UBLBio Corporation, Suwon 16679,Republic of Korea. 14These authors contributed equally: Ji-Hwan Park, Sung Jin Ryu, Byung Ju Kim. ✉email: [email protected]; [email protected]; [email protected]; [email protected]
www.nature.com/emm
signals, such as signals transmitted through the p-ERK, p-P38, and p-Jun kinase signaling pathways, are trapped in the cytoplasm ofsenescent cells8,19–23. Considering the findings showing that NCT isdisrupted during cellular senescence, we previously proposed anuclear barrier hypothesis of aging12,24. The nuclear barrier is a
functional concept formed on the basis of dysregulated NCT proteinsin senescent cells. This barrier disrupts the selective permeability ofsignals passing through the nuclear membrane, which is activelymodulated by intact NCT proteins. This nuclear barrier hypothesiswas originally based on the expression of several molecular markers;
Young(n=3)
Nucleus
Cytoplasm
Nucleus(set 1)
126
127N
127C
128N
128C
129N
129C
130N
130C
131
Cytoplasm(set 2)
Tryptic digestion
10-plex TMT labeling
Peptide samples
TMT labeled peptides (2 sets)
Old(n=3)
LMB-treated(n=3)
Young
msalpotyCsuelcuN
Old LMB-treated Universalreference
mid-pH reverse phase(mRP) fractionation
LC-MS/MSEasy-nLC & Q-Exactive
24 mRP peptide fractions
24 LC-MS/MS dataset(Nucleus, Set 1)
24 LC-MS/MS dataset(Cytoplasm, Set 2)
mRP
Up
RNA processing &transport
Glucose & fatty acidmetabolism
Nucleocytoplasmictrafficking
Endocytic &lysosome network
Mitochondrialorganization &
transport
Immune response,Intracellular signaling
Down6
Z-score Z-score
msalpotyCsuelcuN
60 0
Cell cycleDNA replication
DNA repairchromosome organization
SpliceosomeRNA processingRNA transport
ribosome assemblyRibosome biogenesis in eukaryotes
nuclear exportnuclear import
integrin-mediated signaling pathwayendocytosisLysosome
mitochondrial transportmitochondrion organization
Fatty acid metabolismGlycolysis / Gluconeogenesisimmune response-activating
signal transductioninnate immune response
cytokine-mediated signaling pathwaysmall GTPase mediated
signal transductionRas protein signal transduction
Nucleus(336)
Cytoplasm(270)
311 25 245
Nucleus(389)
Cytoplasm(213)
375 14 199
Up
log2-fold-change
msalpotyCsuelcuN
-log 10
( P v
alue
)
Down
16
12
8
4
0-6 -4 -2 0 2 4 6
log2-fold-change
16
12
8
4
0-6 -4 -2 0 2 4 6
Down(389)
Up(336)
Down(213)
Up(270)
Imp α1
p7 p23 p33
HDFs
p42 p47 p53
Imp β
CRM1
RanBP1
pS10H3
p53
p16
Actin
RCC1
a
eb
c
d
Cell cycle
- 70
- 100
- 100
- 50
- 25
- 15
- 50
- 15
- 40
kDa(DT, day) 1 1.5 5 8 10 14
J.-H. Park et al.
1093
Experimental & Molecular Medicine (2021) 53:1092 – 1108
1234567890();,:

however, for the nuclear barrier formation and functional implica-tions to be realized, systematic global proteome and transcriptomeanalyses are required.In this study, we initially performed proteomic analysis of
cytoplasmic and nuclear fractions from young and senescent cellsto analyze aging-dependent nucleocytoplasmic protein segrega-tion patterns. The expression of NCT and RNA processing-/transport-related proteins was downregulated in the nucleus ofsenescent cells, but the expression of endocytosis-lysosomepathway-related proteins was upregulated. In contrast, theexpression of immune response-related proteins was down-regulated in the cytoplasm. These aging-dependent differencesin nucleocytoplasmic protein distribution support the presence ofa nuclear barrier in senescent cells. Blocking NCT to induce anuclear barrier led to the acquisition of a senescence phenotypereferred to as nuclear barrier-induced senescence (NBIS), andchanges in the nuclear and cytoplasmic proteomes were found tobe similar to those associated with RS. A transcriptomic analysisrevealed that NBIS was associated with senescence-dependentexpression patterns that with most similar to those associatedwith RS than with other types of senescence (OIS, DDIS, or OSIS).Moreover, a nuclear barrier was also found in an aging yeastmodel. We further showed that age-associated downregulation ofSp1 transcription factor expression induced downregulation ofNCT-related gene expression. Taken together, the results of ourintegrative analysis implicate NBIS as a novel mechanism ofcellular senescence that is most similar to RS and demonstratethat nuclear barrier induction is an important characteristic of thephysiological aging of eukaryotes.
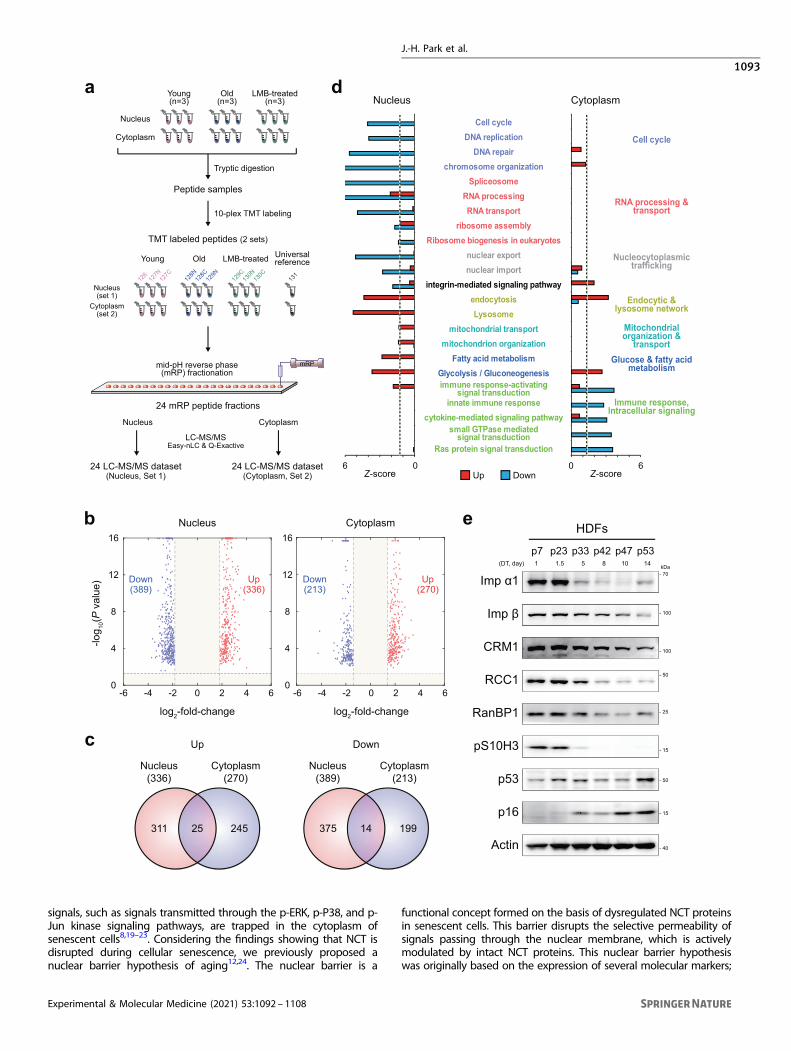
RESULTSProteomic analysis reveals the presence of a nuclear barrier insenescent cellsAccording to the nuclear barrier hypothesis, proteins are distributedseparately in the cytoplasm and nucleus of senescent cells. To testthis hypothesis, we isolated the cytoplasmic and nuclear fractions ofyoung (control) and senescent cells (n= 3) with doubling times of 1and 14 days, respectively, and then performed comparativeproteomic analysis of these fractions. After tryptic digestion of eachsample, we performed tandem mass tag (TMT) labeling on thedigested peptides of the young and senescent cells in the nuclearfractions (Set 1) and on those of the young and senescent cells in thecytoplasmic fractions (Set 2) (Fig. 1a). The labeled peptide samples inSet 1 were fractionated into 24 fractions using mid-pH reverse-phasefractionation, and each fraction was then analyzed using liquidchromatography-tandem mass spectrometry analysis (LC-MS/MS);the same process was used to fractionate the peptide samples in Set2 (Fig. 1a). An MS-GF+25 database search of the peptides obtainedby LC-MS/MS led to the identification of 99474 unique peptides witha false discovery rate (FDR) criterion of 1% and 4967 protein groupswith two or more unique sibling peptides (Supplementary Table 1).To examine senescence-dependent changes in nucleocytoplas-
mic protein distribution, we compared the intensities of the TMTreporter ions and identified 8599 and 11254 differentiallyexpressed peptides (DE peptides) in the cytoplasm and nucleus
between young and senescent cells, respectively. We thenidentified 725 and 483 differentially expressed proteins (DEPs) inthe nucleus (336 upregulated and 389 downregulated insenescent cells) and the cytoplasm (270 upregulated and 213downregulated), respectively, with each DEP associated with twoor more unique DE peptides that showed consistent up- ordownregulation (Fig. 1b, c; Supplementary Table 2). Among theseDEPs, 39 (25 upregulated and 14 downregulated) were commonbetween the cytoplasmic and nuclear fractions. Consistent withour previous finding10,19, 32 NCT-related proteins were down-regulated in the nucleus of senescent cells compared to that ofyoung cells, including RNA-binding proteins (RANBP2/3), nucleo-porins (NUP98/133/155), mRNA export system-related proteins(RCC1, DDX39B, SARNP, and THO complex proteins THOC2/5), andlamin A/C (LMNA).For the systematic analysis of cellular processes affected by the
aging-dependent differential nucleocytoplasmic protein distribu-tion, we performed enrichment analysis of Gene Ontologybiological processes (GOBPs) and Kyoto Encyclopedia of Genesand Genomes (KEGG) pathways for the up- and downregulatedproteins in the cytoplasm or nucleus. The upregulated proteins inthe nucleus of senescent cells were mainly associated with theendocytic and lysosome network (endocytosis and lysosomes),glucose and fatty acid metabolism, and mitochondrial organiza-tion and transport (Fig. 1d). The downregulated proteins in thenucleus were associated with the cell cycle (DNA replication), NCT(nuclear export and import), RNA processing and transport(spliceosome and ribosome assembly), and integrin-mediatedsignaling pathways. On the other hand, the downregulatedproteins in the cytoplasm were associated with the innateimmune response and intracellular signaling (cytokine-mediatedsignaling and regulation of Ras and small GTPase signaling) (Fig.1d). The Western blot analysis of human diploid fibroblasts (HDFs)after different passages during RS confirmed that the expressionof NCT-related proteins was downregulated (Fig. 1e).Interestingly, the proteomic analysis revealed that a number of
proteins showed opposite alteration patterns in the nucleus andcytoplasm. For example, the expression of 28 proteins wasupregulated in the nucleus and downregulated in the cytoplasm,suggesting that they predominantly accumulate in the nucleusand are potentially associated with NBIS phenotypes. Westernblotting confirmed the up- and downregulation of the expressionof two representative proteins (ADRM1 and HSP90B1) in thenucleus and cytoplasm, respectively (Supplementary Fig. S1a).Moreover, we found that neither protein size, mass, isoelectricpoint (pI), nor disordered region accounted for the nuclear orcytoplasmic enrichment of these DEPs, suggesting that factorsother than physiochemical and structural factors may contributeto protein trafficking in the presence of the nuclear barrier insenescing cells (Supplementary Fig. S1b). Taken together, thesedata suggest that downregulated NCT and RNA processing andtransport form a nuclear barrier in senescent cells. This nuclearbarrier may result in the accumulation of proteins involved in theendocytic pathway, metabolism, and mitochondrial organizationin the nucleus, and nuclear trapping of the endocytic pathwaythen downregulates the immune response.
Fig. 1 Proteomic analysis reveals the presence of a nuclear barrier in senescent cells. a Overall scheme of proteomic analysis of nuclear andcytoplasmic fractions of young, senescent (RS), and leptomycin B-treated (LMB-NBIS) HDFs. Three biological replicates (n= 3) were analyzed.Sets 1 and 2, nuclear and cytoplasmic fractions, respectively; tandem mass tag (TMT) 126, 127N, and 127C for young HDFs; TMT 128N, 128C,and 129N for RS; and TMT 129C, 130N, and 130C for LMB-NBIS. b Volcano plots showing upregulated (red) and downregulated (blue) proteinsin the nucleus (left) and cytoplasm (right). c Relationships between upregulated (left) or downregulated (right) proteins in the nucleus andcytoplasm of RS. d Cellular processes (GOBPs) significantly (P < 0.1) enriched by upregulated (red) or downregulated (blue) genes in RS. The Z-score indicates –N-1(P), where P is the enrichment P value determined with DAVID software and N−1(·) is the inverse normal distribution.e Immunoblot of NCT-related proteins using whole-cell lysates of HDFs at different passages during senescence. Doubling times (DTs)corresponding to passage numbers are shown.
J.-H. Park et al.
1094
Experimental & Molecular Medicine (2021) 53:1092 – 1108

A chemically induced nuclear barrier leads to RS-likesenescenceDespite the association found between the nuclear barrier andcellular senescence, it is still unclear whether the nuclear barrier isa cause or result of cellular senescence. Thus, we first examined
the effect of the nuclear barrier on cellular senescence in humandiploid fibroblasts (HDFs) by treating these cells with leptomycin B(LMB) and wheat germ agglutinin (WGA), which inhibit nuclearexport and import, respectively. After treatment with LMB, thepercentage of SA-β-gal-positive HDFs increased significantly to
Up Down
Young withdrawal
WGA LMB
tnecseneSlawardhtiw+ +
pS10H3
Cytochemical assayChemiluminescence assay
p53
p21
pRb
Actin
NT 2d 4d 2d 4d8d+WGA
2d 4d 2d 4d S8d-WGA +LMB -LMB
% o
f β-g
al p
ositi
ve c
ells 100
80
60
40
20
0
Luminescence
(a.u./μg protein %)
100
80
60
40
20
0
Young
+WGA
+LMB
-LMB
-WGA
Senes
cent
γH2A
XM
erge
+ D
NA
53B
P1
Young WGA LMB Senescent
γH2A
X a
nd 5
3BP
1fo
ci+
cells
(%)
Tail
mom
ent (
a.u.
)
100
80
60
40
20
0
1086420
Young
WGA
LMB
Senes
cent
Young
WGA
LMB
Senes
cent
Senescent / Young(336)
LMB / Young(510)
219 117 393
Senescent / Young(270)
LMB / Young(244)
Senescent / Young(389)
LMB / Young(389)
Senescent / Young(213)
LMB / Young(176)
184 86 158
236 153 236 156 57 119
Up
log2-fold-change
-log 10
(P v
alue
)
Down
Down(389)
Up(510)
Down(176)
Up(244)
16
12
8
4
0-6 -4 -2 0 2 4 6
log2-fold-change
16
12
8
4
0-6 -4 -2 0 2 4 6
LMBSenescent BMLgnuoY SenescentYoung
LMB
Sen
esce
ntYo
ung
0Cor
rela
tion
coef
ficie
nt
1
ρ=0.78(P=0.05)
y=0.91xR2=0.60
ρ=0.82(P=0.05)
y=0.82xR2=0.67
88- 40-4-8
8
4
0
-4
Nucleus
LMB / Young
Sen
esce
nt /
Youn
g
88- 40-4-8
8
4
0
-4
Cytoplasm
msalpotyCsuelcuN Nucleus
Nucleus
Cytoplasm
Nucleus Cytoplasm
LMB / Young
Up DownCytoplasm
a
c
h
g
j
i
f
d
e
b
3<0
Z-sc
ore
Cell cycleDNA replicationnuclear importFatty acid metabolism
chromosome organizationSpliceosomeRNA processingRNA transportribosome assemblynuclear exportintegrin-mediatedsignaling pathwaymitochondrial transportmitochondrion organizationGlycolysis / Gluconeogenesisimmune response-activatingsignal transductioninnate immune responsecytokine-mediatedsignaling pathwaysmall GTPase mediatedsignal transduction
Senescent / Young
LMB / YoungSenescent / Young
LMB / YoungSenescent / Young
LMB / YoungSenescent / Young
LMB / Young
11-33<
J.-H. Park et al.
1095
Experimental & Molecular Medicine (2021) 53:1092 – 1108

more than 60% compared with that in young cells (approximately5%) (Fig. 2a, b). Interestingly, even when the HDFs were culturedcontinuously for 4 days after LMB withdrawal, the increase in SA-β-gal activity was not reversed, illustrating the irreversible natureof LMB-induced senescence. In contrast, after treatment withWGA, the percentage of SA-β-gal-positive HDFs increased toapproximately 15% but was restored to normal levels afterwithdrawal of WGA (Fig. 2a, b), revealing the reversible nature ofWGA-induced senescence.Next, we examined the effects of LMB and WGA on the cell
cycle by monitoring the levels of cell cycle markers. The levels ofp53 and p21, which are G0/G1 checkpoint regulators, increasedonly in the LMB-treated cells, and the increases in these levelswere maintained even after LMB withdrawal (Fig. 2c). In addition,LMB or WGA treatment decreased the levels of phosphorylated H3Ser-10 (pS10H3), a mitosis marker, and phosphorylated Rb (pRb), aG1/S marker (after 8 days of WGA treatment and after 2 days withLMB treatment; Fig. 2c). The decreases in these levels werereversed after WGA withdrawal but not after LMB withdrawal.Next, we compared the effects of LMB and WGA on DNA damageby staining for γH2AX and p53 binding protein 1 (53BP1). Thepercentage of HDFs with γH2AX and 53BP1 double-positivenuclear foci, which indicated DNA double-strand breaks (DSBs),increased to approximately 35% of total cells after WGA treatmentand to more than 40% after LMB treatment, compared withapproximately 15% of young HDFs (Fig. 2d). Correspondingly,neutral comet assays showed that the number of DSBs increasedafter LMB and WGA treatment (Fig. 2e). Notably, LMB treatmentled to a greater increase in the number of DSBs than WGA.Collectively, these data indicate that the inhibition of NCT by LMBtreatment can result in strong irreversible NBIS.We performed further proteomic analysis of the cytoplasmic
and nuclear fractions of young HDFs treated with or without LMB(Fig. 1a). Only the effects of LMB on nuclear and cytoplasmicproteomes were analyzed because LMB induced a strongerirreversible senescence phenotype similar to RS than was inducedby WGA. We then identified 899 DEPs (510 upregulated and 389downregulated) and 420 DEPs (244 upregulated and 176 down-regulated) in the nucleus and cytoplasm, respectively, of the LMB-treated cells (Fig. 2f). A comparison of these DEPs with those insenescent cells showed significant (P < 0.05) overlapping in boththe cytoplasm and nucleus (Fig. 2g). Correspondingly, there weresignificant (P < 0.05) correlations between the changes in theexpression of proteins between the LMB-treated cells and theyoung cells (LMB/Young) and senescent cells compared to youngcells (Senescent/Young) (Fig. 2h and Supplementary Fig. S2a), andthe proteome profiles of the cytoplasm and nucleus of the LMB-treated cells were more highly correlated with those of senescentcells than with those of young cells (Fig. 2i).
To examine cellular processes affected by LMB treatment, weperformed GOBP and KEGG pathway enrichment analysis for theup- and downregulated proteins in the nucleus or cytoplasm ofthe LMB-treated cells. The analysis showed that fatty acidmetabolism was upregulated in the nucleus, but the cell cycle,DNA replication, and NCT (nuclear import) were downregulated,consistent with the findings with senescent cells (Fig. 2j, top heatmap). Splicing, RNA processing/transport, and ribosome assemblywere consistently downregulated in the nuclei of senescent andLMB-treated cells (Fig. 2j). However, the proteins involved in theseprocesses showed mixed up- and downregulation in the LMB-treated nuclei (Supplementary Fig. S2b–e). To clarify the mixedalteration patterns, we built a network model describing theinteractions among the proteins involved in these processes. Thenetwork model shows that splicing is coordinately increased frompre-mRNA, 5′-end capping, and Complex A-C to intron and 3′-endprocessing with no U5 splicing, whereas mRNA transport,ribosome assembly, and formation of translation complexes arecoordinately decreased (Supplementary Fig. S2f). Moreover,mitochondrial organization/transport and innate immuneresponse/cytokine-mediated signaling were consistently upregu-lated in the nucleus and downregulated in the cytoplasm ofsenescent and LMB-treated cells, respectively; however, they alsoshowed the opposite patterns in the other compartments withmixed up- and downregulation patterns, possibly due to thecharacteristics of young cells even in the presence of a nuclearbarrier. Finally, we confirmed the predominant accumulation ofthe representative proteins in the nucleus (PSMB4, ADRM1, CTSD,and HEXB) or cytoplasm (HSPD1, CALD1, MYO6, and EPLIN) afterLMB treatment (Supplementary Fig. S3). All these data suggestthat cells undergoing NBIS, particularly those induced by nuclearexport inhibition, show RS-like senescence phenotypes andchanges in nucleocytoplasmic proteome distribution.
A genetically induced nuclear barrier also results in RS-likesenescenceWe showed that a chemically induced nuclear barrier caused RS-like senescence in HDFs. However, the chemicals that induce thisbarrier may induce limited inhibitory effects26,27 or may exertpotential off-target effects on nuclear transport28. Thus, we furtherconfirmed the aforementioned findings using genetic inhibition ofnuclear import and export (Supplementary Fig. S4a, b). Knock-down of CRM1, an exportin, or importin-α1, an importin, in HDFsusing shRNAs significantly increased the percentage of SA-β-gal-positive HDFs (Fig. 3a, b). This increase was greater in the CRM1-knockdown HDFs than in importin-α1-knockdown HDFs and wascomparable between CRM1-knockdown HDFs and HDFs under-going RS, consistent with the results shown in Fig. 2b. Interest-ingly, we also found that depletion of either CRM1 or importin-α1
Fig. 2 A chemically induced nuclear barrier leads to RS-like senescence. a HDFs stained for SA β-gal activity by the cytochemical (X-gal)method. Young HDFs were treated with 6 μg/ml wheat germ agglutinin (WGA) or 0.1 μg/ml leptomycin B (LMB) for 8 days and then culturedfor an additional 4 days after WGA and LMB removal. Bottom panels show 3× magnified versions of images, as indicated by the dashed box ontop. Scale bar, 50 μm. b Percentages of β-gal-positive cells (n > 200 cells). Left (white) and right (red) bars indicate the percentages estimatedby cytochemical and chemiluminescence assays, respectively. The means ± SD (n= 3) are reported; a.u., arbitrary unit. c Immunoblot usingwhole-cell lysates of young HDFs (NT), young HDFs treated with WGA or LMB, or RS HDFs (S). d Immunocytochemical detection of DNAdamage repair markers (53BP1 and γH2AX foci) in HDFs treated with WGA or LMB. Scale bar, 50 μm. Quantitative analysis of γH2AX and 53BP1double-positive nuclear foci was performed using micrographs of cells labeled with DNA damage repair markers (n > 200 cells). e Comet assayof young HDFs, WGA- and LMB-treated young HDFs, and RS HDFs (n > 50 cells). f Volcano plots showing upregulated (red) and downregulated(blue) proteins in the nucleus (left) and cytoplasm (right). g Relationships between upregulated (top) or downregulated (bottom) proteins inthe nucleus (left) and cytoplasm (right) of cells undergoing RS or LMB-NBIS. h Scatter plots showing significant (P < 0.05) Pearson correlations(ρ) of log2-fold-changes for the differentially expressed sibling peptides with consistent alteration directions for all DEPs measured from thenucleus (left) and cytoplasm (right) between cells undergoing RS and LMB-NBIS. Red lines denote regression lines, and the regressionequations are shown together with R2 values. i Heat maps showing correlations of protein levels measured from individual samples of young,senescent (RS), and LMB-treated (LMB-NBIS) HDFs. Color bar, gradient of the Pearson correlation. j Heat map showing the gene enrichmentpatterns of GOBPs and KEGG pathways by upregulated and downregulated proteins in the nucleus or cytoplasm of cells undergoing RS orLMB-NBIS. Color bar, gradient of Z-score for the enrichment P value determined with DAVID software.
J.-H. Park et al.
1096
Experimental & Molecular Medicine (2021) 53:1092 – 1108

CRM1 shRNAControl
Control Imp α1 shRNA
10080604020
0 CRM1Control
Imp α1Control%
of β
-gal
pos
itive
cel
ls
Y S
shRNA virus
shRNA virus
CRM1 Imp α1
Imp α1Control
p53
p21
γH2AX
Actin
p53
p21
γH2AX
Actin
Contro
l
CRM14d 7d 4d 7d
RCC1Con
trol
RCC1
p53p21
pS10H3γH2AX
Actin
Young Control RCC1 Senescent
ControlRCC1
SenescentYoung
ControlRCC1
Senescent
shRNA virus
shRNA virus
Chemiluminescence assayCytochemical assay
% o
f β-g
al p
ositi
ve c
ells
Tail
mom
ent (
a.u.
)100
80
60
40
20
0
8001
6
4
2
0
80
60
40
20
0
shRNA virus
Ran pAb
HC
150
100
50
0
YIP: anti-active Ran mAb
S*
GDP GTPγS
Y S
Rel
ativ
e R
anG
TP (%
)
a
d
e
hf
g
b
c
Luminescence
(a.u./μg protein %)
- 100
- 50
- 25
kDa
- 40- 40
- 15
- 25
- 50
kDa
- 25
- 50
kDa
- 70
- 50
- 25
kDa
- 15
- 50
- 25
- 15- 15
kDa
- 40
- 15
- 50
Fig. 3 A genetically induced nuclear barrier results in RS-like senescence. a HDFs infected with lentivirus expressing CRM1 shRNA orimportin-α1 shRNA for 9 days and treated with 1 μg/ml puromycin 2 days after infection. Representative images of cells stained for SA-β-galactivity by the cytochemical method. Scale bar, 50 μm. b Percentages of β-gal-positive cells in control and CRM1- or importin-α1-knockdownHDFs (n > 200 cells). Y and S, young and senescent HDFs, respectively. The β-gal assay was carried out 7 days after the start of puromycinselection. c Immunoblot of whole-cell lysates from HDFs infected with virus expressing CRM1 shRNA or importin-α1 shRNA. d Cell lysatesimmunoprecipitated with an anti-RanGTP antibody. As positive and negative controls, young cell lysates were used to pull down RanGTP aftertreatment with GDP or GTPγS. Immunoblotting of immunoprecipitates (IP) with an anti-Ran antibody. The right panel shows the quantitativeanalysis of RanGTP expression normalized to that of heavy chain. The results are representative of three independent experiments that areshown in the bar graph as the means ± SD. *, P < 0.05 (Student’s t-test). Y and S, young and senescent HDFs, respectively. e HDFs infected withlentivirus expressing RCC1 shRNA for 10 days. The cells were selected by treatment with 1 μg/ml puromycin 2 days after infection. Assays wereperformed 10 days after infection. Wide-field micrographs of cells stained for SA-β-gal activity by the cytochemical (X-gal) method. Bottompanels show 3× magnified versions of images as indicated by the dashed boxes on top. Scale bar, 50 μm. f Percentages of β-gal-positive cellsamong young, control shRNA-treated, RCC1-knockdown HDF, and RS HDF populations (Senescent) (n > 200 cells). Left (white) and right (red)bars indicate the percentages estimated by cytochemical and chemiluminescence assays, respectively. The data represent the means ± SD (n= 3); a.u., arbitrary unit. g Immunoblot using whole-cell lysates of HDFs infected with a lentivirus expressing control or RCC1 shRNA. h Cometassay with RCC1-knockdown HDFs and RS HDFs. The data represent the means ± SD (n > 50 cells).
J.-H. Park et al.
1097
Experimental & Molecular Medicine (2021) 53:1092 – 1108

induced DNA damage, as indicated by the increased levels ofγH2AX (Fig. 3c).Next, we examined whether genetic inhibition of the RanGTP
gradient can induce RS-like senescence. We first confirmed thatthe level of RanGTP was significantly (P < 0.05) reduced insenescent cells compared to young cells (Fig. 3d), consistent withthe gradual decrease in the protein levels of RCC1, a core enzymeinvolved in the generation of RanGTP, during RS (Fig. 1e).Knockdown of RCC1 in young HDFs using shRNAs (SupplementaryFig. S4c) significantly increased the percentage of SA-β-gal-positive HDFs, which reached a level comparable to that insenescent cells (Fig. 3e, f). Loss of RCC1 also increased the levels ofp53 and p21 expression but decreased the level of pS10H3expression (Fig. 3g). After knockdown of RCC1, the extent of theDNA damage was increased in the young HDFs, as indicated bythe increased levels of γH2AX and comet tail moments (Fig. 3gand h). Taken together, these data suggest that either chemicallyor genetically induced NBIS results in RS-like senescencephenotypes (cell cycle arrest and DNA damage).
Aging-dependent disruption of NCT is observed in yeastWe next examined whether disruption of NCT might be observedduring the senescence of budding yeast, a single-cell eukaryoticorganism with aging characteristics similar to those of cells inhigher organisms29. To this end, we first obtained previouslyreported mRNA expression profile data (GSE10018) for young (1generation) and old (18–20 generation) budding yeast cells (Fig.4a). For this analysis, we used mRNA expression profiles becauseno proteomic data were available for evaluating the cytoplasmicand nuclear fractions of young and old yeast cells. Thus, forcomparison, we performed mRNA expression profiling of youngand senescent HDFs (RS). We identified 2388 differentiallyexpressed genes (DEGs; 1328 upregulated and 1060 down-regulated genes in senescent HDFs) between young andsenescent HDFs and 1479 DEGs (689 upregulated and 790downregulated genes in old yeast cells) between young and oldyeast cells (Supplementary Table 3).We next performed GOBP and KEGG pathway enrichment
analyses of the up- and downregulated genes in senescent HDFsand old yeast cells. The enrichment analyses showed that theupregulated genes were significantly (P < 0.05) enriched inendocytosis and glucose and lipid metabolism in both senescentHDFs and old yeast cells. In contrast, the downregulated geneswere enriched in NCT (nuclear export) and RNA processing andtransport in senescent HDFs and old yeast cells (Fig. 4b). Next, weconfirmed that the expression of the following 10 representativegenes involved in NCT and RNA processing/transport wasdownregulated in two types of aging yeast models (replicativeand chronological aging models) using quantitative real-timepolymerase chain reaction (qRT-PCR) analysis: ANB1, RRS1, SEH1,and YRB1, which are involved in NCT, and ERB1, MRT4, RRP1, RRP4,IMP4, and RSA4, which are involved in RNA processing/transport(Fig. 4c and Supplementary Fig. S5). These data suggest thatdisruption of NCT, the formation of a nuclear barrier is evident inmultiple eukaryote models of cellular aging.
The senescence-associated changes in NBIS are most similar tothose in RSTo compare NBIS with other senescence models, we furtherperformed mRNA expression profiling of OIS (RasV12-overexpres-sing HDFs), OSIS (H2O2-treated HDFs), and DDIS (doxorubicin-treated HDFs) models, as well as NBIS models including LMB- andWGA-treated HDFs and RCC1-knockdown (RCC1-KD) HDFs. Wethen identified DEGs in each senescence model. For combiningDEGs from all senescence models (Supplementary Table 4), weperformed hierarchical clustering of the DEGs to examine thesimilarity in senescence-associated expression changes among thesenescence models. The NBIS models (LMB-treated, WGA-treated,
and RCC1-KD models) clustered with the RS model. Among theNBIS models, the LMB-treated model was grouped first with the RSmodel, consistent with the finding shown in Fig. 2h. On the otherhand, the OIS and stress-induced premature senescence models(OSIS and DDIS models) clustered separately (Fig. 5a).To compare the expression changes in these senescence
models, we next performed non-negative matrix factorization(NMF) clustering of the DEGs using their log2-fold-change valuesas previously described30 (Fig. 5b). Among the resulting clusters,we focused on the top 10 clusters: C1 and C6 included up- anddownregulated genes shared among all the models, respectively(‘all shared cluster’); C2-3 and C7-8 included up- and down-regulated genes predominantly common to the NBIS and RSmodels, respectively (‘NBIS-RS clusters’); C4 and C9-10 includedup- and downregulated genes predominantly evident in thestress-induced senescence models (‘stress clusters’); and C5included upregulated genes that were also upregulated in theRCC1 shRNA-transfected senescence and OIS models (‘RCC1-OIScluster’). Of the top 10 clusters, six (the all shared and NBIS-RS)clusters included genes that exhibited senescence-associatedexpression changes also observed in the RS model. Takentogether, these data suggest that among the various senescencemodels tested, the NBIS model is most similar to the RS model interms of senescence-associated expression changes.To identify the cellular processes associated with the DEGs, we
performed GOBP and KEGG pathway enrichment analysis of theDEGs in C1-10. To examine the relationships among the enrichedGOBPs/KEGG pathways, we generated two network modelsdescribing the relationships (edges) among the GOBPs and KEGGpathways (nodes) enriched with genes in the upregulated (C1-C5)and downregulated clusters (C6-C10). In the upregulated network,the ‘all shared cluster’ (C1) genes were associated with processesrelated to 1) cell cycle arrest and apoptosis; 2) mitochondrialorganization and oxidative phosphorylation; 3) protein transport;4) autophagy; 5) extracellular matrix (ECM) organization; and 6)proteoglycan metabolism, suggesting that these processes wereconsistently promoted in all the senescence models (Fig. 5c).‘NBIS-RS cluster’ (C2-3) genes were associated with endocytosisand lysosome organization, as well as cell cycle arrest (Fig. 5c).These data suggest that upregulation of cell cycle arrest andendocytic and lysosomal networks may play important roles in theNBIS and RS models. On the other hand, the ‘stress cluster’ (C4)and ‘RCC1-OIS cluster’ (C5) genes were predominantly associatedwith mitochondrial protein transport and immune response-related processes.In the downregulated network, the ‘all shared cluster’ (C6)
genes were associated with processes related to 1) NCT; 2) the cellcycle (chromatin organization and DNA replication); and 3) proteinubiquitination. ‘NBIS-RS cluster’ (C7-8) genes were associated withprocesses related to RNA processing/transport and nucleosidemetabolism, as well as NCT and the cell cycle (Fig. 5d). These datasuggest that the downregulation of NCT, the cell cycle, RNAprocessing/transport, and nucleoside metabolism may playimportant roles in the NBIS and RS models. On the other hand,‘stress cluster’ (C6-7) genes were predominantly associated withdifferentiation-related processes (regulation of cell differentiationand cell development). Notably, the processes related to sharedup- and downregulated genes in the NBIS and RS models werelargely consistent with those identified by proteomic analysis (Fig.1d) and conserved in aged yeast (Fig. 4b). Taken together, thesedata suggest the potential importance of these processescommon to both NBIS and RS in physiological cellular senescence.
Processes common to NBIS and RS coordinate the reduction ofNCTWe next generated network models describing the interactionsamong gene products involved in processes common to NBIS andRS according to protein-protein interactions (endocytic and
J.-H. Park et al.
1098
Experimental & Molecular Medicine (2021) 53:1092 – 1108

lysosomal network, NCT, and nucleoside metabolism). Theendocytic and lysosomal network (Fig. 6a) showed coordinatedupregulation of 1) ‘endocytosis’ pathways, including clathrin-dependent (CLTB, EPS15, SGIP1, GGA2, GRP107, DBNL, FNBP1L,CYFIP2, and HIP1R) and clathrin-independent (PI3KR1, RIN2, andRAB22A) pathways and lipid/lipoprotein transport pathways (LRP1/1B/3/12, LRPAP1, APOE, CD36, SORL1, and SYT1), and 2) lysosomaldegradation pathways of endocytosed proteins and lipids,including ceramidase (ASAH1), proteases (CTSD/F/H/K/O andTPP1), glycosidases (MAN2B1, MANBA, IDUA, HEXA/B, and GAA),vacuolar ATPases (ATP6V0A1/B/C and ATP6AP1), and lysosomalmembrane proteins (LAMP2/3 and SLC11A2/17A2). This orche-strated upregulation may reduce the transmission of extrinsicsignals to the nucleus.The NCT network (Fig. 6b) illustrated coordinated downregula-
tion of (1) the ‘NCT system’ (e.g., RAN, RCC1, CSE1L, and RANBP inthe RanGTP gradient), (2) ‘RNA export’ pathways (e.g., SRSF2/3/7,TRA2B, and U2AF1 for RNA; ANP32B/E, BUD13, and CHTOP formRNA), (3) ‘RNA processing’ pathways including spliceosomecomponents (e.g., SNRPB/D1/D3/E/F and HNRNPA1L2/A2B1/A3/D/H1/M) and splicing factors (SFPQ and PSIP1), and (4) rRNA
processing pathways for ribosome assembly (DKC1, IMP4, EMG1,DDX21, RRP1/7 A/15, FBL/L1, RRS1, and BOP1). These pathways areinvolved in the supply of proteins and RNAs produced in thenucleus to the cytoplasm. Their orchestrated downregulation mayreduce the supply of materials trafficked out of the nucleus.Moreover, the nucleoside metabolism network (Fig. 6c) showeddownregulation of metabolic pathways (UCK2, NT5C, CDA, CTPS1,DHODH, PRPS1L1, IMPDH1, DUT, TYMS, and TK1) that are linked tothe production of GTP, and therefore the GDP/GTP ratio ismaintained, which may explain the reduced supply of GTPavailable for the RanGTP gradient, resulting in disruption of theRanGTP gradient-dependent NCT system.Finally, qRT-PCR analysis confirmed similar changes in expres-
sion of the following representative genes during NBIS and RS(Fig. 6d): (1) DBNL, PIK3R1, and TPP1, which are involved inendocytic and lysosomal networks; (2) KPNA2 and RAN, which areinvolved in NCT; and (3) CTPS1, which is involved in nucleosidemetabolism. These networks collectively suggest decreased (1)transmission of extrinsic signals to the nucleus because ofincreased lysosomal degradation and (2) supply of materials fromthe nucleus to the cytoplasm because of substantially inhibited
G1
689 up-regulated genes
790 down-regulated genes
Young
Microarray experiments (n = 7)
Comparison of Old vs. Youngyeast cells (1,479 DEGs)
Enrichment analysis ofGOBP & KEGG pathway
OldG18
Generations of budding yeast
G20
1.5
AN
B1
G0 G12
1
0.5
0
***
G0 G12
1.5
RR
S1 1
0.5
0
**1.5
SE
H1
G0 G12
1
0.5
0
**
G0 G12
1.5
MR
T4
1
0.5
0
***
G0 G12
1.5
RR
P1 1
0.5
0
* 1.5
RS
A4
G0 G12
1
0.5
0
**
G0 G12
1.5
RR
P4 1
0.5
0
**
1.5
YR
B1
G0 G12
1
0.5
0
***
G0 G12
1.5
ER
B1 1
0.5
0
**
1.5IM
P4
G0 G12
1
0.5
0
***
a
c
b
RNA processing
RNA transport
nuclear export
endocytosis
lipid metabolic process
regulation of glucosemetabolic process
HDFs Yeast
Z-score04
Z-score40
Up-regulated insenescent cells
Down-regulated insenescent cells
Fig. 4 Disruption of NCT is conserved in aging yeast. a Schematic overview of the experimental design and microarray and data analyses.The number of DEGs between young and old yeast cells is presented. b Cellular processes (GOBPs) significantly (P < 0.1) enriched consistentlyby upregulated (red) or downregulated (blue) genes in aged yeast cells and HDFs undergoing RS. The Z-score indicates –N−1(P), where P is theenrichment P value determined with DAVID software and N−1(·) is the inverse normal distribution. c qRT-PCR analysis of representative genesinvolved in common NBIS-RS cellular pathways in the replicative aging yeast model. For the replicative aging model, the analysis wasperformed at 0 generations (young) and 12 generations (old). mRNA expression levels were first normalized to those of CDC19 (internalcontrol) and then further normalized by the mean mRNA expression level in young yeast cells. In this analysis, two additional non-DEGs, SEH1and YRB1, with P values close to the cutoff value, were included to confirm the downregulation of NCT. The values are presented as the means± SD (n= 2 or 3). *, P < 0.05; **, P < 0.01; and ***, P < 0.001 by Student’s t-test.
J.-H. Park et al.
1099
Experimental & Molecular Medicine (2021) 53:1092 – 1108

nuclear transport in both the NBIS and RS models. In summary,dysregulation of both endocytic and lysosomal networks andNCT may be critical for the RS-like physiological changesobserved in NBIS. These data collectively suggest that theformation of a nuclear barrier is as a key event in cellularsenescence.
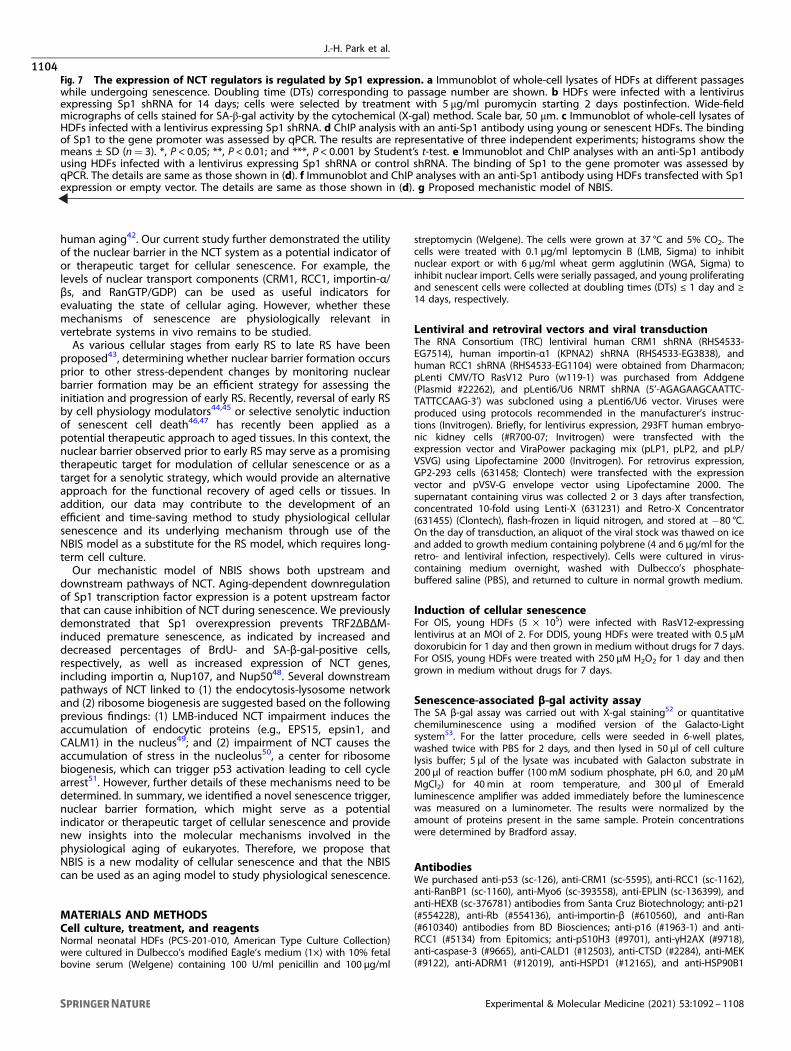
Knockdown of the Sp1 transcription factor downregulates theexpression of NCT-related genesWe previously reported that the expression levels of nucleoporins(Nups) and their associated nuclear pore complexes are decreasedduring senescence10 and that a senescence-dependent decreasein the expression of the Sp1 transcription factor is critical for thedownregulation of Nup expression15. We thus hypothesized that
the senescence-dependent decrease in Sp1 expression maycontribute to the downregulation of the expression of NCT-related genes, thereby leading to the establishment of a nuclearbarrier. To test this hypothesis, we first measured the proteinlevels of Sp1 in HDFs at different passages during RS. The proteinlevels of Sp1 were found to be decreased after passage 33 of cellsundergoing RS (Fig. 7a). We then examined the effect of Sp1 oncellular senescence, the cell cycle, and cell proliferation. Knock-down of Sp1 using optimal shRNAs (Supplementary Fig. S4d)increased SA-β-gal activity (Fig. 7b) and the expression levels ofp53, p21, and p16 (Fig. 7c). In contrast, Sp1 knockdown decreasedthe expression levels of pS10H3 and pRb (Fig. 7c). These dataindicate that downregulation of Sp1 expression can lead tocellular senescence.
a
C6 (718)
C9 (336)
C10 (336)
C7 (262)
C8 (195)
C1 (829)
C2 (310)
C3 (351)
C4 (256)
C5 (288)
RC
C1-
OIS
NB
IS-R
SS
tress
Stre
ssN
BIS
-RS
All
shar
ed
All
shar
ed
RCC1-KD / C
ontro
l
RasV12
/ Con
trol O
RF
H 2O 2
/ You
ng
Doxoru
bicin
/ You
ng
RS / You
ng
WGA / Y
oung
LMB / Y
oung
RCC1-KD / C
ontro
l
RasV12
/ Con
trol O
RF
H 2O 2
/ You
ng
Doxoru
bicin
/ You
ng
RS / You
ng
WGA / Y
oung
LMB / Y
oung
RCC1-KD / C
ontro
l
RasV12
/ Con
trol O
RF
H 2O 2
/ You
ng
Doxoru
bicin
/ You
ng
RS / You
ng
WGA / Y
oung
LMB / Y
oung
2<<-
2
log 2-f
old-
chan
ge
mRNA metabolism
Proteinubiquitination
Actin ( ) & microtubule ( )cytoskeleton organization
tRNA aminoacylation& tRNA processing
Nucleosidemetabolism
NBIS-RS clusters Stress clustersAll shared clusters RCC1-OIS cluster
DNA replication ( )
Chromatin organization( )
& DNA packaging ( )
rRNA processing RNA processing
Nuclear transport ( )
Chemokine production
Leukocyte chemotaxis & Chemokine signaling pathway
Mitochondrial transport
Cell development
Cell differentiationOxidative
phosphorylation
Heparan sulfateproteoglycan metabolism
Mitochondrion organiztaion ( )
Autophagy ( )
Protein transport ( )
Cell cycle arrest ( )
Negative regulation of cell proliferation ( )
Apoptosis ( )
Inflammatory response
Adaptive immune response
Endocytosis
Lysosomeorganization
Cell cycle ( )
ECM organization ( )
b
c d
Fig. 5 The senescence-associated changes in NBIS are most similar to those in RS. a Hierarchical clustering of seven cellular senescencemodels (RS-, WGA- and LMB-treated HDFs, RCC1-knockdown HDFs, OIS, OSIS, and DDIS) based on DEGs in at least one of the seven models (asdetermined by Euclidean distance and average linkage method). Colors represent the increase (red) and the decrease (blue) in mRNAexpression levels for each senescence model with respect to its corresponding control. The color bar denotes the gradient of log2-fold-changebetween each senescence model and its corresponding control. b Top 10 clusters of DEGs identified by NMF clustering analysis based on theirdifferential expression patterns across the seven cellular senescence models. The color scheme is the same as that shown in (a). c, d Processnetwork models constructed for upregulated genes in C1-5 (c) and downregulated genes in C6-10 (d) using cellular process associationanalysis. Magenta and purple nodes represent GOBPs/KEGG pathways significantly (P < 0.1) enriched with genes in at least one of theupregulated (C1-5) and downregulated clusters (C6-10). Edges represent significant genes overlap between the connected GOBPs/KEGGpathways. Label colors or circle colors indicate that the corresponding GOBPs/KEGG pathways are enriched by the genes in the correspondingclusters (see legend at the bottom of the figures). Circles are used only for a GOBP/KEGG pathway enriched by two or more types of clusters,including ‘All shared clusters’.
J.-H. Park et al.
1100
Experimental & Molecular Medicine (2021) 53:1092 – 1108

We next sought to determine whether Sp1 can regulate theexpression of NCT-related genes. Chromatin immunoprecipitation(ChIP) analysis using sheared chromatin obtained from young andsenescent HDFs showed that Sp1 bound to the promoters ofimportins (α1 and β), Ran, RanBP1, CRM1, and RCC1 and that thebinding strengths decreased as the HDFs senesced (Fig. 7d).
Knockdown of Sp1 expression in young HDFs resulted in the samedecrease in binding to promoters of NCT-related genes (Fig. 7e),which caused downregulated expression of RCC1 (Fig. 7c, e). Onthe other hand, overexpression of Sp1 in young HDFs increasedbinding to promoters of these NCT-related genes (Fig. 7f).Together with the previous finding of the aging-dependent
CSE1LRAN
ARSA
GNSARSG
RANBP1
ASAH1
IPO4
KPNA4KPNA2
NUP37 NUP35
NUP107SEH1L
XPOTNDC1
TK1
NT5C
TYMS
UCK2
NT5C
NT5C
UCK2CDA
DUT
GNPTABGNPTG
RCC1 RAN
LOXL4
SH3KBP1NEDD4L
MFGE8 HSPH1
CTPS1
NT5C
PRPS1L1
IMPDH1
DHODH
SNRPA SNRPA1PHF5A
SNRPB SNRPD1SNRPD3
SNRPESNRPF
MINA
FBLL1UTP11L
HNRNPMFUS
HNRNPA1L2HNRNPA3
HNRNPD
PTBP1HNRNPH1
RBMXRBMXL1
HNRNPA2B1
IMP4
RRP15EMG1
DDX21
RRP7A
POP1SARS
FARSA
FARSB
RANRCC1
VARSDARS2
U2AF1
SRSF2SRSF3
XPOTANP32B
TRA2B
SRSF7
CHTOPBUD13
ANP32E
RBM3
EBNA1BP2NOC2L
MRTO4
BYSL
NOP16
GTPBP4
NLE1
LRP3LRP1
LRPAP1LRP12APOE
LRP1B
ABCA1
SYT1CD36
SORL1
B2MPLA2R1ACKR4
GRK4TGFBR2
EPS15FNBP1L
CYFIP2GGA2AP3M2
HIP1RCLTB
DBNL
GPR107
SGIP1
APP
ADRB2 RAB31
GAPVD1
RIN2
RAB22APIK3R1CTSO
CTSDCTSK
CTSF TPP1CTSH
HPS1
HEXBIDUAGAA
MAN2B1 MANBAHEXA
GM2APSAP
CLN5SLC17A5
MCOLN1LAMP3
SLC11A2LAMP2
NPC2LMBRD1
TMEM106BATP6V0B
ATP6V0C
ATP6V0A1ATP6AP1
RPSA
AGO2 EEF1E1
EIF4A1
SUMF1
RPL39L
TICRREIF5A
RPL22L1
GSPT1
LSM6PPIH
LSM5USB1
LSM4
NOP2
BOP1RRS1
DKC1 RRP1C1QBP FBL
NOP56
PA2G4
EXOSC8EXOSC2
EXOSC9
TSEN15ZNF259SFPQKHDRBS3
TTF2 PSIP1DDX20
RBM38
Nucleus
Nucleolus
Cytosol
Plasma membrane
ITS1/2cleavage
Box C/DsnoRNPs
Box H/ACAsnoRNPs
rRNAmodification
DEAD-box helicase
Ribosomal40S subunit
tRNA processing& aminoacylation
RNA export
U1U2 U4/U6
mRNA export
18S
rRN
A
Ran-GTP
Ran-GTP
Nucleoplasmic ring
43S preinitiationcomplex
Nucleoside metabolism
EIF2
mRNA
Lipid transportClathrin-dependent transport
Endosome
ATPeV
Ceramidase
Sulfatases Glycosidases
Proteases
Lysosomal membrane proteins
SNARE interactionsin vesicular transportActivation of lysosomal
sulfatase precursor
Clathrin-independent transport
Lipoproteins
Cholesterol efflux
Spokecomplex
Luminal ring
Cytoplasmicmaturation of ribosomes
Ran-GDP
Ran-GDP
Ran-GTP
Pre-rRNA(18S+5.8S+25S)
5.8S
+25S
rRN
A
Ribosomal60S subunit
Exonucleolytic trimming
Ran-GDP
Ribose-5P PRPP Orotidine-5P
OrotateDihydroorotate
IMP UMPUDP
CMP
dCMP
CDP
dCDP
enidirUPTU
Cytidine
Thymidine
XMP
GMP
CTP
dCTP
dUTP dUMP
dTMP
GTP
Guanosine
Up-regulated in all aging models
Down-regulated in all aging models
Up-regulated in RS and NBIS
Down-regulated in RS and NBIS
RNA transport
RNA processing
Nucleartransport
rRNAprocessing
Lysosome organization
Endocytosis& Vesicle transport
2
1.5
CTP
S1
1
0.5
0
3
DB
NL 2
1
0
1.5
KP
NA
2 1
0.5
0
4
TPP
1
3
2
1
0
1.5
RA
N
1
0.5
0
3
PIK
3R1 2
1
0
******
******
******
***
****** ***
***
Young Senescent LMB Young Senescent LMB Young Senescent LMB
Young Senescent LMB Young Senescent LMB Young Senescent LMB
a
cb
d
J.-H. Park et al.
1101
Experimental & Molecular Medicine (2021) 53:1092 – 1108

downregulation of Sp1 expression, these data suggest a mechan-istic model for NBIS (Fig. 7g). In this model, an aging-dependentdecrease in Sp1 expression may be critical for the downregulationof the expression of NCT-related genes, thereby leading to theformation of a nuclear barrier. The model also shows previouslyreported regulatory links of downregulated NCT to promotion ofthe endocytosis-lysosome network and inhibition of ribosomebiogenesis.
DISCUSSIONNCT is intimately associated with the regulation of cellularfunctions in the nucleus, such as the cell cycle, DNA replication/repair, chromatin remodeling, and transcriptional activation. Theseevents are also ATP-driven and energy-consuming processes. Ascells undergo senescence, these events are slowed or halted in atime-dependent manner. However, how senescent cells coordi-nate these complicated processes effectively is unclear. In thisstudy, we showed that this process can be initially activated by thesimultaneous shutdown of energy-consuming nuclear events andNCT through the formation of a nuclear barrier. Integrativeproteomic and transcriptomic analysis showed that dysregulationof endocytic and lysosomal networks and NCT in senescent cellsresults in the coordinated reduction in the transmission ofextrinsic signals to the nucleus and the supply of proteins andRNAs trafficked from the nucleus. This feature was also observedin aging yeast, implying that nuclear barrier formation is acharacteristic of physiological aging in all eukaryotes.Our integrative analysis of proteomic and transcriptomic data
showed consistent alterations in cellular processes in RS and NBIS:upregulation of endocytic and lysosomal networks and mitochon-drial organization and downregulation of NCT and the cell cycle/DNA replication. In addition, the proteomic data provided furtherinformation complementary to transcriptomic data indicating thelocation of these alterations in either the nucleus or cytoplasm.This additional information suggests functional relationshipsamong these processes: Dysregulation of NCT may induceaccumulation of proteins involved in endocytic and lysosomalnetworks and mitochondrial organization, resulting in theirupregulation in the nucleus. Moreover, the proteomic analysisrevealed senescence-associated nuclear enrichment of severalcellular processes that do not occur in the nucleus under normalconditions. For example, the levels of proteins involved in glucose,fatty acid metabolism, and mitochondrial organization wereelevated in the nucleus during senescence. According topreviously described canonical and noncanonical nuclear func-tions of these proteins31, their enrichment in the nucleus suggeststhe establishment of an energy supply in the nucleus (canonical)during senescence involving mitochondrial dysregulation orutilization of these proteins for nuclear signaling or transcriptionalregulation to counteract the reduction in signal transductionduring senescence; this speculation should be further tested usingdetailed experiments. On the other hand, a comparativetranscriptomic analysis of seven senescence models indicatedthat NBIS-specific alterations of cellular processes are alsocommon to RS. Thus, our integrative analysis of proteomic and
transcriptomic data afforded a more reliable and comprehensiveunderstanding of senescence-associated changes mediated bythe nuclear barrier.In this study, NBIS induced by WGA (WGA-NBIS) resulted in
weak reversible senescence responses (SA-β-gal activity and DNAdamage). In contrast, NBIS induced by LMB (LMB-NBIS) resulted instronger irreversible senescence responses than those induced byWGA-NBIS. Correspondingly, cells undergoing LMB-NBIS showedmore RS-like gene expression changes than those undergoingWGA-NBIS. Nuclear import enables extrinsic signal transmission tothe nucleus that allow adaptation of the transcriptional programto environmental alterations, and nuclear export supplies proteinsand RNAs from the nucleus to the cytoplasm, where they canexecute their cellular functions according to the transcriptionalprogram. Our results suggest that impaired nucleus-to-cytoplasmtransport of proteins and RNAs might be more effective forinducing irreversible senescence phenotypes than reversibledisruption of the transmission of extrinsic signals to the nucleus.One of the shared features of NBIS and RS is the upregulation ofendocytic and lysosomal degradation of proteins and lipids, whichmay compensate for the reduction in nuclear signal transmission.Notably, differential effects of WGA and LMB on senescencecannot be ruled out, and the weaker senescence phenotypesobserved after WGA treatment might have been partially theresult of inadequate inhibition or off-target effects.Conventional senescence models (RS, OIS, OSIS, and DDIS
models) were previously shown to exhibit shared features,including increased SA-β-gal activity and DNA damage32. How-ever, differences between RS models and other senescencemodels have also been reported33,34. For example, comparativeproteomic analyses of OSIS and RS models have revealed asignificant number of differentially regulated proteins in cellsundergoing RS and OSIS34. Moreover, the expression of hTERT hasa senescence-bypassing effect in RS but not in OIS33. In this study,we compared the genome-wide gene expression profiles in theRS, OIS, OSIS, and DDIS models. The RS model showedsenescence-associated gene expression patterns that were distinctfrom those of the OIS, OSIS, and DDIS models. In contrast to RS,OIS was predominantly associated with inflammatory andadaptive immune responses, while OSIS and DDIS were associatedwith cell development. In contrast, there was a considerableoverlap of senescence-associated gene expression patternsbetween the NBIS and RS models, such as downregulatedexpression of genes related to NCT and upregulated expressionof genes related to endocytosis and lysosome networks, indicatingthe significance of these pathways in physiological cellularsenescence. Interestingly, although NBIS indirectly induces DNAdamage (Fig. 2d) putatively via p53-related apoptosis35 or RNAGTPase-associated ROS36, the NBIS model in our study showeddifferent mRNA expression alteration patterns than the DDISmodel, in which DNA damage was directly induced by doxor-ubicin (C7-8 and C9-10 in Fig. 5b). Due to the direct damagemechanism, DDIS results in more severe DNA damage than NBIS.The difference in the damaging mechanism and severity maycause differential mRNA expression alteration patterns in NBIS andDDIS, as indicated by different sets of genes with expression levels
Fig. 6 Processes common to NBIS and RS coordinate the reduction of NCT. a–c Network models showing interactions among DEGsinvolved in endocytosis and lysosomal degradation (a), nuclear transport and RNA processing (b), or nucleotide metabolism (c). Node colorsrepresent the clusters to which the corresponding belong (see legend box). Gray lines denote protein-protein interactions, arrows representthe transport of molecules or metabolic reactions, the dotted line denotes the membrane of the nucleolus, and the two thick lines representthe plasma or nuclear membrane. Names of complexes or functional modules for the closely located genes are shown. d qRT-PCR analysis ofrepresentative genes in the cellular pathways common to both NBIS and RS. The analyzed genes are shown as large nodes in the networkmodels (a–c). mRNA expression changes were first normalized to those of RPS11 (internal control) and then further normalized by the meanmRNA expression change in young HDFs. The values are presented as the means ± SD (n= 2 or 3). *, P < 0.05; **, P < 0.01; and ***, P < 0.001 byone-way analysis of variance with Dunnett’s post hoc test.
J.-H. Park et al.
1102
Experimental & Molecular Medicine (2021) 53:1092 – 1108

that were specifically downregulated by NBIS (POLD2) and DDIS(REV3L, RMI2, and CUL4B).Moreover, the pathological implications of NCT have been
observed in several diseases, such as cancers, metabolic disorders,and infectious diseases37. For example, CRM1 expression is highlyupregulated in various types of cancers, such as rectal cancer,
osteosarcoma, and ovarian cancer38–40. Mutations in the mRNAexport mediator GLE1 cause human lethal congenital contracturesyndrome-141. Disruption of the Ran gradient in pathologicalaging in Hutchinson-Gilford progeria syndrome has beenreported16. We recently found global transcriptional downregula-tion of mRNA export (TREX) and nuclear pore components in
p7 p23 p33
HDFsp42 p47 p53
a c
b
d
g
e f
Actin
Sp1
RCC1
pS10H3
Actinfor Sp1, p53, & p21
Actinfor RCC1 & p16
Sp1
Sp1 shRNAControl
shRNA virus
Sp1Control
shRNA virus
p21
p16
pRB
Actinfor pRB & pS10H3
p53
Sp1Control
shRNA virus
Young HDFsSenescent HDFs
0.2
0.15
0.1
0.05
0
% In
put
Impo
rtin α1
Impo
rtin β
GAPDHRan
RCC1CRM1
RanBP1
ControlSp1 shRNA0.4
0.3
0.2
0.1
0
% In
put
Impo
rtin α1
Impo
rtin β
GAPDHRan
RCC1CRM1
RanBP1
ControlSp10.4
0.3
0.2
0.1
0
% In
put
Impo
rtin α1
Impo
rtin β
GAPDHRan
RCC1CRM1
RanBP1
RCC1Sp1
Actin
Sp1Contro
lshRNA virus
RCC1Sp1
Actin
Sp1Contro
lOverexpression
Youn Sg enescent
Nucleus
RanGDP11
RanGTP
RNAProteins
RNAProteins
NCTgenes
Sp1Sp1Sp1
Sp1Sp1
Sp1 Sp1Sp1
Sp1 Sp1NCT
genes
Cytoplasm
Nucleus
RanGDP
RanGTP
CytoplasmROS
Degradation
Nucleolus Nucleolus
Ribosomebiogenesis
NCT NCT
p53
Cell cyclearrest
Importin α1
Importin β
RCC1
RanBP1
CRM1 Endocytic proteins (EPS15, epsin1, & CALM1)
Ub
Endocytosis-lysosomenetwork
Sp1
Sp1
Sp1
- 100
kDa
- 50
- 15
- 40
- 40
- 50
kDa
- 25
- 15
- 100
- 40
- 100
kDa
- 40
- 50kDa
- 100
- 40
- 50kDa
- 100
- 40
** * ** *** ***
**
***
***
***
*******
*
p > 0.6p = 0.1p = 0.06
** *** ***
*****
(DT, day) 1 1.5 5 8 10 14
J.-H. Park et al.
1103
Experimental & Molecular Medicine (2021) 53:1092 – 1108
human aging42. Our current study further demonstrated the utilityof the nuclear barrier in the NCT system as a potential indicator ofor therapeutic target for cellular senescence. For example, thelevels of nuclear transport components (CRM1, RCC1, importin-α/βs, and RanGTP/GDP) can be used as useful indicators forevaluating the state of cellular aging. However, whether thesemechanisms of senescence are physiologically relevant invertebrate systems in vivo remains to be studied.As various cellular stages from early RS to late RS have been
proposed43, determining whether nuclear barrier formation occursprior to other stress-dependent changes by monitoring nuclearbarrier formation may be an efficient strategy for assessing theinitiation and progression of early RS. Recently, reversal of early RSby cell physiology modulators44,45 or selective senolytic inductionof senescent cell death46,47 has recently been applied as apotential therapeutic approach to aged tissues. In this context, thenuclear barrier observed prior to early RS may serve as a promisingtherapeutic target for modulation of cellular senescence or as atarget for a senolytic strategy, which would provide an alternativeapproach for the functional recovery of aged cells or tissues. Inaddition, our data may contribute to the development of anefficient and time-saving method to study physiological cellularsenescence and its underlying mechanism through use of theNBIS model as a substitute for the RS model, which requires long-term cell culture.Our mechanistic model of NBIS shows both upstream and
downstream pathways of NCT. Aging-dependent downregulationof Sp1 transcription factor expression is a potent upstream factorthat can cause inhibition of NCT during senescence. We previouslydemonstrated that Sp1 overexpression prevents TRF2ΔBΔM-induced premature senescence, as indicated by increased anddecreased percentages of BrdU- and SA-β-gal-positive cells,respectively, as well as increased expression of NCT genes,including importin α, Nup107, and Nup5048. Several downstreampathways of NCT linked to (1) the endocytosis-lysosome networkand (2) ribosome biogenesis are suggested based on the followingprevious findings: (1) LMB-induced NCT impairment induces theaccumulation of endocytic proteins (e.g., EPS15, epsin1, andCALM1) in the nucleus49; and (2) impairment of NCT causes theaccumulation of stress in the nucleolus50, a center for ribosomebiogenesis, which can trigger p53 activation leading to cell cyclearrest51. However, further details of these mechanisms need to bedetermined. In summary, we identified a novel senescence trigger,nuclear barrier formation, which might serve as a potentialindicator or therapeutic target of cellular senescence and providenew insights into the molecular mechanisms involved in thephysiological aging of eukaryotes. Therefore, we propose thatNBIS is a new modality of cellular senescence and that the NBIScan be used as an aging model to study physiological senescence.
MATERIALS AND METHODSCell culture, treatment, and reagentsNormal neonatal HDFs (PCS-201-010, American Type Culture Collection)were cultured in Dulbecco’s modified Eagle’s medium (1×) with 10% fetalbovine serum (Welgene) containing 100 U/ml penicillin and 100 μg/ml
streptomycin (Welgene). The cells were grown at 37 °C and 5% CO2. Thecells were treated with 0.1 μg/ml leptomycin B (LMB, Sigma) to inhibitnuclear export or with 6 μg/ml wheat germ agglutinin (WGA, Sigma) toinhibit nuclear import. Cells were serially passaged, and young proliferatingand senescent cells were collected at doubling times (DTs) ≤ 1 day and ≥14 days, respectively.
Lentiviral and retroviral vectors and viral transductionThe RNA Consortium (TRC) lentiviral human CRM1 shRNA (RHS4533-EG7514), human importin-α1 (KPNA2) shRNA (RHS4533-EG3838), andhuman RCC1 shRNA (RHS4533-EG1104) were obtained from Dharmacon;pLenti CMV/TO RasV12 Puro (w119-1) was purchased from Addgene(Plasmid #22262), and pLenti6/U6 NRMT shRNA (5’-AGAGAAGCAATTC-TATTCCAAG-3’) was subcloned using a pLenti6/U6 vector. Viruses wereproduced using protocols recommended in the manufacturer’s instruc-tions (Invitrogen). Briefly, for lentivirus expression, 293FT human embryo-nic kidney cells (#R700-07; Invitrogen) were transfected with theexpression vector and ViraPower packaging mix (pLP1, pLP2, and pLP/VSVG) using Lipofectamine 2000 (Invitrogen). For retrovirus expression,GP2-293 cells (631458; Clontech) were transfected with the expressionvector and pVSV-G envelope vector using Lipofectamine 2000. Thesupernatant containing virus was collected 2 or 3 days after transfection,concentrated 10-fold using Lenti-X (631231) and Retro-X Concentrator(631455) (Clontech), flash-frozen in liquid nitrogen, and stored at −80 °C.On the day of transduction, an aliquot of the viral stock was thawed on iceand added to growth medium containing polybrene (4 and 6 μg/ml for theretro- and lentiviral infection, respectively). Cells were cultured in virus-containing medium overnight, washed with Dulbecco’s phosphate-buffered saline (PBS), and returned to culture in normal growth medium.
Induction of cellular senescenceFor OIS, young HDFs (5 × 10⁵) were infected with RasV12-expressinglentivirus at an MOI of 2. For DDIS, young HDFs were treated with 0.5 μMdoxorubicin for 1 day and then grown in medium without drugs for 7 days.For OSIS, young HDFs were treated with 250 μM H2O2 for 1 day and thengrown in medium without drugs for 7 days.
Senescence-associated β-gal activity assayThe SA β-gal assay was carried out with X-gal staining52 or quantitativechemiluminescence using a modified version of the Galacto-Lightsystem53. For the latter procedure, cells were seeded in 6-well plates,washed twice with PBS for 2 days, and then lysed in 50 μl of cell culturelysis buffer; 5 μl of the lysate was incubated with Galacton substrate in200 μl of reaction buffer (100mM sodium phosphate, pH 6.0, and 20 μMMgCl2) for 40min at room temperature, and 300 μl of Emeraldluminescence amplifier was added immediately before the luminescencewas measured on a luminometer. The results were normalized by theamount of proteins present in the same sample. Protein concentrationswere determined by Bradford assay.
AntibodiesWe purchased anti-p53 (sc-126), anti-CRM1 (sc-5595), anti-RCC1 (sc-1162),anti-RanBP1 (sc-1160), anti-Myo6 (sc-393558), anti-EPLIN (sc-136399), andanti-HEXB (sc-376781) antibodies from Santa Cruz Biotechnology; anti-p21(#554228), anti-Rb (#554136), anti-importin-β (#610560), and anti-Ran(#610340) antibodies from BD Biosciences; anti-p16 (#1963-1) and anti-RCC1 (#5134) from Epitomics; anti-pS10H3 (#9701), anti-γH2AX (#9718),anti-caspase-3 (#9665), anti-CALD1 (#12503), anti-CTSD (#2284), anti-MEK(#9122), anti-ADRM1 (#12019), anti-HSPD1 (#12165), and anti-HSP90B1
Fig. 7 The expression of NCT regulators is regulated by Sp1 expression. a Immunoblot of whole-cell lysates of HDFs at different passageswhile undergoing senescence. Doubling time (DTs) corresponding to passage number are shown. b HDFs were infected with a lentivirusexpressing Sp1 shRNA for 14 days; cells were selected by treatment with 5 μg/ml puromycin starting 2 days postinfection. Wide-fieldmicrographs of cells stained for SA-β-gal activity by the cytochemical (X-gal) method. Scale bar, 50 μm. c Immunoblot of whole-cell lysates ofHDFs infected with a lentivirus expressing Sp1 shRNA. d ChIP analysis with an anti-Sp1 antibody using young or senescent HDFs. The bindingof Sp1 to the gene promoter was assessed by qPCR. The results are representative of three independent experiments; histograms show themeans ± SD (n= 3). *, P < 0.05; **, P < 0.01; and ***, P < 0.001 by Student’s t-test. e Immunoblot and ChIP analyses with an anti-Sp1 antibodyusing HDFs infected with a lentivirus expressing Sp1 shRNA or control shRNA. The binding of Sp1 to the gene promoter was assessed byqPCR. The details are same as those shown in (d). f Immunoblot and ChIP analyses with an anti-Sp1 antibody using HDFs transfected with Sp1expression or empty vector. The details are same as those shown in (d). g Proposed mechanistic model of NBIS.
J.-H. Park et al.
1104
Experimental & Molecular Medicine (2021) 53:1092 – 1108

(#2104) from Cell Signaling Technology; anti-importin-α1 (NB100-1371)from Novus Biologicals; anti-actin (A1978) from Sigma; anti-53BP1 (#05-726) and anti-trimethylated-SPK (#07-1814) from Millipore; and anti-PSMB4(AB137067), anti-NRMT (AB72660) and anti-LMNA (AB26300) from Abcam.
RanGTP activation assayRanGTP levels were measured using Ran activation assay kits obtainedfrom Abcam (AB173247) or Cell Biolabs (#STA-409) according to themanufacturer’s instructions. For use with the former kit, a configuration-specific monoclonal antibody that specifically recognizes RanGTP but notRanGDP is used, while for use in the latter kit, RanBP1-agarose beads areused to selectively pull down RanGTP. Briefly, 5 × 10⁶ cells were lysed in100 μl of 1× assay/lysis buffer containing cOmplete protein inhibitorcocktail (Roche) and PhosSTOP (Roche). Lysates were centrifuged at14,000 × g for 10 min at 4 °C and then incubated on a rotator for 1 h at 4 °Cwith RanGTP antibody/protein A/G agarose or RanBP1 agarose beads,which were then separated from the supernatant by centrifugation at14,000 × g for 1 min and washed four times with 1× assay/lysis buffer. Thebeads were resuspended in 2× SDS sample buffer, heated at 95 °C for5 min, and the associated proteins were then resolved by SDSpolyacrylamide gel electrophoresis.
Chromatin-immunoprecipitation assayQuantitative ChIP was performed as previously described54. Briefly, 1 × 10⁷
cells were treated with 1% formaldehyde for 10min at 37 °C. Chromatinwas fragmented on ice by sonication with four 30-s pulses delivered from aBioruptor (Cosmo Bio). Chromatin was precleared by incubation withprotein A or G magnetic beads (Life Technologies). After the beads wereremoved, the chromatin was incubated overnight with specific or isotypecontrol antibodies at 4 °C, followed by incubation with protein A or Gmagnetic beads for 1 h at 4 °C. Bound protein-DNA complexes were elutedafter washing. DNA was isolated by phenol-chloroform extraction. Aportion of recovered DNA from each ChIP experiment was evaluated byqPCR using the primers listed in Supplementary Table 5.
Neutral comet assayA neutral comet assay was performed using a single-cell gel electrophor-esis assay kit (Trevigen) according to the manufacturer’s instructions withminor modifications. Briefly, 1 × 10⁵ cells were diluted in 0.5 ml of ice-coldPBS, and a 50-μl cell suspension was resuspended in 500 μl of LMAgaroseand rapidly spread onto slides. DNA was stained with SYBR-gold (LifeTechnologies), and olive tail moments (expressed in arbitrary units) werecalculated by counting from 100 to 200 cells per condition. The data wereanalyzed with Metafer4 software (MetaSystems). Bar graphs were plottedusing GraphPad Prism v8.0 software (GraphPad Inc.) with the standarderror of the mean. Statistical analysis was performed using the nonpara-metric Mann-Whitney U rank sum t-test in GraphPad Prism v.8.0.
Subcellular fractionationTo isolate the cytoplasmic and nuclear fractions, cells were lysed in buffer A(10mM HEPES [pH 8.0], 1.5mM MgCl2, 10mM KCl, 0.5mM DTT, 300mMsucrose, 0.1% NP40, 0.5mM PMSF) and incubated for 5min on ice. Thesamples were centrifuged at 10,000 rpm at 4 °C for 1min, and the supernatantwas collected as the cytoplasmic fraction. The pellet was resuspended inbuffer B (20mM HEPES [pH 8.0], 20% glycerol, 100mM KCl, 100mM NaCl,0.2mM EDTA, 0.5mM DTT, and 0.5mM PMSF) and incubated for 15min onice. The samples were centrifuged at 12,000 rpm at 4 °C for 5min, and thesupernatant was used as the nuclear fraction.
LC-MS/MS analysisProteins were isolated from cytoplasmic and nuclear fractions andsubjected to tryptic digestion. The resulting peptides were labeled usingTMT reagents, and the labeled peptide samples were fractionated into 24fractions as described in the Supplementary Methods. Twenty-fourprepared fractions of peptide samples were then analyzed on a Q ExactiveOrbitrap mass spectrometer coupled online with an EASY nLC 1000 system(Thermo Fisher Scientific, Bremen, Germany). A PepMapTM RSLC C18(75 μm × 50 cm, 2 μm) column and Acclaim PepMapTM 100 nanoViper C18(75 μm × 2 cm, 3 μm) column were used as the analytical column and trapcolumn, respectively. Solvent A consisted of 2% acetonitrile and 0.1%formic acid in water, and Solvent B consisted of 2% water and 0.1% formicacid in acetonitrile. Peptides in a mixture were loaded onto the trap
column and then separated on the analytical column with a 120-min lineargradient (0-5 min, 5% solvent B; 5-85min, a shallow linear increase from 5to 25% solvent B; 85-95min, a sharp increase from 25 to 90% solvent B;95–105min, 90% solvent B; 105–110min, 90 to 5% solvent B; and110–120min, 5% solvent B). The column flow rate was 300 nL/min, and thetemperature of the column was set at 50 °C. Full MS scans were acquired at35,000 resolution with the auto gain control target value of 1.0 × 10⁶ andthe maximum ion injection time of 100 milliseconds. A total of the 20 mostabundant ions were subsequently isolated and subjected to gas phasedissociation using higher-energy collision dissociation (HCD)55 with anormalized collision energy of 29%. The dynamic exclusion value was setto 30 s. MS/MS scans were acquired at 70,000 resolution with an automaticgain control value of 1.0 × 10⁵. Lock mass from ambient air (m/z445.12003) was used for the internal calibration56. The raw data weredeposited in the Proteomics Identifications (PRIDE) database with anaccession ID, PXD025618.
Identification of DEPsPeptides were identified and quantified using the datasets generated fromthe LC-MS/MS analysis results, as described in the SupplementaryMethods. To identify DEPs in the nucleus or cytoplasm, we first identifiedDE peptides. Briefly, we normalized reporter ion intensities of identifiedpeptides using quantile normalization57 and selected peptides unique to aprotein group and that had precursor isolation purities > 75% andmaximum log2-intensities across TMT channels > the 5th percentile of thelog2-intensity distribution. For individual peptides in the nucleus orcytoplasm, we computed T values by Student’s t-test and log2-median-ratios between senescent HDFs (or LMB-treated young HDFs) and youngHDFs. We then generated empirical null distributions of the T values andlog2-median-ratios by performing random permutations of the TMTchannels 100 times. Next, the adjusted P values were calculated byapplying a two-tailed test to the observed T values using the empiricaldistribution58. The DE peptides were identified as those with P values <0.05 and absolute log2-median-ratios > the cutoff, as determined by themean absolute values of the 5th and 95th percentiles in the empiricaldistribution of log2-median-ratios. Additionally, we determined that the DEpeptides were to be identified under only one condition (> more than tworeplicates). DEPs in the nucleus and/or cytoplasm were then determined asdescribed in the Supplementary Methods. Finally, we performed enrich-ment analyses of GOBPs and KEGG pathways for the DEPs in the nucleusand cytoplasm using DAVID software59. GOBPs and KEGG pathwaysenriched by the genes in each cluster were identified as those with P < 0.1and ≥5 genes.
Microarray experimentsTotal RNA was isolated from RS HDFs, young HDFs and young HDFs treatedwith LMB, WGA, RCC shRNA, H2O2, doxorubicin, or RasV12. RNA purity andintegrity were evaluated with an ND-1000 spectrophotometer (NanoDrop)and Bioanalyzer 2100 (Agilent), respectively. The average RNA integritynumber of the samples was 9.4. The RNA was amplified and labeled withCy3-dCTP according to the standard Agilent One-Color microarray protocol(Agilent, V6.5, 2010). The amplified cRNA was hybridized to AgilentSurePrint G3 Human Gene Expression 8x60K v2 microarray chips contain-ing 62,976 probes for 23,627 annotated genes. The hybridized chips werescanned with an Agilent Microarray Scanner D (Agilent, Santa Clara, CA).The raw data were deposited in the Gene Expression Omnibus (GEO) underaccession ID GSE112530.
Identification of DEGsThe scanned log2-intensities of individual samples were normalized using thequantile normalization method57. To identify DEGs, an integrative statisticalmethod was applied to the normalized log2-intensities as previouslyreported60. Briefly, for each gene, we performed Student’s t-test and log2-median-ratio test to obtain T values and log2-median-ratios between eachsenescence condition and its correlated control condition (e.g., LMB-treatedHDFs versus young HDFs). Then, empirical null distributions of the T valuesand log2-median-ratios were estimated by random sampling experimentsperformed 1,000 times. The adjusted P values of the two tests were calculatedby two-tailed tests on the basis of the observed T values and log2-median-ratios. The adjusted P values obtained from these two tests were combined tocompute an overall P value using Stouffer’s method61. The DEGs were thenidentified as the genes with overall P values < 0.05 and absolute log2-median-ratio > the cutoff, which was determined as the mean absolute values of the
J.-H. Park et al.
1105
Experimental & Molecular Medicine (2021) 53:1092 – 1108

2.5th and 97.5th percentiles in the empirical null distribution for the log2-median-ratio.
DEG cluster analysisA log2-fold-change (log2-median-ratio) matrix was formed for the 6,836DEGs identified through the comparisons performed in this study. Afterquantile normalization of the log2-fold-changes in the matrix, weapplied NMF clustering to the normalized log2-fold-change matrix aspreviously described in Kim et al.30. In summary, the number of clusters(k) was set to 100 after several trials (50, 70, 100, and 150), and adjustedP values were computed through the following steps: (1) The elementsof the log2-fold-change matrix were randomly permuted; (2) NMFclustering was performed on the randomly permuted matrix with k=100; (3) steps 1 and 2 were repeated 1000 times; (4) the empirical nulldistribution was estimated for the NMF activation values obtained fromthe random permutation experiments; and (5) the adjusted P values forthe observed NMF activation values were calculated by right-sided testusing the empirical distribution. The genes belonging to cluster i wereidentified as those with adjusted P values for the data cluster that wereless than 0.01. Finally, to prioritize the major clusters according to theirsignificance, we ordered the clusters in a descending order by theEuclidean norms of the NMF activation values, and the top 10 clusterswere then selected for further analysis. Finally, we performedenrichment analysis of the GOBPs and KEGG pathways for the genesin the top 10 clusters using DAVID software59. GOBPs and KEGGpathways enriched by the genes in each cluster were identified asthose with P < 0.1 and ≥5 genes.
Evaluation of similarities in proteomes and transcriptomesbetween RS and NBIS modelsTo measure similarities of altered proteomes between RS and LMB-NBIS inthe cytoplasm or nucleus, we calculated the Pearson correlation coefficientof log2-fold-changes (Senescent/Young or LMB/Young) of DE peptides in atleast one of RS and LMB-NBIS model (Fig. 2h, i). To assess the significanceof the correlation coefficients, we first selected the DE sibling peptides (m)with alteration directions consistent with those of the corresponding DEPs(Supplementary Methods). We then generated an empirical null distribu-tion for the correlation coefficient by calculating correlation coefficients ofthe log2-median-ratios from random sample permutations (5000 times).Finally, the adjusted P values of the observed correlation coefficients werecalculated by the right-sided test using the empirical distribution. Thisempirical testing was performed separately for the nuclear andcytoplasmic fractions. To examine the similarities of altered transcriptomesin the seven cellular senescence models, we performed hierarchicalclustering on the basis of log2-fold-changes of the union of the DEGsidentified in the seven senescence models and qualitatively evaluated thesimilarities between the senescence models using a dendrogram (Fig. 5a),rather than by the statistical evaluation used for the proteome.
Cellular process network analysisWe reconstructed two process networks for GOBPs and KEGG pathwaysenriched by upregulated (C1-5) and downregulated clusters (C6-10). Eachprocess network consists of GOBPs/KEGG pathways (nodes) enriched by atleast one of the top 10 clusters. For each node, we obtained a list of genesannotated with the corresponding GOBP/KEGG pathway. Each pair ofnodes was connected with an edge if the number of shared genes ≥ 3.Each edge connecting nodes i and j was then quantified by measuring theSørensen–Dice coefficient, as previously described62,63, which is defined by2|Pi ∩ Pj | /(|Pi |+ |Pj | ), where |Pi | and |Pj | are the numbers of genes innodes i and j and |Pi ∩ Pj | is the number of shared genes. Finally, only theedges with Sørensen–Dice coefficients > 0.4 were included in the processnetwork, which was visualized by Cytoscape software64 in the organiclayout option. The cutoff of 0.4 was determined on the basis of the 95th
percentile in the coefficient distribution of all possible pairs of nodes in thenetwork.
Quantitative real-time polymerase chain reaction (qRT-PCR)analysisTotal RNA was isolated from HDFs using QIAzol reagent (Qiagen) accordingto the manufacturer’s instructions. First-strand cDNA was synthesizedusing the Transcriptor First Strand cDNA synthesis kit (Roche), followed byqRT-PCR analysis (with SYBR Green I Master, Roche and a LightCycler® 480Detection System, Roche). mRNA expression levels of the target genes
were calculated using the comparative threshold (CT) method andnormalized to those of RPS11 (human) and CDC19 and ALG9 (replicativeand chronological aging models of yeast, respectively). The primers usedfor PCR are listed in Supplementary Table 5.
Comparison of senescence-associated processes betweenhuman and yeastGene expression profiles of young (1 generation) and old yeast cells (18-20generations) were obtained from the GEO database (accession ID:GSE10018). After quantile normalization of the probe intensities, wecompared the normalized log2-intensities of the young and old cells usingthe aforementioned integrative statistical method. In this case, to avoidbias caused by the large variation in the data, DEGs were identified asthose with adjusted P values for the observed T values ≤ 0.01 and absolutelog2-median-ratio ≥ the mean absolute values of the 5th and 95thpercentiles of the empirical null distribution for the log2-median-ratio. Weperformed analysis of GOBPs and KEGG pathways for DEG enrichmentusing DAVID software and then compared the enriched GOBPs and KEGGpathways with those enriched by the up- and downregulated genes in theRS model.
Yeast cultureThe Saccharomyces cerevisiae BY4741 (MATa his3Δ1 leu2Δ0 met15Δ0ura3Δ0) strain was used in this study. Yeast cells were cultured in YPDmedium containing 1% Bacto™ yeast extract, 2% Bacto™ peptone, and 2%Difco™ dextrose (BD Bioscience) and incubated at 30 °C in an orbital shakerat 200 rpm.
Yeast cell preparation for inducing chronological andreplicative agingFor chronologically aging, yeast cells were grown in YPD medium at 30 °Cin an orbital shaker at 200 rpm, and the cells were collected after 14 days(young) and 35 days (old). Replicative aging cells were prepared by rate-zonal sedimentation using a sucrose gradient. On day 3 of the stationaryphase, yeast cells were sonicated and centrifuged in a linear sucrosegradient (10–30%) at 340 × g for 5 min. The upper band was collected asvirgin cells (0 generation) and pelleted by centrifugation. The virgin cellswere inoculated into fresh YPD medium and incubated at 30 °C until theoptical density was doubled. Briefly, cultured cells were sonicated andcentrifuged in a linear sucrose gradient (10–30%) at 340 × g for 5 min. Thelowest band was collected as the mother cells (1 generation). The collectedmother cells were incubated and separated repeatedly until the newgeneration was established. For preparation of total RNA, the yeast cellswere resuspended in 500 μl RNA lysis buffer (10mM EDTA, 0.5% SDS and10mM tris(hydroxymethyl)aminomethane buffer [pH 7.5]) and transferredto a screw cap tube containing glass beads. The cells were homogenizedusing a vortex at the top speed for 9 min, and the supernatant wascollected by centrifugation. Total RNA was prepared using TRIzol® LSreagent (Invitrogen) according to the manufacturer’s instructions withminor modifications.
Statistical analysesStatistical analyses for the data other than proteome and transcriptomedata were performed with GraphPad Prism v.8.0 and Excel (Microsoft)software. P < 0.05 was considered to indicate statistically significance for allstatistical analyses.
REFERENCES1. Lopez-Otin, C., Blasco, M. A., Partridge, L., Serrano, M. & Kroemer, G. The hallmarks
of aging. Cell 153, 1194–1217 (2013).2. Casella, G., Munk, R., Kim, K. M., Piao, Y., De, S. & Abdelmohsen, K. et al. Tran-
scriptome signature of cellular senescence. Nucleic Acids Res. 47, 7294–305(2019).
3. Campisi, J. Aging, cellular senescence, and cancer. Annu. Rev. Physiol. 75, 685–705(2013).
4. Chen, Q. M. Replicative senescence and oxidant-induced premature senescence.Beyond the control of cell cycle checkpoints. Ann. N. Y Acad. Sci. 908, 111–25(2000).
5. Kuilman, T., Michaloglou, C., Mooi, W. J. & Peeper, D. S. The essence of senes-cence. Genes Dev. 24, 2463–79 (2010).
J.-H. Park et al.
1106
Experimental & Molecular Medicine (2021) 53:1092 – 1108

6. Sharpless, N. E. & Sherr, C. J. Forging a signature of in vivo senescence. Nat. Rev.Cancer 15, 397–408 (2015).
7. Campisi, J. & di Fagagna, d’Adda F. Cellular senescence: when bad things happento good cells. Nat. Rev. Mol. Cell Biol. 8, 729–40 (2007).
8. Ryu, S. J., Oh, Y. S. & Park, S. C. Failure of stress-induced downregulation of Bcl-2contributes to apoptosis resistance in senescent human diploid fibroblasts. CellDeath Differ. 14, 1020–8 (2007).
9. Suh, Y., Lee, K. A., Kim, W. H., Han, B. G., Vijg, J. & Park, S. C. Aging alters theapoptotic response to genotoxic stress. Nat. Med. 8, 3–4 (2002).
10. Kim, S. Y., Ryu, S. J., Ahn, H. J., Choi, H. R., Kang, H. T. & Park, S. C. Senescence-related functional nuclear barrier by down-regulation of nucleo-cytoplasmictrafficking gene expression. Biochem. Biophys. Res. Commun. 391, 28–32 (2010).
11. Kim, S. Y., Ryu, S. J., Kang, H. T., Choi, H. R. & Park, S. C. Defective nucleartranslocation of stress-activated signaling in senescent diploid human fibroblasts:a possible explanation for aging-associated apoptosis resistance. Apoptosis 16,795–807 (2011).
12. Park, S. C. Nuclear barrier hypothesis of aging as mechanism for trade-off growthto survival. Adv. Exp. Med. Biol. 720, 3–13 (2011).
13. Clarke, P. R. & Zhang, C. Spatial and temporal coordination of mitosis by RanGTPase. Nat. Rev. Mol. Cell Biol. 9, 464–77 (2008).
14. Cautain, B., Hill, R., de Pedro, N. & Link, W. Components and regulation of nucleartransport processes. FEBS J. 282, 445–62 (2015).
15. Cekan, P., Hasegawa, K., Pan, Y., Tubman, E., Odde, D. & Chen, J. Q. et al. RCC1-dependent activation of Ran accelerates cell cycle and DNA repair, inhibitingDNA damage-induced cell senescence. Mol. Biol. Cell 27, 1346–57 (2016).
16. Kelley, J. B., Datta, S., Snow, C. J., Chatterjee, M., Ni, L. & Spencer, A. et al. Thedefective nuclear lamina in Hutchinson-gilford progeria syndrome disrupts thenucleocytoplasmic Ran gradient and inhibits nuclear localization of Ubc9. Mol.Cell Biol. 31, 3378–95 (2011).
17. Nagai, M. & Yoneda, Y. Downregulation of the small GTPase ras-relatednuclear protein accelerates cellular ageing. Biochim. Biophys. Acta 1830, 2813–9(2013).
18. Rempel, I. L., Crane, M. M., Thaller, D. J., Mishra, A., Jansen, D. P. & Janssens, G.et al. Age-dependent deterioration of nuclear pore assembly in mitotic cellsdecreases transport dynamics. Elife 8, e48186 (2019).
19. Kim, S. Y., Kang, H. T., Han, J. A. & Park, S. C. The transcription factor Sp1 isresponsible for aging-dependent altered nucleocytoplasmic trafficking. Aging Cell11, 1102–9 (2012).
20. Ahn, J. S., Jang, I. S., Kim, D. I., Cho, K. A., Park, Y. H. & Kim, K. et al. Aging-associated increase of gelsolin for apoptosis resistance. Biochem. Biophys. Res.Commun. 312, 1335–41 (2003).
21. Lim, I. K., Won Hong, K., Kwak, I. H., Yoon, G. & Park, S. C. Cytoplasmic retention ofp-Erk1/2 and nuclear accumulation of actin proteins during cellular senescence inhuman diploid fibroblasts. Mech. Ageing Dev. 119, 113–30 (2000).
22. Ryu, S. J., Cho, K. A., Oh, Y. S. & Park, S. C. Role of Src-specific phosphorylation siteon focal adhesion kinase for senescence-associated apoptosis resistance. Apop-tosis 11, 303–13 (2006).
23. Kim, S. Y., Kang, H. T., Choi, H. R. & Park, S. C. Reduction of Nup107 attenuates thegrowth factor signaling in the senescent cells. Biochem. Biophys. Res. Commun.401, 131–6 (2010).
24. Park, S. C. Survive or thrive: tradeoff strategy for cellular senescence. Exp. Mol.Med. 49, e342–e342 (2017).
25. Kim, S. & Pevzner, P. A. MS-GF+ makes progress towards a universal databasesearch tool for proteomics. Nat. Commun. 5, 5277 (2014).
26. Hicks, G. R., Smith, H. M., Lobreaux, S. & Raikhel, N. V. Nuclear import in per-meabilized protoplasts from higher plants has unique features. Plant Cell 8,1337–52 (1996).
27. Hinshaw, J. E., Carragher, B. O. & Milligan, R. A. Architecture and design of thenuclear pore complex. Cell 69, 1133–41 (1992).
28. Mutka, S. C., Yang, W. Q., Dong, S. D., Ward, S. L., Craig, D. A. & Timmermans, P. B.et al. Identification of nuclear export inhibitors with potent anticancer activityin vivo. Cancer Res. 69, 510–7 (2009).
29. Jazwinski, S. M. Aging and senescence of the budding yeast Saccharomycescerevisiae. Mol. Microbiol. 4, 337–43 (1990).
30. Kim, Y., Kim, T. K., Kim, Y., Yoo, J., You, S. & Lee, I. et al. Principal network analysis:identification of subnetworks representing major dynamics using gene expres-sion data. Bioinformatics 27, 391–8 (2011).
31. Boukouris, A. E., Zervopoulos, S. D. & Michelakis, E. D. Metabolic enzymesmoonlighting in the nucleus: metabolic regulation of gene transcription. TrendsBiochem. Sci. 41, 712–30 (2016).
32. Rodier, F. & Campisi, J. Four faces of cellular senescence. J. Cell Biol. 192, 547–56(2011).
33. Wei, S., Wei, S. & Sedivy, J. M. Expression of catalytically active telomerase doesnot prevent premature senescence caused by overexpression of oncogenic Ha-Ras in normal human fibroblasts. Cancer Res. 59, 1539–43 (1999).
34. Aan, G. J., Hairi, H. A., Makpol, S., Rahman, M. A. & Karsani, S. A. Differences inprotein changes between stress-induced premature senescence and replicativesenescence states. Electrophoresis 34, 2209–17 (2013).
35. Lecane, P. S., Kiviharju, T. M., Sellers, R. G. & Peehl, D. M. Leptomycin B stabilizesand activates p53 in primary prostatic epithelial cells and induces apoptosis inthe LNCaP cell line. Prostate 54, 258–67 (2003).
36. Datta, S., Snow, C. J. & Paschal, B. M. A pathway linking oxidative stress and theRan GTPase system in progeria. Mol. Biol. Cell 25, 1202–15 (2014).
37. Mor, A., White, M. A. & Fontoura, B. M. Nuclear trafficking in health and disease.Curr. Opin. Cell Biol. 28, 28–35 (2014).
38. Ferreiro-Neira, I., Torres, N. E., Liesenfeld, L. F., Chan, C. H., Penson, T. & Landes-man, Y. et al. XPO1 Inhibition Enhances Radiation Response in Preclinical Modelsof Rectal Cancer. Clin. Cancer Res. 22, 1663–73 (2016).
39. Yao, Y., Dong, Y., Lin, F., Zhao, H., Shen, Z. & Chen, P. et al. The expression of CRM1 isassociated with prognosis in human osteosarcoma. Oncol. Rep. 21, 229–35 (2009).
40. Noske, A., Weichert, W., Niesporek, S., Röske, A., Buckendahl, A. C. & Koch, I. et al.Expression of the nuclear export protein chromosomal region maintenance/exportin 1/Xpo1 is a prognostic factor in human ovarian cancer. Cancer 112,1733–43 (2008).
41. Nousiainen, H. O., Kestilä, M., Pakkasjärvi, N., Honkala, H., Kuure, S. & Tallila, J. et al.Mutations in mRNA export mediator GLE1 result in a fetal motoneuron disease.Nat. Genet. 40, 155–7 (2008).
42. Kim, S. Y., Yang, E. J., Lee, S. B., Lee, Y. S., Cho, K. A. & Park, S. C. Global tran-scriptional downregulation of TREX and nuclear trafficking machinery as pan-senescence phenomena: evidence from human cells and tissues. Exp. Mol. Med.52, 1351–9 (2020).
43. De Cecco, M., Ito, T., Petrashen, A. P., Elias, A. E., Skvir, N. J. & Criscione, S. W. et al.L1 drives IFN in senescent cells and promotes age-associated inflammation.Nature 566, 73–78 (2019).
44. Kang, H. T., Park, J. T., Choi, K., Kim, Y., Choi, H. & Jung, C. W. et al. Chemicalscreening identifies ATM as a target for alleviating senescence. Nat. Chem. Biol.13, 616–23 (2017).
45. Kang, H. T., Park, J. T., Choi, K., Choi, H., Jung, C. W. & Kim, G. R. et al. Chemicalscreening identifies ROCK as a target for recovering mitochondrial function inHutchinson-Gilford progeria syndrome. Aging Cell 16, 541–50 (2017).
46. Baker, D. J., Wijshake, T., Tchkonia, T., LeBrasseur, N. K., Childs, B. G. & van de Sluis,B. et al. Clearance of p16Ink4a-positive senescent cells delays ageing-associateddisorders. Nature 479, 232–6 (2011).
47. Jeon, O. H., Kim, C., Laberge, R. M., Demaria, M., Rathod, S. & Vasserot, A. P. et al. Localclearance of senescent cells attenuates the development of post-traumatic osteoar-thritis and creates a pro-regenerative environment. Nat. Med. 23, 775–81 (2017).
48. An, H. J., Lee, H. J., Jang, S., Jung, Y. J., Choi, S. S. & Park, S. C. et al. Transcriptionfactor Sp1 prevents TRF2(DeltaBDeltaM)-induced premature senescence inhuman diploid fibroblasts. Mol. Cell Biochem. 414, 201–8 (2016).
49. Pyrzynska, B., Pilecka, I. & Miaczynska, M. Endocytic proteins in the regulation ofnuclear signaling, transcription and tumorigenesis. Mol. Oncol. 3, 321–38 (2009).
50. Bai, B., Moore, H. M. & Laiho, M. CRM1 and its ribosome export adaptor NMD3localize to the nucleolus and affect rRNA synthesis. Nucleus 4, 315–25 (2013).
51. Golomb, L., Volarevic, S. & Oren, M. p53 and ribosome biogenesis stress: theessentials. FEBS Lett. 588, 2571–9 (2014).
52. Debacq-Chainiaux, F., Erusalimsky, J. D., Campisi, J. & Toussaint, O. Protocols todetect senescence-associated beta-galactosidase (SA-betagal) activity, a bio-marker of senescent cells in culture and in vivo. Nat. Protoc. 4, 1798–806 (2009).
53. Bassaneze, V., Miyakawa, A. A. & Krieger, J. E. A quantitative chemiluminescentmethod for studying replicative and stress-induced premature senescence in cellcultures. Anal. Biochem. 372, 198–203 (2008).
54. Yang, S. M., Kim, B. J., Norwood Toro, L. & Skoultchi, A. I. H1 linker histonepromotes epigenetic silencing by regulating both DNA methylation and histoneH3 methylation. Proc. Natl Acad. Sci. USA 110, 1708–13 (2013).
55. Olsen, J. V., Macek, B., Lange, O., Makarov, A., Horning, S. & Mann, M. Higher-energy C-trap dissociation for peptide modification analysis. Nat. Methods 4,709–12 (2007).
56. Olsen, J. V., de Godoy, L. M., Li, G., Macek, B., Mortensen, P. & Pesch, R. et al. Partsper million mass accuracy on an Orbitrap mass spectrometer via lock massinjection into a C-trap. Mol. Cell Proteom. 4, 2010–21 (2005).
57. Bolstad, B. M., Irizarry, R. A., Astrand, M. & Speed, T. P. A comparison of nor-malization methods for high density oligonucleotide array data based on var-iance and bias. Bioinformatics 19, 185–93 (2003).
58. Storey, J. D. & Tibshirani, R. Statistical significance for genomewide studies. Proc.Natl Acad. Sci. USA 100, 9440–5 (2003).
59. Huang da, W., Sherman, B. T. & Lempicki, R. A. Systematic and integrative analysis oflarge gene lists using DAVID bioinformatics resources. Nat. Protoc. 4, 44–57 (2009).
60. Lee, H. J., Suk, J. E., Patrick, C., Bae, E. J., Cho, J. H. & Rho, S. et al. Direct transfer ofalpha-synuclein from neuron to astroglia causes inflammatory responses insynucleinopathies. J. Biol. Chem. 285, 9262–72 (2010).
J.-H. Park et al.
1107
Experimental & Molecular Medicine (2021) 53:1092 – 1108

61. Hwang, D., Rust, A. G., Ramsey, S., Smith, J. J., Leslie, D. M. & Weston, A. D. et al. Adata integration methodology for systems biology. Proc. Natl Acad. Sci. USA 102,17296–301 (2005).
62. Mueller, L. N., Rinner, O., Schmidt, A., Letarte, S., Bodenmiller, B. & Brusniak, M. Y.et al. SuperHirn—a novel tool for high resolution LC-MS-based peptide/proteinprofiling. Proteomics 7, 3470–80 (2007).
63. Dice, L. R. Measures of the amount of ecologic association between species.Ecology 26, 297–302 (1945).
64. Shannon, P., Markiel, A., Ozier, O., Baliga, N. S., Wang, J. T. & Ramage, D. et al.Cytoscape: a software environment for integrated models of biomolecularinteraction networks. Genome Res. 13, 2498–504 (2003).
ACKNOWLEDGEMENTSThe authors are grateful to Samsung Advanced Institute of Technology (SAIT)colleagues Y.S. Kim, M.S. Kim, B.G. Moon, and H.T. Kang for their assistance. We alsothank S.-E. Lee, D.-E. Kim, and H.-Y. Cho for their assistance. This research wassupported by SAIT, the DGIST R&D Program and the Institute for Basic Science (IBS-R013-A1) of the Ministry of Science, ICT and Technology (MSIT) of KOREA. This studywas also supported by the Brain Research Program (NRF-2017M3C7A1027472), theBasic Research Program (NRF-2019R1C1C1006262, NRF-2020R1A2C2013416, NRF-2020M3A9D8038014, and NRF-2020R1A2C2009439), the Basic Research Laboratoryprogram (NRF-2019R1A4A1024278) through the National Research Foundation (NRF)funded by the MSIT, KRIBB Research Initiative Program (KGM5422113), and ChonnamNational University R&D Program Grant for Research Chair Professor.
AUTHOR CONTRIBUTIONSS.J.R., B.J.K., D.H., Y.-S.L., and S.C.P. designed the research. S.J.R., B.J.K., H.J.C.C., E.-J.J.,H.-J.C., E.J.Y., J.-A.H., S.-H.W., J.H.L., K.-M.C., Y.-Y.K., and C.-K.L. performed experiments.J.-H.P., C.H.P., J.H.P., M.-S.K., and D.H. performed the bioinformatics analysis. J.-H.P., S.J.R., B.J.K., M.-S.K., D.H., Y.-S.L., and S.C.P. wrote the article. J.-H.P., S.J.R., B.J.K., J.T.P., S.C.C., Y.-I.L., S.B.L., J.A.H., K.A C., M.-S.K., D.H., Y.-S.L., and S.C.P. interpreted andcommented on the article.
COMPETING INTERESTSThe authors declare no competing interests.
ADDITIONAL INFORMATIONSupplementary information The online version contains supplementary materialavailable at https://doi.org/10.1038/s12276-021-00643-6.
Correspondence and requests for materials should be addressed to M.-S.K., D.H., Y.-S.L. or S.C.P.
Reprints and permission information is available at http://www.nature.com/reprints
Publisher’s note Springer Nature remains neutral with regard to jurisdictional claimsin published maps and institutional affiliations.
Open Access This article is licensed under a Creative CommonsAttribution 4.0 International License, which permits use, sharing,
adaptation, distribution and reproduction in anymedium or format, as long as you giveappropriate credit to the original author(s) and the source, provide a link to the CreativeCommons license, and indicate if changes were made. The images or other third partymaterial in this article are included in the article’s Creative Commons license, unlessindicated otherwise in a credit line to the material. If material is not included in thearticle’s Creative Commons license and your intended use is not permitted by statutoryregulation or exceeds the permitted use, you will need to obtain permission directlyfrom the copyright holder. To view a copy of this license, visit http://creativecommons.org/licenses/by/4.0/.
© The Author(s) 2021
J.-H. Park et al.
1108
Experimental & Molecular Medicine (2021) 53:1092 – 1108