Embed Size (px)
Citation preview


Ingo Müller
Influence of Cellulose Ethers on the Kinetics ofEarly Portland Cement Hydration

Karlsruher Mineralogische und Geochemische Hefte
Schriftenreihe des Instituts für Mineralogie und Geochemie,
Universität Karlsruhe (TH)
Band 32

Influence of Cellulose Etherson the Kinetics of Early PortlandCement Hydrationvon Ingo Müller
Universitätsverlag Karlsruhe 2006Print on Demand
ISSN: 1618-2677ISBN-13: 978-3-86644-077-7ISBN-10: 3-86644-077-4
Dissertation, Westfälische Wilhelms-Universität MünsterMathematisch-Naturwissenschaftliche Fakultät, 2006
Anschrift des Autors: Ingo MüllerHercules GmbHPaul-Thomas-Str. 56D – 40599 Düsseldorf
Anschrift der Schriftleitung:Karlsruher Mineralogische und Geochemische HefteInstitut für Mineralogie und GeochemieUniversität Karlsruhe (TH)D – 76128 Karlsruhe
Impressum
Universitätsverlag Karlsruhec/o UniversitätsbibliothekStraße am Forum 2D-76131 Karlsruhewww.uvka.de
Dieses Werk ist unter folgender Creative Commons-Lizenz lizenziert: http://creativecommons.org/licenses/by-nc-nd/2.0/de/

i
Acknowledgement
I'd like to thank Prof. Dr. Andrew Putnis, Inst. f. Min., Westf. Wilhelms-Universitaet
Muenster, and PD Dr. habil. Dirk Bosbach, Inst. f. Nukl. Ents. (INE), Forschungszentrum
Karlruhe, for giving me the great opportunity to graduate, for patiently reviewing this thesis
and for their helpful advices and discussions.
My special thanks are dedicated to Dr. John Bard, Dr. Dieter Schweizer and
Dr. Wilfried Hohn at Hercules Inc. for the kind permission to transform a Hercules research
project into a public PhD thesis. Without their essential support and endless patience this
project would not have been possible.
Many thanks to the very ambitious crews of the Swiss Light Source and the SINQ Neutron
Source at the Paul Scherrer Institut in Villigen, Switzerland. Especially I'd like to thank
Dr. Heinz Weyer, Dr. Bernd Schmitt and Dr. Bruce Patterson for their helpful company in
many sleepless nights at the Material Research Beamline. I'm very grateful for the help of
Dr. Peter Fischer and Dr. Denis Sheptyakov at the High Resolution Powder Diffractometry of
Thermal Neutrons. Many thanks to Dr. Fabia Gozzo and Dr. van der Veen who promised to
handcuff me to the heating system until I get the publications done.
I'd like to thank Angelika Breit and Dr. Ermrich for XRD analyses and software support and
Dr. Klaus Lipus at the VDZ for ESEM-FEG-images.
Many thanks to my colleagues, especially to Dr. Michael Dittel, Alexander Kindler, Stefan
Hucko and Wolfgang Hildebrandt for their help at the Hercules Construction Material
Laboratory in Duesseldorf. I'm particularly grateful for the associated apprenticeship of
Michael Zwanzig and his colleagues at the Heinrich-Hertz-Berufskolleg in Duesseldorf.
Last not least I'd like to thank my dear friends Annette Rolfes in Muenster and
Susanne Herppich in Zurich for their kind support and friendly hospitality. I always enjoyed
to take you out for dinner in times when I had to reconfigurate my mental hard disc drive.
A Note on Notation
Mutated vowels and pronounced s in German names are written in international notation (ae, oe, ue, ss).
ii
Content
1. Abstract 1
2. Introduction 2
2.1 Subject 2
2.2 Objectives 2
2.3 Nomenclature 3
2.4 Historical Background 5
2.4.1 The Development of Cement 5
2.4.2 The Development of Cellulose Ethers 7
2.5 Materials 7
2.5.1 Portland Cement 7
2.5.2 Clinker and Cement Phases 8
2.5.3 Hydration Processes of Portland Cement 12
2.5.4 Cellulose Ethers 13
2.5.5 Macroscopic Effects of Cellulose Ethers on Dry Mortars 17
2.5.6 Dry Mortar Applications and their Economic Relevance 18
2.6 State of Research 20
3. Methods 24
3.1 Standard Wet Paste Preparation 24
3.2 Etrringite Pure Phase Synthesis 25
3.3 Particle Size Distribution (PSD) 25
3.4 Specific Surface Area 26
3.5 Helium Pycnometry 27
3.6 Ultrasonic Measurements 27
3.7 Heat Flux Calorimetry 28
3.8 Adsorption Tests and Size Exclusion Chromatography (SEC) 29
3.9 Powder Diffraction 33
3.9.1 Laboratory X-Ray Powder Diffraction 33
3.9.2 Synchrotron X-Ray Powder Diffraction 34
3.9.3 Thermal Neutron Powder Diffraction 37
3.10 Environmental Scanning Electron Microscopy - Field Emission Gun (ESEM-FEG) 39

iii
4. Material Characterization 40
4.1 Defined Portland Cement 40
4.2 Pure Mineral Phases 42
4.3 Cellulose Ethers 43
4.4 Cement and Pure Phase Admixtures 44
5. Results 46
5.1 The Adsorption of Cellulose Ethers on Cement Phases 46
5.2 The Retarding Effect of Cellulose Ethers on Early Portland Cement Hydration 53
5.2.1 Ultrasonic Measurements 53
5.2.2 Heat Flux Calorimetry 55
5.2.3 Laboratory XRD 59
5.2.4 Synchrotron XRD 66
5.2.5 Synchrotron XRD with Liquid Injection 73
5.2.6 Thermal Neutron Powder Diffraction 81
5.2.7 ESEM-FEG 83
6. Summary 89
6.1 Portland Cement Hydration without Cellulose Ether 89
6.2 CE-caused Retardation 91
6.3 CE-Adsorption 93
7. Discussion 95
7.1 Stepwise Ettringite Formation 95
7.2 Interactions of Cellulose Ethers with Cement 96
8. Outlook 98
Appendix 99
A.1 Figures 99
A.2 Abbreviations 104
A.3 References 106
A.4 Technical Equipment 109
A.5 Co-operations 110

1
1. Abstract
The present study is focused on the effects of cellulose ethers (CEs) on the kinetics of early
Portland cement hydration. The retarding effects of cellulose ethers on the development of
single cement phases could be traced to the adsorption behaviour of the polymers. A method
was developed to quantify the amount of cellulose ether adsorbed on the surfaces of cement
phases. The specific surface area of some hydrated phases was analysed by determination of
nitrogen gas adsorption isotherms. The amount of adsorbed cellulose ether was determined by
analysing the residual free water of a cement paste by size exclusion chromatography. It could
be demonstrated that the adsorption behaviour of the polysaccharide depends on the mineral
phase and on the degree of substitution (DS), a key parameter of cellulose ether
characterization.
Beside other methods, the hydration processes were monitored in-situ by the means of ultra
sonic measurements, synchrotron X-ray and neutron powder diffraction and environmental
scanning electron microscopy using a field emission gun. The results of all independent
methods showed a good correlation. The following phase reactions could be observed within
the first 24 hours of Portland cement hydration:
1. tri-calcium aluminate + bassanite + water → ettringite (1st generation)
2. bassanite + water → gypsum
3. anhydrite + water → gypsum
4. tri-calcium aluminate + gypsum + water → ettringite (2nd generation)
5. tri-calcium silicate + water → calcium silicate hydrates + portlandite
It turned out that cellulose ethers had a strong direct effect on the hydration of the silicate
components of cement. Tri-calcium silicate and its hydration products showed the highest
values of polymer adsorption. The adsorption led to a surface intoxication and therefore to
delayed hydration reaction. The effects of cellulose ethers on the aluminates were less
specific. No CE adsorbed on the surface of ettringite, a hydration product of tri-calcium
aluminate and calcium sulphates. Nevertheless the ettringite crystallization after 4 hours was
strongly retarded by cellulose ethers depending on their DS. This retardation was an indirect
phenomenon caused by delayed development of ion-concentration in the pore water. This
delay again was a consequence of the retardation of the silicate hydration caused by cellulose
ethers. In general it can be said that the lower the degree of substitution of the cellulose
ethers, the larger the amount of adsorbed polymers and the stronger the retarding effect.
2
2 Introduction
2.1 Subject
Cement is the most important construction material used today. It is used as a binder in many
mineral-based building material formulations all over the world. Its importance is not only
due to its binding function in concrete but also in dry mortars. In comparison to concrete, dry
mortars are more specialized and therefore more sophisticated. Except for masonry mortar
they do not have load-carrying functions in civil engineering. Dry mortars in general consist
of mineral binders such as cement, lime or gypsum, fillers such as silica sand or carbonates
and various organic and inorganic auxiliary agents. Dry mortar is the term for an industrial
product offered by cement producers to the workers and craftsmen on construction sites as a
complete formulation that only needs water to be applied. The most important applications are
plasters and renders, tile cements and self-levelling compounds, masonry mortars and thermal
insulation compounds, joint fillers and grout. The dry mortar comes as powder in bags or silos
and has to be mixed with water at the construction site.
Cellulose ethers (CEs) are the most important rheological regulators for aqueous systems.
Their primary function is that of a thickener and control agent for the water balance. CEs
dissolved in aqueous solution increase the viscosity of the liquid as a function of molecular
weight and addition level. They are used in construction materials as well as in paints, food,
pharmaceuticals, body care and household cleaners. Due to their film-forming property they
are also used as glue in paper and tobacco industries and for the application of wallpapers.
The common field of cement and cellulose ether is the dry mortar application. Concrete as a
load carrier usually does not contain cellulose ethers because of their strength weakening
effect. In contrast to concrete there is almost no dry mortar formulation without cellulose
ether as the most important rheological regulator.
2.2 Objective
Due to the complexity and great variety of mineral-based construction materials the work is
focused on the organic-inorganic interaction between cement phases and cellulose ethers in
ordinary Portland cement (OPC), pure cement phases and admixtures thereof. Other materials
should only be mentioned as examples where it appears to be reasonable.
Experiences in product development showed that cellulose ether retards the hardening of
cement. The retardation times vary with variations of the chemistry of the polymer. The
CE-caused increase of viscosity of the pore solution may hinder the ion transport. But the
retarding effect does not correlate with the viscosities of CE-solutions. This is evidence that
3
the pore solution is not the only hydration-controlling factor influenced by CE. A direct
interaction between dissolved polymer and solid phase is assumed. Classic retarders for
gypsum such as phosphonic acid derivates adsorb on the faces of gypsum crystals. The
surface intoxication leads to retarded crystal growth and a change of the crystal
morphology [Bos1]. Following this idea, the study focused on the question whether CE-
adsorption on cement phases controls the hydration kinetics. This leads to the following
questions:
What is the polymer's key parameter controlling retardation if viscosity plays a minor role?
Is the retarding effect of CE phase-specific?
If yes, can the retarding effect be correlated with phase-specific adsorption?
In order to answer those questions methods were developed that allow to quantify CE-
adsorption and to monitor hydration processes phase- and time-resolved. Two ways seemed to
be practicable: 1. Phase-resolved investigations on phase development in cement. X-ray
powder diffraction (XRD), in particular synchrotron-XRD as in-situ method, should be
suitable. 2. Macroscopic integral methods to determine sum parameters can also give phase-
resolved results if experiments are performed on pure phases. Batch-type experiments with
subsequent residual free water analysis were performed in order to quantify the CE-adsorption
per phase.
2.3 Nomenclature
Material research is an interdisciplinary science. Contributions come from physics, chemistry,
mineralogy, ceramic research and last not least from handcraft. The big advantage is that the
manifold input creates a fertile environment for development. A disadvantage is that any
discipline cultivates its own language. To avoid confusion it is indispensable to define a strict
nomenclature. Craftsmen for example call powdered construction materials "gypsum" if they
are based on calcium sulphates of any kind. Mineralogists give trivial names to natural
mineral phases. These names may derive from old common names (gypsum), from their
chemical composition (anhydrite), a location where a natural form has been found for the first
time (ettringite), the name of a person to be honoured (brownmillerite) or a word composition
of ancient Greek or Latin that describes physical properties (chlorite, from chloros = green).
Cement research scientists of the 19th century adopted the trivial name system of mineralogy
and invented names for artificial phases that sound similar to mineral names (alite, belite,
celite). Chemists prefer descriptions of chemical compositions (tri-calcium silicate) on the
basis of the international IUPAC-standard and use the chemical formula (Ca3SiO5). Ceramic

4
engineers divide the chemical formula into its oxide components (3CaO⋅SiO2). In ceramics it
is usual to abbreviate those components with single letters (C3S). Tables 2.1 and 2.2 give term
definitions of the most important oxide components and cement phases.
oxide component ceramic short formula oxide component ceramic short
formula Al2O3 A H2O H CaO C SiO2 S
Fe2O3 F SO3 S MgO M K2O K
Table 2.1: Oxide components and their ceramic symbols (examples)
Full expression, trivial name
Ceramic short formula / abbreviation 1) Phase composition
Ca-sulphate, anhydrite C S CaSO4
Ca-sulphate hemi-hydrate, bassanite C S H0.5 CaSO4⋅0.5H2O
Ca-sulphate di-hydrate, gypsum C S H2 CaSO4⋅2H2O
tri-Ca-aluminate C3A Ca3Al2O6
di-Ca-aluminate ferrite, celite C2(A,F), C4AF 1) Ca2(Al,Fe)2O5
di-Ca-silicate, belite C2S Ca2SiO4
tri-Ca-silicate, alite C3S Ca3SiO5
Ca-aluminate hydrates CAH various 1)
Ca-silicate hydrate CSH stoichiometrically not determined 1)
Ca-hydroxide, portlandite CH Ca(OH)2
Ca-aluminate tri-sulphate hydrate, ettringite AFt 1) Ca3Al2O6⋅3CaSO4⋅32H2O
Ca-aluminate mono-sulphate hydrate AFm 1) C33Al2O6⋅CaSO4⋅12H2O
Table 2.2: Expressions of cement phases and their formulas as used in this thesis. 1) for detailed explanation see chapter 2.5.2.

5
2.4 Historical Background
Men have used building materials since the middle stone age. The basic material was
certainly wood and fur. In the first permanent settlements of the late stone age clay,
respectively loam, was used. Further development in early antiquity led to loam brick or
quarrystone masonry with clay, lime or gypsum as masonry mortar. First cements with
pozzolan as hydraulic binder are known from ancient Greeks, Phoenicians and Romans. The
knowledge of making cement was not lost with the decline of the Roman Empire but its
application became very rare. In the Middle Ages half-timbered buildings were European
standard. The gaps of wooden frame works were filled with straw and clay with a lime render
finishing. Sacred buildings and constructions with strategic importance or representative
character such as castles and town halls were erected with quarrystone masonry. Ceramic
brick masonry was used in prospering cities and trade centres since the 15th century. Masonry
for residential homes spread even over remote places with improved general living standard
in the 18th and 19th century. Cement was reinvented in the 18th century in England. In the
19th century steel and glass completed the list of modern construction materials.
Organic components in combination with mineral binders have been used since the
antiquity. Soaps, resins and proteins in their natural form were added to the binders to
improve their workability. Lime for example was mixed with cottage cheese, which contains
casein. Casein is a retarder for lime and retards the carbonization. In the 19th century cellulose
was etherified with nitric acid for military use. Other derivatives were used as thickeners in
dry mortars for roughly forty years.
2.4.1 The Development of Cement
Greek, Phoenician and Roman civil engineers found out that a mixture of lime, clay and
pozzolan, a powdered volcanic ash, is a hydraulically setting binder [VDZ1]. Hydraulic means
that the material hardens under water as opposed to pure lime or gypsum. One of the oldest
written witnesses of ancient construction material development is ascribed to Vitruv [Vit1]. He
described binders made of stone debri, lime, sand, pozzolan and milled bricks as "opus
caementitium" (= work made of stone debri) from the 3rd century B.C. Later the hydraulic
components made of pozzolan and milled bricks were shortly named "caementum". The
hydraulic powders were dry-mixed with lime. The Roman concrete achieved compressive
strengths up to 40 N/mm² and last in Roman architecture until today.
In the 18th century the Englishman John Smeaton discovered that limestone, naturally
contaminated with clay minerals, could be fired to a hydraulic binder without pozzolan. The
6
further development took place in England. In 1796 James Parker held a patent for hydraulic
binder fired from natural clay-rich lime-sandstone that he called "Roman cement". The name
"cement" was transferred to hydraulic binders in general. Edgar Dobs held a patent for
hydraulic lime that has been burned from an artificial mixture of limestone and clay in 1810.
Later Joseph Aspdin improved the limestone-clay-mixture and called the product "Portland
cement". Even this early Portland cement was rather more like Roman cement since clinker
conditions at 1450 °C had not been reached yet. The name was chosen for two reasons: first
the colour of the cement was similar to those of natural limestone found in the region of
Portland, second the Portland limestone was a well-established high quality quarrystone in the
construction material market. With the name the cement should be associated with high
quality. Joseph's son William Aspdin reached clinker conditions in his cement factory in 1843
for the first time. Higher burning temperatures led to this important improvement. The further
development improved the cement in respect of strength by increasing the content of clinker
phases in the burned product. In Germany and France Portland cement was manufactured for
the first time in 1850 and in the USA in 1870.
The first national standard concerning cement quality was introduced in Prussia in 1878.
The hydraulic properties of granulated alkaline cinder, a waste product of steel production,
was discovered in 1862 by Emil Langen in Germany. The resulting smelter cement was the
first cement made of artificial raw materials. The German cement industries introduced a
national standard in 1882 that defined that a Portland cement must be burned to clinker
condition from at least 98 molar-% of natural raw materials. Other national standards were
introduced in France in 1885 and England in 1905. The development in the 20th century led to
further cement types like the iron-free white cement or the fast setting aluminate cement. For
concrete and most dry mortars Portland cement is still the most important. Further work was
focused on standardization on a national basis in the thirties and forties. The specification on
cement quality was summarized in Germany in 1932 in the national standard DIN 1164.
Later, since the eighties, national standards were transformed to common European standards
in the European Union.
It was not a coincidence that modern cement production started in England. In the Middle
Ages wood was nearly the only fuel. Its energy content was too poor to produce Roman
cement. The little charcoal that could be made by men was urgently needed for steel
production. Even the Romans had no better fuel than wood, but pozzolan is a volcanic rock.
The firing energy to produce this hydraulic material came from the upper mantle of the earth.
7
With the invention of lignite firing during the industrial revolution in England there was
plenty of energy available for burning cement.
2.4.2 The Development of Cellulose Ethers
The history of cellulose ether started with military application. Gunpowder had been used by
Chinese for centuries before it was brought to Europe. While the Chinese used it for fireworks
only, gunpowder became an explosive and a propellant for military use in Europe in the 15th
century. It was the only explosive, respectively propellant, known until the sixties of the 19th
century. The handling of gunpowder is very dangerous since this unstable material reacts
unpredictable, especially when moist. The invention of nitro-glycerine in the 19th century
replaced gunpowder as an explosive. The further development of nitro-explosives led to
dynamite and nitro-cellulose [Dye1]. Both explosives are relatively safe in handling and are
more effective than gunpowder. Partly nitrated cellulose was used as explosive by the
Saracens during the era of crusades since the 11th century. Brushwood was soaked with nitric
acid and placed in tunnels beneath castle walls to destroy Christian strongholds. Completely
nitrated cellulose was the first water-soluble cellulose derivative used as propellant since the
second half of the 19th century. Other derivatives like Carboxy-methylcellulose (CMC) and
methylcellulose (MC) were developed as glue for cardboard and paper in the early
20th century [Sch1]. The further development of cellulose ethers led to a wide range of
derivatives used mainly as thickeners, soluble in hot and/or cold water and organic solutants.
The first application of cellulose ethers in construction materials appeared with the
development of dry mortars in about 1960.
2.5 Materials
This chapter will give a brief overview of Portland cement, its primary and hydrated mineral
phases, cellulose ethers and dry mortars. Material properties, phase development during
hydration and the task of cellulose ethers will be briefly described.
2.5.1 Portland Cement
Cement is a fine mineral powder with hydraulic properties, i.e. the ability to harden under
water. The most important mineral phases of ordinary Portland cements belong to the system
CaO-Al2O3-SiO2-SO3-H2O. The Association of German Cement producers (Verein Deutscher
Cement-Fabrikanten) defined that the name "Portland cement" must not be used for any
cements others than those produced of at least 98 molar percent of natural raw materials.
8
These raw materials are limestone, clay and silica sand. Limestone is a rock consisting mainly
of calcite, a calcium carbonate. Clay is rich in aluminium-bearing phyllosilicates. Silica sand
(quartz) is the main source for silicon oxide. A mixture of these three components is burned at
temperatures above 1400 °C. First the calcite decarbonizes at approx. 600 °C. The calcium
oxide reacts with the Al2O3- and Fe2O3- components of clay minerals above 700 °C. Reaching
clinker conditions at 1450 °C, CaO reacts with the silicon oxide. The products of this process
are mainly tri-calcium aluminate (C3A), di-calcium aluminate ferrite (C2(A,F), celite), tri-
calcium silicate (C3S, alite) and di-calcium silicate (C2S, belite). These are the primary clinker
phases of Portland cement. "Clinker" describes the clinking noise when cement granules fall
out of the furnace onto the floor. The granules are milled down together with calcium
sulphate. The sulphate is added as retarder for C3A-hydration. Usually gypsum (calcium
sulphate di-hydrate, C s H2) is used. Since the granules are still hot and the milling process
also produces heat, the primary sulphate dehydrates partly to calcium sulphate hemi-hydrate
(C s H0.5) and partly to water-free calcium sulphate (anhydrite, C s ). A certain ratio of hemi-
hydrate and anhydrite can also be added on purpose to control the C3A hydration kinetics.
2.5.2 Clinker and Cement Phases
Tri-calcium aluminate, C3A, Ca3Al2O6
Tri-calcium aluminate occurs in different polymorphs. Pure C3A is cubic. In OPC an
orthorhombic modification is formed by incorporation of alkalis especially potassium. Cubic
and orthorhombic forms can coexist in OPC. A mixture of both polymorphs is hard to analyse
by X-ray diffraction. Cubic C3A is the most reactive phase in OPC closely followed by the
orthorhombic form. Monoclinic modifications of C3A are known but they are of no
importance in OPC.
Celite, di-calcium aluminate ferrite, C2(A,F), Ca2(Al, Fe)2O5
C2(A,F) is a solid solution of the binary system Ca2Al2O5 - Ca2Fe2O5. The term C2(A,F) is an
abbreviation for C2AxF1-x. Without other oxide components the series of solid solutions is
continuous i.e. all ratios of Al2O3 and Fe2O3 exist. In OPC C2(A,F) exists usually with a
component ratio around 0.5. The single point phase C2A0.5F0.5 may also be written as C4AF.
Brownmillerite is natural C2(A,F) often associated with ettringite in contact-metamorphic
limestone. C2(A,F) binds Fe2O3, the most important colour-giving oxide component of
Portland cement. The colour of OPC therefore depends on the amount of C2(A,F) in cement
and the Fe/Al-ratio in that phase. The colour of Portland cement ranges from brown over grey
to greenish grey. A C2(A,F)-free Portland cement is white.
9
Alite, tri-calcium silicate, C3S, Ca3SiO5
C3S is the main component of OPC with contents above 70 mol-%. C3S exists in several
modifications depending on the temperature. Below 980 °C two triclinic forms T1 and T2 are
known. The pure compound at room temperature is T1 with a transition point to T2 at 620 °C.
Above 980 °C three monoclinic polymorphs are known: M1, M2 and M3 in order of
increasing temperatures with transition points at 990 °C and 1060 °C. A rhombohedral high-
temperature-modification exists above 1070 °C. Due to impurities of substituent ions C3S
exist at room temperatures in OPC as metastable polymorphs close to M1 or M3 or a mixture
of both. The hydration of C3S has the largest contribution to strength development of OPC.
Belite, di-calcium silicate, C2S, Ca2SiO4
Five different polymorphs are known from C2S. The stability of pure components depends on
the temperature. These modification in order of increasing temperature are: γ, β, α´L, α´H and
α with transition points at 500, 690, 1160 and 1425 °C. Like C3S, modifications stable at
higher temperatures can be stabilized at lower temperature by impurities. In OPC impurities
stabilizes the β-form at room temperature. The hydration of C2S contributes to strength
development but C2S is less active than C3S.
Anhydrite, calcium sulphate, C s , CaSO4
Anhydrite is the calcium sulphate end-member of the binary system CaSO4 - H2O. Three
different polymorphs exist with different solubilities in water: cubic anhydrite I, orthorhombic
anhydrite II and hexagonal anhydrite III [BGG1]. The firing of gypsum or bassanite at
temperatures above 110 °C forms hexagonal anhydrite III which is soluble in water.
Anhydrite III still contains little water, less than 0.05 per formula unit. Depending on the
partial pressure of vapour during the firing process an α-form (wet) and β-form (dry) exists.
In contradiction to the usual phase indices of mineralogy the Greek indices in this case do not
represent different polymorph phases but different morphologies. The α-form is well
crystalline with idiomorph crystals. The β-form is produced by rapid dehydration that does
not allow the anhydrite to recrystallize well. It consists of cryptocrystalline particles with a
rough surface. Due to the increased surface area the β-form dissolves much faster in water
than the α-form. Higher burning temperatures lead to the formation of orthorhombic
anhydrite II at temperatures above 350 °C. This phase exists only in one morphological form
and is not soluble in water. Natural anhydrite is the orthorhombic form. Firing at temperatures
above 800 °C causes anhydrite II to partly desulphurize. The incorporation of remaining CaO
into the crystal leads to renewed activation of the anhydrite II to react with water [Kue1]. Cubic

10
anhydrite I only exists at temperatures above 1180°C and is therefore irrelevant for
construction materials. Anhydrite is added to OPC as a retarder for C3A-hydration. Usually
the sulphate carrier is added to cement during grinding in the form of gypsum. The heat
produced during the milling process dehydrates the gypsum to hemi-hydrate and β-anhydrite.
A certain anhydrite to hemi-hydrate ratio can also be added on purpose to control the kinetics
of ettringite formation in the early cement hydration process [Hae1, Win1]. The dissolution rates
of the sulphates are critical.
Bassanite, calcium sulphate hemi-hydrate, C s H0.5, CaSO4⋅½H2O
Two forms exist with different water-contents. Besides the common monoclinic
CaSO4⋅0.5H2O there is a trigonal CaSO4⋅0.8H2O. The dehydration process of gypsum above
50 °C forms CaSO4⋅0.5H2O. Its natural form is called bassanite. Hemi-hydrate is also divided
into an α- and β-form. Also in the case of C s H0.5 the Greek indices indicate no polymorphs
with different crystal structure. The difference lies in the crystallinity and morphology of the
hemi-hydrate. As with anhydrite III the formation of α- and β-C s H0.5 depends on the partial
vapour pressure during the dehydration of gypsum. β-hemi-hydrate is a phase with poor
crystallinity and rough surfaces. α-hemi-hydrate occurs in idiomorphic crystals. Both forms
can be easily detected by their BET-values. The typical specific surface area of β-calcium
sulphate hemi-hydrate lies between 6 and 16 m²/g whereas that of the α-form is around
1 m²/g. Due to increased surface area β-hemi-hydrate dissolves much faster in water than α-
hemi-hydrate. Like anhydrite and gypsum, hemi-hydrate is added to cement to control C3A-
hydration.
Gypsum, calcium sulphate di-hydrate, C s H2, CaSO4⋅2H2O
Only one monoclinic modification exists. Gypsum is the raw material for most calcium
sulphates used in construction materials. Its origin maybe from natural sources as well as
from industrial by-products. Large amounts of gypsum come from desulphuration facilities of
power plants and from phosphoric and citric acid production. Natural calcium sulphates occur
as gypsum and anhydrite. Natural bassanite plays a negligibly small role. Like hemi-hydrate
and anhydrite gypsum is added to cement to control C3A-hydration.
11
Ettringite, calcium aluminate ferrite tri-sulphate hydrate, AFt, Ca6(Al,Fe)2O6(SO4)3⋅32H2O
Ettringite is the first hydration product of OPC in presence of sulphates. It also exists in
nature in contact-metamorphic limestone. It was first found near the village Ettringen in the
Middle German Highlands from which the mineral got its name. Besides the pure phase from
which only one modification exists, solid solutions with other components of OPC are known.
Fe(III) for example can substitute Al. All polymorphs are hexagonal. The abbreviation AFt
stands for calcium aluminate ferrite tri-sulphate hydrate. In Portland cement ettringite
crystallizes rapidly within the first minutes of cement hydration. A second ettringite formation
follows after hours. Both, first and second ettringite formation are sometimes summarized in
the literature as primary ettringite formation to distinguish those hydration processes from the
so-called secondary ettringite formation. The latter one is caused by sulphate-contaminated,
meteoric water (acid rain) that intrudes into aged cement after years leading to fatal damage in
constructions. The formation of ettringite and monosulphate in Portland cement hydration
processes was studied in-situ using synchrotron XRD by Christensen et al. [Chr1]. Further
details on ettringite formation as a nucleation and growth process out of pore solution is given
by Amathieu and Estienne [Ama1].
Monosulphate, calcium aluminate ferrite monosulphate hydrate, AFm,
Ca4(Al,Fe)2O6SO4⋅12H2O
Monosulphate is a degradation product of ettringite that is formed when the sulphate is
undersaturated in the pore solution of OPC. AFm stands for calcium aluminate ferrite
monosulphate hydrate since this phase may also contain a ferrite component.
Calcium aluminate hydrates, CAH
CAH is a collective term for all calcium aluminate hydrates. The most important phases are
C4AH19 and the later dehydration product C4AH13. In OPC their formation is inhibited by the
addition of sulphates. C4AH19 first occurs when all sulphate and ettringite is consumed by
monosulphate.
Portlandite, calcium hydroxide, CH, Ca(OH)2
Portlandite is, besides CSH-phases, the main hydration product of C3S and C2S. Due to the
lower Ca-content the C2S-contribution to portlandite formation is smaller than that of C3S.
Portlandite reacts with atmospheric CO2 to calcite, the trigonal Ca-carbonate. Williams
et al. [Wil1] made quantitative determination of the CH-content in hydrating cement in-situ by
means of synchrotron XRD.
12
Calcium silicate hydrates, CSH
In contrast to CAH, CSH is not a collective term for various well-defined calcium silicate
hydrates. It describes an X-ray amorphous phase with uncertain stoichiometry. In older
studies it is usually described as gel due to its amorphous appearance in XRD-measurements
and its diffuse appearance in early scanning electron microscopy (SEM). In the early nineties
Taylor [Tay1] still describes CSH as gel although its structure is determined as similar to
tobermorite. Improved techniques in SEM especially the field emission gun (FEG) and the
environmental scanning electron microscopy (ESEM) led to higher resolution. Standard SEM
requires carbon- or gold coating of the sample to provide a conductive layer on the sample
surface. ESEM does not need such conductive coating. ESEM-FEG studies by Stark, Moeser
and Eckart [Sta1, Sta2] showed the crystalline nature of CSH. Still the determination of crystal
structure and chemistry is difficult since the crystals appear as tiny needles only a few nm in
size. The gel-like morphology in early SEM-studies is explained by the carbon layer whose
thickness is larger than the CSH crystal sizes. CSH is the main hydration product in OPC and
contributes mostly to strength formation. Whitfield and Mitchel [Whi1] did quantitative phase
analysis of amorphous phases in Portland cement based on the Rietveld method.
2.5.3 Hydration Processes of Portland Cement
The clinker phases of Portland cement usually do not exist as single-phase particles since the
original clinker granules exist as more or less homogeneous breccias of all phases. Also the
fine particles of powdered cement consists rather of all clinker phases randomly distributed.
The most reactive clinker phase is C3A. In sulphate-free cements C3A would react with water
immediately forming different calcium aluminate hydrates (CAH). First C4AH19 crystallizes.
During the drying process of cement the C4AH19 dehydrates to C4AH13. The cement sets
quickly with fast strength development. To avoid this fast reaction the C3A-hydration in
Portland cement is retarded by calcium sulphate. The reaction of C3A with sulphates produces
ettringite, a reaction that prevents CAH formation during early hydration. Taylor [Tay1]
describes cement hydration in three steps: 1. The early period (initial state), 2. the middle
period (accelerated state) and 3. the late period with divisions after approx. three and 24 hours
of hydration. Taylor´s discussion is based on the studies of Scrivener [Scr1]. C3A as the most
active phase reacts immediately with water and sulphate forming ettringite and a little CAH.
Simultaneously some of the calcium silicate reacts with water. The polymineralic particle is
covered by a thin colloidal Al- and Si-rich shell with significant amounts of calcium and
sulphate. The component ratio of the shell varies with the underlying primary phase. Within
13
10 minutes ettringite crystallizes as short-prismatic hexagonal crystals on the outer side of the
shell and in the pore spaces. The place of ettringite formation suggests that nucleus formation
takes place out of solution as a dissolution-precipitation-process.
In the accelerated state CSH begins to grow rapidly at the outer side of the shell. It is
assumed that CSH nucleates on the ettringite. The shell grows outwards and the dissolving
primary phases leave a gap between grain and shell [Sta3] filled with highly concentrated
solution. This is evidence that 1. CSH formation is also a dissolution-precipitation-process
and 2. the shell is ion-permeable at this stage. The morphology of CSH depends on the free
space available for crystallization. After 12 hours the outward growth of the shell has reached
so far that shells of neighboured grains interconnect. This development coincides with
maximum heat evolution and highest rate of strength formation. CH crystallizes in the pore
rooms simultaneously with CSH formation. At the end of the accelerated stage ettringite
growth takes place forming needle-like crystals. Scrivener [Scr1] sees the second ettringite
crystallization related to C3S hydration.
The late period is characterized by decreased permeability of the shell. CSH starts to grow
inwards. Since CSH grows faster than C3S retreats, the gap fills up and vanishes after 7 days.
With ongoing reaction of C3A the sulphate concentration drops rapidly inside the shell. This
leads to monosulphate formation at the inner side whereas at the outside ettringite may
persist. As the gap between shell and grain disappears the reaction rate decreases. Further
CSH formation is assumed to be a topochemical reaction replacing C3S in place. The
hydration of C2S and C2(A,F) is hard to observe. Significant amounts of C2S have been
hydrated after 14 days but remaining C2S may react slowly over years.
2.5.4 Cellulose Ethers
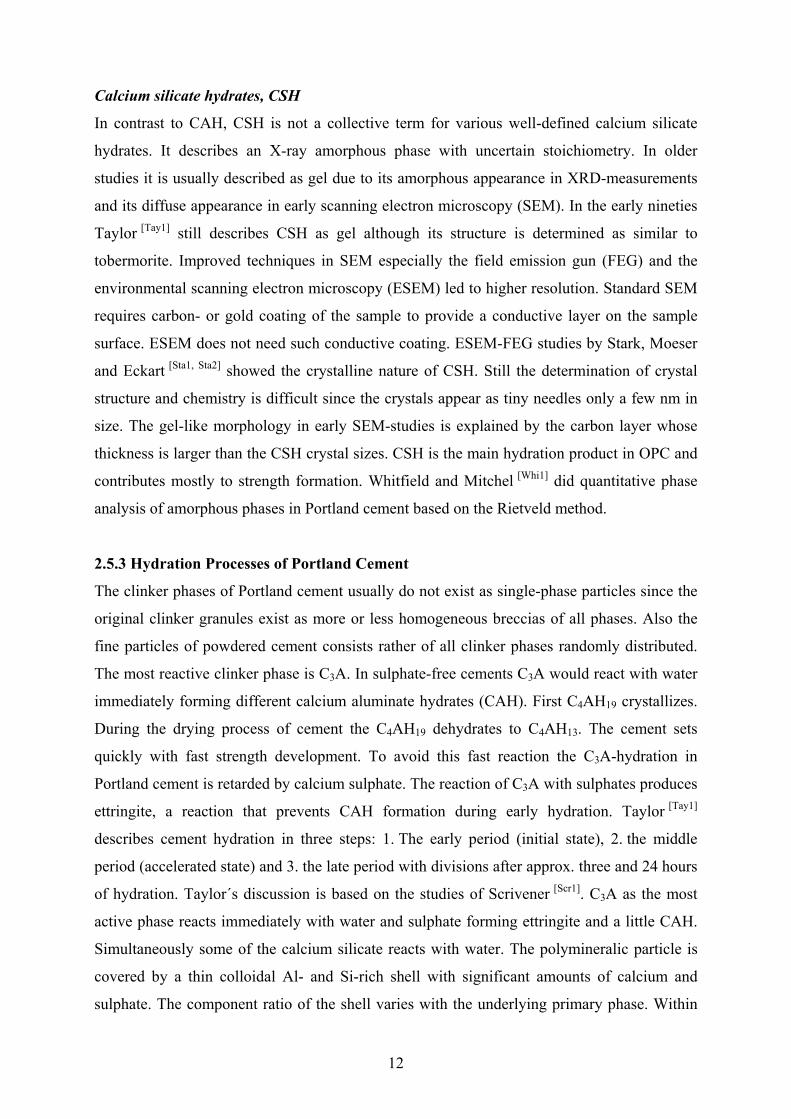
Cellulose ethers are derivatives of cellulose, a polysaccharide consisting of β-1,4-glycosidicly
bonded anhydroglucose units (fig. 2.01). The numbering of the carbon positions starts at the
carbon [1] next to the ring oxygen with a link to the neighboured anhydroglucose ring. The
numbering follows the direction to the next carbon linked to a hydroxyl group (away from the
ring oxygen). The carbon at position [4] is linked by an oxygen to the [1]-position of the
previous ring (1,4-bonding). The carbon position [6] does not belong to the ring but is situated
in a side branch connected to position [5]. OH-groups are linked to carbons on positions [2],
[3] and [6].
Cellulose consists of amorphous and mostly crystalline domains of parallel oriented
polymer molecules, which are not soluble in water. They are bonded to each other by
14
intermolecular H-H bridging bonds at the hydroxyl groups of the anhydroglucose units. These
bonds also exist within one molecule as intramolecular H-H bridging bonds. Besides lignin,
cellulose is the main component of wood. The chain length of the polymer molecule depends
on the raw material. The molecular weight increases with the raw material in the following
order: grass and other lower plants, wood, cotton.
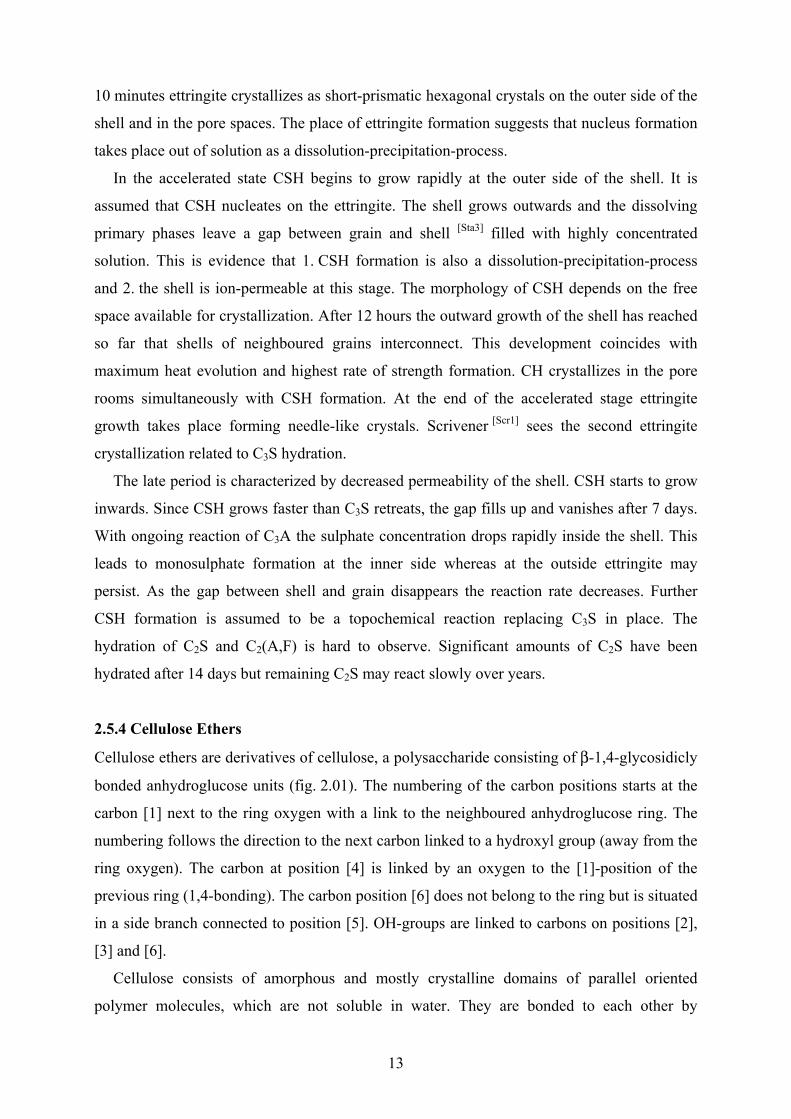
In order to etherify cellulose the polymer is first deprotonated in caustic soda solution. The
H-H-bonds are broken and the remaining oxigen of the former OH-groups of the dissolved or
swollen, negatively charged polymer molecules are associated with sodium cations (fig. 2.02).
Sodium cellulose is water-soluble. The conversion with sodium hydroxide is necessary to
make the active groups accessible for etherifying agents. In the next step the etherifying agent
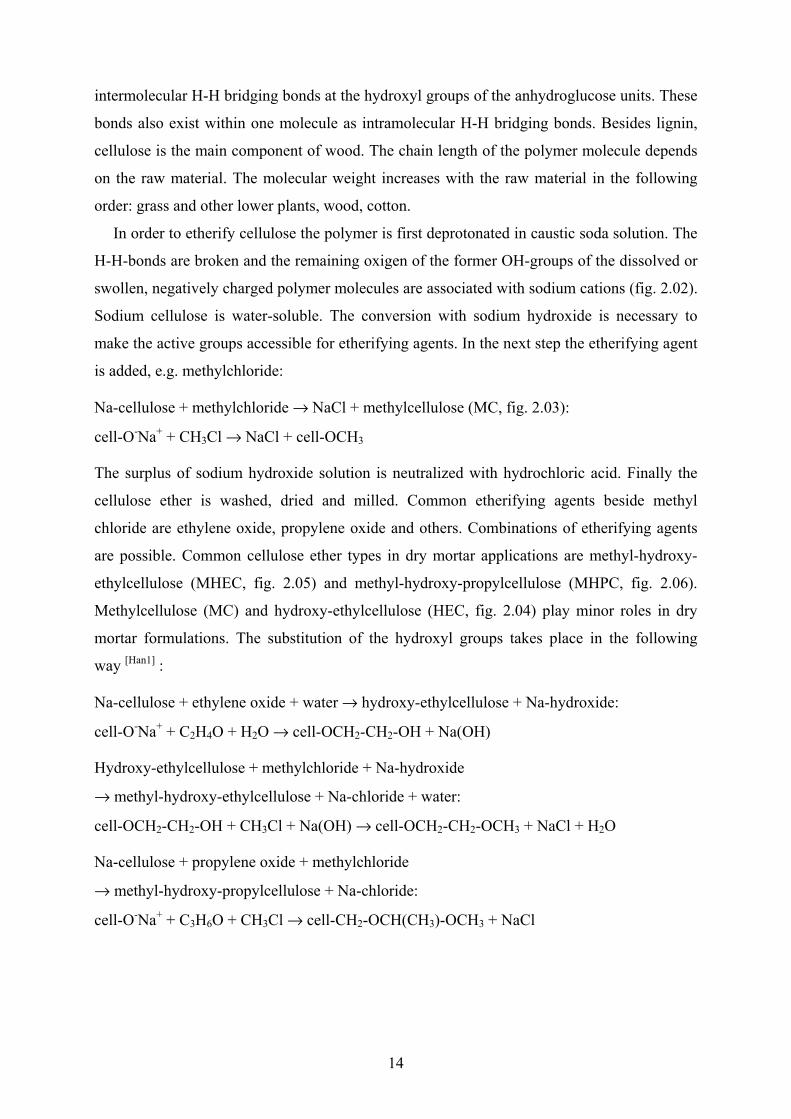
is added, e.g. methylchloride:
Na-cellulose + methylchloride → NaCl + methylcellulose (MC, fig. 2.03):
cell-O-Na+ + CH3Cl → NaCl + cell-OCH3
The surplus of sodium hydroxide solution is neutralized with hydrochloric acid. Finally the
cellulose ether is washed, dried and milled. Common etherifying agents beside methyl
chloride are ethylene oxide, propylene oxide and others. Combinations of etherifying agents
are possible. Common cellulose ether types in dry mortar applications are methyl-hydroxy-
ethylcellulose (MHEC, fig. 2.05) and methyl-hydroxy-propylcellulose (MHPC, fig. 2.06).
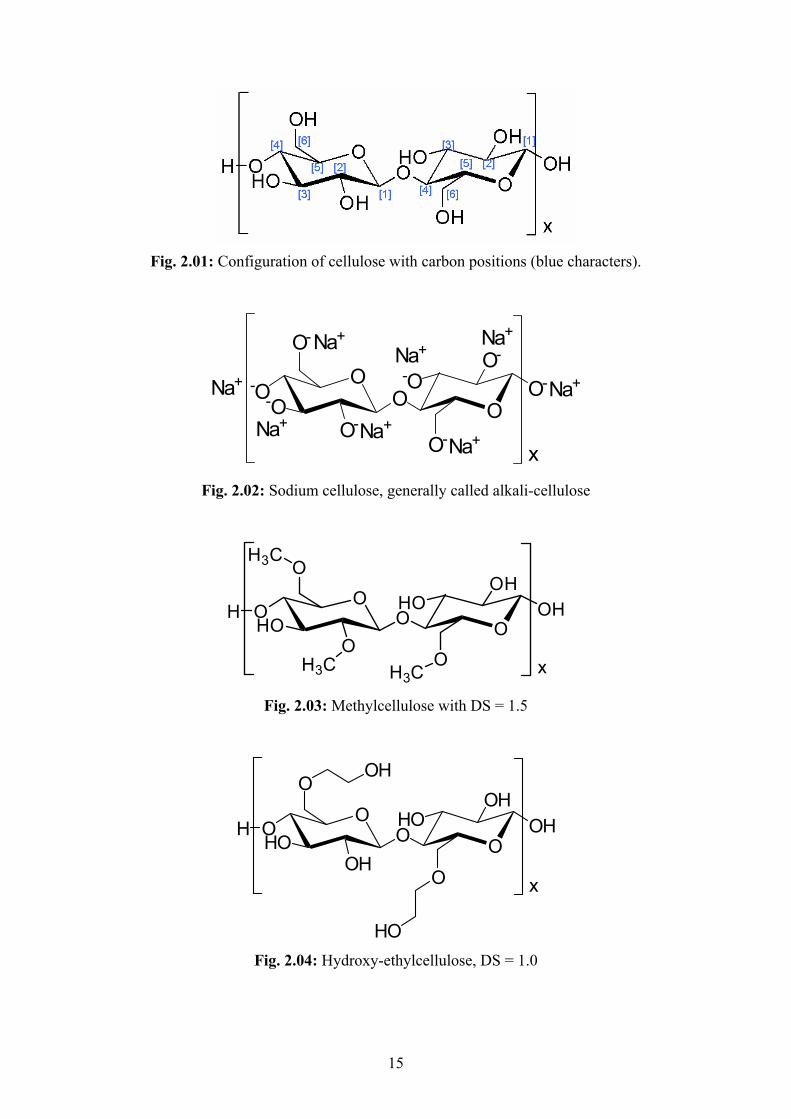
Methylcellulose (MC) and hydroxy-ethylcellulose (HEC, fig. 2.04) play minor roles in dry
mortar formulations. The substitution of the hydroxyl groups takes place in the following
way [Han1] :
Na-cellulose + ethylene oxide + water → hydroxy-ethylcellulose + Na-hydroxide:
cell-O-Na+ + C2H4O + H2O → cell-OCH2-CH2-OH + Na(OH)
Hydroxy-ethylcellulose + methylchloride + Na-hydroxide
→ methyl-hydroxy-ethylcellulose + Na-chloride + water:
cell-OCH2-CH2-OH + CH3Cl + Na(OH) → cell-OCH2-CH2-OCH3 + NaCl + H2O
Na-cellulose + propylene oxide + methylchloride
→ methyl-hydroxy-propylcellulose + Na-chloride:
cell-O-Na+ + C3H6O + CH3Cl → cell-CH2-OCH(CH3)-OCH3 + NaCl
15
Fig. 2.01: Configuration of cellulose with carbon positions (blue characters).
x
O-O-O OO-
O-
O
-OO-
O-
O-
Na+Na+
Na+
Na+
Na+
Na+
Na+
Na+
Fig. 2.02: Sodium cellulose, generally called alkali-cellulose
x
OOHO O
O
O
OHO
OH
O
H OH
H3C
H3C H3C Fig. 2.03: Methylcellulose with DS = 1.5
x
OOHO O
OH
O
OHO
OH
O
H OH
OH
HO Fig. 2.04: Hydroxy-ethylcellulose, DS = 1.0

16
x
OOHO O
O
O
OHO
OH
O
H OH
OH
O
H3C
CH3 Fig. 2.05: Methyl-hydroxy-ethylcellulose, DS = 1.5
x
OOHO O
O
O
OHO
O
O
H OH
O
H3C
CH3
HO CH3
H3C
CH3
Fig. 2.06: Methyl-hydroxy-propylcellulose, DS = 2.0
The stoichiometric equations given above are simplified disengagements and do not reflect
the actual production processes. The latter are not disclosed by the producers. The substitution
of OH-groups of one ring with different substituents can take place either:
1. in one position successively, e.g. figure 2.05, right ring, position [6]: -OCH2-CH2-OCH3; or
2. in different positions parallel, e.g. figure 2.05, left ring, position [6]: -OCH2-CH2-OH and
position [2]: -OCH3.
On the construction material market MHEC, MHPC and MC are known under the collective
name methylcellulose (MC). It has to be kept in mind that in this case the term
methylcellulose does not reflect the actual chemistry of the cellulose ether.
Cellulose ethers are characterized by their chemistry as mentioned above, the conversion
grade (MS and DS), molecular weight and milling grade. The degree of substitution (DS) is
the average number of OH-groups per anhydroglucose ring substituted by etherifying groups.
The substituents are usually statistically distributed over the whole polymer. The hydroxyl
17
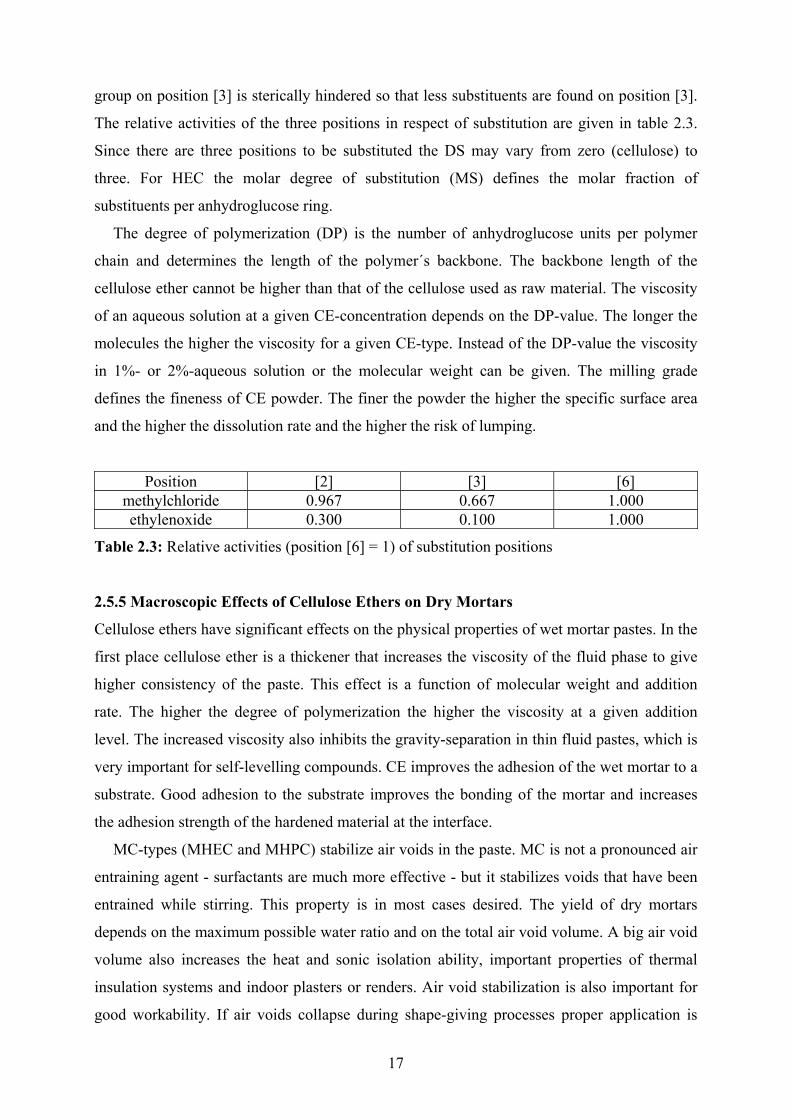
group on position [3] is sterically hindered so that less substituents are found on position [3].
The relative activities of the three positions in respect of substitution are given in table 2.3.
Since there are three positions to be substituted the DS may vary from zero (cellulose) to
three. For HEC the molar degree of substitution (MS) defines the molar fraction of
substituents per anhydroglucose ring.
The degree of polymerization (DP) is the number of anhydroglucose units per polymer
chain and determines the length of the polymer´s backbone. The backbone length of the
cellulose ether cannot be higher than that of the cellulose used as raw material. The viscosity
of an aqueous solution at a given CE-concentration depends on the DP-value. The longer the
molecules the higher the viscosity for a given CE-type. Instead of the DP-value the viscosity
in 1%- or 2%-aqueous solution or the molecular weight can be given. The milling grade
defines the fineness of CE powder. The finer the powder the higher the specific surface area
and the higher the dissolution rate and the higher the risk of lumping.
Position [2] [3] [6] methylchloride 0.967 0.667 1.000 ethylenoxide 0.300 0.100 1.000
Table 2.3: Relative activities (position [6] = 1) of substitution positions
2.5.5 Macroscopic Effects of Cellulose Ethers on Dry Mortars
Cellulose ethers have significant effects on the physical properties of wet mortar pastes. In the
first place cellulose ether is a thickener that increases the viscosity of the fluid phase to give
higher consistency of the paste. This effect is a function of molecular weight and addition
rate. The higher the degree of polymerization the higher the viscosity at a given addition
level. The increased viscosity also inhibits the gravity-separation in thin fluid pastes, which is
very important for self-levelling compounds. CE improves the adhesion of the wet mortar to a
substrate. Good adhesion to the substrate improves the bonding of the mortar and increases
the adhesion strength of the hardened material at the interface.
MC-types (MHEC and MHPC) stabilize air voids in the paste. MC is not a pronounced air
entraining agent - surfactants are much more effective - but it stabilizes voids that have been
entrained while stirring. This property is in most cases desired. The yield of dry mortars
depends on the maximum possible water ratio and on the total air void volume. A big air void
volume also increases the heat and sonic isolation ability, important properties of thermal
insulation systems and indoor plasters or renders. Air void stabilization is also important for
good workability. If air voids collapse during shape-giving processes proper application is
18
hampered (e.g. combing of tile cements or smoothing of render). On the other hand air voids
deteriorates the cohesive strength of the hardened mortar. Strength (cohesive, flexile and
compressive) is an exponential function of bulk density.
Cellulose ether and water molecules have a strong affinity. A hydrate shell surrounds each
CE molecule. This immobilizes the fluid phase and gives water retention ability to the mortar.
Without water retention ability the water will be sucked into a porous substrate by capillary
forces and is no longer available for the hydration process. The hardening of the mortar is
disturbed. To provide water-retention ability is the most important property of cellulose
ethers.
All properties of cellulose ethers mentioned above are desired for good performance. In
some cases CE alone is not sufficient. Further additives are needed to improve the rheology
and consistency, to achieve mechanical flexibility, better cohesion and adhesion. But water
retention capacity makes CE indispensable. No other polymer provides water retention values
(WRV) as does CE and no other polymer provides so many improvements in respect of
workability. This makes CE an universal rheological regulator not only for construction
materials. Wherever an aqueous system has to be adjusted to defined rheology cellulose ether
is the first choice in food, pharmacy, body care, household cleaners and ceramic extrusion. An
overview of the physical properties of cellulose ether in various applications is given by
Croessmann and Klaus (1975) [Cro1].
2.5.6 Dry Mortar Applications and their Economic Relevance
Mortar is a construction material consisting of three major components: binder, filler and
additives. Binders maybe cements, calcium sulphates, lime or organics such as latex or
combinations thereof. Silica sand, carbonates or light materials (polystyrene, perlite) can work
as fillers. Until the fifties of the last century the mortar was mixed at the construction site by
the craftsmen (job-site mixing). This method did not enable workmen to compose mixtures
with well-defined component ratios. Cement producers started to offer complete application-
specific formulations and delivered them as dry powder ("dry mortar") in bags or silos in
contrast to concrete, which comes as wet mixture. The industrial mortar production allows to
develop highly specialized products with optimized well-defined addition ratios of all
components based on laboratory test results and to apply plasters on large wall areas with the
help of spraying pumps [Irs1]. In the sixties cellulose ether was added for the first time. Job site
mixed materials had to be applied in thick layers of several centimetres to counterbalance the

19
water loss on porous substrates. Due to the water retention ability of CE it was now possible
to apply thin layers (approx. 1 cm for plaster and render).
Gypsum-based dry mortars are mainly indoor plasters and joint fillers. The binder is
usually calcium sulphate hemi-hydrate in some cases with addition of anhydrite. Sulphate-
based floor screeds contain anhydrite as binder for higher strength. Fillers are quartz sand,
carbonates or coarse anhydrite.
Cement-based systems are used for render (in- and out-door), tile cements, thermal
insulation systems, self-levelling compounds and masonry mortars. Render is the most
undemanding application of cement-based mortars since the demand on strength is not very
high. Therefore it has the broadest variety of components. Render equalizes uneven walls and
protect the substrate. Indoor application is in most cases to prepare walls for painting or
wallpapers. Their advantage against gypsum-based plasters is their high alkalinity that
prevents mustiness in humid rooms. Other applications are decorative renders. Outdoor
renders have to be chemically resistant against meteoric influences. Renders can be applied by
hand or with help of spraying machines.
Tile cement is the glue between tiles and substrate. Tile cements are highly sophisticated
due to the high requirements on strength and flexibility, open and correction time. Open time
is the time after application on the wall in which the attachment of tiles is possible. Correction
time is the time in which a tile can be slightly moved for correction without loosing adhesion.
Masonry mortars bind the bricks or stones in masonry and equalize uneven sizes. The
mortar has to be softer than the bricks. Thus mechanical stress causes cracks or adhesion loss
in the joint instead breaking the brick. It is easier to repair damages of the mortar layer than to
replace broken bricks.
Self-levelling compounds are the most demanding formulations. They are designed to
equalize uneven floors unaided. The consistency must be thin enough to flow but segregation
must be avoided. Cementitious systems shrink during hydration. Since self-levelling
compounds are spread in thin layers over large floor spaces shrinkage would causes cracks.
To counterbalance cement shrinkage calcium sulphates are added. The sulphates react with
the alumina component of the cement to form strongly expanding ettringite. Cement
shrinkage and ettringite expansion must be synchronized by well-defined ratios of cement and
sulphates as well as retarders and accelerators.
Thermal insulation systems are thick polystyrene boards covered on the outside by a thin
render layer that is enforced by an integrated plastic lattice. Instead of render, tile cement can
be applied to fix tiles or brick blenders.

20
The global market shows regional differences. While masonry combined with render or
plaster is the traditional way to build in Europe, the North American region has little masonry.
Private residential homes are erected as light constructions from wood and plasterboards.
Bigger constructions are made of concrete. Instead of render, walls are covered with gypsum
plasterboards on which wallpapers can be applied directly. Ready-to-use formulations based
on organics are used for joint fillers. They already contain water and setting is caused by
drying. Tile cements are more common in the U.S. than other mortars. The most important
market for dry mortars is Europe traditionally.
2.6 State of Research
The development of construction materials in the times before John Smeaton was mostly
based on handcraft experiences that have been made for generations of masons. Inventions
were mostly made by coincidence and non-systematic trial and error experiments. Systematic
research based on well-aimed experimental work is known from Roman civil engineers. The
English historian R. Rank-Graves [Ran1] mentioned the development of a hydraulic cement for
the enlargement and reinforcement of the harbour of Ostia in the 1st century A.D. The Roman
scholar Vitruv [Vit1] described pozzolan-based cements and concrete and referred to mortars of
the 3rd century B.C. Modern cement research started almost contemporaneously with cement
production at the end of the 18th century. At the same time the scientific analytic methods
developed rapidly. Much work has been invested in the determination of the chemistry and
crystal structures of cement phases. Efforts have been made to understand the phase transition
processes during hydration. The development of XRD and SEM methods and their
application for decades led to an huge amount of publications difficult to survey. A summary
of the state of research in the nineties is given by Taylor [Tay1] and Verein Deutscher
Zementwerke [VDZ1]. Stark et al. [Sta1, Sta2] gave new aspects of Portland cement hydration based
on ESEM-FEG studies. Synchrotron XRD was used for in-situ monitoring of phase
developments during hydration by Christensen (2003) [Chr1] and Williams (2003) [Wil1].
Also using ESEM-FEG Eckart and Stark [Eck1] (1997) studied the hydration of C3A in
presence of sulphates in pure phase admixtures. They describe the morphology of ettringite
and its dependence on the pH-value of the pore solution. At a pH over 12 a very fine
crystalline or X-ray amorphous form of ettringite was found. This correlates with the results
from studies by T. Cerulli [CER1] (2005) from Mapei, Milan, who found a correlation between
ettringite morphology and sample preparation. Thereafter the first ettringite formed within the
first minutes of hydration of OPC is always poorly crystalline or is an X-ray amorphous form.

21
Therefore only weak ettringite peaks occurs in in-situ X-ray diffraction patterns. This changes
significantly if the paste is quenched with acetone. X-ray diffraction patterns of samples
where the hydration process is stopped in this way, show strong peaks of well crystalline
ettringite. Cerulli also confirmed those results with ESEM-FEG images of gel-like phases
formed in the very early hydration. The poorly crystalline ettringite recrystallizes to well-
crystalline ettringite in the undisturbed cement paste after a few hours. Cerulli estimated the
amount of ettringite generated in the first formation to be about 80 masspercent of all
ettringite formed during the whole hydration process. Moeser [Moe1] (2003) gave an
explanation why some cement phases occasionally appear as poorly crystalline in ESEM-FEG
images. He found that the tiny crystals can be destroyed by the electron beam resulting in a
change of chemistry and a loss of crystallinity.
0
50
100
150
200
250
0 4 8 12 16 20 24 28 32 36 40 44
hydration time [h]
conc
entr
atio
n [µ
M]
0
40
80
120
160
200
conc
entr
atio
n [m
M]
Si/µM
Al/µM
S/mM
Ca/mM
Fig. 2.07: Temporal development of ion concentrations in the pore solution of Portland
cement. Data from D. Rothstein et al. [Rot1]
Rothstein et al. [Rot1] (2002) studied the ion-content of pore solutions in wet cement pastes as a
function of hydration time. The authors determined beside others the elemental concentrations
of S, Si, Al and Ca dissolved in the pore water of Portland cement and monitored the
development during hydration. They found a sharp decline of S, Al and Ca-concentrations
accompanied with a steep increase of Si in a time between 6 and 12 hours of hydration
(fig. 2.07). They divided the hydration process into stage A (before the changes) and stage B
22
(after the changes). From elemental concentrations they calculated the saturation indices (SI)
of gypsum, portlandite, ettringite and monosulphate based on thermodynamic models.
Ettringite turned out to be a very stable phase with supersaturation throughout the observed
time of 28 days. The SI of portlandite increased from undersaturation in stage A to
supersaturation in B. For gypsum the SI decreased from saturation to undersaturation.
Monosulphate was supersaturated all the time but significantly less than ettringite.
Little work has been done in public on the effects of cellulose ether on cement hydration.
Only few papers on this subject have been published. Bayer and Lutz [Bay1] summarize the
effect of CE in dry mortars in aspect of workability. A. Janni [Jan1] studied the interaction of
cellulose ethers with other film-forming polymers and their migration. The influence of
polysaccharides on cement hydration was recently studied by Peschard et al. [Pes1]. The authors
recognized the degree of substitution and the molecular weight as the key parameter of the
polymer. They came to the conclusion that CE has no effects on ettringite crystallization and
only a weak retarding effect on portlandite formation compared to those of starch ether and
dextrin. They found that the polymer degradation in alkaline solution depends on the
molecular weight and that sugar acid as a degradation product causes the retardation of
portlandite formation. Dextrin degrades to sugar acids whereas no degradation products of CE
could be detected.
Coarna [Coa1] et al. studied the effects of a methyl-hydroxy-propylcellulose (MHPC) with a
DS of 1.8 on the strength development of Portland cement. They found a delayed evolution of
flexural strength due to the retarding effect of CE on Portland cement. After long-time storage
(>100 days) they found increased flexural strength of samples containing 3 mass-% CE.
Based on Electron Spectroscopy for Chemical Analysis they assume a chemical reaction
between CE and mineral phases. Thereafter C-O bonds of the CE break and the oxygen reacts
with calcium on the mineral surface.
The influence of methyl-hydroxy-ethylcellulose (MHEC) with a DS of 1.75 on the
hydration of Portland cement extrusion pastes was studied by Ridi et. al. [Rid1]. In pure phase
experiments they found a significant retardation of C3S and C2S hydration in the presence of
MHEC. The retarding effect of CE on the hydration processes of C3A and C4AF was studied
in absence of sulphates. A significant inhibition of the crystallization of the cubic stable
phases C3AH6 respectively C3(A,F)H6 was detected.
Brandt [Bra2] investigated the calcium sulphate hydration in diluted systems in the presence
of CE. The dissolution of calcium sulphate hemi-hydrate is non-specifically retarded as a
function of viscosity. The crystallization of calcium sulphate di-hydrate is slightly

23
DS-specifically retarded independently of viscosity. At low DS the morphology of crystal
surface step growth changes from prismatic to needle-like crystals.
The effects of cellulose ethers on early cement hydration has been recently studied by
J. Pourchez [Pou1] at the Ecole des Mines de St. Etienne, France, and C.-J. Haecker [Hae1] from
Shin-Etsu. Their results were discussed at the annual CEReM meeting in February 2005 in
Paris. Both agree that CE has a DS-dependent retarding effect on early cement hydration. The
lower the DS the stronger the retardation. In contrast to Pourchez, Haecker found also a DS-
specific adsorption behaviour of CE on cement particles. But Haecker doubts a causal relation
between CE-adsorption and CE-caused retardation. Because his studies came to the result that
the increase of CE-addition level in excess of adsorption saturation still amplifies the CE-
caused, DS-specific retardation [Hae2]. In their latest investigations Pourchez et al. [Pou2] also
discussed the effects of degradation products of cellulose ethers in an alkaline environment.
The results showed that CE is very stable in alkaline media. Nevertheless they identified and
quantified hydroxy carboxylic acids generated during alkaline degradation but found that their
effect on cement hydration is rather small. Furthermore the authors determined, that the
capacity of CE to complex calcium ions is negligibly small.
Earlier works at Hercules Inc. investigated the influence of cellulose ethers on the
hydration behaviour of OPC and gypsum based machine plasters. Results were given in
internal reports that were not published. As far as the author of this thesis was involved results
achieved in these studies are used in this work. Especially an investigation on the hydration
processes of Portland cement using the same materials as used in this work gave fertile inputs
to this thesis. The hydration processes were studied by the means of ultra sonic
measurements, heat flux calorimetry and laboratory X-ray powder diffraction.
Other organic polymers have been subjects of research. Yoshiaka et al. [Yos1] determined
the phase-specific adsorption of superplasticizers on cement particles. The adsorption of those
ionic polymers depends on the ζ-potential of the mineral phase. Plank et al. [Pla1] found out
that poly-carboxylates were mostly adsorbed on ettringite whereas almost no polymers of that
type adsorbed on gypsum and portlandite. The effect of superplasticizers on hydration
processes of cement was investigated by Roessler and Stark [Roe1]. The physical influence of
superplasticizers on wet cement pastes was studied by Al-Wakee et al. [Alw1].
24
3. Methods
The investigation methods described in this chapter can be divided into the following
subgroups: 1. methods to produce and to characterize the used raw materials and
2. investigation methods to describe the nature and consequences of CE-cement interaction
during early hydration, which is the original purpose of this work. X-ray powder diffraction
was used for both aims. Not all methods are described in detail if standard methods are state
of the art of science and are described in the literature. Some analytical devices were not
operated by the author himself. In those cases the operator involved in these investigations is
mentioned.
The sample preparation methods vary in detail with the different experimental set-ups. In
some cases it was even necessary to change the sample formulation but in general it was tried
to keep a standard formulation. Detailed information on sample formulations will be given in
chapter 4.4. The sample preparation will be described with the corresponding investigation
methods. All experiments except ESEM-FEG were performed at room temperature. Due to
the limited sample volume in all experiments it can be assumed that hydration heat did not
lead to a significant increase of temperature within the sample since the thermal energy could
be easily conducted into the environment. This correlates with dry mortar applications
because those construction materials are usually applied in thin layers of mostly less than two
centimetres over a large area of several square metres. In both cases (experiment and
application) the material can easily dissipate the hydration heat into the environment. The
largest sample volume was 3 cm by 2.5 cm by 3.5 cm (= 26.25 cm³) for ultrasonic
measurements, the smallest one was about 8 mm³ for synchrotron X-ray powder diffraction.
3.1 Standard Wet Paste Preparation
A standard preparation procedure for wet slurries was introduced for all experiments except
those demanding a special preparation due to their experimental set-up. Cellulose ethers were
dry blended with OPC prior to water addition. After adding tap water the mixture was allowed
to suck for 15 seconds. Afterwards the slurry was stirred with a Braun multimix 350 W
electric kitchen stirrer in lowest gear for another 15 seconds. The slurry was then immediately
applied on the sample carrier. If not mentioned otherwise, the addition level of cellulose ether
was 0.5 masspercent on dry cement. The water/solid ratio (w/s) was usually 0.5. The
preparation of a reference sample was similar with the difference that no CE was added to the
cement. For these standard formulations tap water was used. Perhaps the ion-concentration of
the tap water affects the hydration process. But all tests were done in comparison to the

25
reference sample without cellulose ether. In this comparative approach the ion concentration
of the tap water does not matter as long as the same water was used within one test series.
Comparative investigations are standard methods in construction material laboratories and
therefore tap water is mostly used. The tap water used in this investigation was rich in Ca-
carbonate corresponding with a degree of approx. 16° German hardness.
3.2 Ettringite Pure Phase Synthesis
Ettringite is the only pure mineral phase that has not been purchased but was synthesized by
the author in the Hercules laboratory. The synthesis recipe was given by S. Barnett [Bar1] from
the University of Leeds, referring to L.J. Struble [Str1]. The raw materials for the synthesis
were calcium oxide from Aldrich and aluminium sulphate 16-hydrate (Al2(SO4)3⋅16H2O)
from Fluka (table 4.4). As an auxiliary agent sucrose was added (Sigma-Aldrich, catalogue
no. 17,994-9).
Since the process is sensitive to atmospheric carbon dioxide, measures had to be taken to
avoid carbonization. The calcium oxide was fired for 24 hours at 1000 °C to decarbonize. An
adequate volume of deionized water was boiled to remove dissolved CO2. Water and CaO
cooled down under a nitrogen-atmosphere. A slurry of 13.4 g CaO in 890 cm³ of a 10 mass-%
aqueous sucrose solution was prepared in a glove box under a nitrogen atmosphere. Another
slurry of 25.11 g of Al-sulphate hydrate in 40 cm³ of water was added. The sucrose was to
inhibit CAH-precipitation. The mixture was stirred for 5 minutes and then filtered by nitrogen
pressure filtration using a micropore filter with 12 µm pore size. The sludge was washed
several times with decarbonized water during filtration to remove the water-soluble sucrose.
The sludge was finally dried under nitrogen gas stream at 35 °C for one week in a
Micromeritics SmartPrep sample station. The purity was verified by standard laboratory
X-ray powder diffraction (chapter 4.2).
3.3 Particle Size Distribution (PSD)
The PSD measurements were done by W. Hildebrandt at Hercules Inc. using a Sympatec
Gradis PFS granulometer. A highly diluted particle-air-stream was blown perpendicular to a
laser beam. The beam was diffracted in a specific circular pattern depending on the grain
sizes. Concentric arranged detectors analyse the diffraction pattern perpendicular to the
primary beam with the beam focus in the centre. The finer the particles the stronger the
aberration of the diffracted beam from the original direction. Assuming that all particles are
spheres a particle size distribution can be calculated based on a mathematical model.

26
3.4 Specific Surface Area
Blaine
The Blaine value is a rough measure of the geometric surface area of a powder and is related
to the air stream resistance when a gas floats through a powder sample in a defined cylinder.
Based on the assumption that all grains are spheres of the same size the particle size can be
calculated from the air stream resistance. Since all grains are supposed to be equally sized, the
geometric surface area can be derived as area size per volume. This value divided by the pure
density of the sample returns a geometric surface area as area size per mass and is usually
given as cm²/g. Since this method is not suitable to describe the surface of a powder correctly
it is not used in the Hercules laboratory. The Blaine value is rather more related to the mean
of grain size distribution and can be used as a quality parameter for milled materials.
Therefore it is often used in cement factories to determine the milling grades of cements. The
Blaine value was not considered in this work with the following exceptions: the Blaine values
of the Portland cement, the tri-calcium aluminate and the tri-calcium silicate pure phases that
were used in this study were determined by the suppliers to check the milling grade. The
Blaine measurements were performed by HeidelbergCement AG and at the University of
Aachen.
SV-value
A geometric surface area can be calculated from the particle size distribution received from
laser-granulometry based on the assumption that all particles are spheres. This surface area,
the so-called SV-value, is given as area per volume (m²/cm³). This value divided by the
sample pure density returns the specific geometric surface area as area per mass (m²/g). This
value usually correlates with the Blaine-value in a linear way but the absolute figure is usually
higher than the Blaine-value. The difference derives from the different assumptions of both
methods. Both assume that all particles are spheres. Blaine assumes spheres of equal size
whereas the SV-value is received from size data with a certain size distribution. Also the SV-
value, respectively the calculated geometric specific surface area, does not describe real
surfaces correctly. SV-values were calculated by W. Hildebrandt at Hercules Inc.

27
BET
The only direct measurement method to determine the reactive surface area is to measure the
amount of adsorbed gas molecules at gas-fluid-equilibrium temperature when the space
demand of a single adsorbed molecule is known. This method goes back to Brunauer, Emmet
and Teller [Bru1] and is therefore called the BET-method. As adsorbent nitrogen is usually
used. For specific surface areas below 0.5 m²/g Krypton shows more accurate results.
The specific surface areas of all raw materials used in this work were determined with
nitrogen by using a Micromeritics Gemini adsorption analyser. All samples were dried before
measurements under dry nitrogen air stream at 35°C for three days in a Micromeritics
SmartPrep sample station. The careful drying of the sample is essential since very small
amount of adsorbed moisture decreases the surface accessible for nitrogen significantly. All
measurements were done at –197 °C, the condensation point of nitrogen. At this temperature
the dynamic equilibrium between adsorbed and gas phase becomes static. The BET
measurements were done using a Micromeritics Gemini sorption analyzer.
3.5 Helium Pycnometry
To determine the pure densities of powders a Micromeritics helium pycnometer of the
AccuPyc series was used. The sample preparation for pycnometry is not as critical as for
BET-measurements since adsorbed humidity has only small effects on the total sample
volume. Nevertheless for accurate measurements the samples were dried under the same
conditions as described for BET-measurements.
3.6 Ultrasonic Measurements
Ultrasonic measurements replace Vicat needle tests in many laboratories of the construction
material industries since the 1990´s. The Vicat needle penetration test is a rough mechanical
method to determine the strength of a hydrating mortar according to national/European
standard DIN/EN 196-3. A pin loaded with a certain weight is dropped from a certain height
onto the mortar. The penetration depth of the pin is a measure for the strength of the mortar.
Inhomogenities such as lumps and air voids often falsify the test results. The advantage of
ultra sonic measurements is that inhomogenities cannot falsify the results and that the
monitoring time and temporal resolution are unlimited. Vicat tests end when the sample has
no more space for pinholes. Ultrasonic has been developed as a non-destructive method to
investigate the strength and damages of any solid material. The sonic velocity within a solid is
a function of the elastic modulus, the compressibility and the Poisson number, material

28
parameters that depend basically on the strength of a material. Detailed information on
ultrasonic measurements with the basic physical background are given by A. T. Herb
(2003) [Her1]. The strength development of a wet cement paste can be monitored by detecting
the increase of sonic speed. A Steinkamp BP 7 ultrasonic tester [Ste1] with a 25 kHz transmitter
was used for this work (Fig. A.01, appendix A.1). The polystyrene sample mould with an
inner size of 3 cm by 6 cm by 3.5 cm has circle-shaped holes of 3 cm in diameter at both short
sides to integrate sender and receiver. Polystyrene is a highly porous material and capillary
forces would suck water from the cement paste although polystyrene is hydrophobic.
Polystyrene takes water up to 100 masspercent. To prevent water suction the polystyrene
moulds were stored in water for one day before measurements. The underwater storage
saturated the polystyrene pores with water. It turned out that at the beginning of the
experiments, when the wet cement paste was soft, the conduction of the sonic signal through
the water-saturated polystyrene walls of the mould was much faster than through the sample.
This falsified the results of early measurements. To overcome this problem the mould was cut
into half between sender and receiver and both halves were mounted onto a dry polystyrene
board with a gap of approx. 1 mm. The gap decouples the two halves of the mould
acoustically. The cement paste was viscous enough not to leak through the gap. To protect the
probes, to improve the acoustic coupling and to ease the dismounting after tests, sender and
receiver were covered with vaseline. The distance between sender and receiver, variable
within 0 and 6 cm, was fixed for the tests at 2.5 cm. For this method standard wet paste
formulations as described in chapter 3.1 were used.
3.7 Heat Flux Calorimetry (HFC)
HFC measurements were performed by S. Hucko and M. Zwanzig at Hercules Inc. For the
calorimetric measurements on OPC the standard formulations as described in chapter 3.1
were used. About 4 g of the paste was filled in the specimen container and covered tightly.
The sample was inserted in the custom-made HFC and measurement started. Environmental
temperature during the whole period of hydration was 23°C. A disadvantage is that the
sample preparation between first water contact and first measurement takes several minutes.
Therefore the first three minutes of hydration cannot be observed. Tests were done to insert
dry powder into the HFC-measure cell and to start the measurement before water was
injected. But in all these tests the water did not mix with the powder properly. The slurries
were strongly inhomogeneous and the test results could not be reproduced. Pure phase
29
formulations were prepared similar to cement paste preparation. But due to the small sample
amount no electric stirrer could be used and the slurry was stirred by hand.
3.8 Adsorption Tests and Size Exclusion Chromatography (SEC)
To determine the amount of cellulose ethers adsorbed on mineral phases the CE-concentration
in the residual pore water was analysed by SEC in comparison to a CE-solution that has not
been in contact to mineral particles. The measurements were done by M. Dittel and the author
at Hercules Inc. using a HPLC Waters 2695 Separation Module in combination with a
Waters 410 Differential Diffractometer. The eluent was a 0.2 molar lithium acetate / acetic
acid buffer with a pH of 4.8.
The refractive index of the eluent-polymer solution is linearly proportional to the polymer
concentration. The advantage of the SEC is that it separates the CE from the inorganic ions,
which affect the refractive index as well. Furthermore it can be taken into account that
cellulose ethers have broad molecular weight distributions. The total CE-concentration in the
eluent solution is calculated as an integral over the eluation curve. The columns are filled with
a macroporous gel. The penetration of the polymers into the gel pores depends on pore and
molecule sizes [Lec1]. The total volume of the gel package in the column is the sum of pure
volume of the gel body, the inner volume Vi of the gel pores and the outer volume V0 between
the gel particles. The fluid floats through the accessible volume within the column with a
constant floatrate F = Ve/t. The eluation volume Ve of a material with a molecule size too big
to intrude into the pores, equals the outer volume V0:
Ve = V0 for large molecules
The molecular size exceeds the exclusion limit and the molecules move through the column
without retardation. Small molecules which have access to the whole pore volume passes the
column with an elution volume of
Ve = V0 + Vi for small molecules
Molecules with sizes in-between have access only to a fraction KD of the inner volume with
0 > KD > 1. Their elution volume is
Ve = V0 + KD Vi
The material parameter KD is the apparent distribution ratio of a material distributed in
solutant inside and outside of the gel pores. KD depends on the molecule size, gel pore
distribution, gel material, solutant, temperature and the configuration of the molecule. The
30
molecule leaves the column and reaches the detector after the time t = F Ve = F (V0 + KD Vi)
with KD as a function of the molecule size if all other parameters are constant. The higher the
molecular weight the shorter the migration time through the column.
The CE was predissolved in water respectively in saturated ion-solutions. The composition
of the saturated solutions depended on the solid phase to be investigated. To mimic pH
conditions similar to those in cement pore water, all experiments with pure phases were
performed in Ca(OH)2-saturated solution. Since this solution was sensitive to atmospheric
carbon dioxide, measures had to be taken to avoid Ca-carbonate precipitation. Therefore the
water used to prepare the solution was deionized and boiled to remove dissolved CO2. The
Ca-oxide to be dissolved in the water was fired at temperatures above 1000 °C to decarbonize.
Water and CaO cooled down over-night under a nitrogen gas stream. The calcium oxide was
dissolved in the prepared water with excess solid CaO respectively precipitated Ca(OH)2 to
achieve saturation. The thin slurry was afterwards filtered under nitrogen overpressure to
remove the solid and to produce a clear, saturated solution. The micropore filter had a pore
size of 12 µm. Other solid phases were added to this solution in order to achieve saturation
with respect to the phase of interest. This suspension was stirred for 30 minutes. After each
addition of solids the solution was filtered again as described before. Cellulose ethers were
dissolved in the prepared solutions prior to experiments.
The CE-concentration and the water/solid ratio depended on the mineral phase to be
investigated and its specific surface area. The amount of CE relative to the solid phase must
exceed the maximum amount that could be adsorbed. Otherwise there would be no residual
CE left in the pore water to be analysed. On the other hand the excess amount must be small
enough so that the difference of CE-concentrations in the primary solution and the residual
pore water was distinct enough to be quantified accurately. The water ratio depended on the
water-demand of the slurry. The consistency of the slurry must be thin enough to enable a
sharp separation between fluid and solid phase. The water demand was primarily a function of
the specific surface area of the powder sample. The larger the specific surface area, the higher
the water-demand. The adsorption experiments could be divided into two types:
1. stable conditions under which the mineral phase did not change and dissolution and
crystallization effects did not play a role. These tests were done with the pure hydrated phases
portlandite, ettringite and gypsum in saturated solutions under a nitrogen atmosphere. The
solutions had to be ion-saturated with respect to the investigated phase to avoid dissolution of
the solid. The cellulose ethers were dissolved in these solutions prior to adsorption
experiments.
31
2. dynamic conditions under which hydration processes took place during the experiments.
Those experiments were done with ordinary Portland cement, pure C3S, pure C3A and a
mixture of 70 mass-% C3A, 15 mass-% calcium sulphate hemi-hydrate and 15 mass-%
calcium sulphate. For the dynamic experiments unprepared tap water was used. The cellulose
ethers were dissolved in water prior to experiments. No efforts have been made to saturate the
solution in aspect of the investigated phases in dynamic experiments because dissolution of
the primary phases takes place during hydration anyway. Even no Ca-hydroxide was
dissolved in the solution before the experiment started. In OPC and C3S solutions Ca(OH)2-
saturation is quickly achieved.
Dynamic conditions only allowed relative statements on CE-adsorption. It could only be
said how much of the cellulose ether has been adsorbed in masspercent of the original CE
dissolved in the solution. It allowed to compare the adsorption behaviour of different CE-
types and to monitor the adsorption over time. But the amount of CE adsorbed per square
meter of the mineral surface could not be quantified since the specific surface area changed
during the hydration process. Inaccuracy was also caused by the amount of water consumed
in the hydration process. This amount was not determined but it is assumed that it is
approximately the same in all experiments with the same mineral phases but different
CE-types. Furthermore in dynamic experiments it could not be differentiated between CE
adsorbed on the mineral surfaces and CE that might have been incorporated as inclusion into
growing crystals.
Under stable conditions the amount of cellulose ether adsorbed per square meter of the
mineral phase could be quantified since the specific surface area of the mineral could be
determined prior to experiment. The stable experiments have been performed with single pure
phases only. The BET-value of the gypsum of 0.2 m²/g was too small for quantitative
adsorption tests. The gypsum was therefore triturated until the specific surface area achieved a
value of 1.7 m²/g.
First the cellulose ether was dissolved in the particular solutions. A small part of the
solutions was kept as reference sample. The rest was added to the mineral powder with a
defined liquid/solid ratio. After certain time intervals a part of the slurry was taken and put
into a centrifuge. Using a Heraeus BioFuge the slurries were centrifuged at 19,000 g for
30 minutes to divide the fluid from the solid phase. The reference CE-solution was also
centrifuged for comparison. All solutions were passed through a 5µm-filter to remove micro-
particles. The pore water and the original CE-solution were then analysed by SEC. The
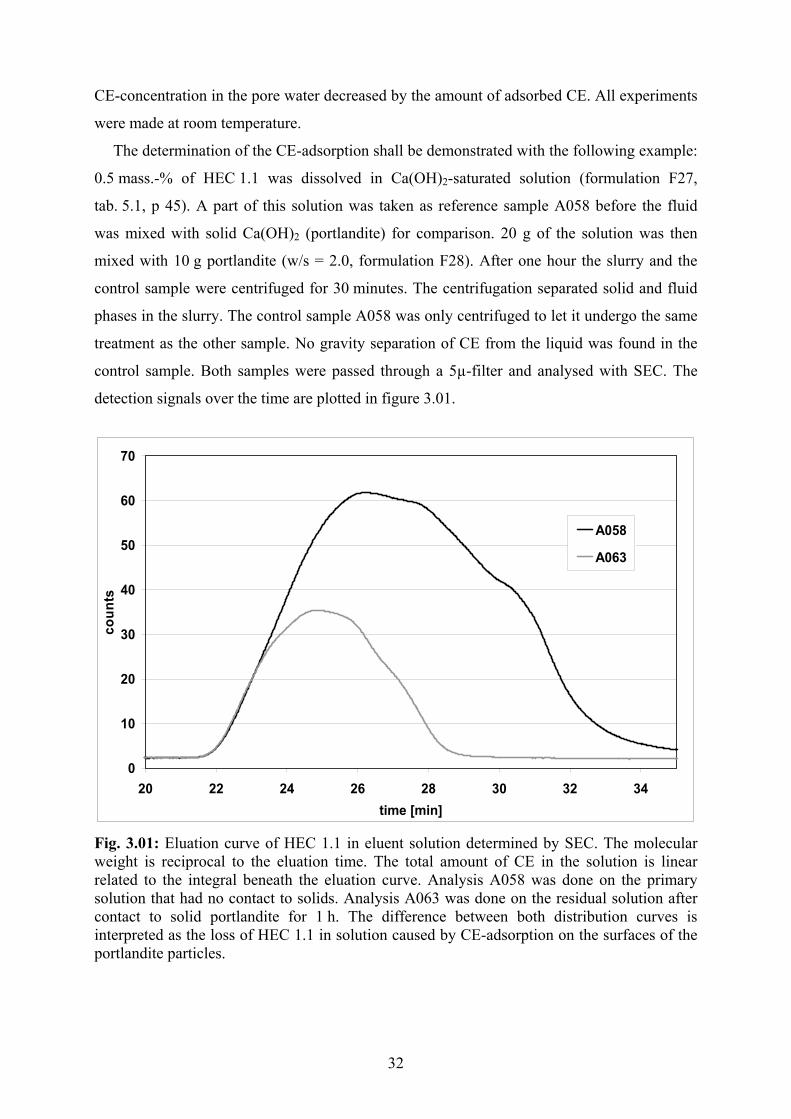
32
CE-concentration in the pore water decreased by the amount of adsorbed CE. All experiments
were made at room temperature.
The determination of the CE-adsorption shall be demonstrated with the following example:
0.5 mass.-% of HEC 1.1 was dissolved in Ca(OH)2-saturated solution (formulation F27,
tab. 5.1, p 45). A part of this solution was taken as reference sample A058 before the fluid
was mixed with solid Ca(OH)2 (portlandite) for comparison. 20 g of the solution was then
mixed with 10 g portlandite (w/s = 2.0, formulation F28). After one hour the slurry and the
control sample were centrifuged for 30 minutes. The centrifugation separated solid and fluid
phases in the slurry. The control sample A058 was only centrifuged to let it undergo the same
treatment as the other sample. No gravity separation of CE from the liquid was found in the
control sample. Both samples were passed through a 5µ-filter and analysed with SEC. The
detection signals over the time are plotted in figure 3.01.
0
10
20
30
40
50
60
70
20 22 24 26 28 30 32 34time [min]
coun
ts
A058
A063
Fig. 3.01: Eluation curve of HEC 1.1 in eluent solution determined by SEC. The molecular weight is reciprocal to the eluation time. The total amount of CE in the solution is linear related to the integral beneath the eluation curve. Analysis A058 was done on the primary solution that had no contact to solids. Analysis A063 was done on the residual solution after contact to solid portlandite for 1 h. The difference between both distribution curves is interpreted as the loss of HEC 1.1 in solution caused by CE-adsorption on the surfaces of the portlandite particles.
33
The integration of the distribution curve of A058 returned a value of 24 985 012 counts in
total. This value corresponded with a CE-concentration of 0.5 mass-% in aqueous solution
since that had been the original addition rate. The distribution curve of the residual solution
A063 extracted from the portlandite slurry showed an integrated value of 8 287 581 counts in
total. Since the detector signal is a linear function of the polymer concentration the residual
CE-content of the pore solution of sample A063 was:
[CE] = 0.5 mass-% x 8 287 581 / 24 985 012 = 0.166 mass-%
That means that approx. 67 % of the initial amount of CE was adsorbed on portlandite. 20 g
of a 0.5%-solution of HEC 1.1 were added to 10 g of portlandite, i.e. 0.01 g HEC 1.1 per 1 g
portlandite. 67 mass-% of HEC 1.1 was adsorbed, that equals 0.0067 g HEC 1.1 on 1 g
portlandite. The specific surface area of portlandite was determined prior to adsorption
experiments by BET with 14.9 m²/g. The amount of HEC adsorbed per square meter of
portlandite surface is:
0.0067 g / (1g x 14.9 m²/g) = 450 µg/m²
Results will be presented in detail in chapter 5.1. Due to technical problems the detector was
not calibrated. Therefore the signal-time curve could not be correlated with a certain
molecular weight distribution in absolute figures. Nonetheless a comparison between two
different distribution curves was possible.
3.9 Powder Diffraction
Standard laboratory and synchrotron X-ray powder diffraction was used to determine the
phase composition of mineral mixtures and to monitor the phase development in hydration
processes. The monitoring of phase development was supplemented by neutron powder
diffraction. Each method needed its own sample treatment. Except for the latest synchrotron
experiments which will be described later all formulations were mixed as described in
chapter 3.1.
3.9.1 Laboratory X-Ray Powder Diffraction
Due to its long measuring time (approx. 45 min.) the standard X-ray diffractometry was not
suitable for in-situ measurements. Therefore the hydration process of the samples stored in
controlled climate (23 °C, 50% rel. humidity) had to be stopped before measurements. For
this purpose small portions of the sample, prepared as described in chapter 3.1, were taken
after certain time intervals and were triturated in acetone. Thereafter the portion was washed
34
in acetone and vacuum filtered. The acetone removed the water and the hydration processes
stopped. The filter residual dried rapidly in the applied vacuum. Triturating, washing and
filtering took five minutes per sample. Before the sample was measured it was triturated a
second time to produce a fine powder. The X-ray measurements were done with a Panalytical
(former Philips) X´pert PW3040 diffractometer at the Institute of Mineralogy of the
University of Muenster. This diffractometer uses Cu-Kα radiation (λ = 1.54184 Å) and has a
powder diffractometer geometry as described by Azaroff [Aza1]. The peak-intensities were
calculated using the X´pert software. Standard laboratory X-ray diffractometry was performed
on OPC with various CE-types only.
3.9.2 Synchrotron X-Ray Powder Diffraction
In-situ XRD-measurements were performed at the Material Science Beamline [Pat1] of the
Swiss Light Source (SLS) at the Paul Scherrer Institute in Villigen/CH for phase-resolved
monitoring of the hydration process. The X-radiation of a synchrotron is produced by
accelerated high-energy electrons. At the SLS those electrons are produced in the following
way: An electron gun emits an electron beam into a linear accelerator (Linac) where the
electrons are accelerated up to an energy of 100 MeV. Then they are injected into the booster
synchrotron (accelerator ring) where their energy is increased up to a final level of 2.5GeV.
From there the electrons are injected into the storage ring where they circulate at nearly the
speed of light.
Although the electrons circulate in high vacuum (< 10-13 bar) there is a final probability to
collide with atoms of the residual gas. In a conventional synchrotron this electron loss results
in a half-life period of the beam of approx. 10 hours. At least once a day the ring has to be
refilled. The variation of the electron beam intensity results in changing intensities of the
electromagnetic radiation generated at the beamlines. As a consequence the thermal load of
the optical components of the beamlines varies, too. To keep a well focused and monochrome
beam those optical components has to be readjusted frequently. This problem has been solved
for the SLS by the "top-up injection" where all few minutes the electron beam loss is
compensated without stopping running experiments. Thus the electron flow is nearly constant
and the half-life time has no effects on the experiments.
The electrons are forced into a circular path. Accelerated or retarded (negative
acceleration) particles radiate. In case of a circular motion the acceleration is perpendicular to
the path. Charged particles that move nearly at light velocity radiate into a narrow cone
tangential to the particle´s path [Ger1]. The wavelength (energy) spectrum of the radiation
35
depends on the velocity of the electrons and the radius of curvature. The radiation intensity
depends on the electron current. Electrons can also be forced to move on sinus-shaped tracks
by insertion devices (wigglers). They consist of a parallel stacking of small magnets (typically
a few mm to cm wide) oriented radially and with alternating magnetization. Depending on the
radius of curvature, radiation of any wavelength can be generated.
The Material Science Beamline set-up is described by Gozzo, Schmitt et al. [Goz1]. The
minigap wiggler of this end station is designed to deliver highly intense hard X-rays with
energies from 5 to 40 keV. Behind focusing X-ray optics, a two-crystal monochromator and a
set of filters, three different experimental stations are placed in line but only one can be used
per session. The diffractometer in second position (fig. A.03, appendix A.1) is equipped with
a high-resolution multi-crystal analyser detector and for time-resolved measurements with a
multistrip detector (Mythen detector, fig. A.04, appendix A.1). The multistrip detector was
designed by B. Schmitt [Goz1] and consists of 12 modules, each with 1280 channels
(> 15.000 channels in total) covering an angle range of 60°. Between the modules are small
blind gaps. The channels are distributed equidistantly on the modules but the gaps may vary
in size from module to module. The accurate angle position of each module was measured by
moving the modules into the primary X-ray beam with strongly reduced intensity at
diffractometer position zero. The zero position was indicated by the intensity maximum of the
primary beam. Turning the detector back into its destined position the turning angle was
measured at the high precision motor that turned the detector.
The primary X-ray beam was focused as a strip focus into the centre of the diffractometer
circle where the sample carrier was mounted. The strip focus had a width of 1.2 mm (slightly
broader than the glass capillary diameter dS = 1mm) and a length parallel to the capillary of
lF = 10 mm. The observed sample volume was VS = π (dS / 2)2 lF = 7.85 mm². The correct
position of the focus was checked by an X-ray camera in diffractometer angle position zero.
The camera produced an image of the primary X-ray beam after passing through the sample.
Camera and reduction filters were removed and a primary beam stopper was inserted behind
the sample before the experiments started.
The analytical equipment is located in a hut which walls limit a restricted safety area. No
person is allowed to stay in the restricted area during experiments. After mounting the sample
this restricted area must be checked for persons left in the hut. The safety status must then be
stated in an electronic safety system before the shutter of the primary beam can be released.
This procedure takes about 30 seconds for experienced personal. This has to be taken into
account in time-sensitive experiments.
36
The samples were freshly mixed at the beamline in the same way as described in chapter 3.1.
Directly after stirring the wet paste was sucked into a glass capillary with a diameter of 1 mm
and a wall thickness of 0.01 mm. The capillary was sealed at both ends with wax to prevent
drying during measurements. The capillary was mounted (glued) into a brass cylinder which
itself was mounted and centred on the goniometerhead of the powder diffractometer. With a
little experience mixing, filling, mounting and centration took 60 seconds. Another
30 seconds were used to mount the goniometerhead into the diffractometer, to save and lock
the restricted beamline area and to start the measurements.
In the latest experiments at the SLS efforts were made to shorten the initial dead time (time
between water contact and first data received) from 90 sec. down to zero. Therefore dry
cement or pure phase admixtures were filled into the capillary up to the cone-shaped widening
near the open end. Efforts had to be taken that the package of the particles in the capillary is
dense enough so that no compression by later water pressure occurred. This would have
moved the sample partly out of the beam area during the measurements. The upper-most part
of the capillary was filled with coarse silica sand. By partly melting the glass, the capillary
shrank thermally onto the sand grains and fixed them (fig. A.02, appendix A.1). Care had to
be taken that the capillary was not completely sealed by welding. Before the capillary was
mounted into a brass sample carrier equipped with a water-inlet, the bottom of the capillary
had been broken open.
Next the brass piece with the capillary was mounted and centred on the goniometerhead
before water contact. The water-inlet of the brass piece was connected by a flexible rubber
hose to a medical syringe filled with fluid. The syringe was mounted onto a remote controlled
step drive that pushed the piston of the syringe. After mounting the whole assembly to the
diffractometer (fig. A.05, appendix A.1) and locking the restricted area the measurements
were started prior to water injection. Water was injected until drops appeared at the open end
of the capillary. The air that had filled the voids between particles was pressed through the
sand package during water injection while the mineral powder was stopped by the sand. The
sample was observed during the full experiments by the means of a standard video camera
and monitor system. During the measurements the capillary stayed in contact with the water
reservoir in the syringe. The goniometerhead usually spins around an axis through the centre
of the glass capillary for better statistics and to counterbalance texture effects. This rotation
had to be replaced by oscillation of approx. 120° to prevent the rubber hose to wrap around
the glass capillary.

37
Water injection experiments were done on OPC and a pure phase mixture of 70 mass-% C3A,
15 mass-% C s H0.5, and 15 mass-% C s . In these experiments it was impossible to dry-blend
the mineral powder with CE homogenously. Due to the small sample size of approx. 8 mm³ a
homogenous mixture with only a few solid CE particles (0.5 mass-% on mineral phase
admixture) could not be prepared. It was tried to dissolve the CE prior to experiments in the
water to be injected. But the injection device did not resist the high pressure necessary to
pump the viscous CE-solution through the cement-filled capillary. Instead experiments were
performed using tap water respectively Ca(OH)2-saturated solution in order to investigate
early hydration processes in dependence of pH-level and Ca2+-ion concentration in the pore
water.
All experiments were done with radiation energy of 11.9 keV resulting in a wavelength of
0.104014 nm (1.04014 Å). Rietveld analyses [Rie1, You1] were made for the XRD data. For that
the Siroquant Quantitative XRD Software by Sietronics [Sie1] was used. The software includes
a data set of cement phases. All calculations were done on the basis of the data sets of the
following phases: cubic C3A, monoclinic C3S polymorph M1, β-C2S, C4AF, ettringite,
gypsum and portlandite. Due to the complexity of the phase compositions observed no efforts
have been made to determine the amount of X-ray amorphous phases. An inner standard was
not added to the sample because it could not be excluded that either important peaks of the
cement phases would be overlain by those of the standard or that the standard interacts with
the cement or with the cellulose ether. Fundamentals on Rietveld analysis are given by
Taylor [Tay2].
3.9.3 Thermal Neutron Powder Diffraction
Samples were mixed and stirred at the beamline in the same way as described in chapter 3.1.
But instead of water, di-deuterium monoxide (D2O, heavy water) was used. After stirring, the
paste was filled into an aluminium cylinder with open ends. Two open ends made it easier to
fill the cylinder with the viscous paste. The size of the cylinder is 7 cm in length, 1 cm for the
inner diameter and 0.1 mm thickness of the Al-wall. One end was equipped with an enforced
bottom and an inner thread in which a double-sided screw could be mounted to close this end
and to connect the cylinder to the sample carrier of the diffractometer (fig. A.06,
appendix A.1). The other end was sealed by a cadmium-lid to prevent drying. During the
measurement the bottom of the cylinder together with the mounting screw was wrapped in a
cadmium panel to avoid disturbing reflections from the screw. Cadmium is not transparent for
thermal neutrons.
38
The measurements were done at the HRPT beamline of the SINQ neutron source at the
Paul Scherrer Institute. The diffractometer has the same geometry as the one of the SLS but
with larger diffractometer circle (fig. A.07, appendix A.1). The HRPT-diffractometer is
equipped with a multi-channel detector covering 160° with 1200 channels. Between sample
and detector radial-oriented Soller slits focus the diffracted signal perpendicular onto the
detector to increase the spatial resolution.
The fundamentals of diffraction methods shall not be repeated here since X-ray diffraction
is a standard method of mineralogy. Details are given by Azaroff [Aza1]. But it should be
mentioned that neutron diffraction also follows the Bragg´s Law [Bra1]:
n λ = 2 d sin Θ
Electromagnetic waves are scattered by the electron shells of atoms and the denser the
distribution of heavy atoms in the crystal lattice, the higher the intensity of a diffracted signal.
In contrast to electromagnetic radiation, particle waves like neutron radiation are scattered by
atom cores. The closer the atom weight to the weight of the radiation particle, the better the
impulse transmission. Therefore neutron waves are best scattered by hydrogen since the
weight of a single proton is very close to that of a neutron. To reduce background radiation in
the diffraction spectra from the pore solution, heavy water was used. It is assumed that the
hydration products of cement phases incorporating D2O are chemically and physically
comparable to those hydrated in H2O. The peak positions in a neutron diffractometer
spectrum are the same as in that of X-ray diffraction based on the lattice spacing d. But the
relative peak intensities differs significantly.
At the SINQ neutron source at the PSI first protons are accelerated in a cyclotron. A part of
the protons are shot onto a lead target. The proton bombardment releases neutrons from the
Pb-atom cores. The neutrons leave the atomic formation with high speed. The neutron beams
are used for high and low speed radiation. For low speed (thermal) the neutrons are retarded
by passing a tank with D2O. These thermal neutrons are used for neutron powder
diffractometry. The generated neutron radiation has a wavelength of λ = 1.8857 Å.
The experimental work at the HRPT beamline was assisted by M. Zwanzig (Hercules Inc.)
who at that time was involved in studies at the Heinrich-Hertz-Berufskolleg, a vocational
school in Duesseldorf. He and his colleagues from the school took use of the experimental
work for an apprenticeship project. A report was written for the Heinrich-Hertz-Berufskolleg [Zwa1].
39
3.10 Environmental Scanning Electron Microscopy - Field Emission Gun (ESEM-FEG)
At the VDZ Duesseldorf (German Institute of Cement Research) cement pastes with and
without CE were investigated in-situ with respect to their hydration behaviour using ESEM in
combination with a field emission gun (FEG). The VDZ is equipped with a Philips ESEM
XL30 FEG. In contrast to an ordinary scanning electron microscope the ESEM-FEG does not
require high vacuum. It was possible to investigate the wet system in-situ since the low-
pressure atmosphere is saturated with humidity. During the measurements the samples were
exposed to environmental conditions of 5 °C and 4 Torr. Moreover, it was not necessary to
sputter the sample for conductivity. So it was possible to observe the surface of the material
directly without disturbing coating layer. The cement pastes were prepared as described in
chapter 3.1. The images were recorded by K. Lipus, VDZ.
40
4. Material Characterization
4.1 Defined Portland Cement
The Portland clinker used in this project was ordered from HeidelbergCement AG as a
defined clinker produced on a laboratory scale. An X-ray fluorescence analysis (XRF) of this
cement is given in table 4.1. The phase composition of the milled and sulphate-blended
cement was determined by XRD and Rietveld analysis. One analysis was done at the X-Ray
Laboratory Dr. Ermrich, a second analysis was performed by the author based on the
synchrotron XRD data (table 4.2). In comparison both analysis showed a fairly good
correlation. A significant difference showed up in the silicate contents. Laboratory XRD was
done at a wavelength of λ = 1.54184 Å. The synchrotron radiation had a wavelength of
λ = 1.04014 Å. The higher energy led to a deteriorated spatial resolution of the synchrotron
XRD pattern because the diffraction angle decreases with increasing radiation energy as
described by Bragg´s law. Since most reflections of C3S and C2S superimpose each other, the
Rietveld analysis software had more difficulties to distinguish between those two phases. The
sum of C3S and C2S was in both analyses comparable. The software package was for both
analyses the same (Sietronics Siroquant 2.5). The difficulty to distinguish the calcium silicates
at high radiation energy is also discussed in chapter 5.2.4.
The clinker granules were milled together with 1.5 masspercent of calcium sulphate hemi-
hydrate, a stucco from Boergardts, and 1.5 masspercent α-anhydrite III from Sigma-Aldrich
(table 4.4). The milling grade should correspond to 4000 cm²/g Blaine. The particle size
distribution (PSD) determined by W. Hildebrandt is given in figure 4.01. The SV-value
calculated on PSD was 1.5 m²/cm³ and the pure density determined by He-pycnometry was
3.21 g/cm³ resulting in the geometric surface area of 0.465 m²/g (= 4650 cm²/g) which
roughly correlates with the Blaine value. BET delivered a specific surface area of 1.56 m²/g.
The ratio of geometric and BET-surface of 3.35 was rather small and comes from the
aberration of the real grain shape from the ideal sphere. It indicates that the surfaces of the
cement particles are rather smooth and that pores in micro- or nano-scale were not to be
expected. That means that the difference between the surface area determined by BET
(accessible for N2) and the surface area accessible for water and CE-molecules, is negligibly
small. According to its composition and quality the cement was classified as CEM I 42.5
ordinary Portland cement. The Ca-sulphate hemi-hydrate from Boergardts was a plaster of
Paris with industrial quality. Its composition was determined by differential thermo-
gravimetry (DTG) by W. Hildebrandt (tab. 4.3).
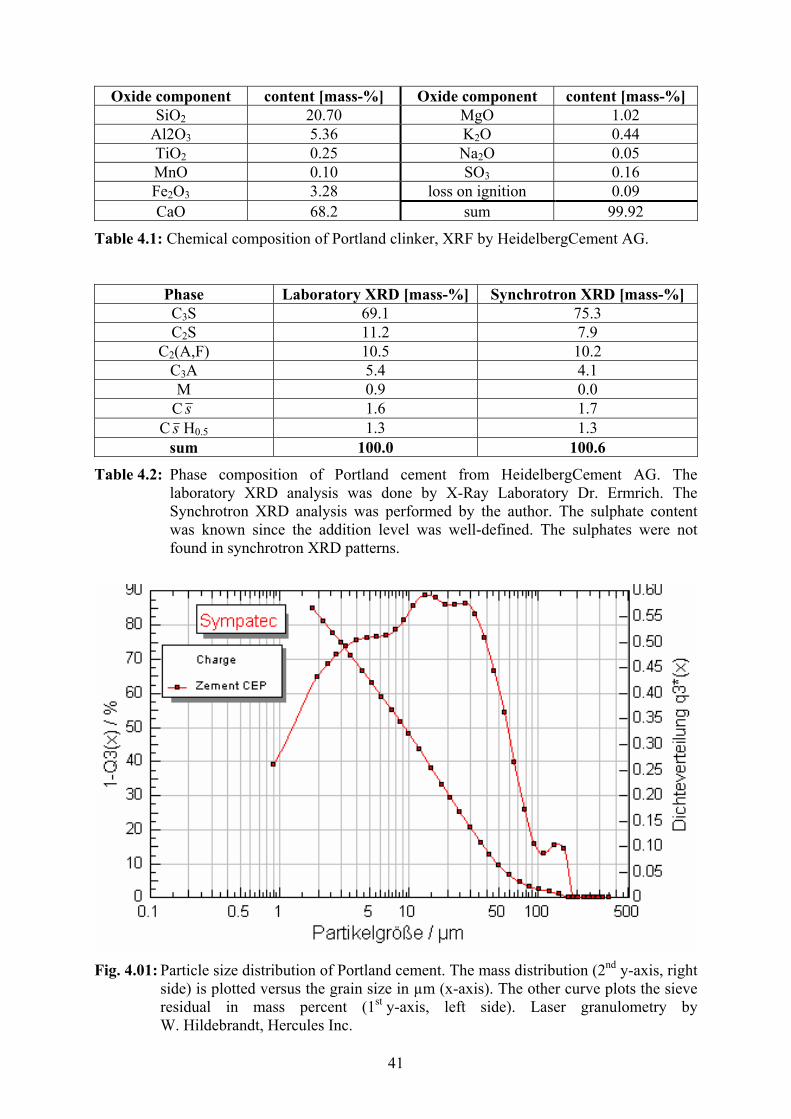
41
Oxide component content [mass-%] Oxide component content [mass-%] SiO2 20.70 MgO 1.02
Al2O3 5.36 K2O 0.44 TiO2 0.25 Na2O 0.05 MnO 0.10 SO3 0.16 Fe2O3 3.28 loss on ignition 0.09 CaO 68.2 sum 99.92
Table 4.1: Chemical composition of Portland clinker, XRF by HeidelbergCement AG.
Phase Laboratory XRD [mass-%] Synchrotron XRD [mass-%] C3S 69.1 75.3 C2S 11.2 7.9
C2(A,F) 10.5 10.2 C3A 5.4 4.1 M 0.9 0.0
C s 1.6 1.7 C s H0.5 1.3 1.3
sum 100.0 100.6
Table 4.2: Phase composition of Portland cement from HeidelbergCement AG. The laboratory XRD analysis was done by X-Ray Laboratory Dr. Ermrich. The Synchrotron XRD analysis was performed by the author. The sulphate content was known since the addition level was well-defined. The sulphates were not found in synchrotron XRD patterns.
Fig. 4.01: Particle size distribution of Portland cement. The mass distribution (2nd y-axis, right
side) is plotted versus the grain size in µm (x-axis). The other curve plots the sieve residual in mass percent (1st y-axis, left side). Laser granulometry by W. Hildebrandt, Hercules Inc.
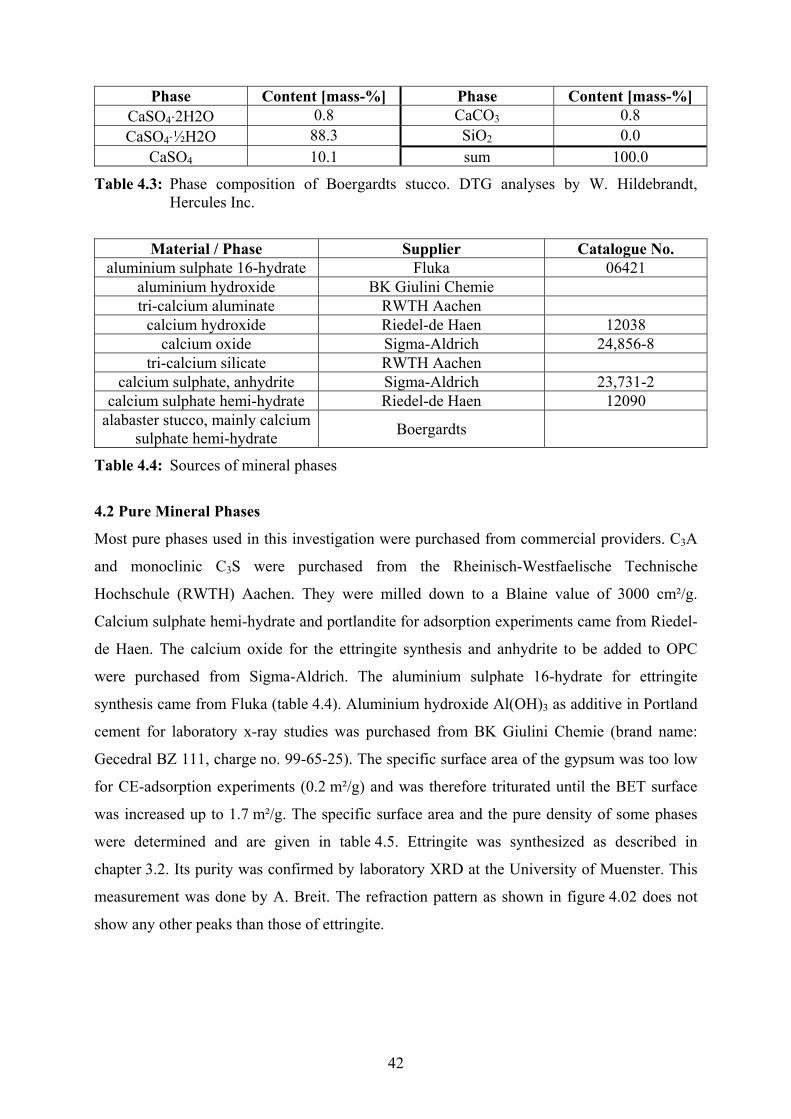
42
Phase Content [mass-%] Phase Content [mass-%] CaSO4⋅2H2O 0.8 CaCO3 0.8 CaSO4⋅½H2O 88.3 SiO2 0.0
CaSO4 10.1 sum 100.0
Table 4.3: Phase composition of Boergardts stucco. DTG analyses by W. Hildebrandt, Hercules Inc.
Material / Phase Supplier Catalogue No. aluminium sulphate 16-hydrate Fluka 06421
aluminium hydroxide BK Giulini Chemie tri-calcium aluminate RWTH Aachen
calcium hydroxide Riedel-de Haen 12038 calcium oxide Sigma-Aldrich 24,856-8
tri-calcium silicate RWTH Aachen calcium sulphate, anhydrite Sigma-Aldrich 23,731-2
calcium sulphate hemi-hydrate Riedel-de Haen 12090 alabaster stucco, mainly calcium
sulphate hemi-hydrate Boergardts
Table 4.4: Sources of mineral phases
4.2 Pure Mineral Phases
Most pure phases used in this investigation were purchased from commercial providers. C3A
and monoclinic C3S were purchased from the Rheinisch-Westfaelische Technische
Hochschule (RWTH) Aachen. They were milled down to a Blaine value of 3000 cm²/g.
Calcium sulphate hemi-hydrate and portlandite for adsorption experiments came from Riedel-
de Haen. The calcium oxide for the ettringite synthesis and anhydrite to be added to OPC
were purchased from Sigma-Aldrich. The aluminium sulphate 16-hydrate for ettringite
synthesis came from Fluka (table 4.4). Aluminium hydroxide Al(OH)3 as additive in Portland
cement for laboratory x-ray studies was purchased from BK Giulini Chemie (brand name:
Gecedral BZ 111, charge no. 99-65-25). The specific surface area of the gypsum was too low
for CE-adsorption experiments (0.2 m²/g) and was therefore triturated until the BET surface
was increased up to 1.7 m²/g. The specific surface area and the pure density of some phases
were determined and are given in table 4.5. Ettringite was synthesized as described in
chapter 3.2. Its purity was confirmed by laboratory XRD at the University of Muenster. This
measurement was done by A. Breit. The refraction pattern as shown in figure 4.02 does not
show any other peaks than those of ettringite.
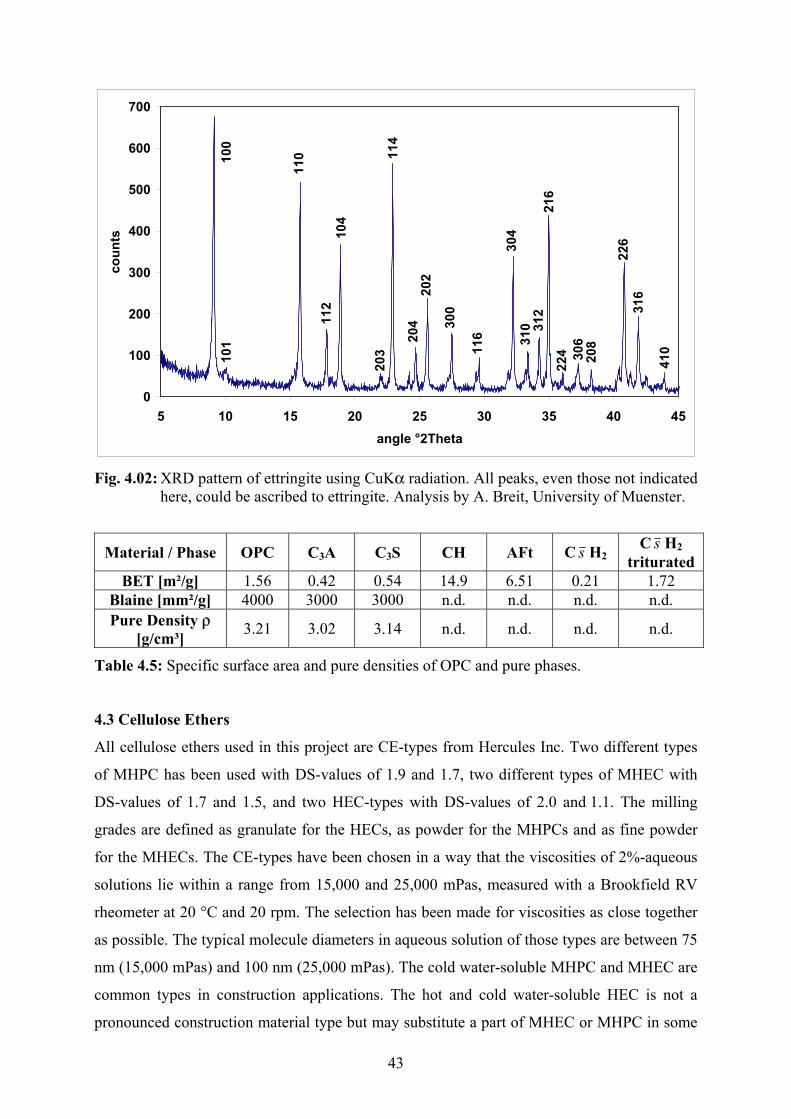
43
0
100
200
300
400
500
600
700
5 10 15 20 25 30 35 40 45angle °2Theta
coun
ts
100
101
110
112
104
114
203
204
202
300
116
304
310 31
221
622
4 306
208
226
316
410
Fig. 4.02: XRD pattern of ettringite using CuKα radiation. All peaks, even those not indicated here, could be ascribed to ettringite. Analysis by A. Breit, University of Muenster.
Material / Phase OPC C3A C3S CH AFt C s H2 C s H2
triturated BET [m²/g] 1.56 0.42 0.54 14.9 6.51 0.21 1.72
Blaine [mm²/g] 4000 3000 3000 n.d. n.d. n.d. n.d. Pure Density ρ
[g/cm³] 3.21 3.02 3.14 n.d. n.d. n.d. n.d.
Table 4.5: Specific surface area and pure densities of OPC and pure phases.
4.3 Cellulose Ethers
All cellulose ethers used in this project are CE-types from Hercules Inc. Two different types
of MHPC has been used with DS-values of 1.9 and 1.7, two different types of MHEC with
DS-values of 1.7 and 1.5, and two HEC-types with DS-values of 2.0 and 1.1. The milling
grades are defined as granulate for the HECs, as powder for the MHPCs and as fine powder
for the MHECs. The CE-types have been chosen in a way that the viscosities of 2%-aqueous
solutions lie within a range from 15,000 and 25,000 mPas, measured with a Brookfield RV
rheometer at 20 °C and 20 rpm. The selection has been made for viscosities as close together
as possible. The typical molecule diameters in aqueous solution of those types are between 75
nm (15,000 mPas) and 100 nm (25,000 mPas). The cold water-soluble MHPC and MHEC are
common types in construction applications. The hot and cold water-soluble HEC is not a
pronounced construction material type but may substitute a part of MHEC or MHPC in some

44
formulations. Detailed information on those CE-types such as substitution analysis and the
accurate trade name must not be disclosed on demand of Hercules Inc. In the following the
CE-types are named as follows: MHPC 1.9, MHPC 1.7, MHEC 1.7, MHEC 1.5, HEC 2.0 and
HEC 1.1. The numbers return the DS-values of those CE-types.
4.4 Cement and Pure Phase Admixtures
Standard cement wet paste formulation
As far as possible the compositions of wet pastes have been kept constant. In most cases
0.5 mass-% of cellulose ether was dry mixed with ordinary Portland cement or mineral pure
phase mixtures before adding water. The reference samples did not contain CE. The
water/solid ratio was 0.5. These standard wet paste formulations were used for ultrasonic
measurements, heat calorimetry (partly), XRD (lab and synchrotron) and neutron diffraction
(D2O instead of H2O). If not described otherwise untreated tap water was used. The wet
pastes were prepared as described in chapter 3.1.
Heat flux calorimetry
Beside the standard cement wet paste, pure C3S and a mixture of 70 mass-% C3A, 15 mass-%
bassanite and 15 mass-% anhydrite were used. The CE addition level on dry powder was
0.5 mass-%. The water/solid ratio for the C3S could be kept comparable to OPC (w/s = 0.5).
The aluminate/sulphate mixture had a higher water demand of w/s = 0.8.
Adsorption experiments
The formulations for that method had the broadest variety. This was necessary because the
liquid/CE/mineral phase ratios had to be adjusted to the specific surface area of the
investigated mineral phase. A list of those formulations is given in table 5.1. The reference
samples for these tests were CE-solutions that had no contact to mineral phases.
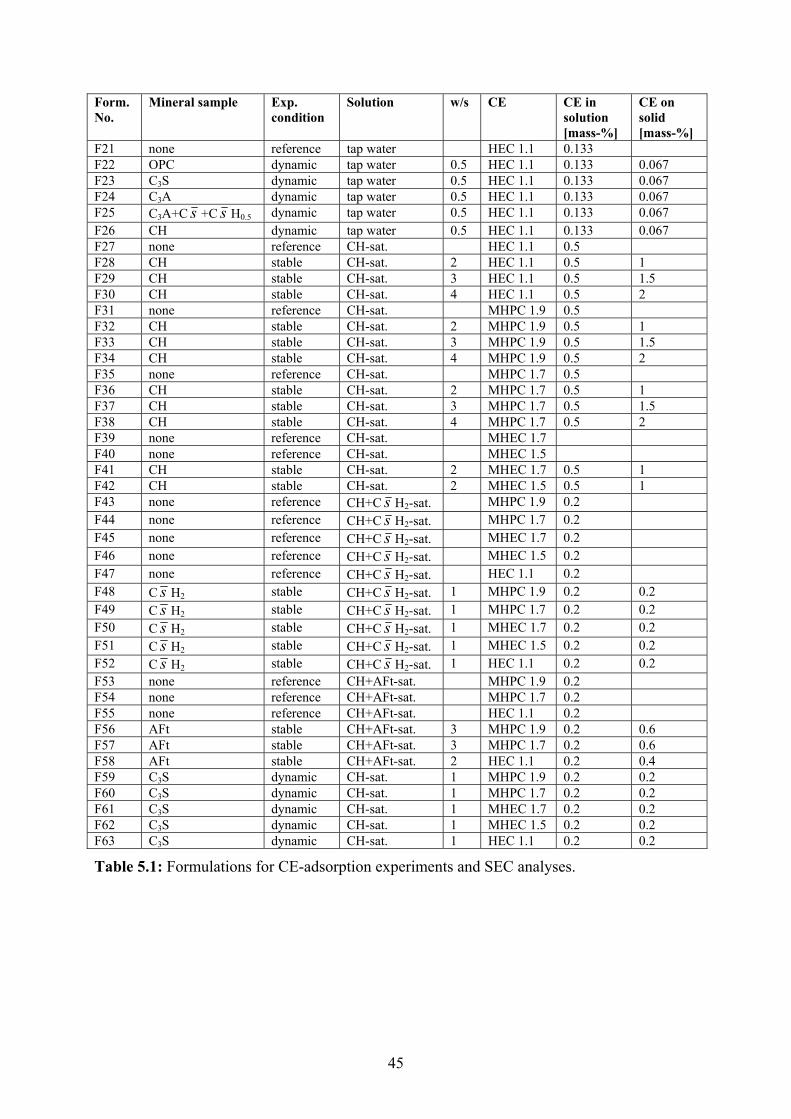
45
Form. No.
Mineral sample Exp. condition
Solution w/s CE CE in solution [mass-%]
CE on solid [mass-%]
F21 none reference tap water HEC 1.1 0.133 F22 OPC dynamic tap water 0.5 HEC 1.1 0.133 0.067 F23 C3S dynamic tap water 0.5 HEC 1.1 0.133 0.067 F24 C3A dynamic tap water 0.5 HEC 1.1 0.133 0.067 F25 C3A+C s +C s H0.5 dynamic tap water 0.5 HEC 1.1 0.133 0.067 F26 CH dynamic tap water 0.5 HEC 1.1 0.133 0.067 F27 none reference CH-sat. HEC 1.1 0.5 F28 CH stable CH-sat. 2 HEC 1.1 0.5 1 F29 CH stable CH-sat. 3 HEC 1.1 0.5 1.5 F30 CH stable CH-sat. 4 HEC 1.1 0.5 2 F31 none reference CH-sat. MHPC 1.9 0.5 F32 CH stable CH-sat. 2 MHPC 1.9 0.5 1 F33 CH stable CH-sat. 3 MHPC 1.9 0.5 1.5 F34 CH stable CH-sat. 4 MHPC 1.9 0.5 2 F35 none reference CH-sat. MHPC 1.7 0.5 F36 CH stable CH-sat. 2 MHPC 1.7 0.5 1 F37 CH stable CH-sat. 3 MHPC 1.7 0.5 1.5 F38 CH stable CH-sat. 4 MHPC 1.7 0.5 2 F39 none reference CH-sat. MHEC 1.7 F40 none reference CH-sat. MHEC 1.5 F41 CH stable CH-sat. 2 MHEC 1.7 0.5 1 F42 CH stable CH-sat. 2 MHEC 1.5 0.5 1 F43 none reference CH+C s H2-sat. MHPC 1.9 0.2 F44 none reference CH+C s H2-sat. MHPC 1.7 0.2 F45 none reference CH+C s H2-sat. MHEC 1.7 0.2 F46 none reference CH+C s H2-sat. MHEC 1.5 0.2 F47 none reference CH+C s H2-sat. HEC 1.1 0.2 F48 C s H2 stable CH+C s H2-sat. 1 MHPC 1.9 0.2 0.2 F49 C s H2 stable CH+C s H2-sat. 1 MHPC 1.7 0.2 0.2 F50 C s H2 stable CH+C s H2-sat. 1 MHEC 1.7 0.2 0.2 F51 C s H2 stable CH+C s H2-sat. 1 MHEC 1.5 0.2 0.2 F52 C s H2 stable CH+C s H2-sat. 1 HEC 1.1 0.2 0.2 F53 none reference CH+AFt-sat. MHPC 1.9 0.2 F54 none reference CH+AFt-sat. MHPC 1.7 0.2 F55 none reference CH+AFt-sat. HEC 1.1 0.2 F56 AFt stable CH+AFt-sat. 3 MHPC 1.9 0.2 0.6 F57 AFt stable CH+AFt-sat. 3 MHPC 1.7 0.2 0.6 F58 AFt stable CH+AFt-sat. 2 HEC 1.1 0.2 0.4 F59 C3S dynamic CH-sat. 1 MHPC 1.9 0.2 0.2 F60 C3S dynamic CH-sat. 1 MHPC 1.7 0.2 0.2 F61 C3S dynamic CH-sat. 1 MHEC 1.7 0.2 0.2 F62 C3S dynamic CH-sat. 1 MHEC 1.5 0.2 0.2 F63 C3S dynamic CH-sat. 1 HEC 1.1 0.2 0.2
Table 5.1: Formulations for CE-adsorption experiments and SEC analyses.

46
5. Results
5.1 The Adsorption of Cellulose Ethers on Cement Phases
The adsorption of cellulose ether on crystal faces was measured in two different kinds of
experiments:
1. Under stable conditions the hydrated pure phases were in stable equilibrium with the
fluid phase. All solutions were Ca(OH)2-saturated to increase the pH-value as high as in
Portland cement pastes. To avoid dissolution of the solids all solutions were ion-saturated in
respect of the investigated phases. Cellulose ethers were predissolved in those ion-saturated
solutions. Under the assumption that changes in specific surface areas during the experiments
were negligibly small, the amount of adsorbed CE per area was calculated on the basis of
BET surface analyses of the pure phases. Since all investigated phases had specific surface
areas below 15 m²/g it can be assumed that the grain surfaces were rather smooth and no
micropores occurred. Thus the difference between measured surface areas accessible for
nitrogen and the surface accessible for CE molecules in aqueous solution is negligibly small.
2. In dynamic experiments active phases reacted with water to form several hydration
products. Since the actual specific surface area of the products could not be determined during
the experiments, only qualitative and comparative statements were made. The cellulose ethers
were predissolved in the water prior to experiments. The formulations used for the adsorption
tests are listed in table 5.1.
Formulation F27 (highly alkaline) was analysed after 24 hours and was compared to F21
(neutral) by SEC to check if low-DS cellulose ether (HEC 1.1) is stable in high alkaline
environment for this time. No differences between F21 and F27 were found. The higher the
DS the higher the resistance of CE against alkaline degradation. Since the low-DS type was
stable, the other types were stable, too. This result correlates with those of Pourchez [Pou2].
Dynamic experiments did not produce absolute values but they allowed a time-resolved
monitoring of CE-adsorption during hydration (fig. 5.01). Exposure times of solids to CE-
solution were 1, 4, 8 and 24 hours plus 30 minutes of centrifugation each. The dynamic
experiments were done with HEC 1.1 only. The reference formulation for all dynamic
experiments was F21. The adsorption of the HEC 1.1 on cement phases during the hydration
of OPC (formulation F22) increased with increasing hydration time. The OPC hydration took
place as described in chapter 2.5.3. The adsorption performance correlated with results of
pure C3S-hydration (F23), where the pure clinker phase reacted with water to CSH and CH.
Since the phase content changed in these experiments no statement can be given on which
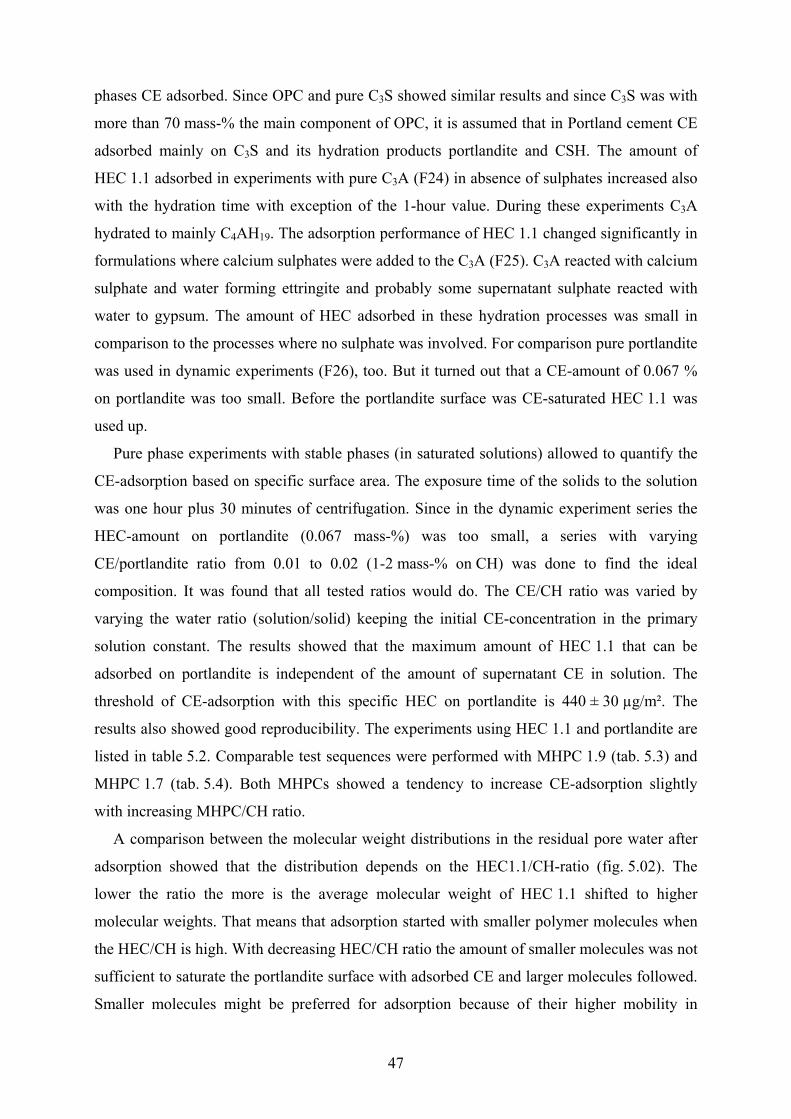
47
phases CE adsorbed. Since OPC and pure C3S showed similar results and since C3S was with
more than 70 mass-% the main component of OPC, it is assumed that in Portland cement CE
adsorbed mainly on C3S and its hydration products portlandite and CSH. The amount of
HEC 1.1 adsorbed in experiments with pure C3A (F24) in absence of sulphates increased also
with the hydration time with exception of the 1-hour value. During these experiments C3A
hydrated to mainly C4AH19. The adsorption performance of HEC 1.1 changed significantly in
formulations where calcium sulphates were added to the C3A (F25). C3A reacted with calcium
sulphate and water forming ettringite and probably some supernatant sulphate reacted with
water to gypsum. The amount of HEC adsorbed in these hydration processes was small in
comparison to the processes where no sulphate was involved. For comparison pure portlandite
was used in dynamic experiments (F26), too. But it turned out that a CE-amount of 0.067 %
on portlandite was too small. Before the portlandite surface was CE-saturated HEC 1.1 was
used up.
Pure phase experiments with stable phases (in saturated solutions) allowed to quantify the
CE-adsorption based on specific surface area. The exposure time of the solids to the solution
was one hour plus 30 minutes of centrifugation. Since in the dynamic experiment series the
HEC-amount on portlandite (0.067 mass-%) was too small, a series with varying
CE/portlandite ratio from 0.01 to 0.02 (1-2 mass-% on CH) was done to find the ideal
composition. It was found that all tested ratios would do. The CE/CH ratio was varied by
varying the water ratio (solution/solid) keeping the initial CE-concentration in the primary
solution constant. The results showed that the maximum amount of HEC 1.1 that can be
adsorbed on portlandite is independent of the amount of supernatant CE in solution. The
threshold of CE-adsorption with this specific HEC on portlandite is 440 ± 30 µg/m². The
results also showed good reproducibility. The experiments using HEC 1.1 and portlandite are
listed in table 5.2. Comparable test sequences were performed with MHPC 1.9 (tab. 5.3) and
MHPC 1.7 (tab. 5.4). Both MHPCs showed a tendency to increase CE-adsorption slightly
with increasing MHPC/CH ratio.
A comparison between the molecular weight distributions in the residual pore water after
adsorption showed that the distribution depends on the HEC1.1/CH-ratio (fig. 5.02). The
lower the ratio the more is the average molecular weight of HEC 1.1 shifted to higher
molecular weights. That means that adsorption started with smaller polymer molecules when
the HEC/CH is high. With decreasing HEC/CH ratio the amount of smaller molecules was not
sufficient to saturate the portlandite surface with adsorbed CE and larger molecules followed.
Smaller molecules might be preferred for adsorption because of their higher mobility in
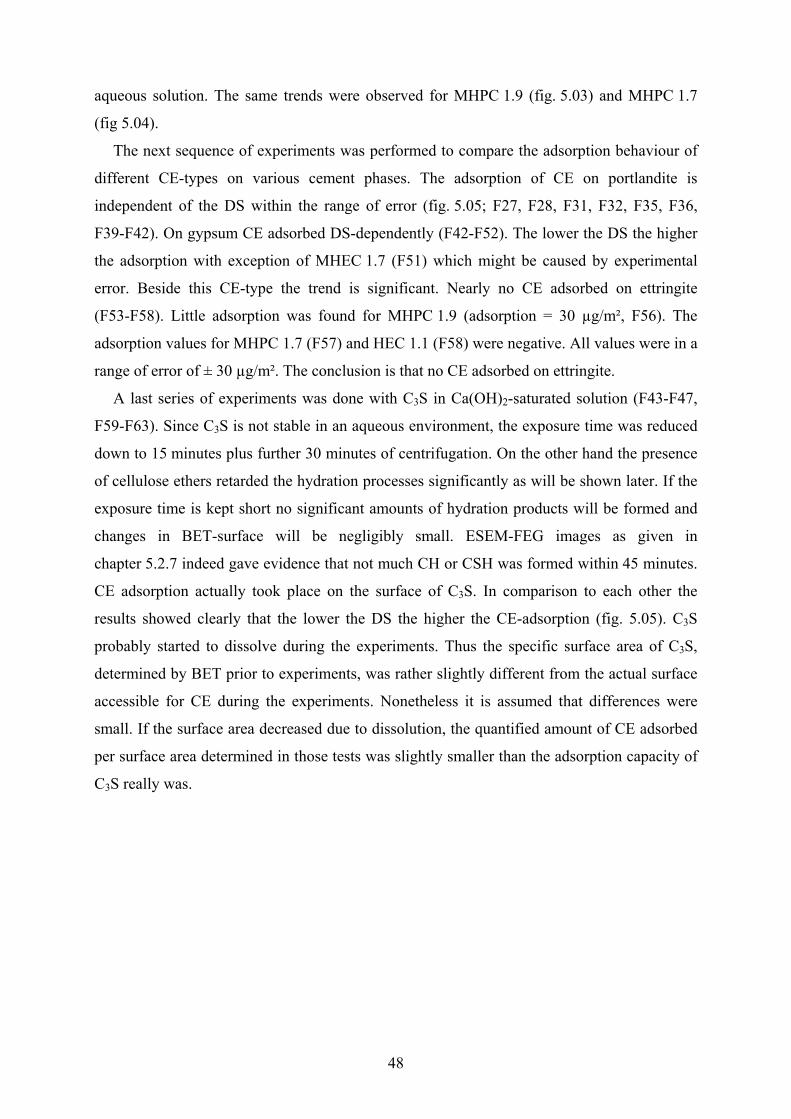
48
aqueous solution. The same trends were observed for MHPC 1.9 (fig. 5.03) and MHPC 1.7
(fig 5.04).
The next sequence of experiments was performed to compare the adsorption behaviour of
different CE-types on various cement phases. The adsorption of CE on portlandite is
independent of the DS within the range of error (fig. 5.05; F27, F28, F31, F32, F35, F36,
F39-F42). On gypsum CE adsorbed DS-dependently (F42-F52). The lower the DS the higher
the adsorption with exception of MHEC 1.7 (F51) which might be caused by experimental
error. Beside this CE-type the trend is significant. Nearly no CE adsorbed on ettringite
(F53-F58). Little adsorption was found for MHPC 1.9 (adsorption = 30 µg/m², F56). The
adsorption values for MHPC 1.7 (F57) and HEC 1.1 (F58) were negative. All values were in a
range of error of ± 30 µg/m². The conclusion is that no CE adsorbed on ettringite.
A last series of experiments was done with C3S in Ca(OH)2-saturated solution (F43-F47,
F59-F63). Since C3S is not stable in an aqueous environment, the exposure time was reduced
down to 15 minutes plus further 30 minutes of centrifugation. On the other hand the presence
of cellulose ethers retarded the hydration processes significantly as will be shown later. If the
exposure time is kept short no significant amounts of hydration products will be formed and
changes in BET-surface will be negligibly small. ESEM-FEG images as given in
chapter 5.2.7 indeed gave evidence that not much CH or CSH was formed within 45 minutes.
CE adsorption actually took place on the surface of C3S. In comparison to each other the
results showed clearly that the lower the DS the higher the CE-adsorption (fig. 5.05). C3S
probably started to dissolve during the experiments. Thus the specific surface area of C3S,
determined by BET prior to experiments, was rather slightly different from the actual surface
accessible for CE during the experiments. Nonetheless it is assumed that differences were
small. If the surface area decreased due to dissolution, the quantified amount of CE adsorbed
per surface area determined in those tests was slightly smaller than the adsorption capacity of
C3S really was.

49
0
20
40
60
80
100
OPC C3S C3A C3A +bassanite
rela
tive
adso
rptio
n [%
]
1h
4h
8h
24h
hydration time
Fig. 5.01: Relative adsorption rates of HEC 1.1 on different cement phases determined in
dynamic experiments.
Conclusions
• Cellulose ethers, even those with low DS, are stable in high alkaline environment over
24 hours.
• In dynamic hydration processes the amount of CE adsorbed on the surfaces of the solids
increases with progressing hydration time.
• Significant amounts of CE are adsorbed during C3A hydration in absence of sulphates.
• CE-adsorption during C3A hydration is strongly inhibited in the presence of sulphates.
• CE-adsorption on C3S is DS-specific: the lower the degree of substitution the stronger
the adsorption. C3S showed the highest CE-adsorption capacity of all investigated
phases.
• Significant amounts of CE adsorbs on portlandite DS-independently.
• CE-adsorption on gypsum is also DS-specific: the lower the DS the stronger the
adsorption. Significantly less CE adsorbs on gypsum than on C3S.
• No CE adsorbs on ettringite.
• Within the given molecular weight distribution of the CE in aqueous solution, the
molecular weight of the CE adsorbed on portlandite depends on the CE/CH ratio: The
smaller the CE/CH ratio the higher the molecular weight of the adsorbed CE molecules.
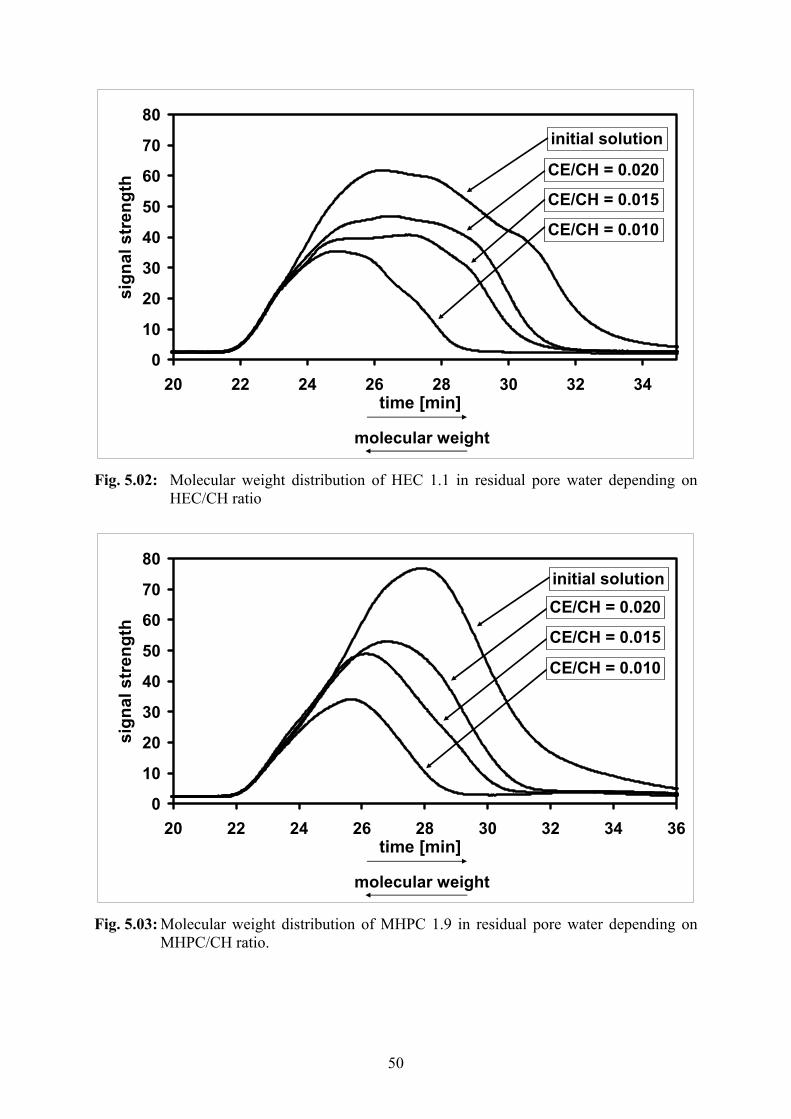
50
0
10
20
30
40
50
60
70
80
20 22 24 26 28 30 32 34time [min]
sign
al s
tren
gth
molecular weight
initial solution
CE/CH = 0.020
CE/CH = 0.015
CE/CH = 0.010
Fig. 5.02: Molecular weight distribution of HEC 1.1 in residual pore water depending on
HEC/CH ratio
0
10
20
30
40
50
60
70
80
20 22 24 26 28 30 32 34 36time [min]
sign
al s
tren
gth
molecular weight
CE/CH = 0.020initial solution
CE/CH = 0.015
CE/CH = 0.010
Fig. 5.03: Molecular weight distribution of MHPC 1.9 in residual pore water depending on
MHPC/CH ratio.
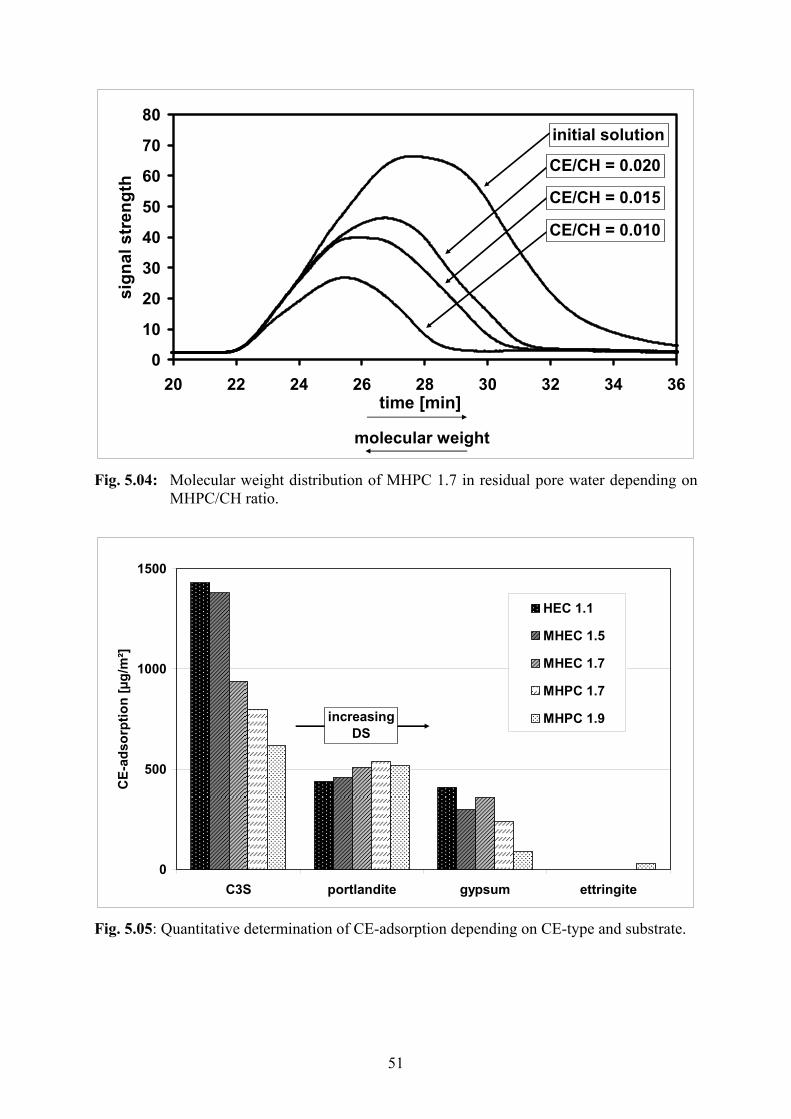
51
0
10
20
30
40
50
60
70
80
20 22 24 26 28 30 32 34 36time [min]
sign
al s
tren
gth
molecular weight
CE/CH = 0.020
initial solution
CE/CH = 0.015
CE/CH = 0.010
Fig. 5.04: Molecular weight distribution of MHPC 1.7 in residual pore water depending on
MHPC/CH ratio.
0
500
1000
1500
C3S portlandite gypsum ettringite
CE-
adso
rptio
n [µ
g/m
²]
HEC 1.1
MHEC 1.5
MHEC 1.7
MHPC 1.7
MHPC 1.9increasingDS
Fig. 5.05: Quantitative determination of CE-adsorption depending on CE-type and substrate.
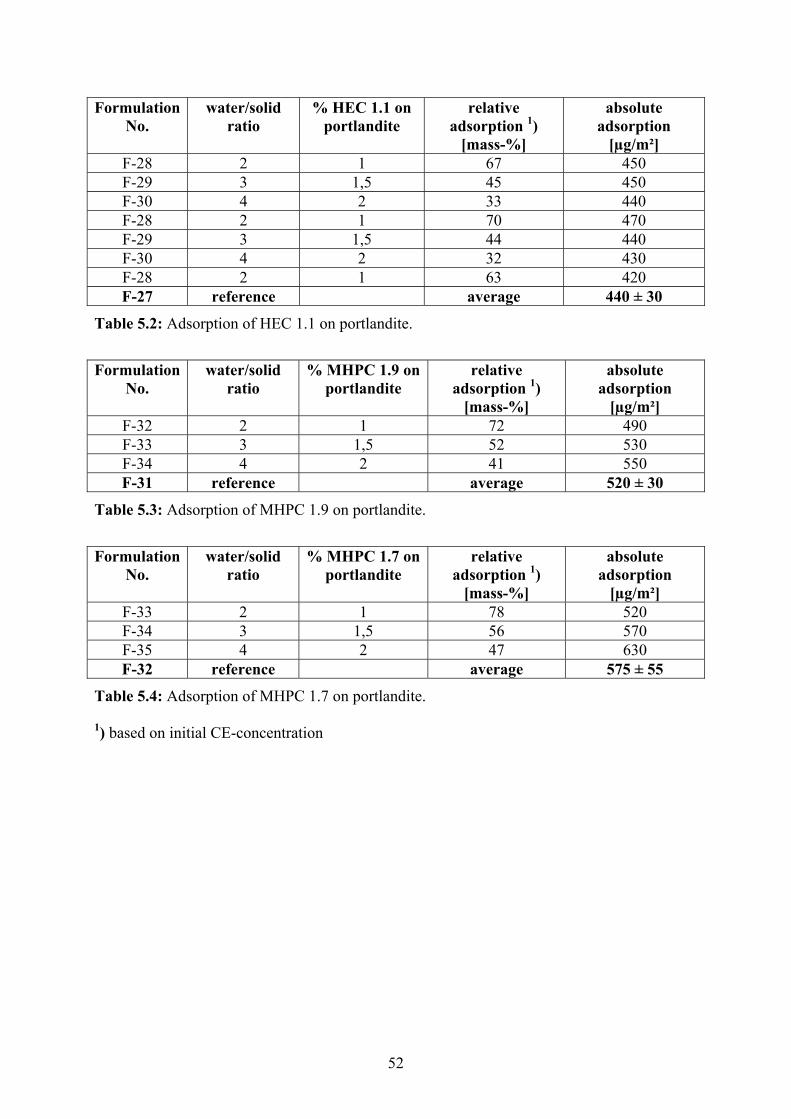
52
Formulation No.
water/solid ratio
% HEC 1.1 on portlandite
relative adsorption 1)
[mass-%]
absolute adsorption
[µg/m²] F-28 2 1 67 450 F-29 3 1,5 45 450 F-30 4 2 33 440 F-28 2 1 70 470 F-29 3 1,5 44 440 F-30 4 2 32 430 F-28 2 1 63 420 F-27 reference average 440 ± 30
Table 5.2: Adsorption of HEC 1.1 on portlandite.
Formulation No.
water/solid ratio
% MHPC 1.9 on portlandite
relative adsorption 1)
[mass-%]
absolute adsorption
[µg/m²] F-32 2 1 72 490 F-33 3 1,5 52 530 F-34 4 2 41 550 F-31 reference average 520 ± 30
Table 5.3: Adsorption of MHPC 1.9 on portlandite.
Formulation No.
water/solid ratio
% MHPC 1.7 on portlandite
relative adsorption 1)
[mass-%]
absolute adsorption
[µg/m²] F-33 2 1 78 520 F-34 3 1,5 56 570 F-35 4 2 47 630 F-32 reference average 575 ± 55
Table 5.4: Adsorption of MHPC 1.7 on portlandite. 1) based on initial CE-concentration
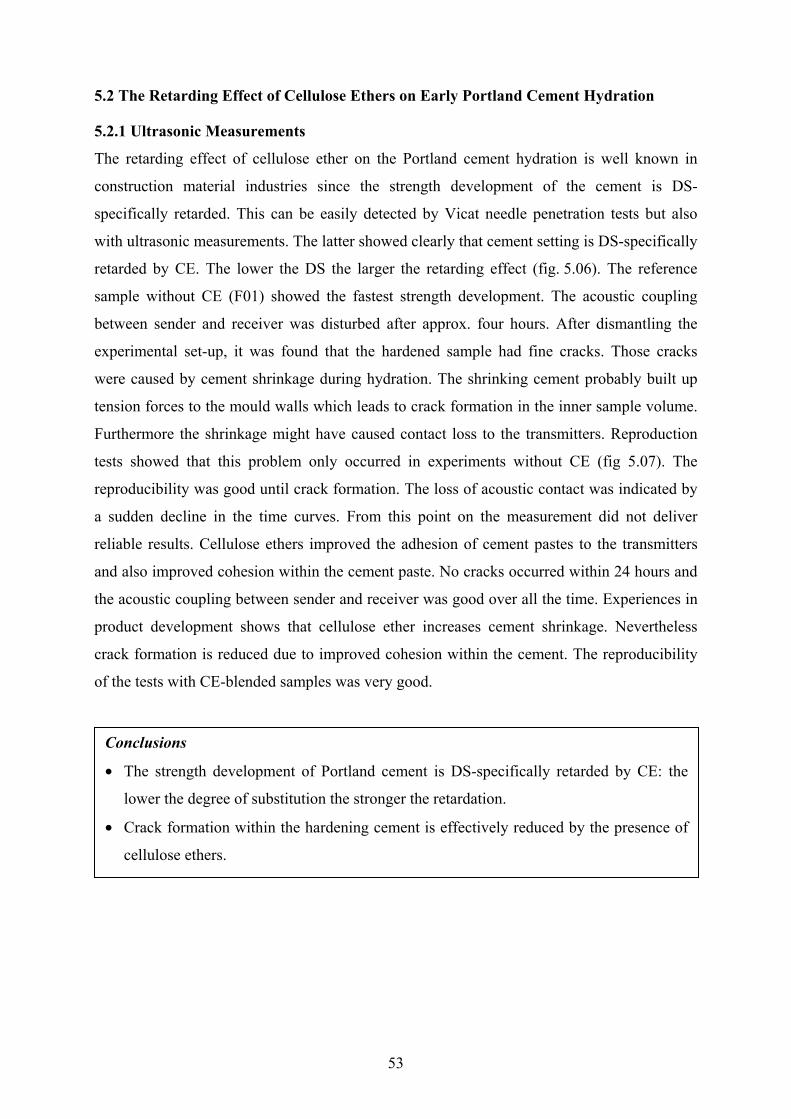
53
5.2 The Retarding Effect of Cellulose Ethers on Early Portland Cement Hydration
5.2.1 Ultrasonic Measurements
The retarding effect of cellulose ether on the Portland cement hydration is well known in
construction material industries since the strength development of the cement is DS-
specifically retarded. This can be easily detected by Vicat needle penetration tests but also
with ultrasonic measurements. The latter showed clearly that cement setting is DS-specifically
retarded by CE. The lower the DS the larger the retarding effect (fig. 5.06). The reference
sample without CE (F01) showed the fastest strength development. The acoustic coupling
between sender and receiver was disturbed after approx. four hours. After dismantling the
experimental set-up, it was found that the hardened sample had fine cracks. Those cracks
were caused by cement shrinkage during hydration. The shrinking cement probably built up
tension forces to the mould walls which leads to crack formation in the inner sample volume.
Furthermore the shrinkage might have caused contact loss to the transmitters. Reproduction
tests showed that this problem only occurred in experiments without CE (fig 5.07). The
reproducibility was good until crack formation. The loss of acoustic contact was indicated by
a sudden decline in the time curves. From this point on the measurement did not deliver
reliable results. Cellulose ethers improved the adhesion of cement pastes to the transmitters
and also improved cohesion within the cement paste. No cracks occurred within 24 hours and
the acoustic coupling between sender and receiver was good over all the time. Experiences in
product development shows that cellulose ether increases cement shrinkage. Nevertheless
crack formation is reduced due to improved cohesion within the cement. The reproducibility
of the tests with CE-blended samples was very good.
Conclusions
• The strength development of Portland cement is DS-specifically retarded by CE: the
lower the degree of substitution the stronger the retardation.
• Crack formation within the hardening cement is effectively reduced by the presence of
cellulose ethers.
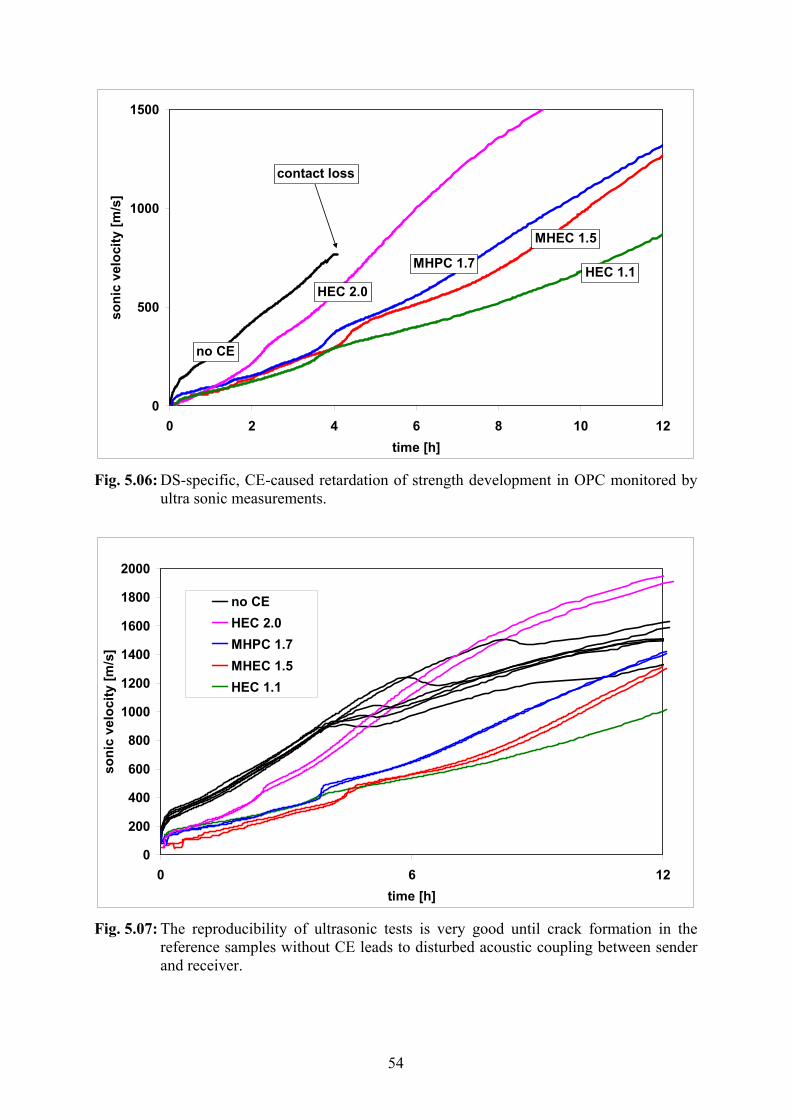
54
0
500
1000
1500
0 2 4 6 8 10 12time [h]
soni
c ve
loci
ty [m
/s]
HEC 2.0
no CE
MHEC 1.5
HEC 1.1MHPC 1.7
contact loss
Fig. 5.06: DS-specific, CE-caused retardation of strength development in OPC monitored by
ultra sonic measurements.
0
200
400
600
800
1000
1200
1400
1600
1800
2000
0 6 12time [h]
soni
c ve
loci
ty [m
/s]
no CEHEC 2.0MHPC 1.7MHEC 1.5HEC 1.1
Fig. 5.07: The reproducibility of ultrasonic tests is very good until crack formation in the
reference samples without CE leads to disturbed acoustic coupling between sender and receiver.
55
5.2.2 Heat Flux Calorimetry
The results were confirmed by heat flux calorimetric measurements of setting Portland
cement (fig. 5.08, table 5.5). The lower the DS the longer the retardation times. The heat
evaluation curve usually started with a strong, sharp peak. Its origin lay mostly in the
dissolution heat plus first crystallization heat. Since the water was added prior to
measurements this peak could not be observed except for the rest of the sharp drop down in
the very left of the diagram. The main hydration took place in a time frame of 3-20 hours with
its maximum between 6 and 13 hours depending on the DS of the added CE. According to
Taylor [Tay1] this heat development correlates with strong CSH-formation in the hydration
process of C3S. The downward trend of the heat evaluation curve hereafter showed a weak
shoulder. Taylor associates this shoulder with increased ettringite and monosulphate
formation. This process was, like the main hydration, DS-specifically retarded.
Heat flux calorimetry can also produce information on phase-dependent retardation if
single phases are used. Instead of cement pure C3S was mixed with water prior to
measurements. The heat evaluation curves here showed a significant retardation of the mean
hydration caused by CE (fig. 5.09, tab. 5.6), much clearer than in experiments with cement.
The lower the DS of the added CE the stronger the retardation. Since C3S was the only clinker
phase in these experiments the heat evaluation curves did not show shoulders of C3A-
hydration. Due to the lower milling grade (3000 cm²/g Blaine) the hydration times were
significantly longer than those of the Portland cement (4000 cm²/g Blaine).
Further experiments were carried out with mixtures of 70 % C3A, 15 % anhydrite and
15 % calcium sulphate hemi-hydrate. The heat development curves showed that the main
hydration of C3A took place approx. 30 minutes after water contact when no CE was added
(fig. 5.10). All CE-types showed a slight retarding effect of approx. 25 minutes, independent
of DS. It is assumed that the retardation was an unspecific effect of increased viscosity of the
pore solution which inhibited the ion mobility in crystallization processes.
Since a single time point for the climax of hydration processes can be determined (i.e. the
point of maximum heat development), it was possible to plot the retardation times versus the
degree of substitution. Figure 5.11 shows the DS-dependent retardation times for the three
different hydration processes described above. The hydration process of the pure C3S is much
slower than that of Portland cement due to coarser particle sizes.

56
Fig. 5.08: DS-specific retardation of cement hydration monitored by heat flux calorimetry.
Analyses by S. Hucko and M. Zwanzig, Hercules Inc
Conclusions
• The main hydration processes of Portland cement and C3S pure phase are strongly and
DS-specifically retarded by CE: the lower the degree of substitution the stronger the
retardation.
• The hydration of C3A in presence of Ca-sulphates is slightly and DS-independently
retarded by CE.

57
Fig. 5.09: DS-specific retardation of C3S-hydration monitored by heat flux calorimetry.
Analyses by S. Hucko and M. Zwanzig, Hercules Inc
CE-type no CE MHPC 1.7 MHEC 1.5 HEC 1.1 main hydration time [h] 6:15 8:45 10:00 13:00
retardation time [h] 2:30 3:45 6:45
Table 5.5: CE-caused retardation of Portland cement hydration determined by heat flux calorimetry.
CE-type no CE HEC 2.0 MHPC 1.7 MHEC 1.5 HEC 1.1 main hydration time [h] 11:00 15:00 24:30 32:00 53:00
retardation time [h] 4:00 12:30 21:00 42:00
Table 5.6: CE-caused retardation of C3S hydration determined by heat flux calorimetry.

58
Fig. 5.10: DS-independent retardation of C3A-hydration in presence of sulphates monitored
by heat flux calorimetry. Analyses by S. Hucko and M. Zwanzig, Hercules Inc.
0:00:00
6:00:00
12:00:00
18:00:00
24:00:00
30:00:00
36:00:00
42:00:00
48:00:00
1 1.2 1.4 1.6 1.8 2degree of substitution
reta
rdat
ion
time
[h]
C3S
OPC
C3A + sulfates
Fig. 5.11: DS- and phase-specific expansion of hydration times.
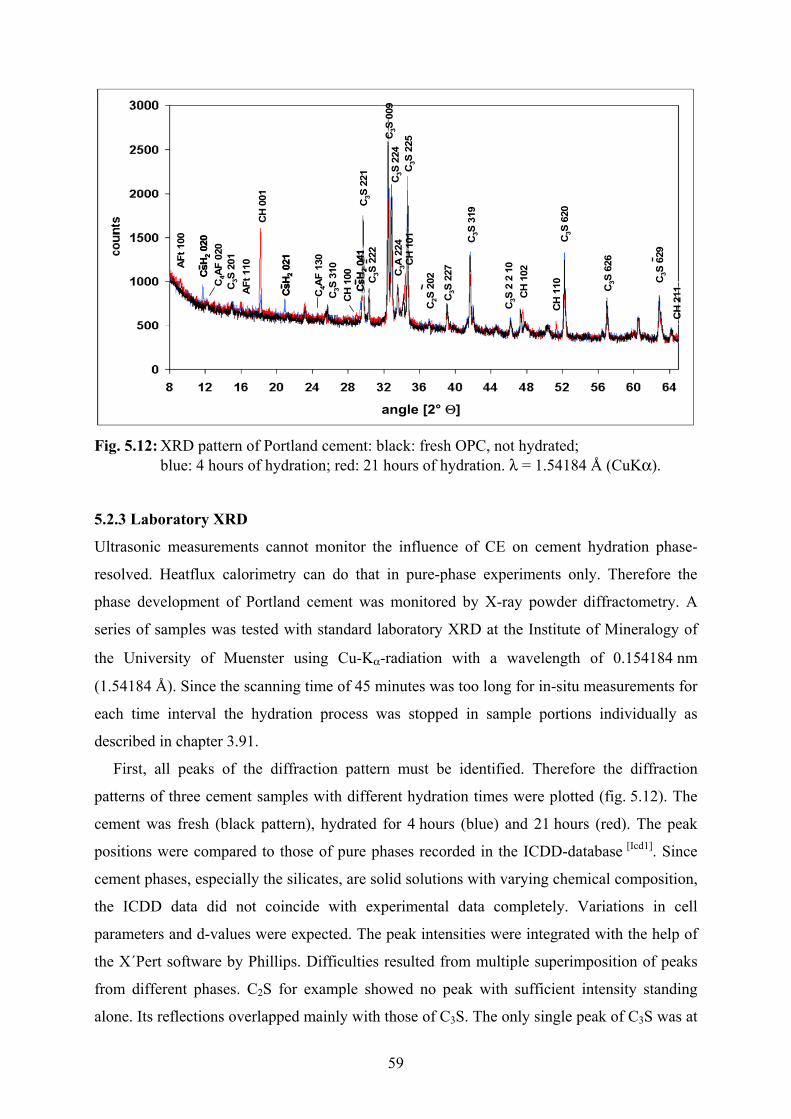
59
AFt
100
CsH
202
0
CH
001
CsH
202
1
CsH
204
1
AFt
110 C
H 1
01
CH
102
CH
110
CH
211CH
100C4A
F 02
0
C3A
224
C4A
F 13
0
C2S
202C3S
201
C3S
310
C3S
221
C3S
222
C3S
009
C3S
224
C3S
225
C3S
227
C3S
2 2
10
C3S
319
C3S
620
C3S
626
C3S
629
angle [2° Θ]
AFt
100
CsH
202
0C
sH2
020
CH
001
CsH
202
1C
sH2
021
CsH
204
1C
sH2
041
AFt
110 C
H 1
01
CH
102
CH
110
CH
211CH
100C4A
F 02
0
C3A
224
C4A
F 13
0
C2S
202C3S
201
C3S
310
C3S
221
C3S
222
C3S
009
C3S
224
C3S
225
C3S
227
C3S
2 2
10
C3S
319
C3S
620
C3S
626
C3S
629
angle [2° Θ]
Fig. 5.12: XRD pattern of Portland cement: black: fresh OPC, not hydrated; blue: 4 hours of hydration; red: 21 hours of hydration. λ = 1.54184 Å (CuKα).
5.2.3 Laboratory XRD
Ultrasonic measurements cannot monitor the influence of CE on cement hydration phase-
resolved. Heatflux calorimetry can do that in pure-phase experiments only. Therefore the
phase development of Portland cement was monitored by X-ray powder diffractometry. A
series of samples was tested with standard laboratory XRD at the Institute of Mineralogy of
the University of Muenster using Cu-Kα-radiation with a wavelength of 0.154184 nm
(1.54184 Å). Since the scanning time of 45 minutes was too long for in-situ measurements for
each time interval the hydration process was stopped in sample portions individually as
described in chapter 3.91.
First, all peaks of the diffraction pattern must be identified. Therefore the diffraction
patterns of three cement samples with different hydration times were plotted (fig. 5.12). The
cement was fresh (black pattern), hydrated for 4 hours (blue) and 21 hours (red). The peak
positions were compared to those of pure phases recorded in the ICDD-database [Icd1]. Since
cement phases, especially the silicates, are solid solutions with varying chemical composition,
the ICDD data did not coincide with experimental data completely. Variations in cell
parameters and d-values were expected. The peak intensities were integrated with the help of
the X´Pert software by Phillips. Difficulties resulted from multiple superimposition of peaks
from different phases. C2S for example showed no peak with sufficient intensity standing
alone. Its reflections overlapped mainly with those of C3S. The only single peak of C3S was at

60
angle position 51.7 °2Θ (620). The strongest reflection of C4AF (141) became overlapped by
a strong portlandite peak (101) with proceeding hydration. Some minor peaks of this phase
are (020), (130) and (040). Other peaks did not overlay them, but they had low intensity. C3A
had only one peak (224) without superimposition at 33.2 °2Θ. In contrast to clinker phases the
hydration products ettringite, portlandite and gypsum had their main reflections standing
alone in the low angle range. Ettringite has its main reflections at 9.1 °2Θ (100) and
15.8°Θ (110). Due to the small amount of ettringite none of the smaller peaks were found.
Gypsum showed three distinct peaks at 11.6 °2Θ (020), 20.7 °2Θ (021) and 29.2 °2Θ (041).
Portlandite has three strong peaks: (001), (101) and (110). (101) was partly superimposed by
C4AF (141) and C3S (225). Calcium sulphate hemi-hydrate and anhydrite also have distinct
main reflections but their content in cement (approx. 1.5 mass-% each) was too low. No peaks
of those two phases could be detected.
To monitor the phase development in the hydration process and to compare the hydration
kinetics of different cement-CE-blends it was not necessary to determine the phase content
quantitatively as can be done by Rietveld analysis. In this first test series the development of
peak intensities of one specific phase was compared in different formulations. For better
statistics the intensities of several selected reflections of one phase were summed up. A list of
all used reflections is given in table 5.7. The peak intensities were integrated and calculated
by using X´Pert peak identification and fitting software. The plot of the sum of intensities
versus time shows the phase development during hydration.
Figure 5.13 shows the phase development of ettringite over time. About two third of all
observed ettringite was formed within the first ten minutes of hydration. This result correlates
basically with the estimation of Cerulli (80 mass-%, chapter 2.6). The rest crystallized slowly
over 24 hours. Cellulose ethers did not show any effect on ettringite crystallization.
AFt C S H2 C4AF C3S CH C3A C2S 1 0 0 0 2 0 0 2 0 2 0 1 0 0 1 2 2 4 2 0 2 1 1 0 0 2 1 1 3 0 3 1 0 1 0 0
0 4 1 0 4 0 2 2 2 1 0 1 1 4 1 2 2 7 1 1 0 2 2 10 2 1 1 6 2 0 6 2 6 6 2 9 6 2 9 8 0 4
Table 5.7: Selected peaks suitable to determine the phase development in OPC.
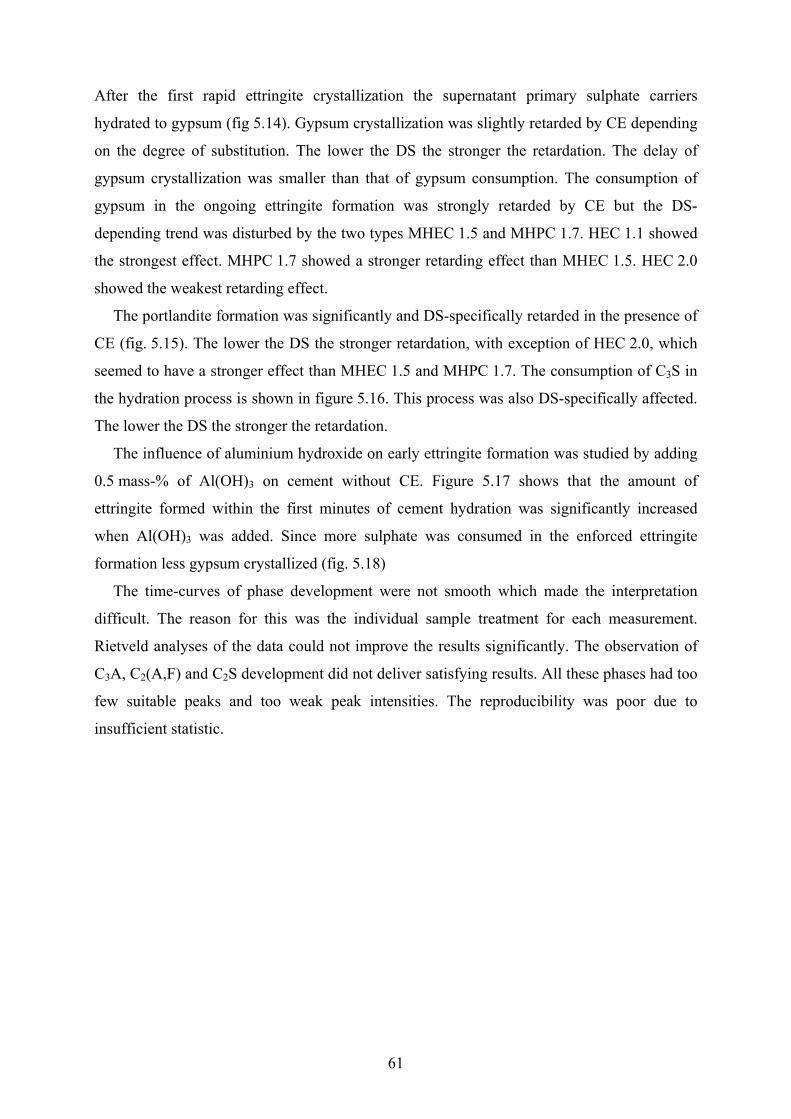
61
After the first rapid ettringite crystallization the supernatant primary sulphate carriers
hydrated to gypsum (fig 5.14). Gypsum crystallization was slightly retarded by CE depending
on the degree of substitution. The lower the DS the stronger the retardation. The delay of
gypsum crystallization was smaller than that of gypsum consumption. The consumption of
gypsum in the ongoing ettringite formation was strongly retarded by CE but the DS-
depending trend was disturbed by the two types MHEC 1.5 and MHPC 1.7. HEC 1.1 showed
the strongest effect. MHPC 1.7 showed a stronger retarding effect than MHEC 1.5. HEC 2.0
showed the weakest retarding effect.
The portlandite formation was significantly and DS-specifically retarded in the presence of
CE (fig. 5.15). The lower the DS the stronger retardation, with exception of HEC 2.0, which
seemed to have a stronger effect than MHEC 1.5 and MHPC 1.7. The consumption of C3S in
the hydration process is shown in figure 5.16. This process was also DS-specifically affected.
The lower the DS the stronger the retardation.
The influence of aluminium hydroxide on early ettringite formation was studied by adding
0.5 mass-% of Al(OH)3 on cement without CE. Figure 5.17 shows that the amount of
ettringite formed within the first minutes of cement hydration was significantly increased
when Al(OH)3 was added. Since more sulphate was consumed in the enforced ettringite
formation less gypsum crystallized (fig. 5.18)
The time-curves of phase development were not smooth which made the interpretation
difficult. The reason for this was the individual sample treatment for each measurement.
Rietveld analyses of the data could not improve the results significantly. The observation of
C3A, C2(A,F) and C2S development did not deliver satisfying results. All these phases had too
few suitable peaks and too weak peak intensities. The reproducibility was poor due to
insufficient statistic.
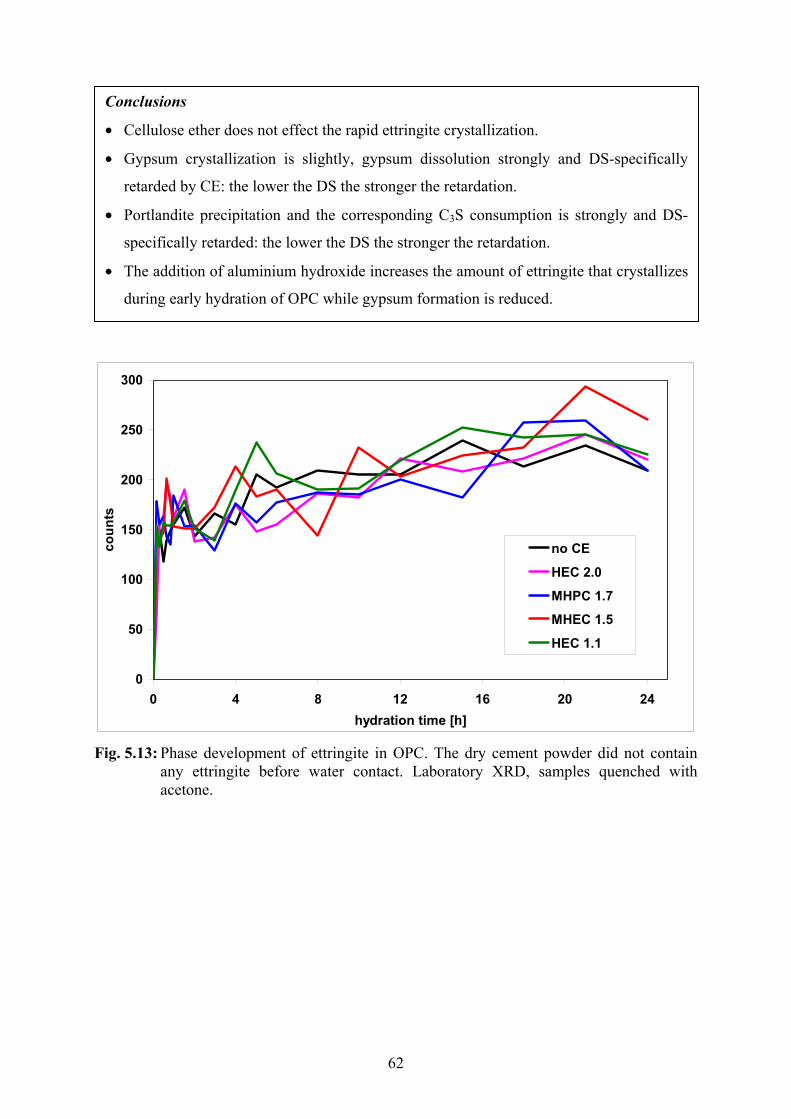
62
0
50
100
150
200
250
300
0 4 8 12 16 20 24hydration time [h]
coun
ts
no CE
HEC 2.0
MHPC 1.7
MHEC 1.5
HEC 1.1
Fig. 5.13: Phase development of ettringite in OPC. The dry cement powder did not contain
any ettringite before water contact. Laboratory XRD, samples quenched with acetone.
Conclusions
• Cellulose ether does not effect the rapid ettringite crystallization.
• Gypsum crystallization is slightly, gypsum dissolution strongly and DS-specifically
retarded by CE: the lower the DS the stronger the retardation.
• Portlandite precipitation and the corresponding C3S consumption is strongly and DS-
specifically retarded: the lower the DS the stronger the retardation.
• The addition of aluminium hydroxide increases the amount of ettringite that crystallizes
during early hydration of OPC while gypsum formation is reduced.
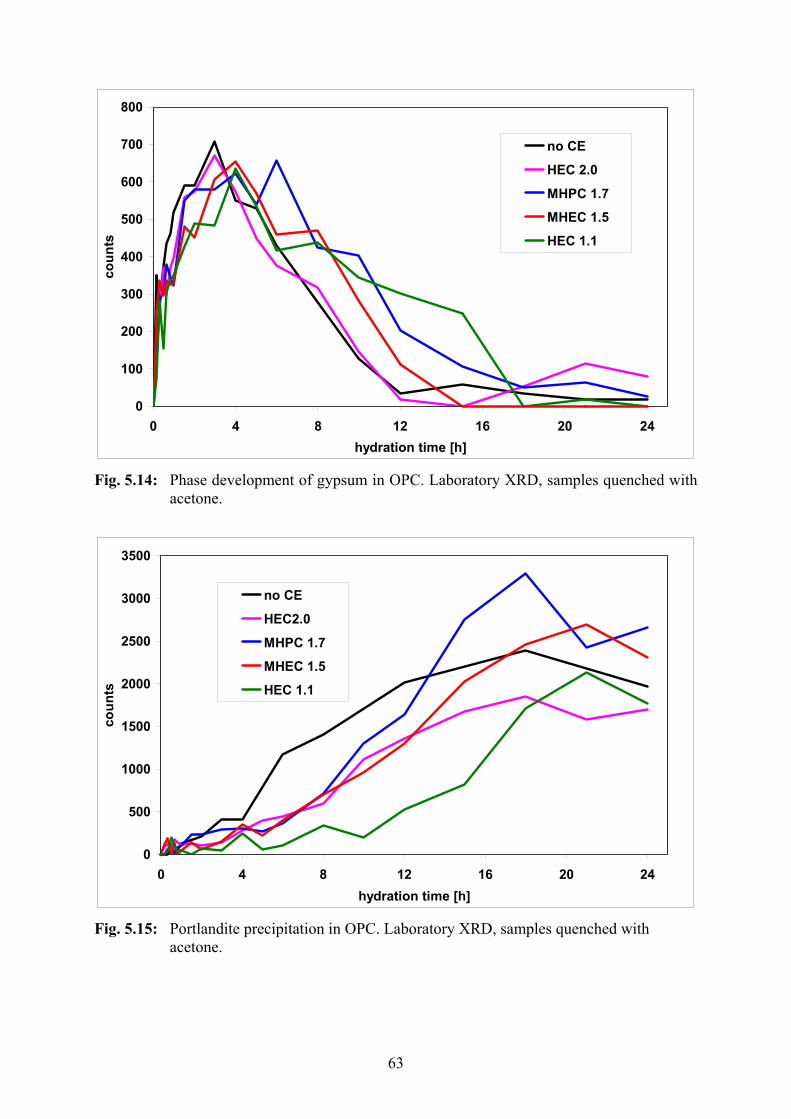
63
0
100
200
300
400
500
600
700
800
0 4 8 12 16 20 24hydration time [h]
coun
ts
no CE
HEC 2.0
MHPC 1.7
MHEC 1.5
HEC 1.1
Fig. 5.14: Phase development of gypsum in OPC. Laboratory XRD, samples quenched with acetone.
0
500
1000
1500
2000
2500
3000
3500
0 4 8 12 16 20 24hydration time [h]
coun
ts
no CE
HEC2.0
MHPC 1.7
MHEC 1.5
HEC 1.1
Fig. 5.15: Portlandite precipitation in OPC. Laboratory XRD, samples quenched with
acetone.

64
1500
2000
2500
3000
3500
0 4 8 12 16 20 24hydration time [h]
coun
ts
no CE
HEC 2.0
MHPC 1.7
MHEC 1.5
HEC 1.1
Fig. 5.16: C3S consumption during OPC hydration. Laboratory XRD, samples quenched
with acetone.
0
50
100
150
200
250
300
350
0 4 8 12 16 20 24time [h]
coun
ts
no Al(OH)3
Al(OH)3 added
Fig. 5.17: Increased ettringite formation in OPC with addition of 0.5 mass-% Al(OH)3.
Laboratory XRD, samples quenched with acetone.

65
0
100
200
300
400
500
600
700
0 4 8 12 16 20 24time [h]
coun
ts
no Al(OH)3
Al(OH)3 added
Fig. 5.18: Reduced gypsum formation in OPC with addition of 0.5 mass-% Al(OH)3.
Laboratory XRD, samples quenched with acetone.
AFt
100
CsH
202
0
CH
001 CsH
202
1
CsH
204
1
AFt
110
CH
102
CH
110
CH
211CH
100
C4A
F 02
0
C3A
224
C4A
F 13
0
C2S
202
C3S
201
C3S
310
C3S
221
C3S
222
C3S
009
C3S
224
C3S
225
C3S
227
C3S
2 2
10
C3S
319
C3S
620
C3S
626
C3S
629
angle [2° Θ]
AFt
100
CsH
202
0C
sH2
020
CH
001 CsH
202
1C
sH2
021
CsH
204
1C
sH2
041
AFt
110
CH
102
CH
110
CH
211CH
100
C4A
F 02
0
C3A
224
C4A
F 13
0
C2S
202
C3S
201
C3S
310
C3S
221
C3S
222
C3S
009
C3S
224
C3S
225
C3S
227
C3S
2 2
10
C3S
319
C3S
620
C3S
626
C3S
629
angle [2° Θ]
Fig. 5.19: Synchrotron XRD pattern of Portland cement after 5 hours of hydration. λ = 1.04014 Å.

66
5.2.4 Synchrotron XRD
The incontinuity of measurements as described in the chapter before, can only be avoided if
the same sample is monitored in-situ over time. Synchrotron radiation with high brilliance (up
to 1013 ph/s) in combination with simultaneous detection of diffracted beams over the whole
angle range allows in-situ measurements with a temporal resolution of 10 seconds. During a
measuring time of 24 hours a huge amount of data was produced (approx. 8600 data files per
day). Only a small part of all data could be used for data analysis in a reasonable time. The
time-resolution was high at the beginning of hydration to monitor the rapid ettringite
crystallization and was more and more reduced with progressing hydration time. Rietveld
analyses were done without consideration of the so-called amorphous phases. Calcium silicate
hydrates and the X-ray amorphous ettringite as observed by Eckart and Stark [Eck1] had not
been taken into account. Therefore the calculated phase content given in masspercent is based
on the sum of all observed phases:
[X] = 100 mX / Σmn
with [X] = content of phase X in masspercent, mX = mass of X and Σmn = sum of masses of
all observed phases including X. The following phases could be observed: C3A, C4AF, C3S,
C2S, ettringite, portlandite and gypsum (fig. 5.19). Since the ignored content of amorphous
phases increased with proceeding hydration time, the calculated content of all observed
phases was higher than their content in cement actually was. The difference between
calculated and actual content increased with progressing hydration time. Furthermore free
water was not considered. A part of the pore water was incorporated into crystalline hydration
products and contributes to the mass of observed phases. However, this did not disturb the
comparing approach of hydration kinetics.
The first ettringite was formed within the first five minutes of hydration (fig. 5.20). CE had
no effect on the first ettringite crystallization. This correlates well with results from laboratory
XRD. Whereas conventional XRD showed a rather continuous ettringite formation hereafter,
the synchrotron XRD gave three other results: 1. After a few minutes the first ettringite
formation stopped and the phase content of ettringite was constant for some hours. After some
hours a renewed growth of ettringite started. 2. The apparent amount of ettringite formed
during first crystallization was less in in-situ experiments than in quenched samples. This
correlates with the observations made by T. Cerulli [Cer1] (s. chapter 2.6). 3. The second
ettringite formation is strongly DS-specifically retarded by CE. MHPC 1.9 showed nearly no
retardation closely followed by MHEC 1.7. The next was MHEC 1.5 followed by MHPC 1.7.
The strongest retardation was shown by HEC 1.1. After 24 hours the second ettringite

67
formation had just started in the HEC 1.1 formulation. The second ettringite formation
proceeded simultaneously with gypsum dissolution, a phase that was consumed in this
process.
Gypsum crystallization was significantly retarded by CE depending on DS (fig. 5.21). The
lower the DS the stronger the retardation. An exception is MHEC 1.5, which showed a
slightly stronger retardation than HEC 1.1. The disappearance of gypsum proceeds
simultaneously with the second ettringite formation indicating that gypsum is consumed in
this crystallization process. The retarding effects of various CE-types was here in line with
their DS-value. The lower the DS the stronger the retardation.
After complete consumption of gypsum, ettringite should react with C3A and water
forming calcium aluminate monosulphate hydrate. The monosulphate has only one strong
peak very close to ettringite (100). Due to the partly superposition of both peaks and the high
radiation energy with decreased spatial resolution, monosulphate could not be distinguished
from ettringite. However, it was assumed that only negligibly small amounts of monosulphate
were formed during the first 24 hours of hydration. Theoretically no monosulphate should
appear in this time since the pore solution is more supersaturated in respect of ettringite than
of monosulphate (Rothstein [Rot1]). Thus ettringite is a stable phase at this stage of hydration.
This correlates with results presented by Stark [Sta1, Sta2], who did not observe monosulphate
formation in the first 24 hours of cement hydration.
A comparison of the calculated development of C3S and C2S showed that the Siroquant
software had difficulties to distinguish between those two phases (see also chapter 4.1).
Sudden drop downs of the calculated C3S-content were always associated with a sharp
increase of C2S (fig. 5.22). This indicates that in some analyses Siroquant identified C3S
peaks as those of C2S. Therefore both phases were summarized as calcium silicates which led
to a steady course of the time curves. This made it easier to compare the kinetics of the phase
development in different samples. The comparison between C3S and C2S shows that it is
rather the C3S that was consumed in the silicate hydration in which portlandite and X-ray
amorphous CSH is formed. C2S seemed to be stable over 24 hours. This result was in line
with those of Taylor and Scrivener [Tay1, Scr1]. Thereafter C2S is less active and reacts in cement
over years. The consumption of calcium silicates was retarded DS-specifically (fig. 5.23). The
lower the DS the stronger the retardation. The phase development of calcium silicates
correlated perfectly with the simultaneous portlandite crystallization (fig. 5.24). The HEC 1.1
showed the strongest retardation: after 24 hours the amount of calcium silicates hardly
decreased and only little CH was formed.

68
The content of C2(A,F) seemed to increase after eight hours (fig. 5.25). This apparent DS-
dependent increase was an artefact since the increase of a clinker phase during hydration
makes no sense. Assuming that the mass of C2(A,F) was constant over observation time,
which is reasonable since C2(A,F) is the most stable clinker phase, its calculated content
increased because Σmn decreased due to its contribution to CSH-formation whose mass was
not included in the sum.
The same argumentation explains the apparent DS-specific C3A-growth after eight hours
(fig. 5.26). C3A contributes to ettringite formation. The stoichiometric equation
Ca3Al2O6 + 3 CaSO4⋅2H2O + 26 H2O → Ca6Al2O6(SO4)3⋅32H2O
transformed into a balance of molecular masses:
270 + 516 + 468 = 1254
indicates that the mass contribution of C3A is approx. one fifth of the mass of ettringite. A
slight decrease of C3A content in cement is to be expected, as the figure shows for the initial
stage of hydration. Due to the impossibility to describe the phase development of the last two
phases, no statement can be made on the influence of cellulose ethers on those developments.
All in all it could be said that the cellulose ether had a DS-dependent effect on the
hydration process of the calcium silicates and on the second ettringite formation together with
gypsum consumption. The lower the DS the stronger the retarding effect. A comparison
between MHECs and MHPCs shows that MHPCs had stronger retarding effects on the
hydration kinetics than MHECs. Samples containing MHPC 1.7 were always delayed for
longer times than samples with MHEC 1.7. In respect of second ettringite formation the
MHPC 1.7 was close to MHEC 1.5. This indicated that the chemistry of the substituent had
also an influence on hydration kinetics. Within one group of cellulose ethers the CE-caused
retardation was DS-specific. HEC 1.1 with its extremely low DS showed always the longest
retardation times.
Additionally to the quantitative phase analyses based on synchrotron XRD data, a Rietveld
analysis of the reference sample that had been hydrated for 24 hours without CE was made at
the X-Ray Laboratory Dr. Ermrich to confirm the results. The results are given in table 5.8.
The comparison is satisfying. The differences between the ettringite contents showed that the
laboratory XRD result fits better since a cement sample without CE should have a higher
content of ettringite after 24 hours of hydration (see also fig. 5.20).

69
Phase Laboratory XRD [mass-%] Synchrotron XRD [mass-%] C3S 47.5 50.9 C2S 10.2 6.7
C2(A,F) 9.4 12.9 C3A 5.4 4.5 M 0.4 0.0
C s 0.0 0.0 C s H0.5 0.0 0.0 C s H2 0.0 0.0
CH 16.2 16.9 AFt 10.9 7.9
amorphous 0.00 0.0 sum 100.0 99.6
Table 5.8: Phase composition of hydrated Portland cement without CE after 24 hours. The laboratory XRD analysis was done by X-Ray Laboratory Dr. Ermrich. The Synchrotron XRD analysis was performed by the author. The correlation is satisfying. A significant difference occurs with ettringite.
Conclusions
• Ettringite crystallization takes place in two stages: the rapid first ettringite formation is
not effected by CE. The second ettringite formation after several hours of rest is
strongly and DS-specifically retarded by CE: the lower the DS the stronger the retarding
effect.
• Gypsum crystallization is significantly, gypsum dissolution strongly and DS-
specifically retarded by CE: the lower the DS the stronger the retardation.
• Portlandite precipitation and the corresponding C3S consumption is strongly and DS-
specifically retarded: the lower the DS the stronger the retardation.
• The retarding effect of MHPC is stronger than that of MHEC with the same DS (1.7).
Within one group of CE the retarding effect increases with decreasing DS.

70
0%
2%
4%
6%
8%
10%
12%
0:00:00 4:00:00 8:00:00 12:00:00 16:00:00 20:00:00 24:00:00
hydration time [h]
phas
e co
nten
t [m
ass-
%]
no CE MHPC 1.9 MHPC 1.7
MHEC 1.7 MHEC 1.5 HEC 1.1
Fig. 5.20: Phase development of ettringite in OPC. The dry cement powder did not contain
any ettringite before water contact. Rietveld analyses based on synchrotron XRD data.
0.0%
0.5%
1.0%
1.5%
2.0%
2.5%
0:00:00 4:00:00 8:00:00 12:00:00 16:00:00 20:00:00 24:00:00
hydration time [h]
phas
e co
nten
t [m
ass-
%]
no CE MHPC 1.9 MHPC 1.7
MHEC 1.7 MHEC 1.5 HEC 1.1
Fig. 5.21: Phase development of gypsum in OPC. Rietveld analyses based on synchrotron XRD data.
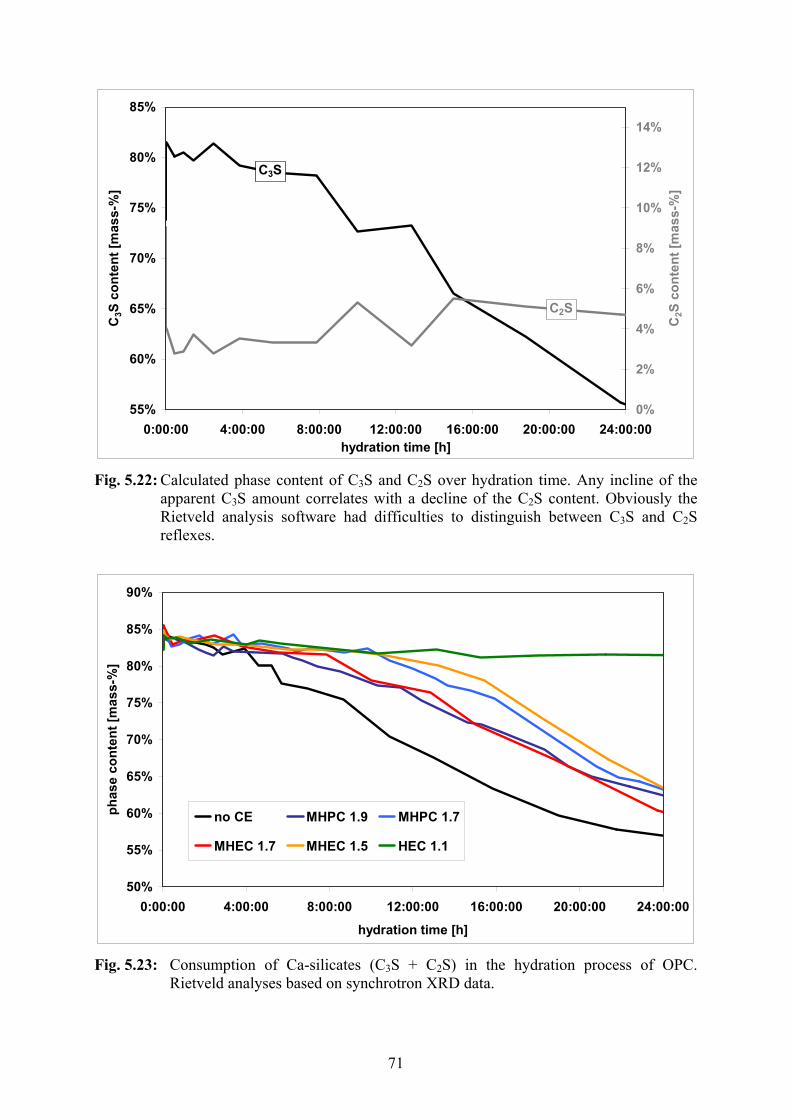
71
55%
60%
65%
70%
75%
80%
85%
0:00:00 4:00:00 8:00:00 12:00:00 16:00:00 20:00:00 24:00:00hydration time [h]
C3S
con
tent
[mas
s-%
]
0%
2%
4%
6%
8%
10%
12%
14%
C2S
con
tent
[mas
s-%
]
C2S
C3S
Fig. 5.22: Calculated phase content of C3S and C2S over hydration time. Any incline of the
apparent C3S amount correlates with a decline of the C2S content. Obviously the Rietveld analysis software had difficulties to distinguish between C3S and C2S reflexes.
50%
55%
60%
65%
70%
75%
80%
85%
90%
0:00:00 4:00:00 8:00:00 12:00:00 16:00:00 20:00:00 24:00:00
hydration time [h]
phas
e co
nten
t [m
ass-
%]
no CE MHPC 1.9 MHPC 1.7
MHEC 1.7 MHEC 1.5 HEC 1.1
Fig. 5.23: Consumption of Ca-silicates (C3S + C2S) in the hydration process of OPC. Rietveld analyses based on synchrotron XRD data.
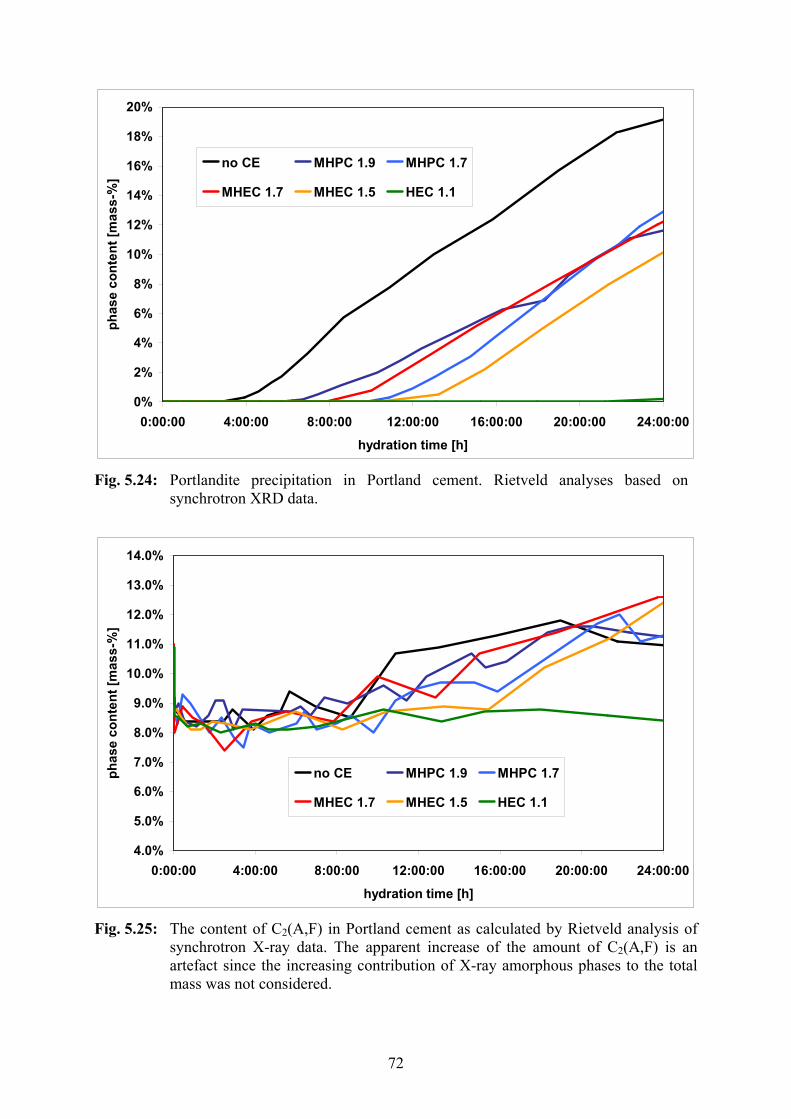
72
0%
2%
4%
6%
8%
10%
12%
14%
16%
18%
20%
0:00:00 4:00:00 8:00:00 12:00:00 16:00:00 20:00:00 24:00:00
hydration time [h]
phas
e co
nten
t [m
ass-
%]
no CE MHPC 1.9 MHPC 1.7
MHEC 1.7 MHEC 1.5 HEC 1.1
Fig. 5.24: Portlandite precipitation in Portland cement. Rietveld analyses based on
synchrotron XRD data.
4.0%
5.0%
6.0%
7.0%
8.0%
9.0%
10.0%
11.0%
12.0%
13.0%
14.0%
0:00:00 4:00:00 8:00:00 12:00:00 16:00:00 20:00:00 24:00:00
hydration time [h]
phas
e co
nten
t [m
ass-
%]
no CE MHPC 1.9 MHPC 1.7
MHEC 1.7 MHEC 1.5 HEC 1.1
Fig. 5.25: The content of C2(A,F) in Portland cement as calculated by Rietveld analysis of synchrotron X-ray data. The apparent increase of the amount of C2(A,F) is an artefact since the increasing contribution of X-ray amorphous phases to the total mass was not considered.
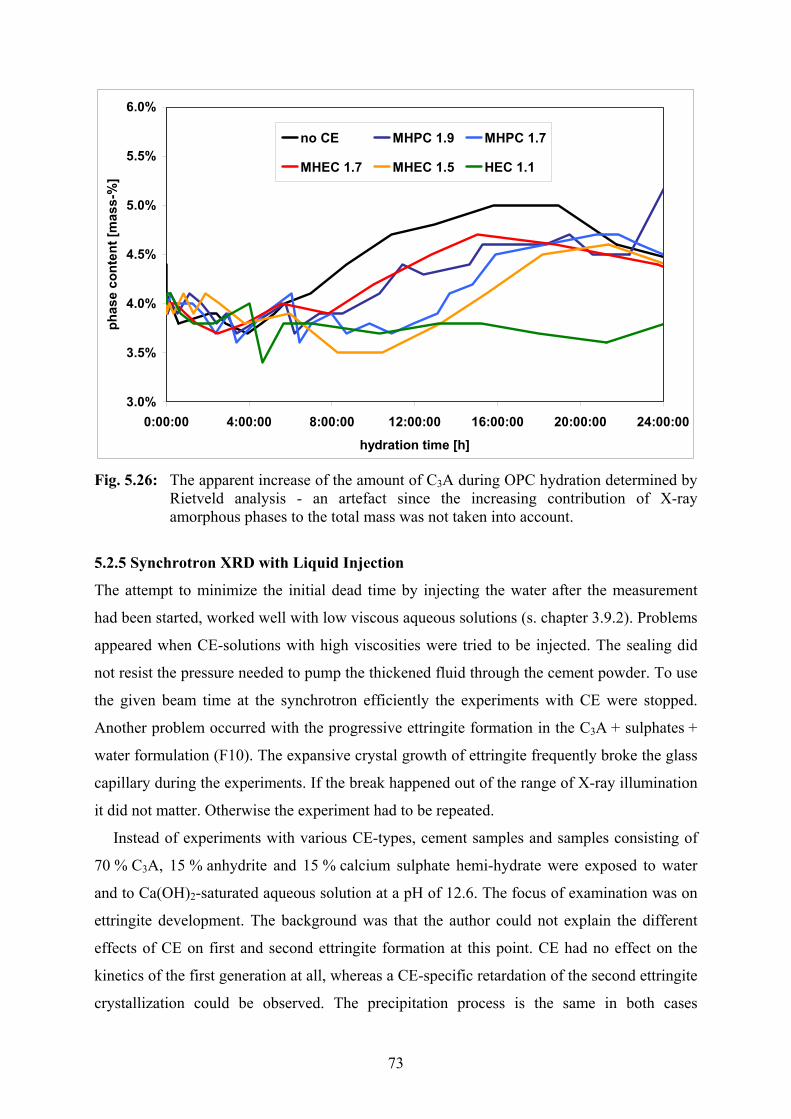
73
3.0%
3.5%
4.0%
4.5%
5.0%
5.5%
6.0%
0:00:00 4:00:00 8:00:00 12:00:00 16:00:00 20:00:00 24:00:00
hydration time [h]
phas
e co
nten
t [m
ass-
%]
no CE MHPC 1.9 MHPC 1.7
MHEC 1.7 MHEC 1.5 HEC 1.1
Fig. 5.26: The apparent increase of the amount of C3A during OPC hydration determined by Rietveld analysis - an artefact since the increasing contribution of X-ray amorphous phases to the total mass was not taken into account.
5.2.5 Synchrotron XRD with Liquid Injection
The attempt to minimize the initial dead time by injecting the water after the measurement
had been started, worked well with low viscous aqueous solutions (s. chapter 3.9.2). Problems
appeared when CE-solutions with high viscosities were tried to be injected. The sealing did
not resist the pressure needed to pump the thickened fluid through the cement powder. To use
the given beam time at the synchrotron efficiently the experiments with CE were stopped.
Another problem occurred with the progressive ettringite formation in the C3A + sulphates +
water formulation (F10). The expansive crystal growth of ettringite frequently broke the glass
capillary during the experiments. If the break happened out of the range of X-ray illumination
it did not matter. Otherwise the experiment had to be repeated. Instead of experiments with various CE-types, cement samples and samples consisting of
70 % C3A, 15 % anhydrite and 15 % calcium sulphate hemi-hydrate were exposed to water
and to Ca(OH)2-saturated aqueous solution at a pH of 12.6. The focus of examination was on
ettringite development. The background was that the author could not explain the different
effects of CE on first and second ettringite formation at this point. CE had no effect on the
kinetics of the first generation at all, whereas a CE-specific retardation of the second ettringite
crystallization could be observed. The precipitation process is the same in both cases

74
independent of the educts (different sulphates) if the nuclei are formed out of aqueous
solution as Taylor and Scrivener suggested [Tay1, Scr1] (s. chapter 2.5.3). This means that
adsorption of CE on ettringite and surface intoxication cannot explain the effect on renewed
ettringite growth. But the crystallization kinetics can be affected by the dissolution rate of the
educts and/or the ion-concentration in the pore water. Scrivener saw a relation between
second ettringite formation and C3S hydration. This relation could be confirmed by the results
of synchrotron XRD. A comparison between second ettringite crystallization and portlandite
precipitation showed clearly, that indeed renewed ettringite growth always started
synchronically with portlandite crystallization (fig. 5.27). The common component of both
processes is calcium and it was assumed that the calcium concentration in pore water is the
key. If the ion-balance in solution plays a role, even the first ettringite formation must be
affected by variations of calcium concentration in water.
Graphical comparison of the development of the ettringite reflections (100) and (110)
within the first 45 minutes of hydration showed that the crystallization started immediately
after water contact. In the pure phase mixture of C3A + sulphates with water the ettringite
formation was a continuous and steady process (fig. 5.28). Comparison of the two sulphate
phases showed that the hemi-hydrate was consumed while the anhydrite was more stable
(fig. 5.29). After 4 hours gypsum appeared while ettringite was still slowly growing. The
bassanite was long gone and the anhydrite began to dissolve. In a time range of a few hours it
was clear that the dissolution of anhydrite was a slow but continuous process (figures 5.30
and 5.31).
If Ca(OH)2-saturated solution was used, only little ettringite seemed to crystallize directly
after contact with the fluid. The further precipitation of (well-crystalline) ettringite was
efficiently inhibited by Ca2+ respectively (OH)- ions in aqueous solution (fig. 5.32).
Simultaneously only little bassanite and no anhydrite were consumed (fig. 5.33). The initial
amount of ettringite was comparable to the first ettringite formation in OPC. After one hour
ettringite was slowly growing, much slower than in the experiment with tap water. Instead
much more gypsum was formed by the hydration of bassanite. Anhydrite was much more
stable in Ca(OH)2 saturated solution (figures 5.34 and 5.35).
In experiments with Portland cement the additional Ca(OH)2 dissolved in water prior to
cement contact had no significant influence on the results. In OPC Ca(OH)2-saturation is
quickly achieved after water contact anyway, even if no additional Ca(OH)2 was given into
solution before the experiment started (figures 5.36 and 5.37).

75
0:00:00 4:00:00 8:00:00 12:00:00 16:00:00 20:00:00 24:00:00
hydration time [h]
phas
e co
nten
t
CH
AFt
Fig. 5.27: Portlandite (CH) and second ettringite (AFt) crystallization in comparison.
Depending on the cellulose ether both processes starts at the same time. Black: no CE; dark blue: MHPC 1.9; red: MHEC 1.7; light blue: MHPC 1.7; orange: MHEC 1.5; green: HEC 1.1.
Conclusions
• Ettringite crystallization starts immediately after water contact.
• In Portland cement the second ettringite crystallization always takes place
contemporaneously with portlandite precipitation.
• In pure phase admixtures of C3A and Ca-sulphates (in absence of silicates) the ettringite
formation is a continuous process.
• High Ca(OH)2-concentration in the pore water inhibits the ettringite formation
significantly.
• Calcium sulphate hemi-hydrate is more reactive than the water-soluble anhydrite used
in this investigation.

76
5.5 6.0 6.5 7.0 7.5 8.0 8.5 9.0 9.5 10.0 10.5 11.0 11.5 12.0 12.5 13.0 13.5
angle °2Θ (λ = 1.04014 Å)
coun
ts a
nd ti
me
[h]
AFt 100
dry phaseswater injection
0:20
0:10
0:30
0:40
C3A 111AFt 101
C3A 210C3A 211
CsH0.5
200
AFt 110
C3A 220
C3A 221
AFt 112
C3A 311AFt 104
Fig. 5.28: Early ettringite formation in a pure phase mixture of 70 mass-% C3A, 15 mass-% anhydrite and 15 mass-% bassanite plus water. The anhydrite does not show reflexes in this angle range.
20.6 20.8 21.0 21.2 21.4 21.6 21.8 22.0
angle °2Θ (λ = 1.04014 Å)
coun
ts a
nd ti
me
[h]
water injection
0:200:10
0:300:40
CsH0.5 [204]
C3A 521
AFt 304
Cs 012
C3A 250
Fig. 5.29: Ca-sulphate consumption during early ettringite formation in a pure phase mixture of 70 mass-% C3A, 15 mass-% anhydrite and 15 mass-% bassanite plus water. The anhydrite is less active than the bassanite.

77
5.5 6.0 6.5 7.0 7.5 8.0 8.5 9.0 9.5 10.0 10.5 11.0 11.5 12.0 12.5 13.0 13.5
angle 2°Θ (λ = 1.04014 Å)
coun
ts a
nd ti
me
[h]
1:00
3:30
waterinjection
6:30
AFt 100
C3A 111AFt 101
C3A C3A 211
CsH0.5
200
AFt 110
C3A 220
C3A 221
AFt 112200
C3A311
AFt 104CsH2 020
Fig. 5.30: Ettringite formation in a pure phase mixture of 70 mass-% C3A, 15 mass-% anhydrite and 15 mass-% bassanite plus water. The anhydrite does not show reflexes in this angle range.
20.6 20.8 21.0 21.2 21.4 21.6 21.8 22.0
angle 2°Θ (λ = 1.04014 Å)
coun
ts a
nd ti
me
[h]
1:00
3:30
waterinjection
6:30
CsH0.5 204
C3A 521
AFt 304
Cs 012
C3A 250
Fig. 5.31: Ca-sulphate consumption during ettringite formation in a pure phase mixture of 70 mass-% C3A, 15 mass-% anhydrite and 15 mass-% bassanite plus water. The anhydrite is less active than the bassanite.

78
5.5 6.0 6.5 7.0 7.5 8.0 8.5 9.0 9.5 10.0 10.5 11.0 11.5 12.0 12.5 13.0 13.5
angle °2Θ (λ = 0.04014 Å)
coun
ts a
nd ti
me
[h]
AFt 100
dry phaseswater injection
0:20
0:10
0:40
C3A 111
C3A 210 C3A211
CsH0.5
200
AFt 110
C3A 220
C3A 221
C3A 311
AFt 104
Fig. 5.32: Disturbed early ettringite crystallization in Ca(OH)2-saturated aqueous solution. This experiment was performed with a pure phase mixture of 70 mass-% C3A, 15 mass-% anhydrite and 15 mass-% bassanite.
20.6 20.8 21.0 21.2 21.4 21.6 21.8 22.0
angle °2Θ (λ = 0.04014 Å)
coun
ts a
nd ti
me
[h]
water injection
0:20
0:10
0:40
CsH0.5 204
C3A 521
Cs 012
C3A 250
Fig. 5.33: Disturbed early ettringite crystallization in Ca(OH)2-saturated aqueous solution. Only little Ca-sulphate was consumed.

79
5.5 6.0 6.5 7.0 7.5 8.0 8.5 9.0 9.5 10.0 10.5 11.0 11.5 12.0 12.5 13.0 13.5
angle 2°Θ (l = 1.04014 Å)
coun
ts a
nd ti
me
[h]
1:15water
injection
2:45
AFt 100
C3A 111
C3A
C3A 211CsH0.5
200AFt110
C3A 220
C3A 221
AFt112 104
C3A 311
CsH2 020
Fig. 5.34: Disturbed ettringite crystallization in Ca(OH)2-saturated aqueous solution. This experiment was performed with a pure phase mixture of 70 mass-% C3A, 15 mass-% anhydrite and 15 mass-% bassanite. Instead of ettringite much more gypsum hydrated from bassanite than in low-pH solutions.
20.6 20.8 21.0 21.2 21.4 21.6 21.8 22.0
angle 2°Θ (l = 1.04014 Å)
coun
ts a
nd ti
me
[h]
1:15water
injection
2:45
CsH0.5 204
C3A 521
AFt 304
Cs 012
C3A 250
CsH2 211
Fig. 5.35: Disturbed ettringite crystallization in Ca(OH)2-saturated aqueous solution. Bassanite is consumed in gypsum formation.
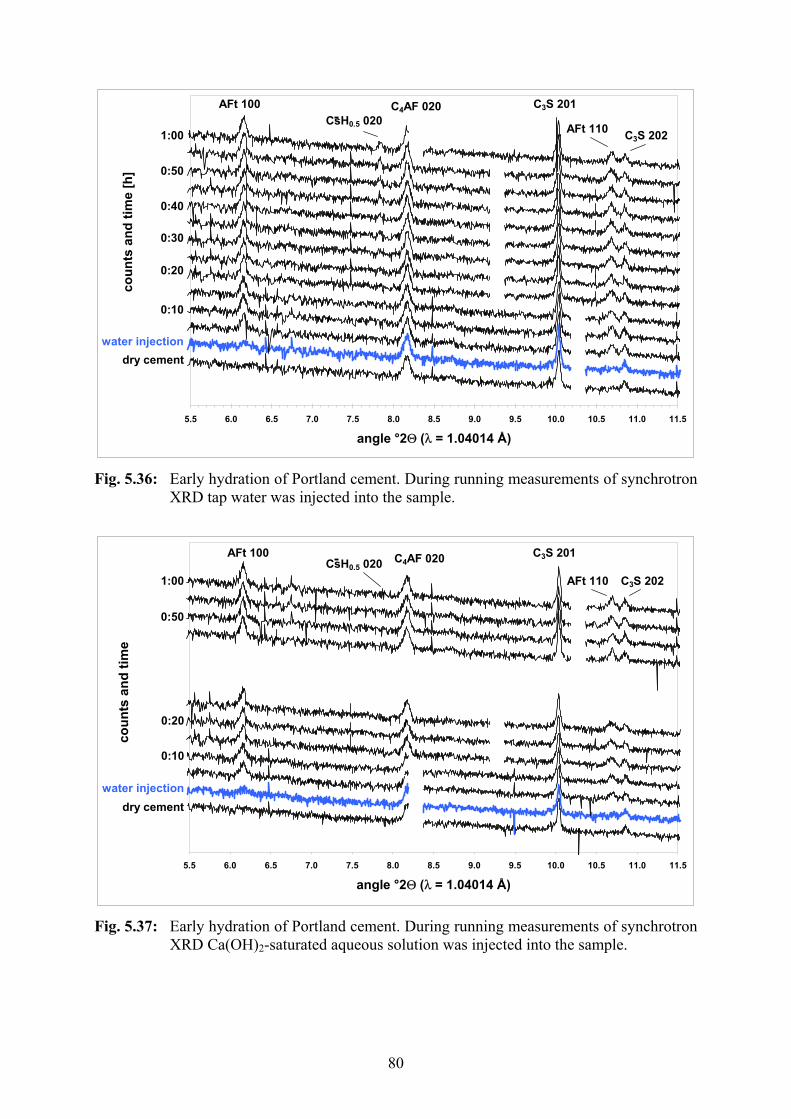
80
5.5 6.0 6.5 7.0 7.5 8.0 8.5 9.0 9.5 10.0 10.5 11.0 11.5
angle °2Θ (λ = 1.04014 Å)
coun
ts a
nd ti
me
[h]
dry cementwater injection
0:20
0:10
0:30
1:00
0:40
0:50
AFt 100 C4AF 020CsH0.5 020
C3S 201
AFt 110 C3S 202
Fig. 5.36: Early hydration of Portland cement. During running measurements of synchrotron XRD tap water was injected into the sample.
5.5 6.0 6.5 7.0 7.5 8.0 8.5 9.0 9.5 10.0 10.5 11.0 11.5
angle °2Θ (λ = 1.04014 Å)
coun
ts a
nd ti
me
dry cementwater injection
0:20
0:10
1:00
0:50
AFt 100 C4AF 020CsH0.5 020C3S 201
AFt 110 C3S 202
Fig. 5.37: Early hydration of Portland cement. During running measurements of synchrotron XRD Ca(OH)2-saturated aqueous solution was injected into the sample.
81
1000
2000
3000
4000
5000
6000
7000
8000
5 15 25 35 45 55 65 75 85 95 105 115 125 135angle °2Θ (λ = 1.8857 A)
coun
ts
D2O noise
AlMg-alloy CH 110
CH 104
CH 101
AlMg-alloy
AlMg-alloy
CH 300
Fig. 5.38: Neutron diffraction pattern of a cement without CE after 24 hours hydration time in a slurry with heavy water (D2O). Indicated are the strongest peaks of portlandite and the AlMg-alloy, the material of the sample carrier.
5.2.6 Thermal Neutron Powder Diffraction
During the work at the SLS there was also the opportunity to monitor cement hydration by
thermal neutron diffractometry at a wavelength of 0.18857 nm (1.8857 Å). Neutron
diffraction follows Bragg´s law like X-ray diffraction. That means that the peak positions
plotted over dhkl are principally the same in both methods. While X-rays are diffracted by the
electron shells, neutrons are scattered by collision with the atom cores. This results in
different intensities at the same d-position. The differences can be enormous since very low
intensities down to zero might occur with one method while the other gives a distinct peak at
same d-value.
A disadvantage of neutron diffractometry is the long integration time of 30 minutes and the
lower spatial resolution (1200 channels/160°2Θ), both caused by less intense radiation.
Nevertheless a pilot test using an aged sample from earlier synchrotron measurements was
promising despite of the long integration time. The ettringite and portlandite peaks were much
stronger than measured with X-rays. Neutron diffractometry put emphasis on phases with
light elements especially with water because the impulse transmission from nucleus to
neutron is the better the closer the atomic mass is to that of the neutron. Hydrogen works best.
To avoid high background from pore water, heavy water (D2O) with lower refractive capacity
was used. The hydration of cement took place in heavy water over 24 hours. It was assumed
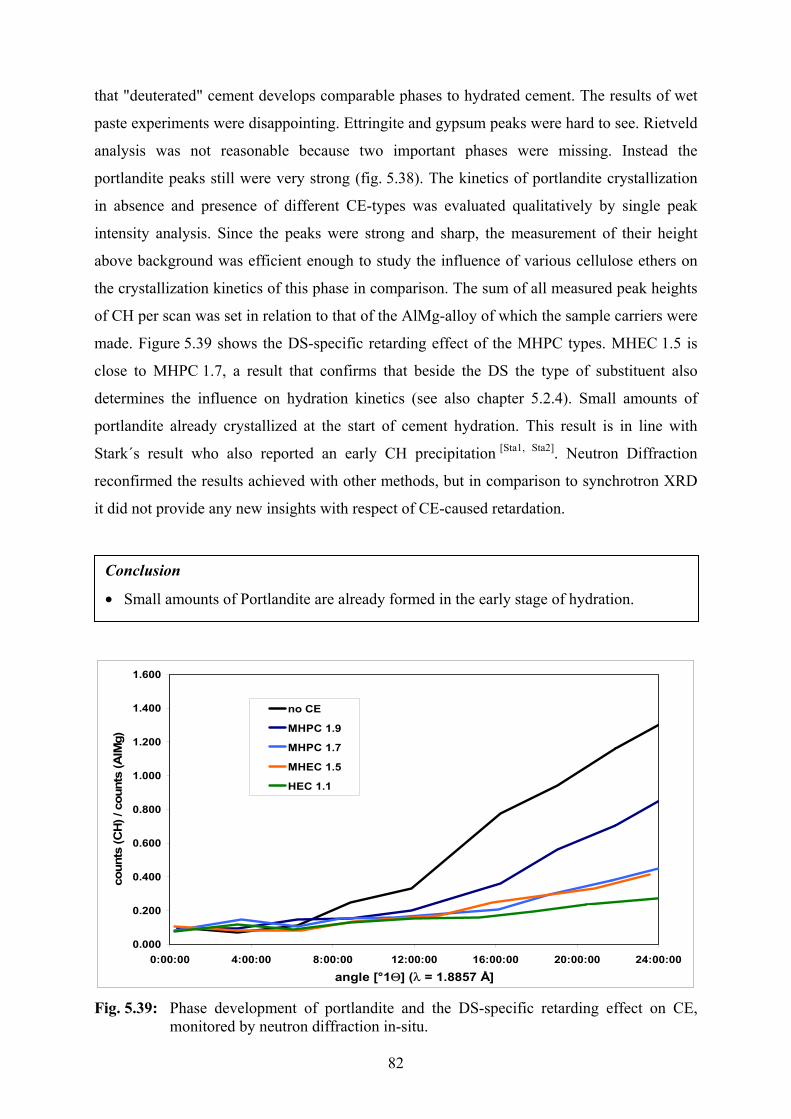
82
that "deuterated" cement develops comparable phases to hydrated cement. The results of wet
paste experiments were disappointing. Ettringite and gypsum peaks were hard to see. Rietveld
analysis was not reasonable because two important phases were missing. Instead the
portlandite peaks still were very strong (fig. 5.38). The kinetics of portlandite crystallization
in absence and presence of different CE-types was evaluated qualitatively by single peak
intensity analysis. Since the peaks were strong and sharp, the measurement of their height
above background was efficient enough to study the influence of various cellulose ethers on
the crystallization kinetics of this phase in comparison. The sum of all measured peak heights
of CH per scan was set in relation to that of the AlMg-alloy of which the sample carriers were
made. Figure 5.39 shows the DS-specific retarding effect of the MHPC types. MHEC 1.5 is
close to MHPC 1.7, a result that confirms that beside the DS the type of substituent also
determines the influence on hydration kinetics (see also chapter 5.2.4). Small amounts of
portlandite already crystallized at the start of cement hydration. This result is in line with
Stark´s result who also reported an early CH precipitation [Sta1, Sta2]. Neutron Diffraction
reconfirmed the results achieved with other methods, but in comparison to synchrotron XRD
it did not provide any new insights with respect of CE-caused retardation.
0.000
0.200
0.400
0.600
0.800
1.000
1.200
1.400
1.600
0:00:00 4:00:00 8:00:00 12:00:00 16:00:00 20:00:00 24:00:00
angle [°1Θ] (λ = 1.8857 Å]
coun
ts (C
H) /
cou
nts
(AlM
g)
no CE
MHPC 1.9
MHPC 1.7
MHEC 1.5
HEC 1.1
Fig. 5.39: Phase development of portlandite and the DS-specific retarding effect on CE, monitored by neutron diffraction in-situ.
Conclusion
• Small amounts of Portlandite are already formed in the early stage of hydration.

83
5.2.7 ESEM-FEG
ESEM-FEG images were taken from MHPC 1.7 and HEC 1.1 blended samples as well as
from a reference without CE. In the reference sample small and very few ettringite crystals
without distinct crystal morphology could already be seen after 15 min (fig. 5.40). First
needle-shaped CSH-crystals of sizes of about 500 nm appeared after 4 hours (fig. 5.41). At
this time ettringite appeared as short prismatic hexagonal crystals. After 7 hours of hydration
(fig. 5.42) the cement particles were densely covered with CSH-needles and large CH crystals
appeared in former voids. The MHPC 1.7 sample showed a similar picture as the reference
after 15 minutes. After 4 hours of hydration the very first tiny CSH needles could be
observed. They were smaller and fewer than those of the reference after the same time of
hydration. Three hours later the CSH crystals had grown and their number increased. But the
cover of the primary clinker particles is not as dense as it was in the reference sample at the
same hydration time. HEC 1.1 showed the strongest retardation effect. Even at a hydration
time of 4 hours, CSH could not be observed. At 7 h the state of hydration is similar to the
state of the MHPC 1.7 sample at 4 h (fig. 5.43 - 5.47).
Samples containing cellulose ethers showed a homogeneous, massy texture 15 minutes
after stirring. In contrast, the texture of the reference sample without CE was inhomogeneous.
Particles agglomerated in clusters with larger voids in between (fig. 5.48, 5.49). This confirms
that the cohesion within the paste is improved in presence of CE as could be seen during
ultrasonic measurements (chapter 5.2.1). This correlates with the results of SEM studies made
by Ridi et al. [Rid1] who described the texture of cementitious extrusion pastes as more dense
in presence of MHEC than without CE.
Conclusions
• The primary clinker particles are less densely covered by hydrated phases in presence of
CE than in samples without CE at any time of hydration. The amount of hydration
products depends on the DS of the added CE. The lower the DS the less hydration
products precipitate at the same hydration time.
• CE-blended cement samples have a homogenous texture. Samples without CE show
particles agglomerated in clusters with large gaps between. This confirms the improved
cohesion of the particles within the cement in presence of CE.
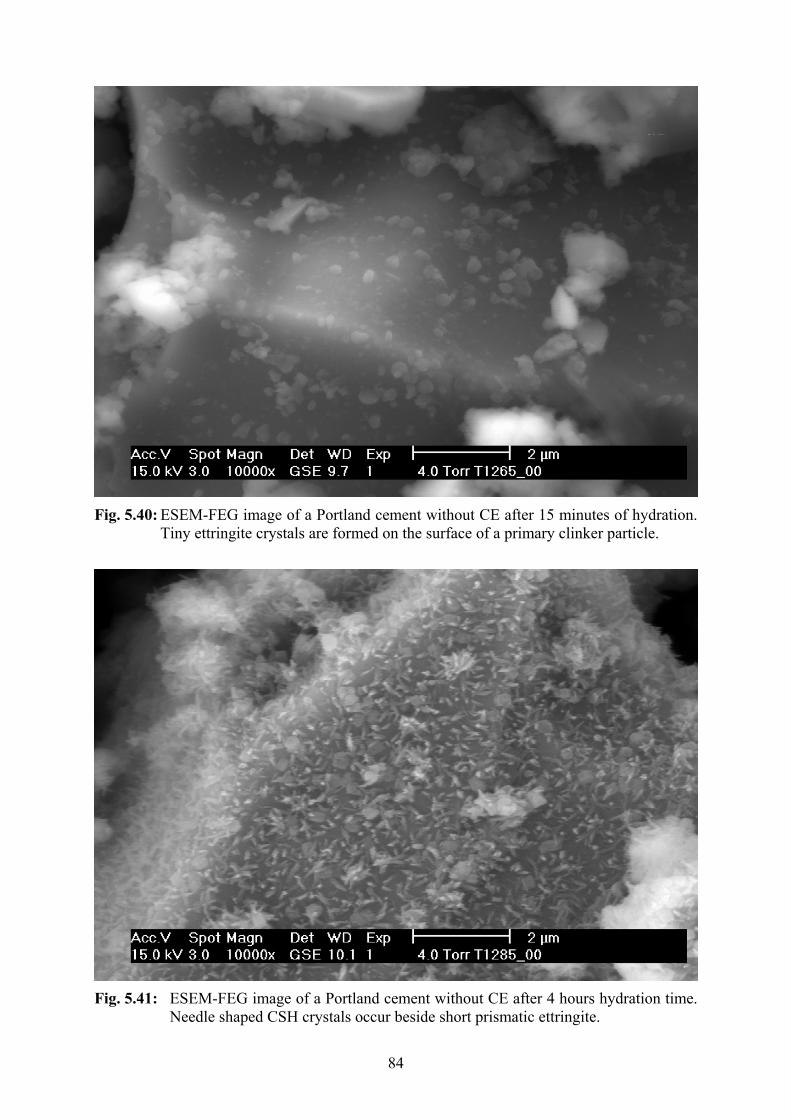
84
Fig. 5.40: ESEM-FEG image of a Portland cement without CE after 15 minutes of hydration.
Tiny ettringite crystals are formed on the surface of a primary clinker particle.
Fig. 5.41: ESEM-FEG image of a Portland cement without CE after 4 hours hydration time. Needle shaped CSH crystals occur beside short prismatic ettringite.

85
Fig. 5.42: ESEM-FEG image of a Portland cement without CE after 7 hours hydration time. The primary cement particles are densely covered by needle-shaped CSH crystals. A big CH crystal can be seen on the left side.
Fig. 5.43: Portland cement with MHPC 1.7 after 15 minutes hydration time.

86
Fig. 5.44: Portland cement with MHPC 1.7 after 4 hours hydration time.
Fig. 5.45: Portland cement with MHPC 1.7 after 7 hours hydration time.
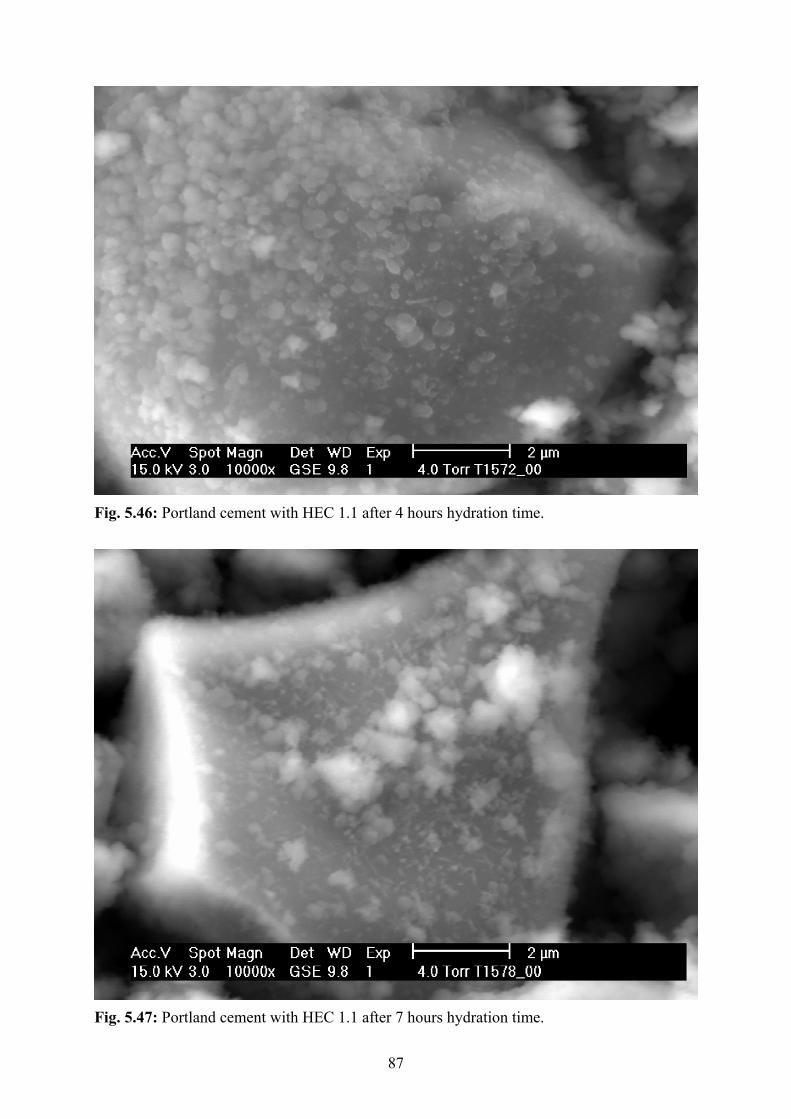
87
Fig. 5.46: Portland cement with HEC 1.1 after 4 hours hydration time.
Fig. 5.47: Portland cement with HEC 1.1 after 7 hours hydration time.
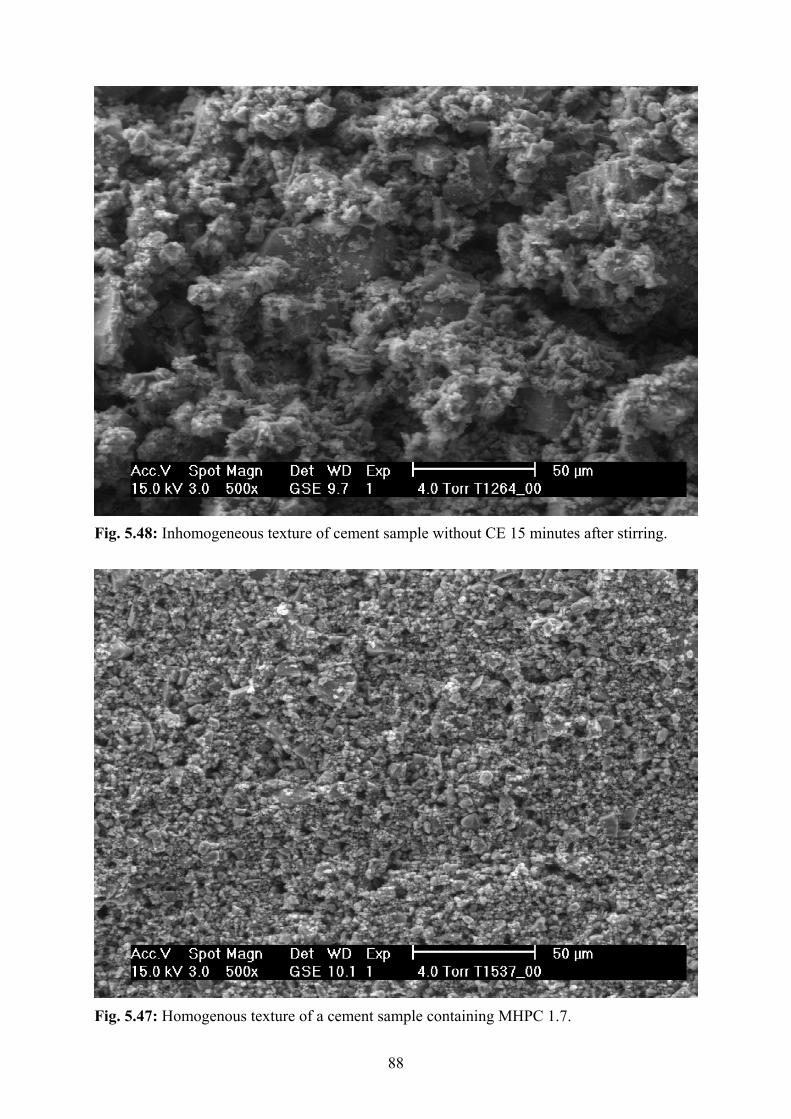
88
Fig. 5.48: Inhomogeneous texture of cement sample without CE 15 minutes after stirring.
Fig. 5.47: Homogenous texture of a cement sample containing MHPC 1.7.

89
6. Summary
6.1 Portland Cement Hydration without Cellulose Ether
During the hydration of the investigated Portland cement the following phase reactions were
observed within the first 24 hours:
C3A + C s H0.5 + H → AFt (1st generation) (1)
C s H0.5 + H → C s H2 (2)
C s + H → C s H2 (3)
C3A + C s H2 + H → AFt (2nd generation) (4)
C3S + H → CSH + CH (5)
In the reference sample without cellulose ethers these reactions took place as follows: The
first ettringite crystallization started immediately after water contact and last for about
10 minutes (1). Probably the anhydrite hardly contributed to this reaction since it was
significantly less reactive than the bassanite. After this process had stopped the supernatant
primary sulphate carriers (both) hydrated to gypsum until 4 hours (2 and 3). The different
activities of anhydrite and bassanite during reactions (1) to (3) is a conclusion from
experiments with pure phase mixtures of C3A, C s H0.5 and C s investigated by synchrotron
XRD (fig. 5.29 – 5.31). Figure 5.29 shows clearly that bassanite is consumed in ettringite
formation directly after water contact while anhydrite kept stable for a longer time. Anhydrite
dissolves much slower (fig. 5.31) at a time when gypsum appears (fig. 5.30).
After about 4 hours renewed ettringite growth occurred in OPC (4) contemporary with
portlandite precipitation (5). In the second ettringite formation gypsum is consumed.
Portlandite is a side product of calcium silicate hydration. In this case it was C3S that mostly
contributed to portlandite formation because C2S was much more stable within the first
24 hours of hydration (fig. 5.22). The formation of monosulphate and the hydration of
C2(A,F) were not observed in the given time. So far they correlate with the studies of
Scrivener [Scr1], Stark [Sta1, Sta2]. and Rothstein [Rot1].
In experiments with pure phase mixtures in tap water and without silicates the reaction of
C3A with calcium sulphates turned out to be a continuous process, combining reactions (1) to
(3) with only little gypsum formation (fig. 5.30). In calcium hydroxide saturated solution the
ettringite formation was strongly inhibited. Instead, bassanite hydrated to gypsum while
anhydrite kept stable (fig. 5.34, 5.35). Before gypsum formation no primary sulphate carrier
was consumed. Transferring these results to the reactions observed in Portland cement
hydration the author of the present study came to the conclusion that the ettringite formation
90
in cement was basically controlled by the level of Ca(OH)2-saturation in the pore water. Little
ettringite was formed in reaction (1) until the dissolution of C3S leads to Ca(OH)2-saturation.
The level of saturation decreased as portlandite (solid Ca-hydroxide) precipitated (5), thus
allowing ettringite to crystallize further (4). The question is if the high pH-level or the ion
concentration of Ca2+ controlled the ettringite precipitation. The answer was given by
Rothstein et al [Rot1]. Their studies showed that the pH-level was high at all times while the
Ca2+-concentration dropped down drastically with portlandite precipitation. Therefore the
author of the present study assumes that the Ca2+-concentration controls the ettringite
crystallization. A concentrated ion-solution decreases the solubility of solids that contain the
same ion components as the solution. Therefore the dissolution rates of Ca-sulphates or C3A
were decreased by high Ca2+-concentration in the pore water leading to a lack of either
sulphate- or aluminate-components for ettringite formation. Since the sulphates hydrated to
gypsum, a dissolution-precipitation-process, it was rather the C3A that was inhibited to
dissolve and therefore there was probably not sufficient amount of the aluminate component
dissolved in water for ettringite growth. Evidence for a lack of dissolved aluminium
component to be responsible for the disturbed ettringite formation during the dormiant period
of Portland cement hydration is the fact that ettringite formation can be increased by the
addition of Al(OH)3 as described in chapter 5.2.3. The solubility of aluminium hydroxide, a
further aluminium source for ettringite formation, did not seem to be affected by a high
Ca(OH)2 saturation level in the pore solution.
Conclusions
• Ettringite crystallization is controlled by the Ca(OH)2-saturation level.
• A high Ca(OH)2-concentration in the pore water inhibits the dissolution of C3A, leading
to a lack of dissolved aluminate component needed for ettringite crystallization.
• The lack of dissolved aluminate component can be compensated by adding Al(OH)3.

91
6.2 CE-caused Retardation
Cellulose ethers showed a retarding effect on cement hydration. As a result of this study one
key parameter is the degree of substitution: the lower the DS the stronger the retardation. This
result was confirmed by independent experimental methods such as ultrasonic and
calorimetric measurements, laboratory and synchrotron X-ray diffraction as well as neutron
diffractometry and environmental scanning electron microscopy. Those results were also
confirmed by the studies of Pourchez [Pou1] and Haecker [Hae2]. The influence on single
reactions during hydration was differentiated. The first ettringite formation in Portland cement
was not affected at all by the presence of CE. This result correlates with those of
Peschard [Pes1]. Since only little ettringite was formed at this point of hydration the residual
sulphates reacted with water to gypsum. This reaction was slightly retarded by CE depending
on the degree of substitution. This is in agreement with the study by Brandt [Bra2]. The
renewed ettringite crystallization is strongly retarded by cellulose ethers as a function of DS.
Generally, the lower the DS the stronger the retardation. MHPCs showed stronger effects than
MHECs. The delay of second ettringite formation correlated with the strong CE-caused
retardation of portlandite precipitation. Pure phase experiments using HFC confirmed the DS-
specific strong retardation of C3S hydration but showed only a weak and DS-unspecific effect
on the hydration of C3A in presence of sulphates and in absence of silicates. The latter effect
is ascribed to an unspecific influence of increased viscosity of the pore solutions with reduced
ion mobility. As discussed earlier, second ettringite formation takes always place
contemporaneously with portlandite precipitation and a steep decline of the Ca2+-
concentration in the pore water. It is assumed that by retarding the CH precipitation, together
with a delay of CSH formation, the decline of the Ca2+-concentration in the pore solution was
also delayed. Thus the second ettringite crystallization was indirectly retarded by CE in the
presence of silicates. This would also explain that the retarding effect of CE on the reaction of
calcium aluminate with sulphates in absence of silicates (chapter 5.2.2) is weak and
unspecific.
Cellulose ethers retard the C3S hydration significantly, in Portland cement as well as the
pure phase. The lower the degree of substitution the stronger the retarding effect. MHPCs
have a stronger retarding effect than MHECs at same DS. C3A hydration is indirectly affected
by CE in Portland cement, while the retarding effect on the hydration process in pure phase
mixtures is weak and independent of the DS.

92
Conclusions
• The DS-specific retarding effect of cellulose ethers is confirmed by several independent
investigation methods: ultrasonic, HFC, laboratory and synchrotron XRD, n-diffraction
and ESEM-FEG imaging.
• CEs have a direct retarding effect on C3S hydration: The lower their DS the stronger the
retardation.
• The C3A hydration in Portland cement is controlled by the Ca(OH)2-saturation level in
the pore water with an indirect influence of CE.
• The Ca(OH)2-saturation level in the pore water is affected by the presence of CE
depending on the degree of substitution. CE retards the portlandite precipitation DS-
specifically. The delayed CH precipitation leads to delayed decrease of Ca(OH)2-
concentration in the pore water. Thus the second ettringite formation is retarded, too.
93
6.3 CE-adsorption
The DS-specific retardation of Portland cement could be ascribed to the differentiated
adsorption behaviour of cellulose ethers on the surfaces of cement phases. The highest
amount of CE adsorbed was found on C3S. The lower the DS the more CE was adsorbed. The
C3S hydration was mostly affected by the cellulose ether DS-specifically. High amounts of
CE also adsorbed on portlandite but the adsorption was DS-independent. A DS-specific
adsorption was found on gypsum but with significantly smaller amounts than on C3S.
Gypsum crystallization was moderately and DS-specifically retarded in OPC. No adsorption
of CE at all was found on ettringite. CE did not effect the first ettringite crystallization, the
second ettringite formation was indirectly affected as discussed earlier.
The conclusion suggests that the adsorbed cellulose ether on the surfaces of the cement
phases retards the crystal growth of the hydration product. Strong adsorption was found on
C3S and portlandite and the C3S hydration was strongly retarded. The DS-dependence of this
retardation could not be explained by CE-adsorption on portlandite since it was DS-
independent. But the strong adsorption on C3S could be correlated with the degree of
substitution. The adsorption behaviour of cellulose ethers on CSH-phases could not be
determined. For gypsum and ettringite the relation between adsorption and retardation is
obvious: moderate and DS-specific adsorption on and retardation of the gypsum, no
adsorption and no direct effect on the ettringite. The CE-caused effects on the cement phases
and their hydration processes are summarized in table 6.1.
The CE-adsorption on the surfaces of cement phases apparently increased with proceeding
hydration time. Two different mechanisms might be responsible for this effect: 1. The steadily
increasing total surface area with proceeding precipitation of tiny crystals of the hydration
products. 2. Once a cellulose ether molecule was adsorbed on the surface of a growing crystal
it could even be incorporated as inclusion as the crystal growth proceeded. The increasing
amount of included molecules would then be falsely counted as "adsorbed on surface". The
outward growing surface is covered by further molecules.
Comparison of the molecular weight distribution of CE dissolved in pore solution before
and after adsorption experiments showed that smaller molecules adsorbed on portlandite
preferentially, depending on the CE/portlandite ratio. The higher the ratio the more smaller
molecules adsorbed on the mineral surface. The molecular weight distribution of the adsorbed
polymers did not affect the total amount in mass per surface area of adsorbed CE.
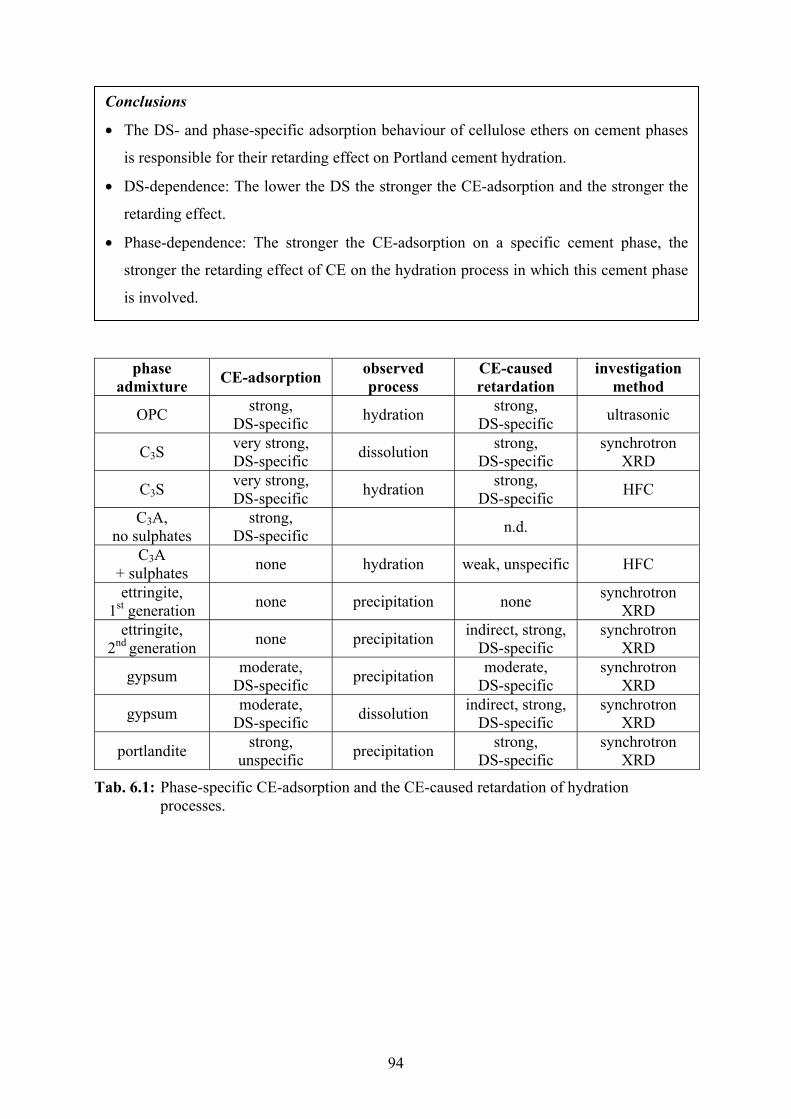
94
phase admixture CE-adsorption observed
process CE-caused retardation
investigation method
OPC strong, DS-specific hydration strong,
DS-specific ultrasonic
C3S very strong, DS-specific dissolution strong,
DS-specific synchrotron
XRD
C3S very strong, DS-specific hydration strong,
DS-specific HFC
C3A, no sulphates
strong, DS-specific n.d.
C3A + sulphates none hydration weak, unspecific HFC
ettringite, 1st generation none precipitation none synchrotron
XRD ettringite,
2nd generation none precipitation indirect, strong, DS-specific
synchrotron XRD
gypsum moderate, DS-specific precipitation moderate,
DS-specific synchrotron
XRD
gypsum moderate, DS-specific dissolution indirect, strong,
DS-specific synchrotron
XRD
portlandite strong, unspecific precipitation strong,
DS-specific synchrotron
XRD
Tab. 6.1: Phase-specific CE-adsorption and the CE-caused retardation of hydration processes.
Conclusions
• The DS- and phase-specific adsorption behaviour of cellulose ethers on cement phases
is responsible for their retarding effect on Portland cement hydration.
• DS-dependence: The lower the DS the stronger the CE-adsorption and the stronger the
retarding effect.
• Phase-dependence: The stronger the CE-adsorption on a specific cement phase, the
stronger the retarding effect of CE on the hydration process in which this cement phase
is involved.
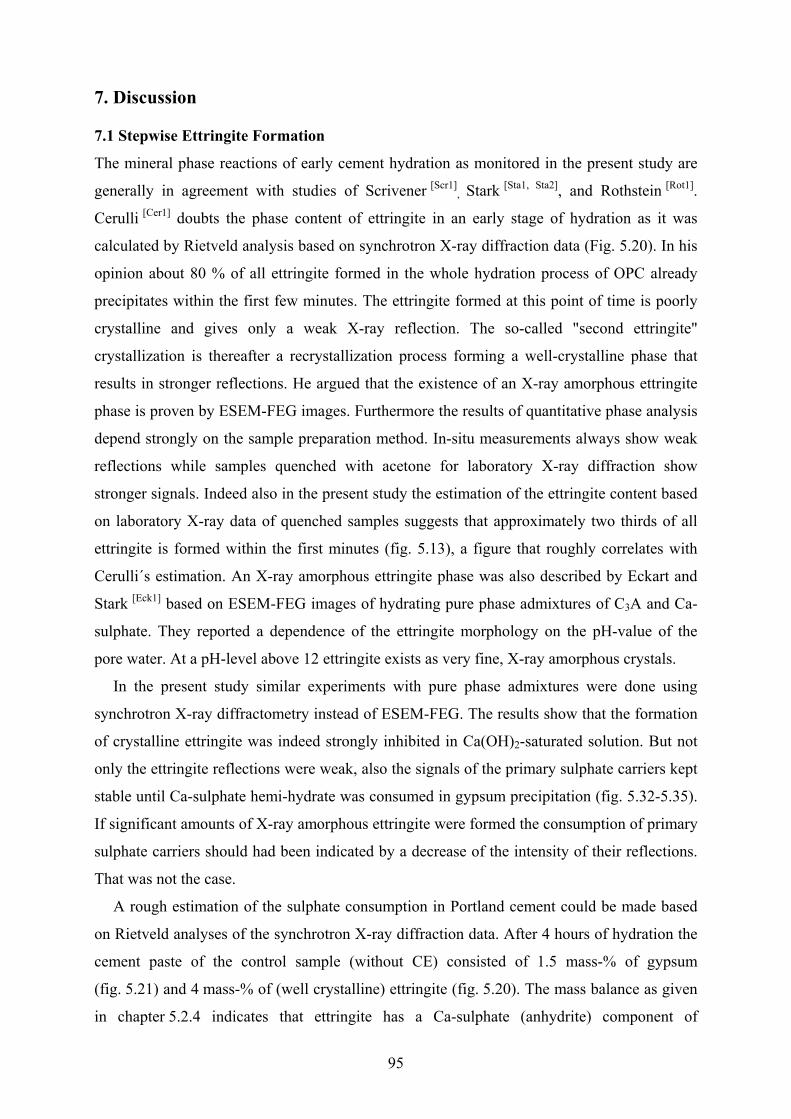
95
7. Discussion
7.1 Stepwise Ettringite Formation
The mineral phase reactions of early cement hydration as monitored in the present study are
generally in agreement with studies of Scrivener [Scr1], Stark [Sta1, Sta2], and Rothstein [Rot1].
Cerulli [Cer1] doubts the phase content of ettringite in an early stage of hydration as it was
calculated by Rietveld analysis based on synchrotron X-ray diffraction data (Fig. 5.20). In his
opinion about 80 % of all ettringite formed in the whole hydration process of OPC already
precipitates within the first few minutes. The ettringite formed at this point of time is poorly
crystalline and gives only a weak X-ray reflection. The so-called "second ettringite"
crystallization is thereafter a recrystallization process forming a well-crystalline phase that
results in stronger reflections. He argued that the existence of an X-ray amorphous ettringite
phase is proven by ESEM-FEG images. Furthermore the results of quantitative phase analysis
depend strongly on the sample preparation method. In-situ measurements always show weak
reflections while samples quenched with acetone for laboratory X-ray diffraction show
stronger signals. Indeed also in the present study the estimation of the ettringite content based
on laboratory X-ray data of quenched samples suggests that approximately two thirds of all
ettringite is formed within the first minutes (fig. 5.13), a figure that roughly correlates with
Cerulli´s estimation. An X-ray amorphous ettringite phase was also described by Eckart and
Stark [Eck1] based on ESEM-FEG images of hydrating pure phase admixtures of C3A and Ca-
sulphate. They reported a dependence of the ettringite morphology on the pH-value of the
pore water. At a pH-level above 12 ettringite exists as very fine, X-ray amorphous crystals.
In the present study similar experiments with pure phase admixtures were done using
synchrotron X-ray diffractometry instead of ESEM-FEG. The results show that the formation
of crystalline ettringite was indeed strongly inhibited in Ca(OH)2-saturated solution. But not
only the ettringite reflections were weak, also the signals of the primary sulphate carriers kept
stable until Ca-sulphate hemi-hydrate was consumed in gypsum precipitation (fig. 5.32-5.35).
If significant amounts of X-ray amorphous ettringite were formed the consumption of primary
sulphate carriers should had been indicated by a decrease of the intensity of their reflections.
That was not the case.
A rough estimation of the sulphate consumption in Portland cement could be made based
on Rietveld analyses of the synchrotron X-ray diffraction data. After 4 hours of hydration the
cement paste of the control sample (without CE) consisted of 1.5 mass-% of gypsum
(fig. 5.21) and 4 mass-% of (well crystalline) ettringite (fig. 5.20). The mass balance as given
in chapter 5.2.4 indicates that ettringite has a Ca-sulphate (anhydrite) component of

96
approximately 38 mass-%. Gypsum has a Ca-sulphate component of 93 mass %. Therefore
the mass content of Ca-sulphate bond in ettringite and gypsum after 4 hours of hydration was
2.9 mass-% in OPC which is fairly close to the 3 mass-% of primary sulphate carriers. This
did not leave much sulphate for the formation of X-ray amorphous ettringite. The existence of
an X-ray amorphous phase cannot be excluded. But if the formation of this phase does not
consume sulphate, it is reasonable to doubt in a chemical composition of that of ettringite.
Moeser [Moe1, Moe2] gave an explanation why ettringite and other cement phases occasionally
occur as poorly crystalline phases in ESEM-FEG images. The tiny crystals were destroyed by
the electron beam resulting in a change of the chemical composition and the loss of
crystallinity.
Stark et al. [Sta3] explained the stepwise growth of ettringite by changing accessibility of
C3A during the hydration process. The present work shows that the ettringite crystallization
could as well be controlled by the ion-concentration, especially the Ca2+-content in the pore
water. Lothenbach et al. [Lot1] showed that the thermodynamic modelling of the temporal
development of the equilibra between fluid and solid phases showed a good correlation with
the actual phase development in Portland cement.
The author of the present thesis comes to the conclusion that: 1. ettringite formation in
Portland cement is a process of two different crystal growth stages, 2. the crystal growth of
ettringite is controlled by the ion-saturation in pore water and not necessarily by
accessibilities of its educts, 3. X-ray amorphous ettringite does not exist in early hydration
stage of undisturbed cement and the second ettringite generation is no recrystallization
process since it would not correlate with the sulphate balance and therefore 4. the amount of
ettringite formed during first generation correlates with the results of quantitative phase
analysis based on in-situ synchrotron X-ray diffraction data.
7.2. Interactions of Cellulose Ethers with Cement.
It is generally accepted that cellulose ethers have a significant DS-specific retarding effect on
cement hydration mechanism. But the nature of the CE-cement interaction is subject of
controversial discussions. Some authors believe in alkaline degradation of CE in the pore
water of cement and ascribe the retarding effect to degradation products. The chemical
stability of CE against alkaline degradation is indeed a function of DS. The higher the DS the
stronger the CE´s resistance. Furthermore sugar acids as degradation products of
polysaccharides are well-known for their strong retarding effects on cement hydration.
Peschard et al [Pes1] followed this idea and found degradation products of dextrin and starch

97
ethers but not of cellulose ethers. This correlates with results achieved in this study where no
degradation of CE in highly alkaline solution within 24 hours was found (chapter 5.1).
Furthermore cellulose ethers are produced in high alkaline caustic soda for several hours at
temperatures above 100 °C. There is no reason why a molecule that survived this treatment
should give up within four hours at room temperature to let its degradation product retard the
portlandite formation in time.
Whether a chemical reaction between CE and the mineral phase on the surface of the
crystal take place as Coarna et al. [Coa1] assume based on electron spectroscopy data, could
neither be confirmed nor denied in the present study. Nevertheless a DS-specific adsorption
behaviour of cellulose ether is obvious since significant amounts of CE vanished from the
fluid phase (fig. 5.01). Whether the nature of CE-adsorption is rather more a physisorption or
chemisorption still remains unanswered.
Haecker [Hae2] agrees that both effects are DS-specific but in his opinion the CE-adsorption
is not necessarily the reason for retardation. He argues that the CE-caused retardation of
cement can still be enforced by increasing the CE/cement ratio above the maximum amount
of CE that can be adsorbed. However, cement hydration is a dynamic process which involves
neo-formation of hydrated phases. Therefore new surface area is generated continuously,
which is suitable for CE-adsorption. Dynamic adsorption experiments showed that the amount
of adsorbed CE increases with progressing hydration time. Figure 5.01 shows that
0.5 masspercent of HEC on Portland cement was completely adsorbed after 8 hours. That
means that from this point on, the pore solution was CE-free. Further crystallization processes
cannot be influenced by CE in solution anymore. A higher dosage level of CE would certainly
have affected the ongoing hydration process. An adsorption analysis after 4 hours showed that
30 masspercent of the added HEC was not adsorbed (at this point of time). Nevertheless this
30 % and probably more would have had a retarding effect on further processes. The
difficulty is to determine the maximum amount of CE that can be adsorbed in such a dynamic
process.
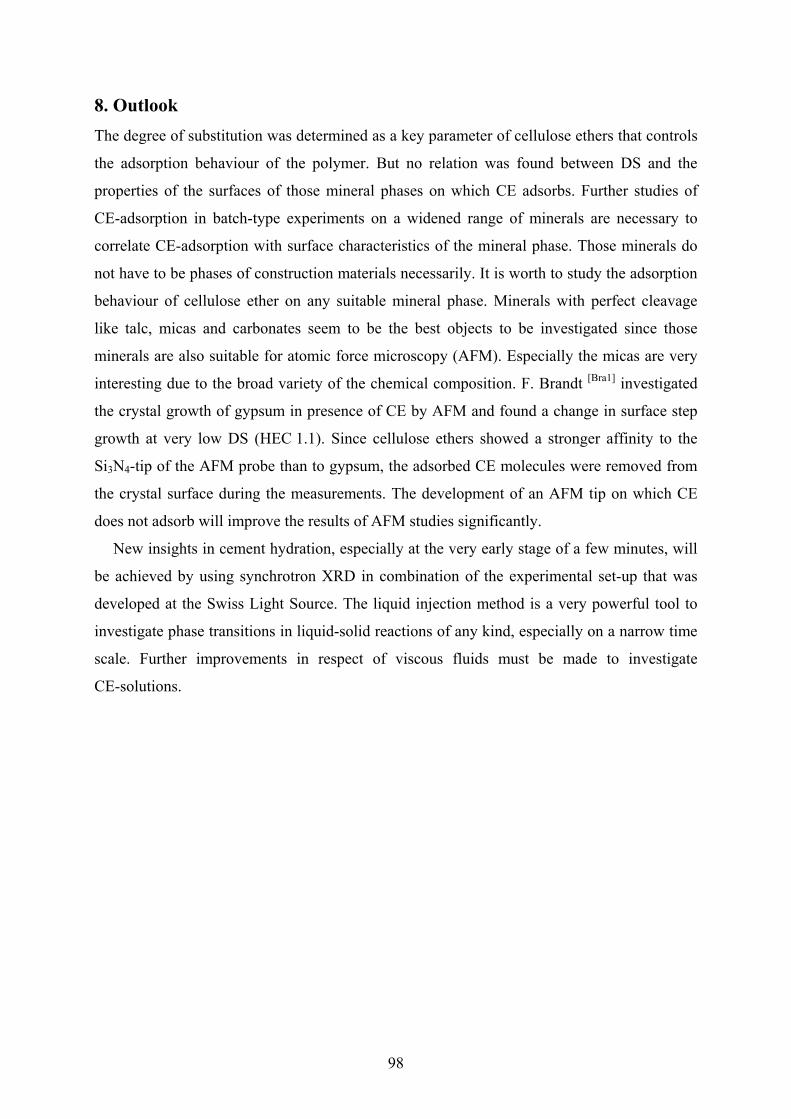
98
8. Outlook The degree of substitution was determined as a key parameter of cellulose ethers that controls
the adsorption behaviour of the polymer. But no relation was found between DS and the
properties of the surfaces of those mineral phases on which CE adsorbs. Further studies of
CE-adsorption in batch-type experiments on a widened range of minerals are necessary to
correlate CE-adsorption with surface characteristics of the mineral phase. Those minerals do
not have to be phases of construction materials necessarily. It is worth to study the adsorption
behaviour of cellulose ether on any suitable mineral phase. Minerals with perfect cleavage
like talc, micas and carbonates seem to be the best objects to be investigated since those
minerals are also suitable for atomic force microscopy (AFM). Especially the micas are very
interesting due to the broad variety of the chemical composition. F. Brandt [Bra1] investigated
the crystal growth of gypsum in presence of CE by AFM and found a change in surface step
growth at very low DS (HEC 1.1). Since cellulose ethers showed a stronger affinity to the
Si3N4-tip of the AFM probe than to gypsum, the adsorbed CE molecules were removed from
the crystal surface during the measurements. The development of an AFM tip on which CE
does not adsorb will improve the results of AFM studies significantly.
New insights in cement hydration, especially at the very early stage of a few minutes, will
be achieved by using synchrotron XRD in combination of the experimental set-up that was
developed at the Swiss Light Source. The liquid injection method is a very powerful tool to
investigate phase transitions in liquid-solid reactions of any kind, especially on a narrow time
scale. Further improvements in respect of viscous fluids must be made to investigate
CE-solutions.
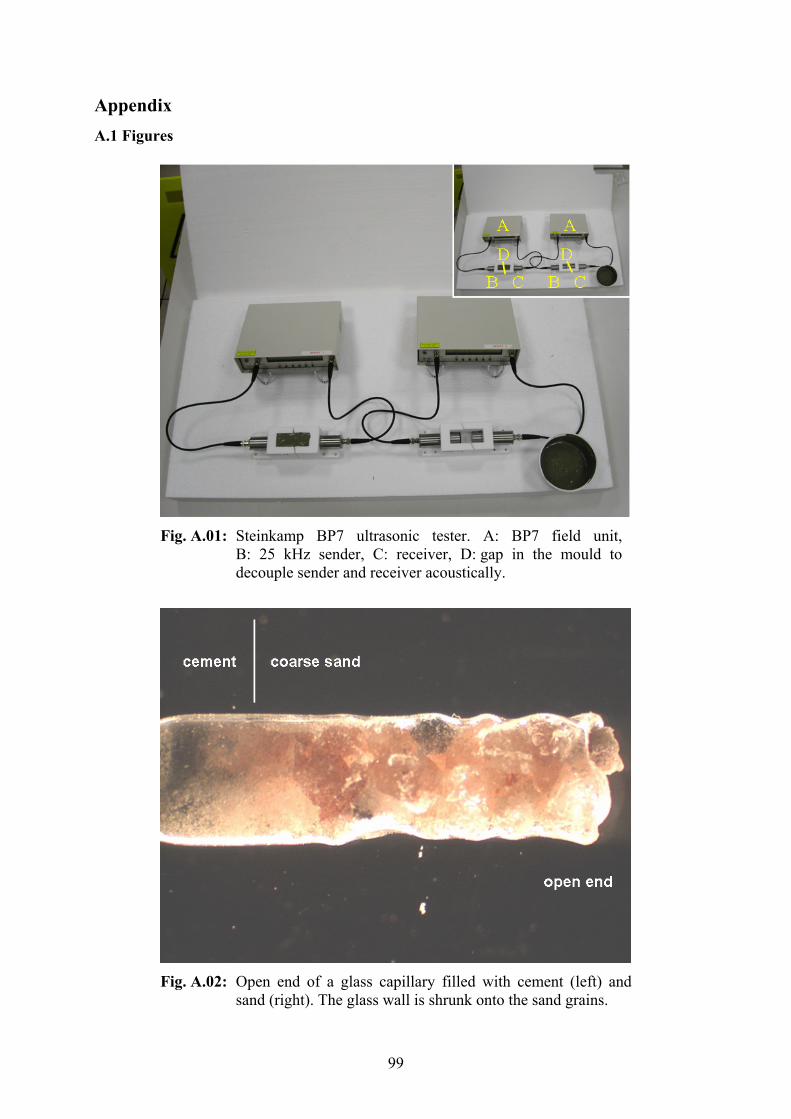
99
Appendix A.1 Figures
Fig. A.01: Steinkamp BP7 ultrasonic tester. A: BP7 field unit,
B: 25 kHz sender, C: receiver, D: gap in the mould to decouple sender and receiver acoustically.
Fig. A.02: Open end of a glass capillary filled with cement (left) and
sand (right). The glass wall is shrunk onto the sand grains.

100
A
B
C
D
E F
G
A
B
C
D
E F
G
A
B
C
D
E F
G
Fig. A.03: Diffractometer at the SLS Material Science Beamline.
A: beam pipe flooded with Helium E: primary beam stopper B: detector with high spatial resolution F: sample C: X-ray camera G: remote controlled step motor D: Mythen multistrip detector and syringe

101
AB
C
AB
C
Fig. A.04: Mythen detector modules.
A: detector strips; B: read out electronic; C: gap between two modules

102
A
B
D
CE F
G
H
I
A
B
D
CE F
G
H
I
A
B
D
CE F
G
H
I
Fig. A.05: Experimental setup with water injection device
A: beam pipe flooded with Helium F: sample with goniometer head B: detector with high spatial resolution and hose adapter C: X-ray camera G: remote controlled step motor D: Mythen multistrip detector H: syringe E: primary beam stopper I: flexible hose
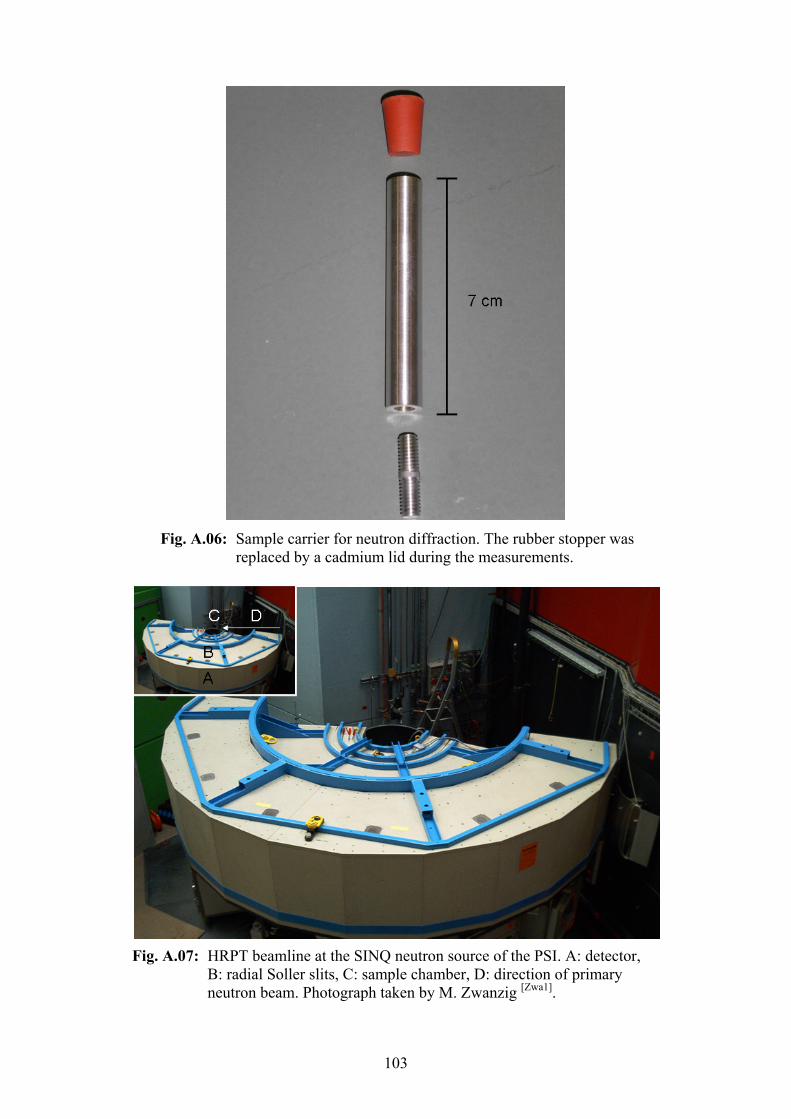
103
Fig. A.06: Sample carrier for neutron diffraction. The rubber stopper was
replaced by a cadmium lid during the measurements.
Fig. A.07: HRPT beamline at the SINQ neutron source of the PSI. A: detector, B: radial Soller slits, C: sample chamber, D: direction of primary neutron beam. Photograph taken by M. Zwanzig [Zwa1].

104
A.2 Abbreviations A ceramic formula for Al2O3 AD anno Domini AFm calcium aluminate ferrite monosulphate hydrate AFM atomic force microscopy AFt calcium aluminate ferrite tri-sulphate hydrate approx. approximately aq. aqueous BC before Christ BET Brunauer, Emmet and Teller C ceramic formula for CaO C3A tri-calcium aluminate C2(A,F) calcium aluminate ferrite C4AF calcium aluminate ferrite CAH calcium aluminate hydrate CE cellulose ether CEReM Consortium d'études et de recherches des mortiers conc. concentration, concentrated C s calcium sulphate C s H0.5 calcium sulphate hemi-hydrate C s H2 calcium sulphate di-hydrate C2S di-calcium silicate C3S tri-calcium silicate CSH calcium silicate hydrate DIN German standard DMG Deutsche Mineralogische Gesellschaft DP degree of polymerization DS degree of substitution DTG differential thermo-gravimetry eg. example given, for example EMRS European Material Research Society EN European standard ESEM environmental scanning electron microscopy EU European Union F ceramic formula for Fe2O3 FEG field emission gun fig. figure form. formulation FZK Forschungszentrum Karlsruhe g standard gravity force, g = 9.81 Nm GDCh Gesellschaft Deutscher Chemiker H water (ceramic formula) HEC hydroxy-ethylcellulose HFC heat flux calorimetry HPLC high pressure liquid chromatography HRPT high resolution powder diffraction of thermal neutrons HS highly substituted ICDD International Centre for Diffraction Data i.e. id est, that means INE Institut fuer Nukleare Entsorgung, FZK
105
K ceramic formula for K2O lab laboratory l/s liquid/solid ratio M ceramic formula for MgO MC methylcellulose MHEC methyl-hydroxy-ethylcellulose MHPC methyl-hydroxy-propylcellulose MS molar substitution n.d. not determined no. number OPC ordinary Portland cement PSI Paul Scherrer Institut PSD particle size distribution p page pp pages PSI Paul-Scherrer-Institut rpm rounds per minute SEM scanning electron microscopy SEC size exclusion chromatography SI saturation index SINQ neutron source of the PSI SLS Swiss Light Source sol. solution SSP Swiss Society of Physics tab. table U.S. United States (of America) VDZ Verein Deutscher Zementwerke WR water ratio WRV water retention value w/s water/solid ratio XRD X-ray diffraction XRF X-ray fluorescence Other abbreviations used in the text are international standardized symbols such as SI-units or chemical elements.

106
A.3 References [Alw1] Al-Wakee, E.I., El-Deen, I.M.; El-Zayat, L.A. (2002); Polymers Modifiers in
Portland Cement Hydration; Egypt. J. Chem., 45, No. 3; pp 463-482 [Ama1] Amathieu, L.; Estienne, F. (2003); Impact of the conditions of ettringite formation on
the performance of products, based on CAC + C$ + OPC; 15. Internationale Baustofftagung; F.A. Finger-Institut f. Baustoffkunde; Tagungsbericht Bd. 1
[Aza1] Azaroff, L. (1968); Elements of X-ray Crystallography, pp 365-367; McGraw-Hill Book Co.; Library of Congress Catalogue Card No. 68-11600
[Bar1] Barnett, S.; Database of Cement Mineral Synthesis; http://www.abdn.ac.uk/chemistry/research/cement/dcc/dcms/data/ettringite.html
[Bay1] Bayer, R; Lutz, R; Dry Mortars; Ullmannn´s Encyclopaedia of Industrial Chemistry, Vol. 9
[BGG1] (1995); Gips-Datenbuch; Bundesverband der Gips- und Gipsbauplattenindustrie e.V. (editor), Birkenweg 13, D-64295 Darmstadt
[Bos1] Bosbach, D.; Hochella, M. F., Jr. (1996) Gypsum growth in the presence of growth inhibitors: a scanning force microscopy study; Chemical Geology 132 (1996), pp 227-236
[Bra1] Bragg, W.L. (1943); The Diffraction of Short Electromagnetic Waves by a Crystal; Science in Britain, Institute of Physics, London
[Bra2] Brandt, F. (2000); Crystallisation of gypsum in presence of cellulose ethers; diploma thesis, Inst. f. Min., Univ. Muenster, not published
[Bru1] Brunauer, S.; Emmet, P.H.; Teller, E. (1938); Adsorption of Gases in Multimolecular Layers; J. Am. Chem. Soc. 60, pp 309-319
[Cer1] Cerulli, T. (2005); private communication; Milan, Feb. 15th 2005 [Chr1] Christensen, A.N.; Jensen, T.R.; Hanson, J.C. (2003); Formation of ettringite,
Ca6Al2(SO4)3(OH)12⋅26H2O, AFt and monosulphate, Ca4Al2O6(SO4)⋅14H2O, in hydrothermal hydration of Portland cement and of calcium aluminium oxide-calcium sulphate dihydrate mixtures studied by in situ synchrotron X-ray powder diffraction; Jour. Solid State Chem. 177, pp 1944-1951
[Coa1] Coarna, M.; Georgescu, M.; Puri, A.; Diaconu, D. (2004); ESCA, MIP and Mechanical Characterisation of Some Portland Cement - Methyl-Cellulose Composites; Key Engineering Materials, Vols. 264-268, pp 2153-2156
[Cro1] Croessmann, F.; Klaus, W. (1975); Wasserloesliche Celluloseaether im Spiegel der Anwendungstechnik; collection of publications by a group of authors of Kalle, branch of Hoechst AG, Wiesbaden-Biebrich
[Dye1] Dyer, D.; Sicilia, D.B. (1990); Labors of a modern Hercules, Evolution of a Chemical Company; Harvard Business School Press; ISBN 0 87584 227 5
[Eck1] Eckart, A.; Stark, J.; Betrachtung der Hydratationsprodukte des Calciumaluminats und des Calciumferrits im ESEM-FEG;
[Irs1] Irsch, H.-P. (2000); Die Entwicklung der Moertel-, Misch- und Verputztechnik unter Verwendung von Werktrockenmoertel; 14. Internationale Baustofftagung; F.A. Finger-Institut f. Baustoffkunde; Tagungsbericht Bd. 2
[Ger1] Gerthsen; Kneser; Vogel, H. (1986); Physik, 15th edition; chapter 11.3.2., p 554 and chapter 13.3.3, pp 659-663; Springer Verlag; ISBN 3 540 16155 4 (Berlin); ISBN 0 387 16155 4 (N.Y.)
[Goz1] Gozzo, F.; Schmitt, B.; Bortolamedi, T.; Giannini, G.; Guagliardi, A.; Lange, M.; Meister, D.; Maden, D.; Willmott; P.; Patterson, B.D. (2004); First experiments at the Swiss Light Source Materials Science beamline powder diffractometer; Journal of Alloys and Compounds 362, pp 206-217

107
[Hae1] Haecker, C.-J.; Bentz, D. P. (2000); Einfluss des Sulfattraegers (Menge und Modifikation) auf die Hydratation von Portlandzement: Experimentelle Untersuchungen und Computersimulationen; 14. Internationale Baustofftagung; F.A. Finger-Institut f. Baustoffkunde; Tagungsbericht Bd. 1
[Hae2] Haecker, C.-J.; private communication; Paris, March 11th 2005 [Han1] Hansi, W. (1974); Die wasseloeslichen Celluloseaether; Lehrbuch der Lacke und
Beschichtungen; Kittel, H. (editor); Vol. 1; Verlag W.A. Colomb, Oberschwandorf [Her1] Herb, A. T. (2003); Indirekt Beobachtung des Erstarrens und Erhaertens von
Zementleim, Moertel und Beton mittels Schallwellenausbreitung; PhD-thesis, Universitaet Stuttgart, Institut fuer Werkstoffe im Bauwesen
[Icd1] International Centre for Diffraction Data (2002); Powder Diffraction File; Release 2002, PDF-2
[Kue1] Kuehn, H.; Oelschlaeger, P. (1976); Technologie der Bindebaustoffe, Band 1, Eigenschaften, Rohstoffe, Erhaertung; VEB Verlag fuer Bauwesen Berlin
[Lec1] Lechner, M. D.; Gehrke, K.; Nordmeier (1996); Makromolekulare Chemie; Birkhaeuser Verlag, Basel; ISBN: 3 7643 5343 0
[Lot1] Lothenbach, B.; Winnefeld, F.; Holzer, L. (2003); Thermodynamische Modellierung der Hydratation von OPC; 15. Internationale Baustofftagung; F.A. Finger-Institut f. Baustoffkunde; Tagungsbericht Bd. 1
[Moe1] Moeser, B. (2003); Nano-Charakterisierung von Hydratphasen mittels Rasterelektronenmikroskopie; 15. Internationale Baustofftagung; F.A. Finger-Institut f. Baustoffkunde; Tagungsbericht Bd. 1
[Moe2] Moeser, B.; Stark, J. (2003); High Resolution Imaging of Wet Building Material Samples in their Natural State using Environmental Scanning Electron Microscope; 11th International Congress On The Chemistry Of Cement; Durban, South Africa
[Odl1] Odler, I. (2003); The BET-specific area of hydrated Portland cement and related materials; Cem. Concr. Res. 33, pp 2049-2056
[Pat1] Patterson, P.D., Gozzo, F.; Kuhne, H.; Lange, M.; Maden, D.; Meister, D.; Schmitt, B.; Spielmann, M.; Stampanoni, M.; Wilmott, P.R. (2004); The Material Science Beamline: recent developments; PSI Scientific Report 2003 / Vol. VII, ISSN 1660-4709; pp 5-6
[Pes1] Peschard, A.; Govin, A.; Fredon, E.; Grosseau, P.; Fantozzi, G. (2004); Influence of Polysaccharides on Cement Hydration; Key Engineering Materials, Vols. 264-268, pp.2141-2144
[Pla1] Plank, J.; Hirsch, C.; Winter, C.; Chatziagorastou, P. (2003); Neues zur Wirkungsweise von Polycarboxylat-basierten Fliessmitteln; 15. Internationale Baustofftagung; F.A. Finger-Institut f. Baustoffkunde; Tagungsbericht Bd. 1
[Pou1] Pourchez, J.; Peschard, A.; Grosseau, P.; Vallée, F. (2004); Cellulose ethers influence on cement hydration; CEReM Jour. 2004
[Pou2] Pourchez, J.; Govin, A.; Grosseau, P.; Guyonnet, R.; Guilhot, B.; Ruot, B. (2005); Alkaline stability of cellulose ethers and impact of their degradation products on cement hydration; Cement Research; in press
[Ran1] Ranke-Graves, R. (1936); I, Claudius; 9th edition; Arthur Barker (editor), London [Rid1] Ridi, F.; Fratini, E.; Mannelli, F.; Baglioni, P. (2005); Hydration Process of Cement
in Presence of a Cellulosic Additive. A Calorimetric Investigation; J. Phys. Chem. B 2005, 109, pp 14727-14737
[Rie1] Rietveld, H.M. (1967); Line profiles of neutron powder-diffraction peaks for structure refinement; Acta Cryst. 22, p 151
[Roe1] Roessler, C.; Stark, J. (2003); Der Einfluss von Fliessmitteln auf die Hydratation von Zement; 15. Internationale Baustofftagung; F.A. Finger-Institut f. Baustoffkunde; Tagungsbericht Bd. 1
108
[Rot1] Rothstein, D.; Thomas, J. J.; Christensen, B. J.; Jennings, H. M. (2002); Solubility behaviour of Ca-, S-, Al- and Si-bearing solid phases in Portland cement pore solutions as a function of hydration time; Cement and Concrete Research 32, pp 1663-1671
[Sch1] Schoene, M. (1979); Von der Leimabteilung zum groessten Klebstoffwerk Europas; Henkel KGaA, Duesseldorf; Stabsstelle fuer Oeffentlichkeitsarbeit/Werksarchiv
[Scr1] Scrivener, K.L. (1989); The Microstructure of Concrete; Materials Science of Concrete I; edited by Skalny, J.P.; American Ceramic Society, Westerville, OH
[Sie1] (2002) Siroquant Quantitative XRD Software, Version 2.5 for Windows, Sietronics Pty Ltd
[Sta1] Stark, J.; Moeser, B.; Eckart, A. (2000); Neue Ansaetze zur Zementhydratation; 14. Internationale Baustofftagung; F.A. Finger-Institut f. Baustoffkunde; Tagungsbericht Bd. 1
[Sta2] Stark, J.; Moeser, B.; Eckart, A. (2001); Zementhydratation - neue Ansaetze; ZKG International 01/2001 und 02/2001
[Sta3] Stark, J.; Moeser, B.; Bellmann, F. (2003); Ein neues Modell der Zementhydratation; 15. Internationale Baustofftagung; F.A. Finger-Institut f. Baustoffkunde; Tagungsbericht Bd. 1
[Ste1] Steinkamp, G. (1996); Messung des zeitlichen Verlaufs von Abbindevorgaengen mit dem micrcontroller-gesteuerten Ultraschallpruefgeraet BP-7; Prof. Dr.-Ing. Georg Steinkamp Labor fuer Technische Physik; Steingraben 5, D-28259 Bremen
[Str1] Struble, L.J. (1987); Proc. VIIIth International Congress on the Chemistry of Cement Vol. VI, pp 582-588
[Tay1] Taylor, H.F.W (1997); Cement Chemistry, 2nd edition; Thomas Telford Publishing; ISBN 0 7277 2592 0
[Tay2] Taylor, J.C.; Hinczak, I. (2001); Rietveld made easy; Sietronics Pty Ltd; ISBN 0 9750798 0 8
[VDZ1] Zement Taschenbuch 2002; Verein Deutscher Zementwerke e.V. (editor); Verlag Bau+Technik; ISBN 3 7640 427 4
[Vit1] Vitruv (1st century B.C.); De architectura [Wey1] Weyer, H.P.; Schmitt, B.; Mueller, I.; Bosbach, D.; Putnis, A. (2005); Time-resolved
monitoring of cement hydration: Influence of cellulose ethers on hydration kinetics; Nuclear Instruments and Methods (in press)
[Whi1] Whitfield, P.S.; Mitchell, L.D. (2003); Quantitative Rietveld analysis of the amorphous content in cements and clinkers; Jour. Mat. Sci. 38, pp 4415- 4421
[Wil1] Williams, P.J.; Biernacki, J.J; Bai, J.; Rawn, C.J. (2003); Assessment of a synchrotron X-ray method for quantitative analysis of calcium hydroxide; Cement and Concrete Research 33, pp1553-1559
[Win1] Winnefeld, F. Lothenbach, B.; Holzer, L.; Ploetze, M.; Rytz, G. (2003); Einfluss verschiedener Sulfattraeger auf die Hydratation von Portlandzement – eine praxisnahe Studie an Werkzementen; 15. Internationale Baustofftagung; F.A. Finger-Institut f. Baustoffkunde; Tagungsbericht Bd. 1
[Yos1] Yoshioka, K.; Tazawa, E.; Kawai, K.; Enohata, T. (2002); Adsorption characteristics of superplasticizers on cement component minerals; Cement and Concrete Research, Vol.32, pp 1507-1513
[You1] Young, R.A. (1993); The Rietveld Method; IUCR Monographs on Crystallography Vol. 5, Oxford University Press
[Zwa1] Zwanzig, M.; Blume, S.; Schwinning, B.; Stammen, C. (2003); Einfluss von wasserloeslichen Polymeren am Beispiel von Celluloseethern auf die Kristallisationskinetik der Hydratphasen im Zement; report of apprenticeship at the Heinrich-Hertz-Berufskolleg, Duesseldorf
109
A.4 Technical Equipment Sample preparation - Sartorius laboratory scale 0 - 2000 g ± 0.01 g, Sartorius microscale 0 - 500 g ± 0.0001 g, Braun multimix 350 W electric kitchen stirrer (Hercules) BET - Micromeritics Gemini with N2-supply, Micromeritics SmartPrep (Hercules) He-Pycnometry - Mycromeritics AccuPyc 1330 with He2-supply (Hercules) Laser-granulometry - Sympatec Gradis PFS (Hercules) Ultrasonic - Steinkamp BP 7 with 25 kHz transmitter set (Hercules) Size exclusion chromatography - Waters 2695 Separation Module, Waters 410 Differential Refractometer, Viscotec T 60 A Dual Detector (Hercules) Heat flux calorimetry - custom-made heatflux calorimeter built by H. J. Kuzel, Inst. f. Min., Universitaet Erlangen-Nuernberg (Hercules) Laboratory XRD - Panalytical (former Philips) X´pert PW3040 diffractometer (Inst. f. Min., Westfaelische Wilhelms-Universitaet Muenster) Synchrotron XRD - Swiss Light Source, Material Science Beamline, Mythen multistrip detector (PSI) Thermal neutron powder diffraction - SINQ neutron source, HRPT beamline (PSI) Environmental Scanning Electron Microscopy - Philips ESEM XL30 FEG. (VDZ) Photography - Minolta DiMAGE F200 (private) Software - Microsoft (MS) Windows NT, MS Windows 2000, MS Windows XP, Linux Red Hat, MS Office 2000, MS Office 97, MS Office 2003, Panatytical X´Pert, Sietronics Siroquant 2.5, Nero Burning Rom 6.0, Dell Image Expert Standard Edition, DiMage Viewer, several device-specific software (private, Hercules, Universitaet Muenster, PSI)

110
A.5 Co-operations Hercules Inc. Aqualon Division German Branch: Hercules GmbH Paul-Thomas-Str. 56 D-40599 Duesseldorf Westfaelische Wilhelms-Universitaet Muenster Institut fuer Mineralogie Corrensstr. 24 D-48149 Muenster Forschungszentrum Karlsruhe (FZK) Institut fuer Nukleare Entsorgung (INE) Postfach 3640 D-76021 Karlsruhe Paul Scherrer Institut (PSI) Swiss Light Source (SLS) and SINQ CH-5232 Villigen PSI Heinrich-Hertz-Berufskolleg Redinghovenstr. 16 D-40225 Duesseldorf Forschungsinstitut des Vereins Deutscher Zementwerke (VDZ) Tannenstr. 2 D-40476 Duesseldorf Roentgenlabor Dr. Ermrich Am Kandelborn 7 D-64354 Reinheim
In der Reihe "Karlsruher Geochemische Hefte" (ISSN 0943-8599) sind erschienen:
Band 1: U. Kramar (1993) Methoden zur Interpretation von Daten der geochemischen Bachsedimentprospektion am Beispiel der Sierra de San Carlos/ Tamaulipas Mexiko
Band 2: Z. Berner (1993) S-Isotopengeochemie in der KTB - Vorbohrung und Beziehungen zu den Spuren-elementmustern der Pyrite
Band 3: J.-D. Eckhardt (1993) Geochemische Untersuchungen an jungen Sedimenten von der Galapagos-Mikroplatte: Hydrothermale und stratigraphisch signifikante Signale
Band 4: B. Bergfeldt (1994) Lösungs- und Austauschprozesse in der ungesättigten Bodenwasserzone und Auswirkungen auf das Grundwasser
Band 5: M. Hodel (1994) Untersuchungen zur Festlegung und Mobilisierung der Elemente As, Cd, Ni und Pb an ausgewählten Festphasen unter besonderer Berücksichtigung des Einflusses von Huminstoffen.
Band 6: T. Bergfeldt (1995) Untersuchungen der Arsen- und Schwermetallmobilität in Bergbauhalden und kontaminierten Böden im Gebiet des Mittleren Schwarzwaldes.
Band 7: M. Manz (1995) Umweltbelastungen durch Arsen und Schwermetalle in Böden, Halden, Pflanzen und Schlacken ehemaliger Bergbaugebiete des Mittleren und Südlichen Schwarzwaldes.
Band 8: J. Ritter (1995) Genese der Mineralisation Herrmanngang im Albtalgranit (SE-Schwarzwald) und Wechselwirkungen mit dem Nebengestein.
Band 9: J. Castro (1995) Umweltauswirkungen des Bergbaus im semiariden Gebiet von Santa Maria de la Paz, Mexiko.
Band 10: T. Rüde (1996) Beiträge zur Geochemie des Arsens.
Band 11: J. Schäfer (1998) Einträge und Kontaminationspfade Kfz-emittierter Platin-Gruppen-Elemente (PGE) in verschiedenen Umweltkompartimenten.
Band 12: M. A. Leosson (1999) A Contribution to the Sulphur Isotope Geochemistry of the Upper Continental Crust: The KTB Main Hole - A Case Study
Band 13: B. A. Kappes (2000) Mobilisierbarkeit von Schwermetallen und Arsen durch saure Grubenabwässer in Bergbaualtlasten der Ag-Pb-Zn-Lagerstätte in Wiesloch
Band 14: H. Philipp (2000) The behaviour of platinum-group elements in petrogenetic processes: A case study from the seaward-dipping reflector sequence (SDRS), Southeast Greenland volcanic rifted margin
Band 15: E. Walpersdorf (2000) Nähr- und Spurenelementdynamik im Sediment/Wasser-Kontaktbereich nach einer Seekreideaufspülung - Pilotstudie Arendsee -
Band 16: R. H. Kölbl (2000) Models of hydrothermal plumes by submarine diffuse venting in a coastal area: A case study for Milos, South Aegean Volcanic Arc, Greece
Band 17: U. Heiser (2000) Calcium-rich Rhodochrosite layers in Sediments of the Gotland Deep, Baltic Sea, as Indicators for Seawater Inflow
In der Fortsetzungsreihe "Karlsruher Mineralogische und Geochemische Hefte" (ISSN 1618-2677) sind bisher erschienen:
Band 18: S. Norra (2001) Umweltgeochemische Signale urbaner Systeme am Beispiel von Böden, Pflanzen, und Stäuben in Karlsruhe
Band 19: M. von Wagner, Alexander Salichow, Doris Stüben (2001) Geochemische Reinigung kleiner Fließgewässer mit Mangankiesen, einem Abfallsprodukt aus Wasserwerken (GReiFMan)
Band 20: U. Berg (2002) Die Kalzitapplikation als Restaurierungsmaßnahme für eutrophe Seen – ihre Optimierung und Bewertung
Band 21: Ch. Menzel (2002) Bestimmung und Verteilung aquatischer PGE-Spezies in urbanen Systemen
Band 22: P. Graf (2002) Meta-Kaolinit als latent-hydraulische Komponente in Kalkmörtel
Band 23: D. Buqezi-Ahmeti (2003) Die Fluidgehalte der Mantel-Xenolithe des Alkaligesteins-Komplexes der Persani-Berge, Ostkarpaten, Rumänien: Untersuchungen an Fluid-Einschlüssen
Band 24: B. Scheibner (2003) Das geochemische Verhalten der Platingruppenelemente bei der Entstehung und Differenzierung der Magmen der Kerguelen-Flutbasaltprovinz (Indischer Ozean)

Ab Band 25 erscheinen die Karlsruher Mineralogischen und Geochemischen Hefte im Karlsruher Universitätsverlag online unter der Internetadresse
http://www.uvka.de/univerlag/institut.php?fakultaet=1
Auf Wunsch sind beim Karlsruher Universitätsverlag gedruckte Exemplare erhältlich („print on demand“).
Band 25: A. Stögbauer (2005) Schwefelisotopenfraktionierung in abwasserbelasteten Sedimenten - Biogeochemische Umsetzungen und deren Auswirkung auf den Schwermetallhaushalt
Band 26: X. Xie (2005) Assessment of an ultramicroelectrode array (UMEA) sensor for the determination of trace concentrations of heavy metals in water
Band 27: F. Friedrich (2005) Spectroscopic investigations of delaminated and intercalated phyllosilicates
Band 28: L. Niemann (2005) Die Reaktionskinetik des Gipsabbindens: Makroskopische Reaktionsraten und Mechanismen in molekularem Maßstab
Band 29: F. Wagner (2005) Prozessverständnis einer Naturkatastrophe: eine geo- und hydrochemische Untersuchung der regionalen Arsen-Anreicherung im Grundwasser West-Bengalens (Indien)
Band 30: F. Pujol Chemostratigraphy of some key European Frasnian-Famennian boundary sections (Germany, Poland, France)
Band 31: Y. Dikikh Adsorption und Mobilisierung wasserlöslicher Kfz-emittierter Platingruppenelemente (Pt, Pd, Rh) an verschiedenen bodentypischen Mineralen


![Nibim4016 preisliste flair 230x290 nor 28jv[1] druckversion 18 08](https://img.pdfslide.net/doc/110x75/568ca8a61a28ab186d9a3730/nibim4016-preisliste-flair-230x290-nor-28jv1-druckversion-18-08.jpg)