Embed Size (px)
Citation preview

DISSERTATION
Titel der Dissertation
Novel Surface Imprinting Strategies for Selective
and Highly Sensitive Protein Recognition:
A case study based on QCM sensing of Bovine Serum Albumin
Verfasser
Nam Phan Van Ho, MSc
angestrebter akademischer Grad
Doktor der Naturwissenschaften (Dr. rer. nat.)
Wien, 2014
Studienkennzahl lt. Studienblatt: A 791 419
Dissertationsgebiet lt. Studienblatt: Chemie
Betreuer: Univ.-Prof. Mag. Dr. Peter Lieberzeit


3
ACKNOWLEDGEMENTS
With my respect and gratitude, I would like to extend my deep thankfulness to my supervisor,
Univ. Prof. Dr. Peter A. Lieberzeit, for his direct helps and supports during learning process,
completing my PhD work and living in Vienna. His instructions and suggestions played the
important role for success of this thesis. Besides, his integrity, dedication and enthusiasm for
research and teaching are the shining example of learning intentions for my future career.
I really appreciate O. Univ. Prof. Dr. Franz Ludwig Dickert for his acceptance, lectures,
managements and supports. Special thanks are due for Dr. Munawar Hussain, Dr.
Martin Zeilinger, Mag. Hermann Sussitz, Dr. Judith Wackerlig, Dr. Christoph Langsam,
Dipl-chem. Eva Spieker, MSc. Annette Schnettelker and all of my colleges in the Sensors and
Rapid Analysis group, for their useful help during my studying and researching in University
of Vienna.
There are no words to show my acknowledgement to University of Vienna for supplying my
wonderful PhD scholar life here.
I am obliged to TRIG Project, OEAD, University of Vienna and my supervisor, Univ. Prof.
Dr. Peter A. Lieberzeit, for the financial support.
My parents, brother, family and motherland are always in my heart.
I own millions sincere thanks to whom always stay by my side, give me help and caring
attitude. Although there is not place enough for me to mention the name of all, I will
remember everything that they did for me.


5
ABBREVIATIONS
3D Three-dimensional
AFM Atomic force microscopy
AIBN 2’-azobisisobutyronitrile
ATR Attenuated total reflectance
BSA Bovine serum albumin
DHEBA N,N′-(1,2-Dihydroxyethylene) bisacrylamide
DMS Dimethyl sulfide
DMSO Dimethyl sulfoxide
DVB Divinyl benzene
EGDMA Ethylene glycol dimethacrylate
FET Field effect transistor
HSA Human serum albumin
MAA Methacrylic acid
MeOH Methanol
MIP Molecularly imprinted polymer
MIPe Molecularly imprinted polymer - coated electrode
NIP Non-imprinted polymer
NIPe Non-imprinted polymer - coated electrode
PBS Phosphate-buffered saline
QCM Quartz crystal microbalance
RT Room temperature
SDS Sodium dodecyl sulfate
STM Scanning tunneling microscopy

6
THF Tetrahydrofuran
TMDMA Tetramethylene dimethacrylate
UV Ultraviolet
VP N-Vinylpyrrolidone
w/w Weight/Weight
7
TABLE OF CONTENTS
ACKNOWLEDGEMENTS ....................................................................................................3
ABBREVIATIONS ..................................................................................................................5
TABLE OF CONTENTS ........................................................................................................7
1 INTRODUCTION........................................................................................................9
1.1 Bovine serum albumin ................................................................................................9
1.2 Biomimetic sensors ...................................................................................................15
1.2.1 Molecularly imprinted polymers........................................................................ 17
1.2.2 Quartz crystal microbalance .............................................................................. 32
1.3 Aim of this thesis.......................................................................................................34
2 EXPERIMENTAL PART AND PRELIMINARY MEASUREMENTS ..............37
2.1 Devices ......................................................................................................................37
2.2 Chemicals ..................................................................................................................44
2.3 Molecularly imprinted polymers (MIP) ....................................................................45
2.3.1 Synthesis of polymer.......................................................................................... 45
2.3.2 Template Stamp preparation .............................................................................. 45
2.3.3 Preparation of MIP-coated QCM ....................................................................... 45
2.4 Optimizing polymerization .......................................................................................46
2.4.1 pH of monomer mixture and temperature of polymerization ............................ 46
2.4.2 Stability of polymer ........................................................................................... 50
2.5 Protein template removal from MIP..........................................................................52
2.5.1 Testing imprinting efficiency by xanthoprotein reaction ................................... 52
2.5.2 Testing imprinting efficiency by ATR spectroscopy ......................................... 55
2.5.3 Testing imprinting efficiency by STM analysis................................................. 56
3 POLYMER OPTIMIZATION AND THIN FILMS ...............................................61
3.1 Preliminary QCM measurement................................................................................61

8
3.1.1 Procedures .......................................................................................................... 61
3.1.2 First QCM data .................................................................................................. 61
3.2 Polmyer Optimization ...............................................................................................63
3.2.1 Cross-linker ........................................................................................................ 63
3.2.2 Monomer ............................................................................................................ 71
3.2.3 Polymerization Solvent ...................................................................................... 75
3.3 Sensor characteristic ..................................................................................................80
3.3.1 Reproducibility .................................................................................................. 80
3.3.2 Sensor Characteristic ......................................................................................... 82
4 MIP NANOPARTICLES ..........................................................................................85
4.1 Nanoparticle synthesis...............................................................................................85
4.2 Precipitation solvent ..................................................................................................86
4.3 Template Removal ....................................................................................................88
4.4 Receptor on nanoparticles .........................................................................................89
5 TWO-STEP IMPRINTING STRATEGIES............................................................97
5.1 Using nanoparticles as templates ..............................................................................98
5.2 Sensor characteristic: comparing BSA and non-washed MIP nanoparticles as
templates ............................................................................................................................104
SUMMARY (ENGLISH) ....................................................................................................107
ZUSAMMENFASSUNG (DEUTSCH) ..............................................................................109
REFERENCES .....................................................................................................................111
CURRICULUM VITAE ......................................................................................................119

9
1 INTRODUCTION
Healthcare is one of those fields, where the availability of reliable analytical instruments has
the most direct influence on everyday life. This includes both diagnostic control and quality
monitoring of drugs and pharmaceuticals during production. However, especially in these
areas, modern instrumental analysis tends to be comparably expensive in terms of purchase as
well as operation, as current protocols include high-performance liquid chromatography
(HPLC), high performance capillary electrophoresis (HPCE), mass spectrometry, and others
(1)(2). In the light of supporting these changes and further increasing the quality of life, it is
therefore of high interest to implement good-value, sensor based analytical strategies that are
suitable to circumvent the high costs of instrumental analysis, ranging from environmental
monitoring and protection to pharmaceutical separation and analysis, and from defense and
security to medicine and healthcare (3)(4). Within this thesis, the goal was to design novel
sensor materials and to implement sensor systems based on mass-sensitive transducers for
drug/protein targeting.
1.1 Bovine serum albumin
Bovine serum albumin (also known as BSA or "Fraction V") is a serum albumin protein
derived from cows. It is one of the most widely studied and applied proteins because of its
availability, low cost, stability and multifunctional binding properties.
Serum albumin is the principal component of blood plasma with a typical concentration of
around 0.6 mM, which is also present in bodily tissues and secretions. It maintains colloid
osmotic blood pressure and is known as a weak acid and therefore active in the acid-base
balance. Its half-life in the circulation system was found to be 19 days. (5)(6) Many
researchers have studied structures, functions and properties of serum albumins (Table 1) to
clarify their interactions with other molecules and ligands (see Table 2).

10
Table 1: Physicochemical properties of Bovine Albumin (7).
Property Bovine Albumin
Molecular mass (Da)
From composition 66,411
From hydrodynamic data 66,700
From ESI-MS 65,430
"Best" value in solution 66,500
Sedimentation constant s20,wx1013
Monomer 4.5
Dimer 6.7
Diffusion constant D20,wx107 (dcm
2.s
-1) 5.9
Partial specific volume 0.7336
Intrinsic viscosity (dL/g) 0.041
Overall dimensions a,b,c (Å) a = 215.7, b = 45.1, c = 142.4 (8)
Molecular volume (Å3) anhydrous 81,000
Isoionic point 5.15
Isoelectric point (at /2 = 0.15) 4.7
Refractive index increment (578 nm)x10-3
1.90
Optical absorbance, 279 nm, 1 g/L 0.667

11
Table 2: Some groups of endogenous substances that bind to Albumin (9).
Compound Association constant, KA (M-1
) n
Long-chain fatty acids (1-69)x107
1
Eicosanoids (PEG1) 7x10⁴
2
Bile acids (13-200)x103 3
Cortisol 5x10³
2
Progesterone 3.6x10³
1
Testosterone 2.4x10⁴
1
Aldosterone 3.2x10³
1
Bilirubin 9.5x10⁷
1
Hematin 1.1x10⁸
1
L-Thyroxine 1.6x10⁶
1
L-Tryptophan 1.0x10⁴
1
25-OH-Vitamin D3 6x10⁵
1
1,25-(OH)2Vitamin D3 5x10⁴
1
Aquocobalamin 2x10⁷
1
Folate 9 X 10 2 9x10²
Ascorbate 3.5 X 10⁴ 0.1 3.5x10⁴
0.1
Copper(II) 1.5 X 10¹⁶ 1 1.5x10¹⁶
1
Zinc(II) 3.4 X 10⁷ 1 3.4x10⁷
1
Calcium 15.1 X 10 9- 1 15.1x10²
1
Magnesium 1 X 10² 12 1x10²
12
Chloride 7.2 X 10² 1 7.2x10²
1

12
The conformation of BSA (64 kDa, 582 amino acid units) in terms of amino acid sequence is
76% homological to Human serum albumin (HSA). Determination via several methods
revealed that both its crystal structure and its three-dimensional (3D) structure are
comparable to the one of HSA. (5)(7)(8) (10)(11)(12)
Figure 1: BSA molecular surface. Modified from ref. (8).
The major function of serum albumin is to act as the carrier of fatty acids in the blood. It is a
versatile protein because it can not only carry fatty acids in a ratio of 1:7 (Figure 2) but also
bind several types of ligands (Table 2), such as bilirubin (13)(14)(15)(16)(17), prostaglandin
(18)(19), progesterone (20), haemin (21)(22), -Fetoprotein (23), bile acids (24) and
metalloporphyrin (25). The albumin molecule exhibits at least six binding sites (26). Figure 2
shows the feature of serum albumin to cover carbon-rich tails of fatty acids and thus
preventing them from impact of the surrounding water. Additionally, all three Ca2+
binding
sites identified in BSA are located in close proximity to fatty acid binding sites identified in
the structure of HSA, thus Ca2+
binding could potentially be disrupted in the presence of fatty
acids. (8)

13
Figure 2: Seven molecules of arachidonic acid bound to a serum albumin molecule. The
protein is shown with pink tubes and the fatty acids are shown with spheres depicting each
atom. Adapted from ref. (27).
The viscosity of a protein solution depends on its intrinsic characteristics, e.g. molecular
mass, size, volume, shape, surface charge and ease of deformation as well as influences due
to environmental factors such as pH, temperature, ionic strength, ion type, shear conditions
and heat treatment (7). The viscosity of serum albumin solution is linearly proportional to
concentration up to 65 mg/mL (approximately 1 mM). At higher concentration the increase is
exponential. Its intrinsic viscosity [] is constant with temperature up to 60oC in the range of
concentrations up to 6 mM. (28) The value [] is shown in Table 1.
Serum albumin undergoes reversible conformational isomerization with changes in pH
(Figure 3). The general form of BSA is found close to the isoelectric point with pI 4.9 up to
neutral pH, while fast form is present at pH 4, the extended form occurs below pH 3, the
basic form and the aged form do not crystallize, therefore no crystal structures can be
recorded. Although these structural changes are predicted based on physicochemical
evidence, their tertiary configuration is difficult to determine (5).
Nowadays, BSA is widely used in research when a generic protein is needed, not only
because of its functional properties in biological fluids, but also because it stabilizes several
unstable enzymes without changing their functional properties (27).

14
Figure 3: Conditions of pH and helical contents of the five recognized forms of BSA
including the crystal structure of the N form and the proposed configurations of F and E
forms (5)(29).

15
1.2 Biomimetic sensors
In recent years, chemical sensors and biosensors are taking an important part in the field of
modern analytical chemistry, as can be seen both from the number of papers published and
the diversity of approaches and techniques applied. In sensor design, receptor and recognition
principles are essential key features for ensuring precise and effective analysis. In almost
every case, reasonable synthetic pathways have to be developed for generating functional
materials that can interact with appropriate analytes in close contact with an interrogative
transducer. (30) The reason is that natural systems for detecting and screening biological
compounds are usually complex and sensitive to environmental parameters, such as
temperature, pH and medium composition. On the other hand, selectivity and sensitivity are
straining challenges for artificial biosensor materials and need to be considered because of
small sample amounts, homology of the analyte with other species consisting of complex
mixtures. Hence, designing mimics of natural systems to recognize biological species has
become a highly interesting issue. (31) Man-made receptors for a wide range of compounds
are responsible for specifically recognizing and binding the target analyte similar to bio-
reactions in living cells. (32) Upon this interaction, one of the layer’s physical properties
changes (e.g. polarity, optical absorbance, fluorescence behavior and mass). These changes
are detected by the transducer, which converts them to an electrical signal. Finally, the data
obtained are processed and stored (Figure 4). (4)
Figure 4: Principle setup of a chemical/bio sensor. Adapted from ref. (4).

16
Biosensors can be classified by the respective bio-receptor or transducer type (Figure 5) (32).
Besides biological receptors, sensor development also makes use of biomimetic materials. As
an example, molecular imprinting yields layers that exceed biological materials in terms of
reproducibility, long-term stability and low cost. Additionally, they can reach similar
selectivity and sensitivity as biological materials. Furthermore, they can be easily customized,
are straightforward to synthesize and comparably easy to manipulate.
(33)(34)(35)(36)(37)(38) Generally speaking, MIP are compatible to a wide range of
transducers including optical, electrochemical, and mass-sensitive ones. In particular, MIP
have been applied in chemo- and biosensors based on e.g. quartz crystal microbalance
(QCM) (39), surface plasmon resonance (40), field effect transistor (FET) (41)(42),
fluorescence (43), conductometry (44) and electrochemistry (45). Mass-sensitive, or acoustic
devices are a popular class of transducers because they are suitable for the detection of any
analyte since mass is a universal property of matter. (4)(33)
Figure 5: Biosensor classification schemes. Modified from ref. (32).

17
1.2.1 Molecularly imprinted polymers
During the development of novel chemo- and biosensor systems, synthesizing the respective
recognition material is of fundamental importance. In terms of selectivity, evolution has
developed a wide range of highly appreciable systems (mainly antibodies and enzymes, but
also for example taste and smell receptors) for this purpose targeting a vast variety of
different analytes. Albeit being outstandingly selective, their use in long-term measurements
and in technological processes can be limited due to their reduced ruggedness and long-term
stability.
Figure 6: Principles of molecular imprinting. Adapted from ref. (46).
One of the promising approaches to overcome this limitation is molecular imprinting (see
Figure 6). (47) For this purpose, the analyte-to-be serves as a template in a polymerization
reaction leading to a highly cross-linked material. After completion, the template compound
is removed either by washing or, where suitable, by evaporation. This procedure leaves
behind interaction sites in the polymer that are ideally suited to reincorporate the template
species as a result of steric adaptation and the formation of an optimized interaction network
between template and functional groups of the polymer. In other words, imprinting is defined
as “the construction of ligand-selective recognition sites in synthetic polymers, where a
template (atom, ion, molecule, complex or a molecular, ionic or macromolecular assembly,
including microorganisms) is employed in order to facilitate recognition site formation
during the covalent assembly of the bulk phase by a polymerization or polycondensation
process, with subsequent removal of some or all of the template being necessary for

18
recognition to occur in the spaces vacated by the templating species” (38). This strategy has
already lead to several successful applications, covering a wide range of template dimensions
(48), including e.g. detecting organic vapors via electronic noses (49), degradation processes
in engine oils (50) as well as the detection of bio-species including proteins (51), bacteria
(52)(53), viruses (34)(54) and entire cells (55)(56).
1.2.1.1 Molecular Imprinting Strategies
Historically, two different imprinting concepts, namely covalent and non-covalent imprinting
were used for categorizing MIP (57)(58) according to the link properties between template
and monomer molecule. However, bond breaking for removing the template in case of
covalent imprinting may cause changes in shape and chemical function of interaction sites.
Hence, non-covalent imprinting based on coordinative bonds, hydrogen bonds and other
affinity interactions is widely applied because of fast and elegant interactions between the
analyte and the receptor layer. As non-covalent imprinting is experimentally much more
straightforward than covalent, the majority of papers dealing with MIP today rely on this
technique.
A further possibility of classifying MIP that is especially interesting for sensor development
also includes two different strategies, namely bulk imprinting and surface imprinting (Figure
6), depending on the properties of the analyte. (33) For small molecules up to around a few
hundred atomic mass units, such as volatile organics, polycyclic aromatic hydrocarbons,
pharmaceutically active compounds, environmental contaminants and others, bulk imprinting
is the suitable method because of their mobility in and out of the polymer matrix. In this case,
the respective template is directly added to the monomer mixture for polymerization. Hence,
interaction sites of the respective sensor material are not only present on the surface, but also
within the whole bulk of the matrix. This increasing amount of recognition sites increases the
sensitivity of the layer. An important fact is that small molecules diffuse through the network
rather fast and therefore can reach interaction centers deep within the bulk in a reasonable
time (depending on layer height). However, these advantages are limited to small molecules,
as for large templates, i.e. especially bio-species - such as proteins, cells or microorganisms -
steric hindrance is observed. This results in some restrictions related to the thickness of
sensor layer, removing template from the polymer and 3D shape compatibility in diffusion
pathways. In this case, surface imprinting is a straightforward and elegant method for
overcoming those obstacles and difficulties. For that purpose, a stamp is prepared by self-

19
organizing the template on a wafer, which is then pressed into the pre-polymerized oligomer
mixture coated onto the surface of the respective transducer. The growing polymer forms
hydrogen bonds with the template, additionally there can be π-π interactions, Van-der-Waals,
as well as hydrophobic interactions. After removing the template, the resulting surface
exhibits surface cavities with interfacial functional sites. They show very strong interactions
with the templating species and can therefore be regarded artificial antibodies in the manner
of shape, size and surface chemistry of the respective template species.
Recently, the concept of molecular imprinting could be extended by generating nanoparticles
showing increasing application potential. Due to their nano-structure, MIP nanoparticles can
improve sensitivity and selectivity of a sensor via increased accessibility of recognition sites
for analyte and by increasing the interfacial area with a consequently growing number of
interaction sites. (59) In this effort, Dickert et al. directly deposited a layer of titanate MIP
nanoparticles with diameters between 200 and 300 nm on the surface of a QCM gold
electrode in order to improve the re-uptake of capric acid by a factor of two compared to thin
films (50). In another approach, they applied an antibody - which is of course a protein - as
the template and realized two-step imprinting, first on nanoparticles by immune-globulin G,
then on the surface of a QCM by these washed-nanoparticles. This enabled the detection of
their respective antigen, namely insulin. (60) This method proved a possible combination
both imprinting strategies: surface and bulk imprinting. Besides, several researchers also
applied nanoparticles strategy with different kinds of nanoparticles such as organic (39) or
metal core (61)(62) ones to obtain appreciable results.
1.2.1.2 Optimizing the quality of MIP
Although most imprinting protocols within this thesis are the results of applying empirical
strategies, the starting point for doing so relies on previous experience of the group.
Designing the recognition pocket within the polymer and optimizing it towards the imprinted
molecule is the central mission in molecular imprinting strategies. First, the structure of the
target molecule is investigated to deduce template recognition in order to choose the suitable
material structure and polymerization strategy (such as radical polymerization or gel
formation). After determining the fundamental recognition issues, imprinted materials have to
be more or less experientially adjusted and optimized (for example: choice of porogenic
solvent, molar ratios of incorporated building blocks, temperature, etc.). (63) Among all
components contributing to imprinting efficiency - such as composition of polymer, reaction

20
conditions, type of template and mechanism of imprinting - the first one is usually considered
to be the most effective one in optimizing the polymer, because it very efficiently allows for
controlling sensitivity and selectivity of the final MIP. Variation parameters include
functional monomer, cross-linker reagent, initiator, polymerization solvent and solvent for
removing the template from the polymer network.
The functional monomer is the primary element forming the interaction between template and
polymer, as well as between analyte and polymer. Based on the type of template, various
kinds of functional monomers have been applied and designed. For example, hydrogen bonds
are accessible from amine and carboxylic groups of the template and the monomer,
respectively. In the case of non-polar or π-π interaction, e.g. frequently styrene-type
monomers are chosen. Adjusting the polarity of the polymeric surface generally plays an
important role in improving sensitivity and selectivity of a MIP. (64)
The cross-linker is important to build up the polymer network resulting in a rigid material.
For that purpose, several cross-linking monomers can be applied. This component is
responsible for the structure and shape of the polymer, whereas the functional monomers has
to be adapted to the template. However, in many cases cross-linking functional monomers
can share the role of the monomer by controlling the ‘‘rigidity’’ or fidelity of the recognition
site and interacting with the functional groups in the template. (63) The influence of cross-
linking agents was reviewed via chromatographic techniques examining the separation of
enantiomers (64). In the cases of ethylene glycol dimethacrylate (EGDMA), tetramethylene
dimethacrylate (TMDMA) and divinyl benzene (DVB), the best separation factors were
achieved when using a ratio of cross-linker over 70 mol% (Figure 7). Obviously, in this case
a higher degree of cross-linking usually leads to higher selectivity. Moreover, shorter
(EGDMA rather than TMDMA) and more flexible (EGDMA rather than DVB) cross-linker
molecules enhance selective recognition. This leads to a more flexible structure (EGDMA >
TMDMA > DVB). Therefore, a high proportion of cross-linker improves the mechanical
stability of MIP and prevents the imprinted sites from collapsing during environmental
changes because of the more rigid polymeric network. Although a higher content of cross-
linker may lead to reduced interaction with the template because of the decrease in
concentration of functional monomer, the cross-linker sometimes should be able to interact in
the same way with the template, as the functional monomer. Hence, the optimized correlation
of cross-linker and functional monomers has to be investigated individually in each case.

21
Figure 7: Influence of the proportion of cross-linker on the recognition specificity of MIPs.
Represented cross-linkers are EGDMA, TMDMA and DVB. Adapted from ref. (64).
The solvent of course mainly has to dissolve reagents during polymerization. Additionally it
also helps providing a porous structure in the polymer. During the polymerization step, the
solvent drives template, functional monomer and cross-linker toward complex formation and
certainly also occupies space inside the network. Post-treatment removes the solvent and
leaves behind pores in the polymer. Thus, the solvent helps to adjust the pore-size and
morphology of polymer. (63) The mobility and affinity of guest bindings in the polymer can
be adjusted in many ways. The more smooth and homogenous the surface is, the less analyte
is absorbed, depending on number and variety of functional binding groups per area unit on
the surface. The porous diameter and the respective macroporosity are elements that restrict
the accessibility of the analytes towards recognition sites. The interaction between solvent
and the dissolved compounds can strongly influence the advantageous bonding between
analyte and functional sites. Generally, higher polarity of porogen usually decreases the
quality of recognition depending on the different types of non-covalent bonds used in the
concrete case. For example, acetonitrile (a comparably polar solvent) leads to more
macroporous polymers than chloroform. On the other hand, Coulombic charge-charge
interactions become stronger depending on solvent polarity. (64) Furthermore, more polar
solvents can weaken interaction forces formed between the imprinting species and the
functional monomers. Swelling of the polymer matrix in the surrounding medium
additionally affects changes in the 3D configuration of recognition sites within the polymer.
Sometimes this behavior results in poorer binding capability due to changes in size, shape

22
and size distribution of the cavities. It may increase the chance of encounters between guests
and biding sites. (65)
Removing the template is the last step in the imprinting procedure in order to reveal the
recognition sites. Generally, about 90% of the template molecules can be removed in this
stage. (66) The remaining molecules still adhere inside highly cross-linked zones because of
steric hindrance of macromolecular structures. If there are still embedded template molecules
remaining in the polymer network after the washing step, this will reduce the capacity of
rebinding the analyte and has to be considered in calibration of the sensors. (64)
1.2.1.3 Molecular Imprinting of Proteins
Several factors affect the success of protein imprinting: Weight and size of the protein
molecule are of course larger than of small molecules making diffusion into the polymer
matrix as well as removal challenging. A large number of recognition sites as well as
roughness can cause multiple weak interactions and nonspecific binding between analyte and
receptor. Proteins have flexible structure and conformation, depending on changes in
temperature or chemical properties such as ionic strength, pH or exposure to reactive species.
The poor stability and solubility of most proteins in organic solvents leads to limited choice
of polymerization media while many popular monomers are insoluble or only partially
soluble in water. The lower limit of detection that for proteins sensors is normally higher than
its content in biological samples. (67) Besides, the quality of template, the complexity of
functional monomers and cross-linker and sometimes low sensitivity of readout electronics
also contribute to reduce efficacy of artificial protein sensing technologies.
There are several different strategies for creating polymeric receptors targeting peptides and
proteins.
Polymers based on acrylate systems in aqueous solution have recently gained some
popularity for protein imprinting (67). The reason is that in most cases, the protein has to be
soluble in the respective polymerization solvent in order to ensure optimal MIP. This poses
the problem that water is the primary solvent for proteins, but it is not the universal solvent in
the mainstream of polymer science. However, many acrylate-based monomers are soluble in
water and can be polymerized in aqueous solution making them optimal candidates for
protein MIP. Additionally one can expect that the risk of denaturing the template during
imprinting is lower for acrylates, than for other polymer systems, because they can form
hydrogen bonds and thus offer an environment that somewhat resembles native ones for

23
proteins. Thus, the following sections focus on reviewing acrylate polymer systems in water
or related solvents applied for protein imprinting.
Figure 8: Schematic representation of protein imprinting on silica-surfaces derivatized with
methacrylate groups. Adapted from ref. (68).
Mosbach (68) reported two different approaches using short peptides and proteins as template
molecules to create stationary phases for chromatography. The template (low-molecular-mass
compounds such as Boc-L-Phe-OH, Z-L-Phe-OH, Z-L-Asp-OH, Z-L-Glu-OH, Z-L-Ala-L-

24
Ala-OMe, Z-L-Ala-Gly-L-Phe-OMe), functional monomers (methacrylic acid (MAA) and 4-
vinylpyridine), cross-linkers (EGDMA or Trimethylolpropane trimethacrylate) and solvents
(chloroform or tetrahydrofuran) were mixed with the initiator 2’-azobisisobutyronitrile
(AIBN) and polymerized using the bulk imprinting method. Thus, this suggests that it is
possible to use organic solvent in polymerization for detecting peptides. Of course, in the
case of such short chains, no “denaturing” - i.e. loss of tertiary or quaternary structure - is to
be expected. At the same time, authors also developed a surface-imprinting approach: A
mixture of metal-binding monomer (N-(4-vinyl)-benzyl iminodiacetic acid) and template
(RNase A) was polymerized at the surface of silica particles. The “anchoring points”
recognition of the protein here is given by the imidazole groups of the histidines exposed on
the surface of the protein coordinating with the metal chelating functional monomer (Figure
8). In particular, adding metal ions to such samples strongly increases selectivity of the
method. However, this approach is of course limited to proteins with exposed His residues on
their surface and therefore not universally applicable for protein imprinting. Additionally,
metal chelating groups provide strong anchoring points for non-specific interactions, which
might lead to high cross-selectivity in real samples.
Figure 9: Using a sugar shell around the protein molecules for surface imprinting of
proteins. Adapted from ref. (69).
Ratner and co-workers (69) used disaccharides to generate a sugar shell around the protein
molecules followed by surface imprinting to transfer the topographic structure information
from the protein template to the polymer layer (Figure 9). This selective layer contains a
complementary shape to the template and hydroxyl groups binding from the immobilized

25
sugar. However, the hydrophilic properties of the cross-linked sugars on the surface of the
protein MIP cavities result in non-specific protein binding. This leads to low selectivity
during protein recognition. Consequently, applying a co-monomer to reinforce binding
between template and surface polymer is supposed to overcome this limitation.
Tzong-Zeng Wu et al. (70) designed a molecularly imprinted piezoelectric biosensor (QCM)
for discriminating the short-chain peptides oxytocin and vasopressin in an aqueous
environment by bulk imprinting technique. Although protic solvents such as alcohols and
water compete with hydrogen-bonding interactions and thus are not optimal for the use in
imprinting, they chose a water/acetonitrile mixture as a solvent. A mixture of monomers
(acrylic acid, acrylamide, N-benzylacrylamide) and template (oxytocin or vasopressin) in
acetonitrile/water (1:1) was copolymerized with cross-linker. (N-Acr-L-Cys-NHBn)2 was
employed to attach the MIP on the surface of the chip by disulfide functional groups applied
as a “glue”. This formulation led to direct and sensitive discrimination of peptides.
Figure 10: Imprinting of protein with forming channels in polymer by using CaCO3. Modified
from ref. (71).
Si-Hua Zheng et al. (71) use alkaline N-[3-(dimethylamino) propyl]methacrylamide and
MAA as ionizable monomers to generate an amphoteric polymer which is supposed to
provide acid, base, nucleophile, or electrophile units for imprinting chicken egg white

26
lysozyme and BSA. While N-[3-(dimethylamino) propyl] methacrylamide preferentially
reacts with Asp and Glu, MAA seemingly interacts with Lys, Arg, Ser, and His of a protein.
The polymer mixed with CaCO3 was synthesized in buffer solution. After removing CaCO3,
some channels formed in the polymer in order to ensure accession of protein towards
imprinted cavities (Figure 10). This strategy overcame the main hindrance of large molecules
in bulk imprinting, namely their strongly hindered mobility into and out of the polymer.
Another approach for imprinting BSA has been realized by hydrogels exhibiting satisfying
selectivity towards BSA and high adsorption rate depending on the number of BSA-sized
cavities (72). For preparing the non-imprinted hydrogels, N-tert-butylacrylamide, acrylamide
and maleic acid as functional monomer, a small amount of N,N’-methylene-bis-acrylamide of
about 2.5% (w/w) as cross-linker, N,N,N’,N’- tetramethylethylenediamine, ammonium
persulphate as redox initiator system were mixed in methanol:water (1:1) and polymerized.
BSA dissolved in the mixture of methanol and water (1:1) was used instead of the solvent
mixture for preparing the imprinted hydrogels. Because of low cross-linker amount in the
polymer recipe, self-organizing of active sites in the polymer enhanced flexible adjustment
towards the target molecules upon large range of shrinking and swelling. Thus, the low
amount of template in the monomer mixture led to effects proportional to analyte adsorption
onto the imprinted polymer.
Figure 11: Schematic representation of the epitope approach, modified from (73).
The so-called “epitope approach” is another way to create protein recognition polymers.
“Epitope” refers to the small active site located within the larger protein structure on an

27
antigen, which binds to the antigen-binding site of an antibody or lymphocyte receptor.
Rachkov and co-workers (73) applied a small sequence of amino acids from the larger protein
target molecule as a template for MIP preparation. When a protein containing this specific
short peptide sequence appears near the MIP, it should theoretically be able to recognize and
bind the whole protein. Figure 11 summarizes the concept. In the concrete study, the authors
synthesized MIP for the nona-peptide oxytocin, a neurohypophyseal hormone (Cys-Tyr-Ile-
Gln-Asn-Cys-Pro-Leu-Gly- NH2) by using a small oxytocin sequence of three amino acids as
a template. The polymer was made of MAA and EGDMA in acetonitrile with a small
quantity of water (about 3%, v/v). This technique is straightforward and suitable for
chromatography. However, the resulting polymer lacks information on the shape of the entire
template molecule. This of course leads to somewhat reduced overall selectivity, because the
MIP does not contain the full steric and functional information of the template.
Figure 12: Scheme of generating polymer coating of DNA by protein imprinting on DNA
backbone. Adapted from ref. (74).
Comparing to the abovementioned methods, highly specific binding sites on DNA towards
protein gives a more selective approach for protein imprinting. Maeda et al. (74) used
interactions between DNA and protein applied as protein recognition to the polymer coated
DNA strand. DNA was first incubated with EcoRI (a restriction endonuclease). Then,

28
poly(N-isopropylacrylamide) terminated with psoralen was conjugated with the DNA strand
(photoinduced reaction between DNA and psoralen end group). Protein dissociation would
reveal the binding pockets of EcoR1 where are ready for reincorporation. Figure 12 shows
how to build a protein imprinted site upon an existing target site. Although this method
demonstrated that selectivity can be achieved, its application is obviously limited to DNA-
binding proteins.(67)
Besides straightforward surface imprinting, Dickert et al. (60) also generated ‘‘polymer
copies’’ retaining the original binding properties of anti-insulin IgG via two-step imprinting
for detecting insulin by QCM. Instead of insulin adsorbed on a glass plate and pressed into a
pre-polymer coated onto a QCM electrode, the authors realized the imprinting technique two
times. First, nanoparticles were precipitated in the presence of immunoglobulin G. After
removing the antibodies with water, these nanoparticles with cavities forming the ‘‘negative
structure’’ of the binding sites were then imprinted on the surface of sensor layer as usual in
order to form ‘‘positive structures’’, i.e. “plastic copies” of the respective antibody. As a
consequence, the polymer layer is binding insulin in the same way as the respective IgG
(Figure 13). This strategy helps avoiding the direct interaction between the target protein and
the polymer, thus preventing all possible disadvantages of protein properties for
polymerization in aqueous environment.
Figure 13: two-step imprinting for detecting insulin. Adapted from ref. (60).

29
In general, the performance of MIPs in aqueous solutions still poses substantial challenges
(Table 3). Especially the capacity of hydrogen bonding - the dominant interaction in polar
solvents - limits the formation of non-covalent pre-polymer complexes, decreasing the
number of imprinted sites in the polymer. Therefore, high nonspecific binding and
heterogeneity of binding sites need to be considered, if polar environments have to be used
during polymerization. (75)(76)

Table 3: Summary of some protein imprinting strategies in polar environments.
Synthetic strategy
Adjustment Comments
In polymer system In template Advantages Disadvantages
Bulk imprinting protocol
Self-organized in
polymerization
Straightforward Limited mobility of large
molecules in and out of polymer
Hydrogel, Microgel Using small amount
of cross-linker, if at
all
Flexible pore size of polymer
caused by swelling
Unspecific recognition in shape
and functional binding sites
Epitope Using epitope
instead of whole
analyte molecule
Straightforward, similar to
performance of small molecules
Cross-selectivity, reduced
selectivity for whole protein
molecule
Morphology of polymer Adding CaCO3 for
generating diffusion
channels in the
polymer
Expanding accessibility of
analytes towards recognition
sites
Unsuitable for making thin film
on surface, removing CaCO3 can
denature structure of polymer
and recognition sites

Specific recognition Using DNA as
backbone and specific
receptor
Specificity Limitation of applied template
(DNA-binding protein)
Surface imprinting protocol
Self-organized during
polymerization
straightforward Limited amount/area of
interaction sites compared to
bulk imprinting
Shell around the template Using thin film
(disaccharide) to
form around the
protein
Preventing direct interaction
between template and polymer
Poor characteristic of functional
binding sites
Self-organizing the
polymer on pre-polymer
surface
“Bulk imprinting on
a polymer surface”
Complexity
Two-step imprinting Using a “negative”
artificial template
for imprinting
Preventing direct interaction
between template and polymer,
template and environment
Possible cross-selectivity toward
other antigen because of using
polyclonal antibodies

32
1.2.2 Quartz crystal microbalance
Figure 14: Schematic of a 10 MHz QCM transducer and thickness shear wave propagation ,
adapted from (77).
Quartz crystal microbalance (QCM) is a type of acoustic transducer, which can measure the
mass per area on its surface. It is based on the piezoelectric effect, which states that applying
mechanical stress on some types of crystals possessing a polar axis (i.e. without symmetry
center) induces an electric potential on the surface. QCM generally have two metal electrodes
coated on 2 sides of AT-cut quartz crystal plates. They establish an electric field across the
crystal. When applying voltage, the device undergoes thickness shear stress, i.e. the two faces
move against each other in their planes (Figure 14). (77) The thickness of the device,
fundamentally determines the resonance frequency of the crystal oscillator. However, as
Sauerbrey found out in 1959, mass changes (m) lead to frequency shifts (f) according to
Equation 1 as follows:
Equation 1:
√ (78)
where n is the overtone number, the base resonant frequency of the crystal (prior to the
mass change), A is the area (cm2), µ the shear modulus of quartz AT-cut crystal (2.95x10
11
g.cm-1
.s-1
), and is the density of quartz (2.65 g/cm3). Accordingly, if frequencies of 10 MHz
QCM can be determined with an accuracy of 0.1 Hz, in situ mass changes of 1 ng/cm2 can be
detected. This means acoustic transducing is one of the best applicable ways for a wide
variety of chemical sensing, because it allows label-free detection by measuring mass.

33
The frequency measured depends on the combined thickness of the quartz wafer, the metal
electrodes, and the material deposited on the QCM surface. Although increasing enhances
sensitivity, it is almost impossible to achieve higher fundamental frequencies than 50 MHz
due to mechanical stability: 20 MHz requires quartz plates with a thickness of 84 µm. The
operational frequency range of commercially available QCM resonators is up to 20 MHz
(sometimes 50 MHz, but those are usually overtones of the fundamental frequency). (4)
Besides mass, the resonant frequency also depends on density-viscosity changes in the
solution, viscoelastic changes in the bound interfacial materials, and changes in the surface
free energy. Finally, the microscopic roughness of the resonator surface also exerts influence
on the performance of QCM. (79)
QCMs are electromechanical devices, and therefore their mechanical vibrations can be
described in terms of an electrical equivalent circuit. These transducers originally worked as
frequency-determining elements in stable oscillator circuits, e.g. in quartz watches. A typical
equivalent circuit for a QCM is shown in Figure 15. There, four electrical elements represent
the physical properties of QCM: The inductance L can be correlated with the mechanically
vibrating mass; the dynamic capacitance C complies with the elastic behavior of the
resonator; the resonance resistance R represents the dynamic vibration losses; and the static
capacitance C0 describes the capacity between the two electrodes. In case of a quartz
resonator immersed in a liquid, beside L1, C1, R1, the series inductance L2 and series
resistance R2 are added into the equivalent electrical circuit. They represent the mass and
viscosity components of the liquid, respectively. (77)
a) b)
L: Inductivity – C : Dynamic Capacitance – R: resistance – C0: Static Capacitance
Figure 15: Typical equivalent circuits for a QCM (a) in air. (b) in a liquid. (79).

34
1.3 Aim of this thesis
For designing molecularly imprinted polymers (MIP) as synthetic receptors for QCM-based
sensing of proteins, we focused on model compounds that are easily available and do not
pose any hazard. This leads to the detection of BSA with acrylate-based MIP. Molecular
imprinting inherently is a platform technology; therefore transferring results from one
compound to a closely related one should be possible without substantial obstacles. In the
second step, we then aimed at enhancing the sensitivity by implementing a MIP nanoparticle
strategy.
To begin with, the work focused on systematic tests on BSA MIP and optimization of the
polymer. Although there are some previous studies reported about BSA and MIP, there is still
a range of open questions. The size and steric of the template is the most hindrance in
imprinting technique. This leads to the limited success in only small protein applying bulk
imprinting. The fundamental template-protein interactions in aqueous environment, which
mainly forces by H-bond, seem to be disturbed by water. Thus, the protocols applied for BSA
still need improvement in affinity and specificity, especially polymer based on water
porogen.
Quartz crystal microbalance (QCM) transducers were chosen for this study because of their
superior ruggedness, high variability concerning the electrode structure, rather
straightforward measuring procedures and mass-signals requiring only minimum
computational and calibration effort. In some previously reports, all QCM protocols for
screening BSA or protein in general with abovementioned advantages is not high sensitivity
enough for applying in real-life samples - be it environmental or clinical - which is more
complex and low concentration. Thus, the sensor continued investigating the sensitivity and
selectivity.
Besides the traditional way for developing the affinity of layer material towards the target
protein is optimization the composition of the polymer, we will also realize some changes in
the other respect: surface roughness and accessibility of the respective MIP materials to allow
more analyte-layer interactions to take place. Primarily, this goal will be achieved by
applying a new strategy: Using unwashed MIP nanoparticles as templates to assess influence
on sensitivity of the final layers. This both increases the amount of interaction sites available
(due to higher surface roughness) and their availability to analyze compounds. After
confirmation of presence of recognition site on nanoparticles, pre-tests of “artificial antibody”

35
could realize for amplification of detecting BSA. The success of this strategy will contribute
a new effective method for improving the sensitivity of imprinting protein, which remains a
lot of limitation in real-life application.


37
2 EXPERIMENTAL PART AND PRELIMINARY MEASUREMENTS
2.1 Devices
Mass sensitive measurements were carried out by analysis systems consisting of four
principal parts, namely the measuring cell containing the QCM, oscillator circuit, frequency
counter and computer including software as shown in Figure 16, Figure 17.
Figure 16: Quartz crystal microbalance (QCM) measuring system.

38
Figure 17: Work station for QCM measurements responses.
Ismatec peristaltic pump (MCP-Process Series, Ismatec SA, Wertheim- Mondfeld, Germany)
was used to drive the sample solution through the flow cell (Figure 18).
Figure 18: MCP-Process Series Ismatec peristaltic pump.
The measuring cell contacts the QCM with the measuring electronics on one side and exposes
it to the sample fluid on the other side. It consists of the following parts: a holder with a lid
made from polymethylmethacrylate (PMMA); it supports a polydimethylsiloxane (PDMS)

39
cell sandwich. This includes a cap for the inflow and outflow of solutions forming a sample
chamber of 150 µL and a base to support the quartz. Figure 19 shows (A) the side view and
(B) an actual photo of the setup.
(A)
(B)
Figure 19: Measuring cell. (A) Side view of a polydimethylsiloxane (PDMS) cell sandwich
including QCM. (B) Photograph of measuring cell and quartz crystals microbalance installed.
QCMs were prepared by screen-printing the desired electrode structure on an AT-cut quartz
disc with 13.8 mm in diameter and a thickness of 168 μm purchased from Great Microtama
Industries, Surabaya, Indonesia. Figure 20 (next page) depicts the procedure for depositing
the electrodes on quartz crystal discs and the dual electrode pattern designed on the
homemade sieve. Commercial brilliant gold paste (purchased from HERAEUS, Germany)
was manually screen-printed onto the quartz by regular strokes of a sharp rubber edge in
order to print the electrode structure onto the device. Subsequently, devices were heated up to
400oC for 4 hours in order to remove the organic residues and expose the metallic gold

40
electrode. This procedure was repeated on the rear side of quartz sheets. The electrodes
facing the aqueous phase were electrically grounded. Their diameters were 5 mm, whereas
the “backside” electrodes were 4 mm in diameter. In this way, it is possibly to minimize
unspecific sensor responses due to conductivity effects. To eliminate non-specific effects
caused by temperature, viscosity or non-selective adhesion onto the selective channel and the
non-imprinted reference channel, respectively, dual-electrode geometries were applied using
one of them as a reference (Figure 21).
For manufacturing the sieves, Azocol poly-plus S positive photoresist is applied on a 20
micron mesh cloth glued into a metal frame and hardened for 2 hours in the dark at room
temperature (RT). Afterwards, it is exposed to UV for 30 seconds via a mask containing the
electrode pattern. Consequently, the areas exposed to light harden. Washing the sieve with
warm water exposes the non-blocked parts of the cloth leading to the desired dual electrode
pattern (Figure 20 B, C).
(A)
(B)
(C)
Figure 20: The setup employed for imprinting of gold electrodes on Quartz: (A) production of
dual electrode by screen printing technique; (B, C) sieves for screen printing.

41
Figure 21: QCMs with dual electrode geometry: front and back side (left to right).
An RF network analyzer (8712ET 300 KHz-1300 MHz, Agilent Technologies, Palo Alto,
CA) (Figure 22) was utilized to monitor the resonance frequency and damping spectra of
QCM for determining thicknesses of both gold and polymer layers. Additionally, network
analyzer measurements reveal the quality of the electronic quality of the quartz prior to use in
oscillator measurements. This allows for testing the quartz in the cell in terms of readable and
stable output signals when connecting to measuring system.
Figure 22: Network analyzer showing a QCM damping spectrum.
The QCM measuring system is depicted in Figure 16. In order to perform measurements, the
sample solution is kept at 25oC by a thermostat and injected into the measuring chamber of
the cell where it interacts with the sensor layer and induces mass changes on the electrode
surfaces. The QCM acts as the frequency-determining element in an oscillator circuit
operated by an input DC voltage source at 12 V and 60 mA. An Agilent 53131A 225MHz
Universal Counter continuously monitors the oscillator circuit frequency. A custom-made
LabView routine reads out the respective frequency data as a function of time into a PC for
processing and data storage.

42
Figure 23: Oscillator circuit for 2 channels.
Atomic force microscopy (AFM) (Figure 24) using a Nanoscope IVa (Digital Instruments
Inc., Santa Barbara, CA). Scanning probe microscope was used to confirm the morphology of
the surface as well as the thickness of the thin film by scratching with a razor blade and
measuring the depth of the scratch.
(A)
(B)
(C)
Figure 24: (A) Nanoscope IVa Scanning probe microscope with AFM head; (B) with STM
head; (C) STM head.
Additionally we also applied Scanning Tunneling Microscopy (STM) for screening the
morphology of the surfaces. However, in this case it is necessary to generate a conductive
surface by depositing a thin gold layer via a Cressington 208HR sputter (Figure 25). STM

43
measurements were also carried out on the Nanoscope IVa Scanning probe microscope with
an STM head (Figure 24B).
Figure 25: Cressington 208HR sputter coater with rotary planetary tilt stage (left on top of
the machine) and thickness controller MTM-20.
Figure 26: Perkin Elmer spectrum 100 FTIR (Fourier transform infrared spectroscopy).
Besides using STM for confirming the presence of BSA on polymer surface, Attenuated
Total Reflectance (ATR) is the powerful technique for analyzing the chemical composition of
the surface. Perkin Elmer spectrum 100 FITR spectrometer with Spectrum Software v10
(Figure 26) was used for this purpose.
Furthermore, UV/VIS spectra can also help to study some characteristics of transparent film.
We used Perkin Elmer UV/VIS Spectrometer Lambda 12 (Figure 27) to record the UV
spectra of the polymer film colorized by xanthoprotein reaction.
44
Figure 27: Perkin Elmer UV/VIS Spectrometer Lambda 12.
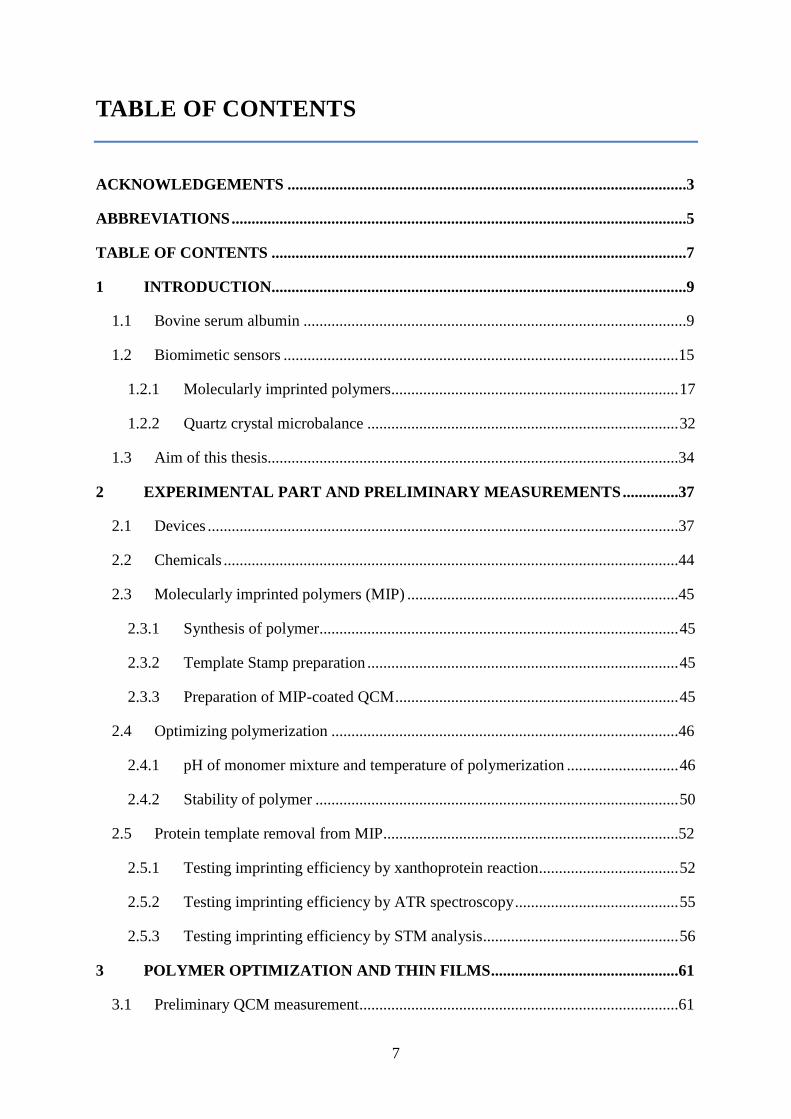
2.2 Chemicals
All solvents were purchased in analytical grade. All chemicals were purchased from Merck
and Sigma-Aldrich in the highest available purity and used as received.
N-Vinylpyrrolidone (VP) methacrylic acid acrylic acid
N,N´-(1,2-dihydroxyethylene) bisacrylamide (DHEBA) 2´-Azobisisobutyronitrile (AIBN)
Figure 28: Chemical structures of functional monomers and cross-linking monomers used in
this thesis.
Phosphate-buffered saline (PBS) pH 7.4 was prepared as follows: 8 g NaCl, 0.2 g of KCl,
1.44 g Na2HPO4.2H2O and 0.24 g of KH2PO4 were dissolved in 800 mL water. Then we
adjusted the pH to a value of 7.4 using either diluted NaOH (1M) solution or diluted H3PO4
(0.33M) solution if neccessary. Finally this solution was diluted to a volume of 1000 mL with
water.

45
2.3 Molecularly imprinted polymers (MIP)
2.3.1 Synthesis of polymer
First, methacrylic acid / N-vinylpyrrolidone copolymer systems were studied to evaluate
optimal polymerization parameters for BSA MIP. The strongly polar/dissociable functional
groups (-COO- and -NR3
+) of this copolymer system can be expected to undergo interactions
with several complementary functional groups of BSA (-OH, -NH2, -COOH, main-chain
amide groups and others) better than other weak/neutral functional monomers (e.g.
acrylamide). Successful imprinting results with insulin (60), trypsin (80), sesame protein
(81), Hev b1 latex allergen (82), Tobacco Mosaic Virus (TMV) and the Human Rhinovirus
serotype 2 (HRV2) (83), human rhino virus 14 (HRV 14) (84) have already been reported for
such a system. All these considerations hence made the system a good starting point for the
work shown in this thesis.
30 mg of the cross-linker DHEBA as well as 25 mg methacrylic acid and 10 mg N-
Vinylpyrrolidone as functional monomers were dissolved in 800 µL distilled water. Then, 1
mg potassium peroxydisulphate was added as a radical initiator and polymerization started
under UV light until the gel point was approached (polymerizing phase 1). This pre-
polymerized solution is suitable for coating the respective transducer.
2.3.2 Template Stamp preparation
Template stamps were prepared by sedimentation of the respective template (BSA or
nanoparticles) on a microscope slide (5 mm x 5 mm), followed by drying at 4C for one hour
and by consecutive spinning with 3000 rpm to remove excess solution.
2.3.3 Preparation of MIP-coated QCM
For generating the sensor layers, the pre-polymerized reaction mixture was spin-coated onto a
10 MHz QCM at 3000 rpm. Immediately afterwards, the respective template stamp was
pressed into the resulting coating layer. Both electrodes were coated with the same polymer,
but only one of them was imprinted. Thus, the other one served as a non-imprinted reference
in order to compensate for physical and non-specific effects. Hence, the difference in
frequency shifts between the two channels yields signals resulting from the material
properties caused by imprinting. The coating procedures resulted in polymer film thicknesses

46
on the surface of electrodes of around 200 nm. After imprinting, layers were stored at room
temperature overnight for hardening (polymerization phase 2).
Protocol for imprinting operation is summarized in Figure 29:
Figure 29: Schematic depiction of the stamping technique for bioanalyte imprinting: A stamp
with densely packed BSA is pressed into the pre-polymerized coating, templates are removed
after polymerization.
2.4 Optimizing polymerization
2.4.1 pH of monomer mixture and temperature of polymerization
First experiments revealed that the pHs of monomer solutions are in the acidic range with a
value of around three. To avoid negative impact on the protein structure, solutions were

47
neutralized prior to polymerization either with 1M KOH or NH4OH solutions. The
polymerization phase 2 (stamp imprinting process) in this case lasted more than 12 hours in
order to ensure complex formation between template and the functional groups of the
polymer. However, neutralizing causes some changes in the properties of the polymer
product: The oligomer solution formed after pre-polymerization is transparent, gel-like and
becomes yellow within a few hours. Furthermore, polymer layers on QCM degrade fast
during washing. Screening the remaining amount of polymer layer thickness (%) (Equation
2) after washing with water for 3 hours allows to quantify this effect. % was statistically
calculated for both MIP and NIP electrodes, respectively. Hence, the following relations are
applicable: following Equation 1,
,
Hence:
Equation 2: Remaining percentage of polymer layer thickness after washing ( ):
: frequency of blank (i.e. uncoated) QCM;
: frequency of QCM after coating with polymer;
: frequency of QCM after washing the layer with 1% sodium dodecyl sulfate (SDS);
Table 4 (next page) summarizes the outcome of these experiments.

48
Table 4: Washing behavior of different polymers neutralized to pH 7.0 by 1M KOH.
Phase 1 Phase 2
Conditions of
polymerization
Treatment
of pre-
polymer
solution
KOH
1M
(µL)
Flush
nitrogen
(minutes)
Polymerization
in nitrogen
Temperature
(oC)
Time
(hours) % (%)
MIP NIP
C01 UV 300 - - RT 24 7.30 7.33
C02 UV 300 - - 40 24 5.71 9.13
C03 UV 300 5 yes 40 72 10.03 8.39
C04 UV - - - RT 24 39.31 51.39
C05 UV - - - 40 24 32.50 33.09
C06 UV - - - 40 72 38.19 49.86
C07 UV - 5 yes 40 72 31.19 38.69
C08 UV - - - 40 96 51.72 54.09
C09 UV - - - 50 72 55.42 58.72
C10 40oC - - - 40 12 16.30 21.24
C11 40oC - - - RT 24 19.10 20.01
C12 40oC - - - 40 96 23.88 27.36
Obviously, washing removes more than 90% of the initial material from the surface, i.e. less
than or equal to 10% of the material remain in the cases of C01, C02, C03, respectively, as
compared to more than 30% in all other cases (Table 4). This fact clarifies that the presence
of OH- in the monomer mixture leading to neutral solutions strongly decreases stability of the
polymer layer. Additionally, pH of the oligomer solution is around six. However, this means
that the acidity of polymer-bound -COOH groups is not strong enough to interact with protein
during the imprinting stage. A possible explanation for such reduced stability may be that
polymerization under neutral conditions was not yet finished. Thus, washing removes mono-
and oligomeric residues from the polymer matrix. Consequently, we additionally adjusted
temperature and flushed monomer solutions with nitrogen (to purge out dissolved oxygen) to
additionally promote the entire reaction. Furthermore, we also polymerized these coated
QCMs product in nitrogen environment (placing them in a desiccator filled with nitrogen

49
atmosphere). However, this did not result in any significant improvement of layer thickness
compared to the other cases, which have the same conditions of polymerization. In the case
of absence of OH-, nitrogen environment resulted the similar effects (C07 compared to C06)
(Table 4).
Figure 30: Dependence of polymer layer thickness on polymerization time (phase 2).
Figure 31: Enhanced polymer stability by increasing temperature or polymerization time,
respectively.

50
For assessing these parameters, we first polymerized layers on quartz electrodes for different
amounts of time at 40oC before washing without adjusting pH. Extending the reaction time
obviously leads to better layer quality (Figure 30). Obviously, increasing polymerization
times strongly enhances stability of the respective layers. However, increasing pre-
polymerization temperature is even more effective than extending reaction time: In the case
of MIP, the remaining thickness of polymer layers increases from 31% to 55% when
increasing the polymerization temperature by 10oC to 50°C. Compared to this, similar values
(51%) can be reached at 40oC via increasing reaction time by 24 hours (Figure 31). This
behavior is similar in the case of NIP (Figure 31). Because the conformation of BSA changes
at 58.1oC (85), the reaction was only investigated at RT, 40
oC and 50
oC.
In an attempt to reduce the effect of temperature on BSA in pre-polymerized phase for bulk
imprinting, we tried to pre-polymerize the monomer mixture at 40oC instead of treating under
UV for 12 hours until the gel point was reached (polymerization phase 1). The obtained
polymer (synthesizing under the conditions C10, C11, C12) was unsatisfactory with %
around 20% (Table 4). In these cases, temperature and hardening time (phase 2) have the
same effect as pre-polymerizing by treating under UV.
Finally, the procedure summarized in section 2.3.1 became the standard in order to optimize
the polymer composition for BSA detection using four days polymerizing phase 2.
2.4.2 Stability of polymer
Furthermore, an additional reason of decreasing polymer layer thickness after washing - i.e.
reduced stability - may be that both absorption and release of solvent by the polymer cause
the polymer itself to swell or shrink besides unreacted oligomers dissolving into the solvent.
Thus, the remaining polymer layer cannot correspondent to 100% after washing. The polymer
was washed by rising with 1% SDS for several hours to investigate its stability. Figure 32
affirms that the solvent did not decrease polymer layer thickness. This procedure was
monitored by QCM measurements: The coated QCM was first mounted in the cell. The
change of resonance frequency was recorded when flushing the cell with 1% SDS in more
than 7 days. The layer thickness was verified by network analyzer before and after resonator
experiments, respectively.

51
Figure 32: Stability of polymer layer on quartz when washing by 1% SDS.
As one can see in Figure 32, the sensor signal fluctuated for every 24 hours almost in sine
form. The most probable explanation of this behavior is the usual daytime fluctuation of
room temperature. When the temperature increases, the viscosity of the solution, a part of
contribution into frequency resonance of QCM measured in liquid phase, would decrease.
Thus, the thermostat was used for inhibiting the influence of the environment temperature. In
any case, the curves on the plot (Figure 32) still have plateaus around 12 hours (in midday) in
every circle. Concretely, the sensor signals reveal that layer materials are stable around 95%
(RSD 0.34%) and 84% (RSD 1.01%) for MIP and NIP, respectively, on the third day (violet
rectangle). Consequently, temperature will not significantly affect measurements lasting less
than 12 hours. From the second day of exposing the QCM to washing solvents, the remaining
of layer thicknesses are stable around 93% (RSD 2.47%) and 78% (RSD 4.06%) for MIP and
NIP, respectively, in overall 6 days.

52
2.5 Protein template removal from MIP
To test the efficiency of imprinting, first it is necessary to prove the presence of protein in the
unwashed MIP. This is possible by its color reaction with nitric acid (the so-called
xanthoprotein reaction), or by Fourier Transform Infrared (FTIR) spectroscopy, or by
scanning tunneling microscopy (STM).
2.5.1 Testing imprinting efficiency by xanthoprotein reaction
In this procedure, hot concentrated nitric acid is dropped on the surface of the polymer.
Successful MIPs turn yellow, because phenolic rings of tyrosine and tryptophan form colored
adducts with nitric acid, whereas the non-imprinted ones stay colorless.
If embedded template molecules remain in the matrix after polymerization, this will of course
reduce the capacity of the respective layers and lead to suboptimal sensors. Therefore, extra
attention is necessary to remove the template from the polymer to ensure optimal reversibility
and reproducibility. Removing 100% of the template is unrealistic; therefore, a layer that did
not release any further protein during washing was regarded “clean” material for sensor
measurements.
In some reviews (86)(87)(88), protein templates were removed from polymer by the means of
an aqueous solution consisting of varying ratios of SDS and acetic acid or protease solutions.
SDS is a surfactant and proteases are capable of cleaving peptide bonds. Consequently, they
can denature the secondary structures of protein templates and reveal the imprinting sites.
Thus, preliminary washing experiments took place on glass slides by applying several
solvents, such as water, 1% SDS, 0.2% pepsin at pH 2, 0.1 mM NaOH, 10% HNO3, 10%
CH3COOH. For that purpose, we placed the respective MIP and NIP layers into petri dishes
containing the respective solvent and stirred the medium for 30 minutes followed by drying.
The xanthoprotein reaction then revealed any residual protein on the surface, both by
inspecting the substrates with the naked eye and taking UV-Vis spectra. The results of the
former are summarized in Table 5 (next page).

53
Table 5: Xanthoprotein reaction results for different washing steps.
Blank Sediment of BSA
Glass (with or without sediment of BSA) - +
NIP MIP
Before washing - +
After washing with
Water - +
1% SDS - +
0.1 mM NaOH Polymer destroyed Polymer destroyed
10% HNO3 - +
1% SDS in 10% CH3COOH - +
0.2% Pepsin at pH 2 - -
Notes: + : positive result
- : negative result
Obviously, only the pepsin solution led to protein-free samples during first inspection (Table
5).
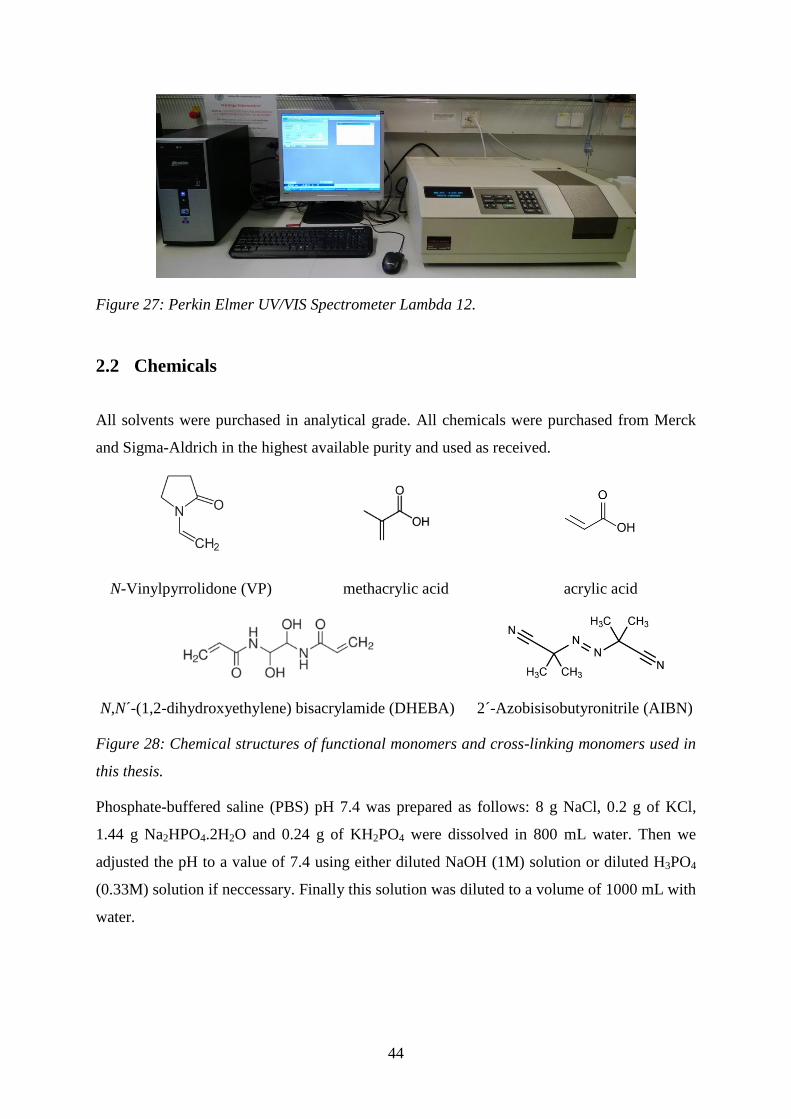
However, for final assessment the UV spectra also needed to be considered. They are
summarized in Figure 33. The baselines of the different spectra are not the same due to
different layer heights of the different samples. Generally speaking, all NIP-coated substrates
did not show any characteristic absorbance bands in this spectral region between 360 nm and
500 nm. The BSA in the MIP is characterized by the absorption band fragment at 360 nm.
Measurements at shorter wavelength became problematic due to UV absorption by the glass
substrates. However, for screening purposes the difference between MIP and NIP spectra is
sufficient (Figure 33). Apparently, washing with 1% SDS solution or 1% SDS in 10%
CH3COOH solution did not lead to any signal change (Figure 33B and C compared to Figure
33A), whereas 0.2% pepsin pH 2 at 40oC for 90 minutes causes disappearance of absorbance
band on BSA-MIP spectra (Figure 33D: BSA-MIP and NIP spectra are the same). It was
proven that 0.2% pepsin at pH 2 can thoroughly remove BSA from the layer.
54
Figure 33: The shape of spectra proved the presence of BSA on the layer. Blank glass slides
were used as reference samples.

55
2.5.2 Testing imprinting efficiency by ATR spectroscopy
Additionally, ATR spectroscopy was tested in terms of being suitable to demonstrate the
presence or absence of BSA. First, the synthesized “fresh” polymers contain large amounts of
water. Consequently, spectra of BSA in dry and powdered form, polymer, and mixture of
polymer and BSA (generated by adding 1 mg BSA into the oligomer solution) were recorded
(Figure 34).
Figure 34: ATR spectra of BSA, polymer R01 and mixture of oligomer R01 and BSA. The
samples were prepared in dry and powdered materials.
In the ATR spectra of lyophilized BSA powder, the bands at 3280, 2935, 1644, and 1532
(cm-1
) were assigned to the stretching vibration of -OH, amide A (mainly -NH stretching
vibration), amide I (mainly C=O stretching vibrations), and amide II (the coupling of bending
vibrations of N–H and stretching vibrations of C–N) bands, respectively (89). Unfortunately,
the polymer also shows all these functional groups leading to similar spectral bands (Table
6). It was impossible to distinguish BSA among BSA, polymer and their mixture.

56
Table 6: Infrared absorption of BSA, polymer R01 cm-1
.
Assignments of Vibration
Wave number (cm-1
)
BSA Polymer
-OH 3580 3580
amide A 2935 2935
1699
amide I 1644 1646
amide II 1532 1539
C-N-H angles 1452 1445
COO- 1394 1388
1242
1170
1098 1092
2.5.3 Testing imprinting efficiency by STM analysis
The overall dimensions of a BSA molecule are around 21.5x4.5x14.2 nm. Hence, it is too
small for monitoring the imprinting effect by AFM under usual ambient conditions. STM is
the better choice because of lateral resolution reaching below 1 nanometer. However, first a
conducting surface had to be generated for STM measurement. Thus, MIP and NIP surface
were sputtered with approximately 40 nm of gold. The sample-pretreatment procedure is
summarized in Figure 35. A Cressington 208HR Turbo Sputter was used operated at the
following process parameters: 0.02 mbar pressure, 500mV voltage bias and 50 pA current. Such
an approach homogeneously deposits gold onto the polymer surface. Previous work in the group
has shown that doing so is in principle suitable for visualizing protein MIP (51)(90).

57
Figure 35: Procedure for generating protein imprint image by STM.
The surface of blank glass, BSA incubated on microscope glass slide (prepared in the part
2.3.2), a gold electrode surface, washed BSA-MIP surface and washed NIP surface, respectively,
were assessed. Figure 36, Figure 37 and Figure 38 summarize the outcome of these
measurements. Figure 36 shows 3D images of the respective surface scans. Figure 37 and
Figure 38 each show the surfaces once more in 2D view as well as the respective cross-
sections to quantify height and surface roughness. Figure 37A points out the gold
agglomerated on the surface of the microscope glass slide as dots of approximate 20 nm in
diameter. This picture is quite similar for all of other surfaces (Figure 37, Figure 38). Thus, it
causes some difficulties to see any cavities in the dimensions of BSA (4 nm or 14 nm or 21
nm). Although no direct proof of cavities resulting from BSA results from these images,
some imprinting effect follows from the roughness of these surfaces. Obviously, the
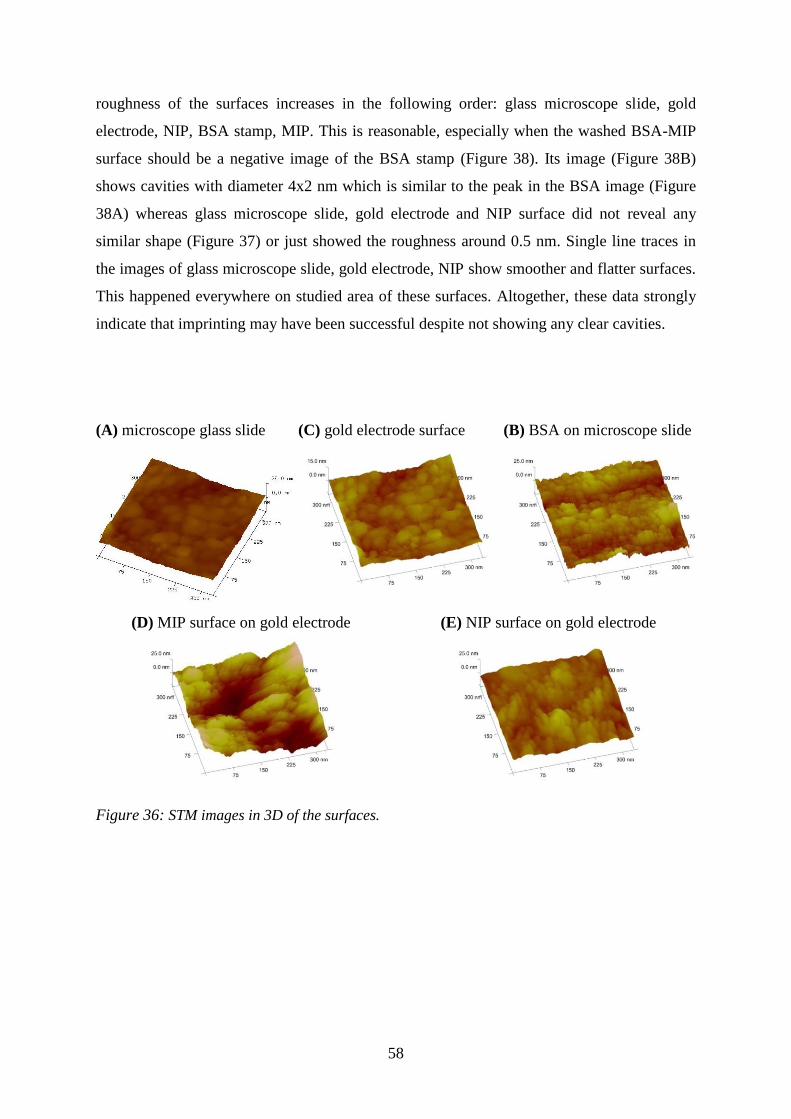
58
roughness of the surfaces increases in the following order: glass microscope slide, gold
electrode, NIP, BSA stamp, MIP. This is reasonable, especially when the washed BSA-MIP
surface should be a negative image of the BSA stamp (Figure 38). Its image (Figure 38B)
shows cavities with diameter 4x2 nm which is similar to the peak in the BSA image (Figure
38A) whereas glass microscope slide, gold electrode and NIP surface did not reveal any
similar shape (Figure 37) or just showed the roughness around 0.5 nm. Single line traces in
the images of glass microscope slide, gold electrode, NIP show smoother and flatter surfaces.
This happened everywhere on studied area of these surfaces. Altogether, these data strongly
indicate that imprinting may have been successful despite not showing any clear cavities.
(A) microscope glass slide
(C) gold electrode surface
(B) BSA on microscope slide
(D) MIP surface on gold electrode
(E) NIP surface on gold electrode
Figure 36: STM images in 3D of the surfaces.

59
(A) Microscope glass slide
(A’)
(B) gold electrode surface
(B’)
(C) NIP surface on gold
electrode
(C’)
Figure 37: STM images of the surfaces. A’, B’, C’: Cross section at black line of A,B,C,
respectively.

60
(A) BSA on Microscope
slide
(A’)
(B) MIP surface on gold
electrode
(B’)
(C) NIP surface on gold
electrode
(C’)
Figure 38: STM images of the surfaces. A’, B’, C’: Cross section at black line of A,B,C,
respectively.

61
3 POLYMER OPTIMIZATION AND THIN FILMS
After having found the optimal experimental parameters for imprinting procedures including
polymerization and removal of template, we changed to QCM to evaluate the sensor effects
of BSA MIP.
3.1 Preliminary QCM measurement
3.1.1 Procedures
In order to perform QCM measurements, the sensor was first mounted in the cell described in
part 2.1 , followed by sequentially washing with 10% acid acetic, 1% SDS and water as well
as measuring the resonance frequency until a stable signal was reached. Subsequently, the
analyte was injected into the measuring cell and measurements were restarted. After reaching
constant frequency value, the analyte was removed by flushing with a washing solution (1%
SDS and 10% acetic acid or 0.1 M NaCl or 10 mM PBS pH 7.4). In this stage, the frequency
signal was not recorded, because it would not be stable because of rapidly changing
conductivity in its environment. Finally, the measuring chamber was filled with water in
order to reach baseline again.
3.1.2 First QCM data
One of the first measurements is depicted in Figure 39. During the first 30 minutes, the
constant signal indicates that the sensor is in equilibium with water leading to horizontal base
line signal. Adding 100 ppm BSA solution in water decreases the frequency by about 950 Hz
on the MIP electrode, while the reference electrode simultaneously yields a similar response
of -500 Hz. During rinsing with 1% SDS for 30 minutes and water for 15 minutes afterwards,
readout of the signals from the oscillator was not recorded. Finally, the baseline was reached
again after injecting water into the cell. Obviously, this procedure completely removed the
incorporated BSA molecules from the layer, because the frequency reached its initial value.
However, the process is rather slow: the QCM measurement reveals that even after 8.5 hours
of exposing the sensor to BSA, the frequencies on the MIP/NIP layers decrease continuously.
This, is rather long compared to other analytes, such as insulin assessed with the same
polymer composition (60) or wheat germ agglutinin lectin based on a slightly different one

62
(acrylamide, methacrylic acid, and methylmethacrylate as the monomers, DHEBA as the
cross-linker and dimethyl sulfoxide as solvent) (51).
Figure 39: Frequency responses of polymer layer R01 exposed to 100 ppm BSA solution.
Figure 40: Signal drift on the polymer layer R01 exposed to 100 ppm BSA solution.
When attempting to reproduce this measurement via another QCM with the same coatings,
the results indicated even longer response time (Figure 40). Similar to the former result, the
frequency gradually decreases when the layer is exposed to 100 ppm BSA. Furthermore, the
MIP as well as NIP responses tended to decline in the same slope. Neither of the two signals
returned to the initial baseline after washing. The endless signal can help to affirm that
measuring in a long time is not a good choice. This may be explained by the comparably low
amount of cross-linker in the polymer (DHEBA 30% w/w): It yields a somewhat flexible
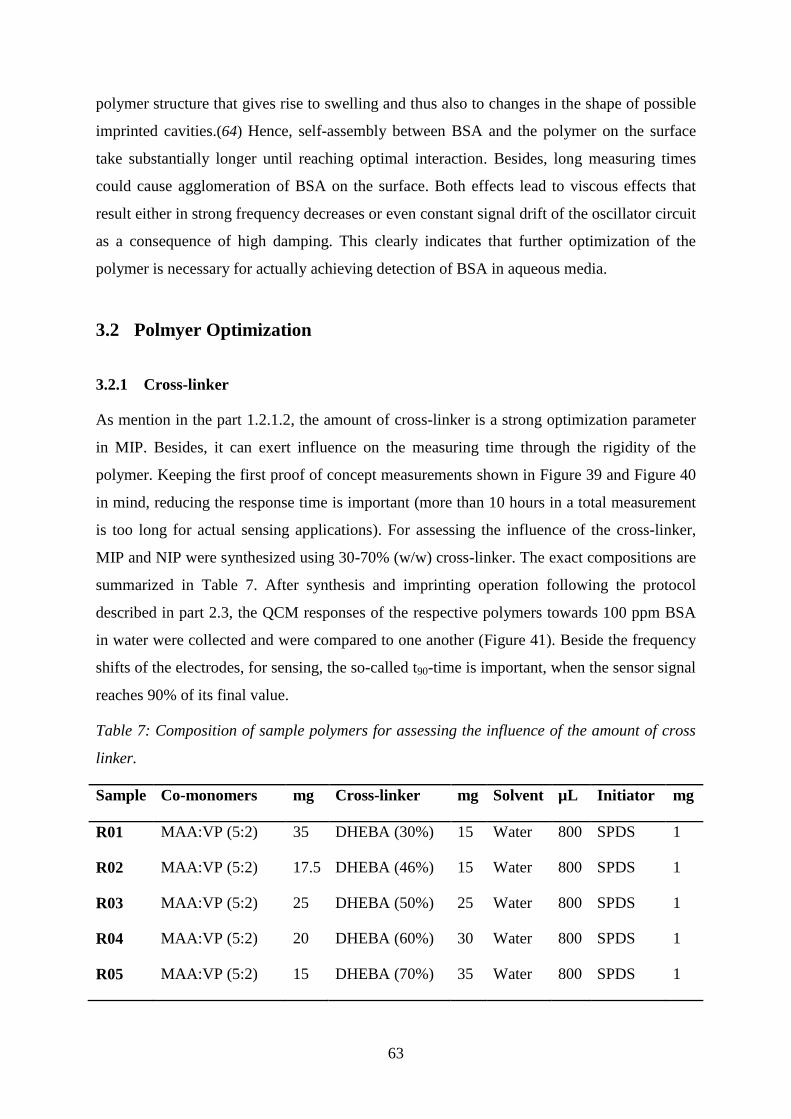
63
polymer structure that gives rise to swelling and thus also to changes in the shape of possible
imprinted cavities.(64) Hence, self-assembly between BSA and the polymer on the surface
take substantially longer until reaching optimal interaction. Besides, long measuring times
could cause agglomeration of BSA on the surface. Both effects lead to viscous effects that
result either in strong frequency decreases or even constant signal drift of the oscillator circuit
as a consequence of high damping. This clearly indicates that further optimization of the
polymer is necessary for actually achieving detection of BSA in aqueous media.
3.2 Polmyer Optimization
3.2.1 Cross-linker
As mention in the part 1.2.1.2, the amount of cross-linker is a strong optimization parameter
in MIP. Besides, it can exert influence on the measuring time through the rigidity of the
polymer. Keeping the first proof of concept measurements shown in Figure 39 and Figure 40
in mind, reducing the response time is important (more than 10 hours in a total measurement
is too long for actual sensing applications). For assessing the influence of the cross-linker,
MIP and NIP were synthesized using 30-70% (w/w) cross-linker. The exact compositions are
summarized in Table 7. After synthesis and imprinting operation following the protocol
described in part 2.3, the QCM responses of the respective polymers towards 100 ppm BSA
in water were collected and were compared to one another (Figure 41). Beside the frequency
shifts of the electrodes, for sensing, the so-called t90-time is important, when the sensor signal
reaches 90% of its final value.
Table 7: Composition of sample polymers for assessing the influence of the amount of cross
linker.
Sample Co-monomers mg Cross-linker mg Solvent µL Initiator mg
R01 MAA:VP (5:2) 35 DHEBA (30%) 15 Water 800 SPDS 1
R02 MAA:VP (5:2) 17.5 DHEBA (46%) 15 Water 800 SPDS 1
R03 MAA:VP (5:2) 25 DHEBA (50%) 25 Water 800 SPDS 1
R04 MAA:VP (5:2) 20 DHEBA (60%) 30 Water 800 SPDS 1
R05 MAA:VP (5:2) 15 DHEBA (70%) 35 Water 800 SPDS 1

64
Figure 41: Response of MIP, NIP applying amount of cross-linker ranged 30-70% (w/w)
towards 100 ppm BSA and measuring time as the respective responses reaching 90% height.
First, Figure 41 shows that the response time of the sensors increases from 6.5 hours to more
than 9 hours, then decreases to less than one hours when the percentage of cross-linker
increases from 30% to 70% (blue columns). Additionally, both the absolute frequency shifts
( ) of MIP and NIP, respectively, decrease as the cross-linker level increases from 46% to
70% (see black and grey columns) as well their ratio (MIP/NIP). The signals on MIP decline
more strongly, whereas the NIP effects remain rather constant between 46 and 60% cross-
linker and slightly decrease only afterwards. The reason for this may be twofold: first, the
higher the amount of cross-linker, the lower the amount of monomers on the surface that can
undergo hydrogen bonding. This leads to reduced affinity to BSA both on the NIP and on the
MIP. Additionally, the polymer structures become much more rigid when increasing the
content of DHEBA. This in principle limits accessibility of binding sites in cavities of the
MIP for the respective protein. The result was compatible with the conclusion from the
review paper by Turner et al. (67) that a low degree of cross-linker should be used in order to
ensure mobility of large molecules in MIP. However, it also causes rapid loss in imprinting
properties of the respective polymer and lower stability towards changes in the environment.
The reason is that polymers swell in water (or solvent in general). This changes the
morphology of the imprinted cavities and results in poor imprinting effects. They overcame
this problem by using a high percentage (90%) of cross-linker, which reduces swelling and
thus improves the stability and selectivity of imprinted cavities. However, the resulting small

65
pore sizes of highly cross-linked polymers restrict access of high molecular weight proteins
towards the imprinted sites (91)(92).
At the lowest cross-linker content (30%), the imprinted polymer yielded almost the same
mass effects towards BSA (frequency shift -950 Hz) as in the case of 46% cross-linker
(frequency shift -970 Hz) whereas the respective NIP signals differ by as much as 100 Hz. In
this case, one can assume that although BSA more easily interacts with the more flexible
polymer (in case of NIP), swelling in the less cross-linked polymer deforms the imprinted
cavities of the surface thus decreasing their affinity towards BSA in case of MIP. With 46%
DHEBA, this effect is much less pronounced. The resulting stability in conformation
therefore leads to improved interaction. Further increasing the amount of cross-linker reduces
the absolute frequency shifts due to increasing rigidity of the polymer. As already mentioned
the reasons for this are reduced surface functionality and increasing rigidity of the polymer
that in principle hinders adaptive processes during recognition events. While the relation
between NIP signal and the amount of cross-linker decreases slowly from 30% to 70% cross
linker, MIP yielded slightly different results. Between 50 and 60% cross-linker, the signals of
the MIP and NIP-coated electrode remain basically constant and the ratio MIP/NIP and the
different MIP-NIP somewhat decrease in general tendency. However, when further
increasing cross-linking by 10% - from 60% up to 70% - lead to very appreciable decrease in
response time on the MIP, but also to strongly reduced sensor responses. Obviously,
interaction with the cavities of the MIP is substantially reduced when cross-linker content is
higher than 60%. However, at 70% cross-linker, despite the fact that the signals of both MIP
and NIP were the lowest within this measuring series, the response times also reached a
minimum in measuring of around 50 minutes until equilibrium (Figure 45), which is
acceptable for first screening.
In more detail, with 46% cross-linker degree, the NIP response towards BSA solution
reached equilibrium very fast: Its t90-time was around 1 hour, whereas t90-time of MIP
response last longer than 9 hours and it showed long drift (Figure 42). This further supports
the idea that the more rigid a surface is, the faster interaction towards the analytes is.
However, the polymer obviously is not yet sufficiently hard.

66
Figure 42: Sensor responses of polymer R02 (46% cross-linker) exposed to 100 ppm BSA
solution.
Besides, the exceeding long measurement could cause cross talk between the MIP and NIP
electrical signal. This phenomena also happen with the 50%, 60% cross-linker polymer. After
7 hours measuring, the NIP signal seemed to be influenced by MIP signal when its curve
changed in similar shape (Figure 43 in the next page). Furthermore, the noise levels in Figure
42 and Figure 43 also indicate that the flexible polymer could expend in many way to self-
organize for binding analytes, which leads to decreasing electronic quality.
Figure 43: Sensor responses of polymer R03 (50% cross-linker) exposed to 100 ppm BSA
solution.

67
Figure 44: Sensor responses of polymer R04 (60% cross-linker) exposed to 100 ppm BSA
solution.
Starting from 60% cross-linker level and higher, the rigidity of polymers obviously strongly
inhibits such self-organizing, because t90-times are lower by half (60% cross-linker) and 10
times (70% cross-linker) (Figure 41). Thus, this led to smooth responses without any
electrical problems (Figure 44 and Figure 45).
Figure 45: Sensor responses of polymer R05 (70% cross-linker) exposed to 100 ppm BSA
solution.
Figure 45 shows an appreciable measurement with reasonable measuring time, low noise, and
acceptable imprinting effect (MIP/NIP ratio was 1.58). BSA adsorbed more easily, rapidly
and reversibly. The less flexible polymers should also be less prone to swelling hence

68
increasing the electronic quality of the QCM frequency signals and reducing measuring time.
Compared to the information in Figure 7, the ratio of cross-linker should be more than 60
mol% to obtain optimal selective recognition. This is in line with previous literature studies
on EGDMA, TMDMA and DVB in organic systems for chromatography (64), although
polymers in this thesis are synthesized in aqueous solution. Hence, further experiments to
improve the affinity of MIP by controlling the functional monomer and further
polymerization factors are based on this material with 70% cross-linker.
Figure 46: Sensor responses of polymer R05 (70% cross-linker) which is prepared on two
separated QCMs exposed to fresh 100 ppm BSA solution stored at 4oC in 1 hour (A,B).
Additionally, to assess polymer reproducibility, NIP and MIP were synthesized following
recipe R05 (i.e. 70% cross linker) and QCMs with blank electrodes were used as a reference.

69
Furthermore, these experiments also assessed the effect of ageing of the BSA solution. For
that purpose, we prepared a protein standard and stored it at 4°C for 1 hour and 14 days,
respectively, before recording the respective QCM responses with the abovementioned
polymers.
Figure 47: Sensor responses of polymer R05 (70% cross-linker) which is prepared on two
separated QCMs exposed to aged 100 ppm BSA solution stored at 4oC in 14 days (A,B).
As we can see in Figure 46 and Figure 47, also the gold surface shows some minor affinity to
BSA yielding frequency shifts of around -50 Hz with new (-50 Hz and -70 Hz in Figure 46)
and aged (-40 Hz and -45 Hz in Figure 47) BSA standard solutions. Thus, the response of
BSA on polymers should be higher than 50 Hz to ensure the functionality of the polymer. To

70
evaluate every response of MIP and NIP separately in this case, the frequency shift values
were compared against the signal of the respective bank electrode.
Furthermore, Figure 48 summarizes the results shown in Figure 46 and 47 and compares
them to measurements obtained with a QCM containing a MIP on one electrode and a NIP on
the other. This latter measurement reveals almost the same frequency shifts (-520 Hz on MIP
and -329 Hz on NIP in case of “two separated QCMs”; -490 Hz and -310 Hz, respectively in
case of “one QCM”). The ratio MIP/NIP in both of cases is the same, namely ~1.6 (490
Hz/310 Hz of MIP and NIP prepared on one QCM and 520 Hz/329 Hz of MIP and NIP
prepared on separated ones). The difference in absolute values is rather low and thus shows
appreciable reproducibility between different polymer batches. This is an issue especially in
the case of radically polymerized materials. It also strongly supports the measuring approach
of always using a NIP as a reference and measuring with two-electrode QCM.
Figure 48: Sensor responses of polymer R05 prepared on one QCM or on two separated
QCMs (70% cross-linker) exposed to 100 ppm BSA solution.
To compare the effect of the sensor towards fresh BSA solution and aged BSA solution, the
results was summarized in Figure 49. As we can see, the aged solutions lead to significantly
higher sensor responses, i.e. the net frequency shift (NIP and MIP increases 2.2 and 3.0
times, respectively. The main difference is in the MIP, but also NIP affinities increase.
Interestingly, the MIP signal for the 14-day-old solution shows some frequency increase after
going through a minimum measuring time compared to NIP signal. The 14-day-old solution

71
revealed some amorphous sediments observable by the naked eye. Although the solution was
filtered through a membrane with 0.45 µm pore size, the agglomeration of protein on the
surface could be the possible explanation for the fast, deep frequency shift of MIP.
Furthermore, in aged solutions, in which BSA may already have partly denatured, its
quaternary structure may have expanded and polymer chains may have broken. Such
fragments and more flexible structures could reach more binding sites and interact with
cavities. Consequently, further experiments used only freshly prepared protein solutions.
Figure 49: Response of polymer R05 to BSA stored at 4oC for 1 hour (freshly prepared BSA
solution) and for 14 days (aged BSA solution) after calibrating by response of blank
electrode.
3.2.2 Monomer
The next step was to optimize the functional monomer to find an appropriate optimized
polymer composition to enhance the affinity of polymers towards the template and thus
increasing the number of MIP recognition sites.
Table 8: Role of VP in part of interaction sites.
Recipe Co-monomer mg Cross-linker mg Solvent µL Initiator mg
R05 MAA:VP (5:2) 15 DHEBA (70%) 35 Water 800 SPDS 1
R06 MAA 15 DHEBA (70%) 35 Water 800 SPDS 1

72
For testing the role of VP in polymer composition, sample R06 (Table 8) with only MAA as
monomer was coated on QCM and exposed to 100 ppm BSA. Figure 50 shows that the
polymer without VP leads to substantially lower sensor responses to BSA: nearly 4 times less
in MIP and more than 5 times in NIP. Although BSA molecules have many interaction sites
with -COOH groups (for instance at least 7 positions binding with arachidonic acid (27)), this
does not translate into sensor signals: NIP show similar affinity towards BSA as blank
electrodes (frequency shift of -55 Hz)! Therefore, it seems that there are hardly any
interactions between the -COOH groups of MMA on the polymer surface and the protein.
Besides, because the isoelectric point of BSA is 4.7 (Table 1), it should perform like an acidic
agent in aqueous solution, which also prevents the formation of -COOH dimers. Overall,
removing the amino groups of VP from the polymer obviously reduces the chemical affinity
of polymer towards BSA. The response of MIP (125 Hz, 2.3 times higher than NIP),
however, reveals the importance of steric adaption of recognition sites to the 3D structure of
the respective protein template. Although polymer R06 indicated better imprinting
performance (ratio MIP/NIP was 2.27 of R06 compared to 1.58 times of R05) (Figure 50),
MIP frequency responses are only 100 Hz higher than noise (around 20 Hz), and was only 70
Hz higher than NIP response (55 Hz). In terms of sensitivity, these results are of course not
promising. Furthermore, decreasing the affinity by removing the amino groups caused the
reaction time to increase by more than a factor of two (Figure 50).
Figure 50: Comparison of polymers R05 and R06.

73
Generally, Figure 50 shows that VP is indispensable in order to improve the sensitivity of the
polymer layer.
The selection of an imprinting protocol always relies on balancing the combination of
monomers containing strong/dissociable functionalities (e.g. methacrylic acid) as well as
weakly/neutrally binding monomers (e.g. acrylamide) for template recognition. (47)(67)
Additionally, according to Figure 2 all hydrophobic regions of the BSA molecule (that are
seminal for fatty acid transport in the serum) are protected from the surrounding environment
by more hydrophilic protein moieties. Therefore, the outer surface of BSA is rather
hydrophilic. Changing the hydrophilic properties of the polymer interface therefore should be
a tool for enhancing affinity between BSA and the respective MIP surface. One possibility
for doing so is to eliminate the methyl groups of methacrylic acid, because this should result
in stronger hydrogen bonding. To test this, we thus replaced methacrylic acid with acrylic
acid in recipe R05 (Table 9) leading to polymer batch R07. Following the procedures set out
in section 3.1.1, the QCM responses towards 100 ppm BSA solutions of all MIP and NIP
were recorded for comparison.
Table 9: Changing hydrophobic characteristic of monomer for improving the selectivity.
Recipe Co-monomer mg Cross-linker mg Solvent µL Initiator mg
R05 MAA:VP (5:2) 15 DHEBA (70%) 35 Water 800 SPDS 1
R07 AA:VP (5:2) 15 DHEBA (70%) 35 Water 800 SPDS 1
Figure 51: Response of respectively polymer (R05 and R07) to 100 ppm BSA solution.

74
As one can clearly see in Figure 51, using acrylic acid substantially improves sensitivity: NIP
signals increase by a factor of 2.2, those on MIP even 3.4 times. Obviously, the methyl group
in methacrylic acid reduces both the overall response of the sensors and the actual imprinting
effect due to less polar interactions with functional groups of protein.
Figure 52: Sensor responses for polymers R07 exposed to 100 ppm BSA.
Usually, increasing affinity additionally means decreasing reaction time. However, as one can
see in Figure 52, the signal of the NIP-coated electrode reaches stable sensor signals after
approximately 2 hours, which is nearly the same result as with other polymers containing
70% ross-linker. On the MIP, reaching equilibrium needs more time: The t90-time of MIP was
4.8 hours. The reason for this may be that the template requires more time to arrange itself
into the cavity. Consequently, the next step was to optimize the ratio of functional groups (-
COO- of AA and -NH3
+ of VP) addressing positively and negatively charged side groups on
the outer protein surface. Table 10 sums up the data obtained for various ratios of AA and VP
in the monomer mixture.
Table 10: Monomer mixtures tested for improving sensitivity.
Recipe Co-monomer mg Cross-linker mg Solvent µL Initiator mg
R07 AA:VP (5:2) 15 DHEBA (70%) 35 Water 800 SPDS 1
R08 AA:VP (1:1) 15 DHEBA (70%) 35 Water 800 SPDS 1
R09 AA:VP (2:3) 15 DHEBA (70%) 35 Water 800 SPDS 1

75
Figure 53: Responses of polymer R07, R08, R09, respectively to 100 ppm BSA.
As one can see in Figure 53 summarizing the QCM sensor responses for these polymer
recipes, the response time and sensor sensitivity are inversely proportional to the amount of
VP in the monomer mixture, indicating that acrylic acid also plays an important role. The
optimal composition is achieved for the material with the component ratio of 2:3 (AA:VP),
which leads to a signal ratio between MIP and NIP of roughly 1.8 and the fastest sensor
response (t90-time just below one hour). Therefore, the material with monomer weight ratio of
2:3 (AA:VP) and 70% cross-linker was used for further investigations.
3.2.3 Polymerization Solvent
In molecular imprinting, the solvent controls the strength of non-covalent interactions
between template and monomers and therefore makes an important contribution to polymer
morphology. Although the mainstream of imprinting techniques basically relies on organic
solvents, water should be applied in biological analysis because of its dominant role in
natural systems. (67) In practice, water rather disturbs ionic interactions and H-bonds.
However, those are the major driving force in interactions between the template and
monomers, which usually work better in organic solvents. Hence, mixtures of an organic
solvent and water can be applied for increasing complex formation between the polymeric
sites and templates that involve electrostatic interactions. Another approach is to first prepare
molecularly imprinted polymers in organic media, where the interactions are strong, and
subsequently use them in aqueous environments. (65) An example for this is a, insulin MIP
sensor generated by surface molecular imprinting in dimethyl formamide and subsequent

76
QCM measurement in aqueous medium (93). Other reports studied the interaction of haemin
with albumin in dimethyl sulphoxide (DMSO)/water (3:5, v/v) mixtures, in which albumin is
not denatured (21)(22)(94). DMSO is miscible with water in any ratio. In the light of this,
polymers based on the optimized monomer ratio of 2:3 (AA:VP) were synthezied in variety
of solvents such as DMSO, a mixture of dimethyl sulfide (DMS) and Tetrahydrofuran (THF),
and a mixture of DMSO and water following the synthesis procedures summarized in section
2.3.1 (Table 11). Additionally, the composition containing 50% cross-linker was used to
increase the accessibility of binding sites towards the protein in order to amplify the MIP
signal.
Table 11: Polymer recipes for assessing the influence of solvent on the quality of MIP.
Recipe Co-monomer:cross-
linker
mg Solvent µL Initiator mg
R09 AA:VP: DHEBA (6:9:35) 50 Water 800 SPDS 1
R10 AA:VP: DHEBA (6:9:35) 50 DMSO 400 AIBN 1
R11 AA:VP: DHEBA (2:3:10) 50 THF:DMS (1:1) 400 AIBN 1
R12 AA:VP: DHEBA (2:3:20) 50 Water:DMSO (80:1) 810 SPDS 1
Figure 54: Response of polymers synthesizing in different organic solvents to 100 ppm BSA.

77
Figure 54 summarizes the corresponding sensor results: As can be seen, DMSO reduces the
binding of BSA on the surface aproximately by 40% in both MIP and NIP compared to
water, but it increases the imprinting effect: The signal ratio between MIP and NIP is 2.1,
which is 15 percent higher than in the case of water as the solvent (1.8). The use of a polar
aprotic solvent hence obviously increases binding affinity of the polymer with template, but it
decreases the number of imprinted sites in the polymer. According to a review by Spivak (76)
there are two effects of the polymerization solvent, referred to as the porogen, on the
formation of MIPs: supporting assembly of the pre-polymer complex and formation of the
porous structure of the polymer. Non-polar solvents direct the template and functional
monomer toward complex formation, and non-polar porogens cause poor capacity for
hydrogen bonding. This can explain why DMSO resulted in lower QCM signals for both MIP
and NIP when compared to polymers synthesized in water. However, the imprinting effect as
such - i.e. the signal ratio between MIP and NIP - did not significantly improve by changing
the solvent. Additionally, when spin-coating the pre-polymer solution, DMSO required
longer spinning time and higher speed than water for generating layers with suitable
thickness (around 200 nm), because its boiling point is 189 .
Table 12: Effect of changing cross-linker content and polarity of solvent in acrylate system of
polymer.
Improvement factor
MIP NIP MIP/NIP
Decreasing cross-linker content
Compare R03 to R05 (Decreasing cross-linker content from
70% to 50%)
1.6 1.3 1.2
Change from protic to aprotic solvent
Compare R10 to R09 (using DMSO instead of water)
0.7 0.6 1.2
Decreasing both of cross-linker content and polarity of
solvent
Compare R11 to R09 (decreasing Cross-linker content from
70% to 50% and using DMS:THF 1:1 instead of water)
5.0 4.2 1.4

78
Hence, a mixture of THF and DMS in a ratio of 1:1 was tested due to expecting three
advantages: Firstly, the boiling points of THF as well as DMS are lower than of water,
therefore it should be easier to control coating thickness. Secondly, the solvent is more
hydrophobic than DMSO, so the polymer surface layer should be smoother, measuring time
should be shorter and NIP signals should be lower. Thirdly, the ratio MIP/NIP should
improve, if the protein does not denature during imprinting. As one can see, doing so
increases sensitivity of both MIP and NIP: signals rise by 5 and 4.2 times, respectively. The
ratio between MIP and NIP also improved, although slightly, namely 1.4 times in the case of
THF:DMS as compared to water. Table 12 summarizes the change of sensor effects when the
polarity of solvent was changed together with some minor variation in cross-linker content
(i.e changing it from 70% in water and DMSO, respectively, to 50%). As already pointed out
in section 3.2.1, decreasing the degree of cross-linker leads to higher affinity of the polymer
towards BSA, but lower polarity of the solvent causes the opposite effect. Therefore, the
combination of these two changes should counteract one another and hence not change
affinity too dramatically. Furthermore, decreasing both the cross-linker content and solvent
polarity leads to increasing imprinting effects, i.e. larger differences between MIP and NIP.
The non-polar solvents very strongly increase the sensor responses. This clearly shows that
H-bonding/polar interactions lead to the main effect in recognition within the BSA-MIP
system. Furthermore, the signals of both MIP and NIP increase. Thus, the absolute difference
and hence imprinting effect also increases, but not the relative one, i.e. the ratio between the
two. Overall, it is therefore questionable to use non-polar solvents especially keeping in mind
the fact that they may lead to problems with protein denaturing.
In chromatography, the following rules were stated by David A. Spivak (76): “For weak non-
covalent interactions, using nonpolar, nonhydrogen-bonding solvents improves selectivity in
MIPs” and “Optimum rebinding conditions for a given template should follow closely the
polymerization conditions, e.g., mobile phases should include the solvent used as porogen”.
These gave the idea to use a mixture of DMSO and water as porogen for improving impriting
efficacy. Transferring this insights to sensor systems lead to polymer R12 polymerized in
water containing slightly more than 1% DMSO. Exposing this layer to 100 ppm BSA (Figure
55) showed a surprising result: The NIP response decreased 1.5 times but the MIP response
increased 1.7 times compared to water as solvent; the NIP response increased slightly (1.2
times) and the MIP response increased 2.7 times compared to DMSO as solvent. This led to
dramatically increasing MIP/NIP ratio compared to both of pure solvents . However, t90-time
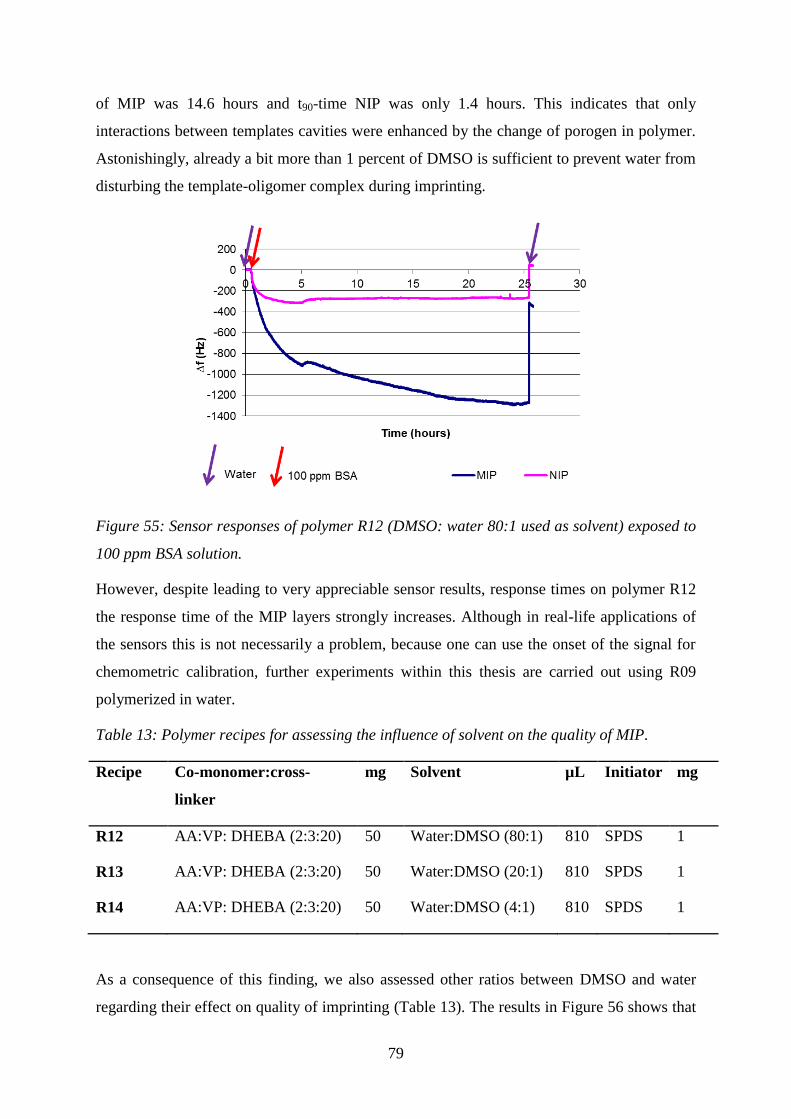
79
of MIP was 14.6 hours and t90-time NIP was only 1.4 hours. This indicates that only
interactions between templates cavities were enhanced by the change of porogen in polymer.
Astonishingly, already a bit more than 1 percent of DMSO is sufficient to prevent water from
disturbing the template-oligomer complex during imprinting.
Figure 55: Sensor responses of polymer R12 (DMSO: water 80:1 used as solvent) exposed to
100 ppm BSA solution.
However, despite leading to very appreciable sensor results, response times on polymer R12
the response time of the MIP layers strongly increases. Although in real-life applications of
the sensors this is not necessarily a problem, because one can use the onset of the signal for
chemometric calibration, further experiments within this thesis are carried out using R09
polymerized in water.
Table 13: Polymer recipes for assessing the influence of solvent on the quality of MIP.
Recipe Co-monomer:cross-
linker
mg Solvent µL Initiator mg
R12 AA:VP: DHEBA (2:3:20) 50 Water:DMSO (80:1) 810 SPDS 1
R13 AA:VP: DHEBA (2:3:20) 50 Water:DMSO (20:1) 810 SPDS 1
R14 AA:VP: DHEBA (2:3:20) 50 Water:DMSO (4:1) 810 SPDS 1
As a consequence of this finding, we also assessed other ratios between DMSO and water
regarding their effect on quality of imprinting (Table 13). The results in Figure 56 shows that

80
higher DMSO content in the solvent mixture just made resulted in sensor characteristics that
are increasingly similar to those obtained with pure DMSO. The signal ratio MIP/NIP
gradually increases depending on the amount of DMSO in the polymerizing solvent (1.6, 1.8,
2.1, respectively, towards 5%, 20%, 100% of DMSO). This opens the question what is the
role of small amount of DMSO in the mixture.
Figure 56: Response of polymers synthesizing in different organic solvents (different ratio of
DMSO and water) to 100 ppm BSA.
3.3 Sensor characteristic
Polymer R09 served for testing reproducibility and dynamic range.
3.3.1 Reproducibility
For testing reproducibility of the measurement process, a QCM was exposed to 100 ppm
BSA solution three times to determine reproducibility. The difference between MIP and NIP
response was in turn 370, 355, 365 Hz and their ratio (MIP/NIP) was in turn 2.15, 2.18, 2.01
(Figure 57). Thus, reproducibility is in the range of roughly +/-3%.

81
Figure 57: Reproducibility measurements with 100 ppm BSA on polymer R09.

82
3.3.2 Sensor Characteristic
We investigated the sensor characteristic by measuring a range of BSA solutions from 100
ppm to 10 ppm. Figure 59 (next page) shows the resulting responses of polymer R09.
Because each measurement took place on a different day, noise is slightly different. The
average of difference between MIP and NIP response of the measurement in section 3.3.1
was 355 Hz, with the noise of around 30 Hz (Figure 57), compared to this measurement of
315 Hz with the noise around 10 Hz (Figure 59). As mentioned in section 3.1.2, the
corresponding of each QCM depends on the thickness of gold layer, polymer layer and
environmental factors, such as temperature. Thus, the response of QCM toward 100ppm BSA
solution can be considered the same in both of these cases.
These measurements reveal distinct, linear response behavior between 10 ppm and 100 ppm
BSA with a slope of 5.66, an intercept of 156.91 and a correlation coefficient of 0.99 in MIP;
2.95, 110.92, 0.99 respectively in NIP; 2.71, 46.00, 0.99 respectively in the difference
between MIP and NIP response. Generally, the MIP shows effects that are almost two times
higher than the NIP. (Figure 58)
Figure 58: QCM sensor characteristic of polymer R09.

83
Figure 59: Measuring different concentrations of BSA solutions for determining the sensor
characteristic of the polymer R09.


85
4 MIP NANOPARTICLES
The main aim of this thesis is to achieve optimum sensitivity and selectivity of protein MIP
sensors. For achieving this, the composition of polymer was adjusted. However, these results
show some limitation in sensitivity and in response time of the sensor. In a next step, the idea
is hence to increase the number of interaction sites on the sensor surface. Instead of further
changing the composition of the polymer layer for example by adjusting polarity, roughness,
heterogeneity or using higher amounts of template, a different and direct way for increasing
the number of recognition sites is assessed by the design of MIP nanoparticles.
4.1 Nanoparticle synthesis
The optimized polymer (R09) served as the basis for generating MIP and NIP nanoparticles
by precipitation polymerization, where one injects the oligomer into a precipitation solvent
that does not dissolve the oligomer.
Figure 60: Scheme of nanoparticles synthesis.

86
In the case of nanoparticles it is not possible to use stamping or self-assembly processes to
achieve surface imprints. Therefore, cavities have to be generated otherwise. For that
purpose, we mixed 200 µL pre-polymer solution (R09) with 500 µL 5 mg/mL BSA solution
(to generate MIP particles) and 500 µL water in the case of NIP particles. Then, both
solutions were treated under UV light for 10 minutes followed by precipitation in 20 mL of
the chosen solvent by vigorously stirring overnight. This lead to precipitation of spherical
particles sized between 70-250 nm, (Figure 60) as determined by contact mode AFM
measurements. Particles were then washed with solvent and centrifuged. These steps were
repeated until the xanthoprotein reaction did not reveal any further protein in the particles.
4.2 Precipitation solvent
Precipitation polymerization is a popular method for the synthesis of spherical particles that
requires a suitable dispersive solvent. When adding the oligomer in diluted conditions (<5%
weight/volume), particles grow by continuously attracting oligomers from solution (95). In
the first stage of polymerization, when the oligomer chains have grown sufficiently large,
they will precipitate from the solvent. This marks the change from polymerizing in a
homogeneous system to heterogeneous system, which means that the polymerizations
conducted both in the solvent and at the surface of the dispersed particles.
The first step in nanoparticle generation therefore consists of finding a suitable precipitation
solvent. For that purpose, we at the start investigated methanol, ethanol, 1-propanol and
acetonitrile, respectively, because their polarity gradually decreases (Table 14). The resulting
morphologies were investigated by AFM.
Table 14: Solvent properties.
Solvent Dielectric constant (96) Viscosity
(mPa·s, 20 ) (96) Relative Polarity (97)
Water 80.1 1 1
Methanol 33.6 0.59 0.762
Ethanol 25 1.2 0.654
1-propanol 20.1 2.3 0.617
Acetonitrile 36.6 0.37 0.46

87
(A) (B)
(C) (D)
Figure 61: AFM images (3.32 µm x 3.32 µm) of nanoparticles prepared by precipitation
polymerization in methanol (A), ethanol (B), 1-propanol (C), acetonitrile (D).
Figure 61 shows the shapes of the nanoparticles generated in the different solvents. First,
even repeated AFM measurements at different positions of several coatings did not reveal
any particles in methanol despite also varying scan directions and other scanning parameters:
All batches turned out more or less gel-like rather than solid particles. This is in line with the
experience that no particles precipitated after centrifuging at 4400 rpm in 30 minutes. The
reason most probably is that the polar solvent methanol is not so much different from water
and hence does not favor precipitation. In ethanol the situation is somewhat better (see Figure
61B), because it is less polar and hence already favors precipitation. Nonetheless, particles
deposited onto a surface still stick together. As one can see from Figure 61D, Acetonitrile is
the best precipitation solvent resulting in separated spherical particles having diameters
around 70 to 250 nm. Obviously, the polarity of solvent is the main factor in precipitating the
nanoparticles. Apolar solvents, however, are also not suitable for dispersing oligomers,

88
because they will generate two-phase systems and agglomerate the polymer in water. Thus,
acetonitrile was chosen as the precipitating solvent during the following steps.
4.3 Template Removal
Table 15: Effect of different washing solutions on the xanthoprotein test of different particles.
Washing by solvent MIP NIP
1 Water 5 times + -
2 20% MeOH - water - 20% MeOH - water - 20% MeOH - water + -
3 70% MeOH - water - 70% MeOH - water - 70% MeOH - water + -
4 Pepsin/pH 2 in 90 minutes - water x 3 times + +
5 Pepsin/pH 2 in 90 minutes - 1% SDS - water - 1% SDS - water x 3 times + -
6 Pepsin/pH 2 in 3 hours - 1% SDS - water - 1% SDS - water x 3 times ± -
7 1% SDS - PBS pH 7.4 - water x 3 times - -
Notes: + : positive result
- : negative result
For removing the template, particle suspensions were centrifuged at 4400 rpm for 30 minutes.
The supernatant was discarded and the sediment was re-dispersed in washing solvent and
treated for 1 minute in an ultrasonic bath. The whole procedure was repeated several times to
obtain optimal cleaning. After washing, the imprinted particles were tested by the
xanthoprotein reaction to assess whether any polymer had remained on the respective surface.
Table 15 summarizes the different washing efforts and allows for comparing them. In the
table, Sign “+” and “-” mean positive and negative results, respectively that we checked
visually. Especially procedure 4 led to positive result in both of MIP and NIP nanoparticles.
The positive reaction on the NIP for pepsin indicates that some pepsin adsorbed onto the
particle surfaces nonspecifically. A solution of 1% SDS removes this residue, whereas water
does not. Consequently, procedure 7 was used for removing the template from nanoparticles.

89
4.4 Receptor on nanoparticles
Figure 62: Interaction between analyte and receptor on surface of thin film and on surface of
nanoparticles.
However, there is some risk that during washing large quantities of nanoparticles, some of the
recognition cavities may be destroyed during these processes leading to low capacity and
poor site accessibility for the template. Therefore it is necessary to confirm the presence of
interaction via the concept described in Figure 62.
To the very best of our knowledge, this is the first attempt to use MIP nanoparticles for signal
amplification. For that purpose, a sensor coated with R06 polymer was exposed to BSA,
washed NIP nanoparticles, washed MIP nanoparticles, a mixture of BSA and washed NIP
nanoparticles and a mixture of BSA and washed MIP nanoparticles, respectively. All
corresponding sensor responses are summarized in Table 16. In this case, we applied highly
concentrated BSA solutions (500 ppm and 1000 ppm, respectively) to ensure saturated
binding sites on the surfaces both of the sensors and the nanoparticles. As the result in part
3.2.2 showed polymer R06 without VP showed weak affinity to BSA. The NIP response
nearly is the same as on the blank gold electrode and the imprinting performance is
acceptable. Besides, if nanoparticles have the same chemical composition as the sensor layer,

90
this could cause chemical adhesion. However, signal amplification by BSA rules out this
possibility.
Table 16: Mass response of QCM coated with Polymer R06 towards BSA, washed NIP
nanoparticles, washed MIP nanoparticles, mixture of BSA and washed NIP nanoparticles,
mixture of BSA and washed MIP nanoparticles solution.
Sample -f@NIP (Hz) -f@MIP (Hz)
500 ppm BSA 35 160
1000 ppm BSA 75 225
100 ppm Washed NIP -40 -75
100 ppm Washed MIP -30 -50
100 ppm Washed NIP + 1000 ppm BSA 65 225
100 ppm Washed MIP + 1000 ppm BSA 100 290
100 ppm Washed MIP + 500 ppm BSA 35 140
200 ppm Washed MIP + 500 ppm BSA 35 120
Table 16, reveals the following interesting facts: Foremost, the responses of NIP and MIP
electrode towards NIP and MIP nanoparticles showed anti-Sauerbrey behavior, i.e. frequency
increased rather than decreasing (Figure 63). This can be explained by only weak binding
between nanoparticles and the comparably flat thin films, so the nanoparticles will retain
some mobility on the sensor surface. Previous measurements with biospecies by
Wangchareansak et al. (51) and Dickert et al. (84) have revealed similar effects on flat
surfaces (there mainly the respective NIP). As the diameters of possible recognition sites on
the polymer surface are much lower than those of nanoparticles are, also the MIP can be
regarded flat with respect to those particles.
Concerning washed NIP nanoparticles, one can see in Figure 64 that the MIP/NIP signals of
1000 ppm BSA solution (225/75 Hz) and mixture of NIP nanoparticles and 1000 ppm BSA
solution (225/65 Hz) are the same (Figure 64A,B). Thus, in this case BSAis the main factor
for QCM sensor responses and the NP do not play any role. In the case of washed MIP
nanoparticles, the MIP/NIP signal of 1000 ppm BSA (225/75 Hz) increased by an extra value
of 65/25 Hz, respectively, when the sensor layer is exposed to the mixture of MIP

91
nanoparticles and BSA (Figure 64A, C). Thus, BSA in the analyte solution plays two roles:
One is interaction with recognition sites on the surface of the thin layer, the other is
interacting with receptor sites on the nanoparticle surfaces. Additionally, in nanoparticle
suspensions, BSA may become a cross-linker between nanoparticles leading to bigger
aggregates, because its 3D structure at least does not exclude two suitable binding sites on
each “face”. Thus, when the QCM is exposed to mixtures of washed MIP nanoparticles and
BSA, the MIP thin film surface adsorbs BSA and the agglomerate. As we can see in Figure
66, the mass of the combination is larger: It resulted in a higher frequency value (290 Hz)
compared to pure BSA (225 Hz). The effect is of course not very large, but it is there,
especially given the fact that the particles without BSA lead to non-Sauerbrey effects. The
BSA hence apparently acts as “glue”. Figure 62 at the beginning of this subchapter sketches
this effect. NIP layers also give rise to the similar phenomena, however, only slightly so (100
Hz compared to 65 Hz of pure BSA). However, increasing density and viscosity of the
solution are the reason for this effect rather than imprinting.
Figure 63: Sensor responses of polymers R06 towards 100 ppm MIP and NIP nanoparticles.

92
(A)
(B)
(C)
Figure 64: Sensor responses of polymers R06 towards 1000 ppm BSA, mixture of washed
MIP nanoparticles and 1000 ppm BSA, mixture of washed NIP nanoparticles and 1000 ppm
BSA.

93
(A)
(B)
(C)
Figure 65: Sensor responses of polymers R06 towards 500 ppm BSA, mixtures of washed
MIP nanoparticles and 500 ppm BSA.

94
Figure 66: Effect of mixture of washed MIP nanoparticles and 1000 ppm BSA, mixture of
washed NIP nanoparticles and 1000 ppm BSA on sensor layers.
However, when the concentration of BSA is not high enough, for example 500 ppm, the
response of QCM is nearly the same in both solutions with or without washed MIP
nanoparticles (Figure 65). Figure 67 shows that every extra 100 ppm of washed MIP
nanoparticle inside the 500 ppm BSA solution led to decreasing MIP signal of 20 Hz whereas
NIP signal did not change. This amount of frequency shift on MIP was large enough when
compared to the NIP signal (35 Hz in all of 3 cases) and oscillator noise (around 10 Hz). This
confirms that a part of BSA in solution bound to nanoparticles instead of interacting with
sensor layer. However, it is not sufficient to aggregate these nanoparticles in order to increase
the signal like in the case of 1000 ppm BSA solution. That also is why the response of NIP
had no influence by these changes of nanoparticles concentration. In practice, the mixture of
washed MIP nanoparticles and 1000 ppm BSA precipitated faster than the mixture of
containing 500 ppm BSA (2 hours compared to 6 hours). Obviously, the amount of
agglomerates in the former solution is larger than in the latter one.

95
Figure 67: Effect of mixtures of different washed MIP nanoparticles and 500 ppm BSA
towards to sensor layer.
In conclusion, interaction sites indeed exist on the surface of washed MIP nanoparticles. This
is positive extension to some other studies that used washed MIP nanoparticles as template
with artificial negative recognition (60)(81).


97
5 TWO-STEP IMPRINTING STRATEGIES
Dickert et al. used nanoparticle as the intermediary agent to transfer biological information
such as recognition abilities of antibodies to surface layers by double imprinting. (60)(81)
This demonstrates that nanoparticles in principle can be artificial templates for imprinting.
Applying unwashed MIP nanoparticles rather than self-assembled layers of analyte on a
stamp as template should therefore lead to larger surface area and to higher density in
analyte-receptor interactions sites. This is a completely different approach than using
nanoparticles themselves as recognition materials as done in previous studies (98). We
introduce chemically selective nanoparticle layers to overcome sensitivity limitations in thin
film sensor layers by increasing accessibility and thus the effectivity of interaction sites.
Figure 68 shows how to form recognition surfaces by imprinting with BSA and unwashed
MIP. Obviously, the “classical” thin film has only one layer of recognition cavities on its
plane (Figure 68A), whereas the latter exhibits more receptors on the walls of the cavities
formed by the template nanoparticles (Figure 68B). Because of particle sizes between 1 and
some 100 nm, they offer very large surface areas, but the interaction sites are easily
accessable for analyte proteins in the same way as for “classical” thin film layers thus
ensuring selectivity.
(A)
(B)
Figure 68: Different template strategies for BSA MIP: BSA and unwashed MIP
Nanoparticles.

98
5.1 Using nanoparticles as templates
After showing that the imprinting process on the surface of nanoparticles is successful and
realizable, this opens an innovative way to increase sensitivity of thin films. Generally, one of
the main purposes in sensor design is to enhance sensitivity towards the target protein by
applying a straightforward method. To assess the influence of different templating strategies,
BSA, washed MIP nanoparticles, washed NIP nanoparticles, un-washed MIP nanoparticles
(i.e. without having removed the BSA from the surface) and un-washed NIP nanoparticles
served as templates during imprinting to assess the resulting number of receptor sites on the
thin film following the strategies sketched in Figure 68 and Figure 69.
Figure 69: washed MIP nanoparticles, washed NIP nanoparticles served as templates during
imprinting.
The results of these templating approaches based on the previously used polymer R09 (see
section 2.3.1) and nanoparticles (see sections 4.1) are summarized Table 17 (see next page)
and plotted in Figure 75 (see on page 103). For investigating the performance of the new
imprinting strategy, only BSA and washed MIP/NIP nanoparticle solutions were used as
analytes. Additionally, using non-washed MIP/NIP nanoparticles is similar to using washed
nanoparticles with the presence of BSA. Therefore, it was also studied in part 4.4.
In order to simplify the name of QCM sensor layers prepared with different templates, all
MIP are named after their respective template.

99
Table 17: Response of MIP and NIP electrode (washed MIP nanoparticles, washed NIP
nanoparticles, un-washed MIP nanoparticles, un-washed NIP nanoparticles, BSA was used
as template) in Hz towards 100 ppm BSA solution, 100 ppm washed MIP Nanoparticles and
100 ppm washed NIP nanoparticles suspensions.
Response of electrode (-Hz)/Analyte
MIPe/ NIPe/ MIPe/ NIPe/ MIPe/ NIPe/
Template
BSA BSA
Washe
d MIP
nano
Washe
d MIP
nano
Washe
d NIP
nano
Washed
NIP
nano
Non-washed MIP nanoparticles -1100 -450 -30 -25 -30 -70
Non-washed NIP nanoparticles -475 -375 -20 -20 -290 -70
Washed MIP nanoparticle -230 -330 -50 -50 -10 -10
Washed NIP nanoparticles -600 -400 -10 -10 -300 -90
BSA -725 -410 -40 -20 -10 -10
Firstly, differently to results introduced in part 4.4, the washed MIP/NIP nanoparticles did not
lead to anti-Sauerbrey effects yielding frequency shifts of -40 Hz/-20 Hz on the BSA thin
film MIP and -10 Hz/-10 Hz on the BSA thin film NIP. Washed MIP/NIP nanoparticles in
every case, yielded frequency shifts ranging from -10 Hz to -90 Hz on NIP electrodes. This is
fully compliant with Sauerbrey effects and indicates only minor absorption of nanoparticles
on the surface. The reason may be polymer composition: Polymer R09 used in these
experiments contains -COOH and -NH3+ groups (from AA and VP) on the surface. This
supports appropriate non-covalent interactions between thin film and nanoparticles. In
contrast to this, polymer R06 used in chapter 0 contains MAA, which is less polar than AA.
This leads to lower non-specific binding on the surface of R06 and thus to anti-Sauerbrey
effects.

100
Figure 70: Response of washed NIP nanoparticle sensor towards BSA and washed MIP/NIP
nanoparticles solution.
Figure 71: Response of different sensors towards 100 ppm BSA.
Secondly, in the case of a thin films templated with washed NIP nanoparticles (Figure 70),
the MIP-coated electrode resulted in 2 times higher signals than NIP electrode towards
washed NIP nanoparticle suspensions, namely 100 Hz compared to 50 Hz. Although these
cavities are not adapted to re-incorporate BSA, they exhibit a larger surface area than the
NIP. Consequently, this surface adsorbs more BSA than the corresponding NIP namely
leading to 600/400 Hz (MIPe/NIPe), respectively. Compared to the responses of the BSA
MIP with 725/410 Hz (MIPe/NIPe), these values are still lower further underpinning the
importance of the imprinting effect (Figure 71). Furthermore, these results are among the first
successful attempts to detect artificial nanoparticles by the means of the respective MIP and
as such represent groundbreaking work. Figure 71 also reveals that the respective NIP
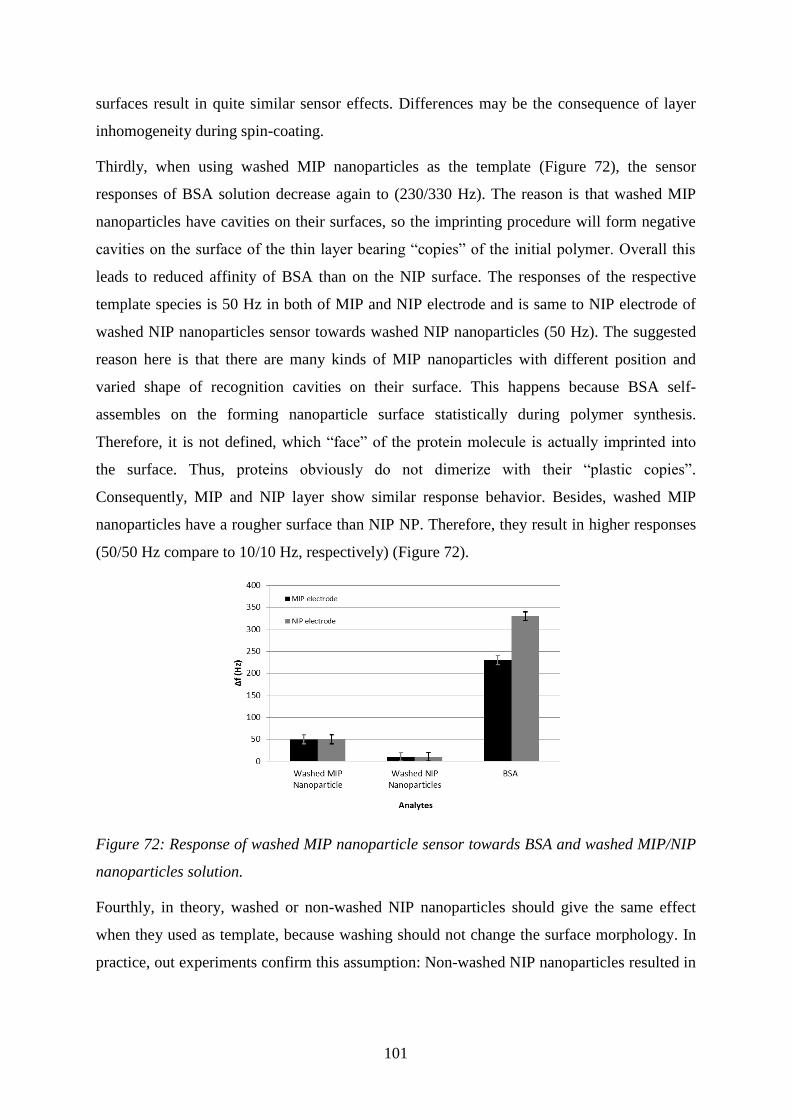
101
surfaces result in quite similar sensor effects. Differences may be the consequence of layer
inhomogeneity during spin-coating.
Thirdly, when using washed MIP nanoparticles as the template (Figure 72), the sensor
responses of BSA solution decrease again to (230/330 Hz). The reason is that washed MIP
nanoparticles have cavities on their surfaces, so the imprinting procedure will form negative
cavities on the surface of the thin layer bearing “copies” of the initial polymer. Overall this
leads to reduced affinity of BSA than on the NIP surface. The responses of the respective
template species is 50 Hz in both of MIP and NIP electrode and is same to NIP electrode of
washed NIP nanoparticles sensor towards washed NIP nanoparticles (50 Hz). The suggested
reason here is that there are many kinds of MIP nanoparticles with different position and
varied shape of recognition cavities on their surface. This happens because BSA self-
assembles on the forming nanoparticle surface statistically during polymer synthesis.
Therefore, it is not defined, which “face” of the protein molecule is actually imprinted into
the surface. Thus, proteins obviously do not dimerize with their “plastic copies”.
Consequently, MIP and NIP layer show similar response behavior. Besides, washed MIP
nanoparticles have a rougher surface than NIP NP. Therefore, they result in higher responses
(50/50 Hz compare to 10/10 Hz, respectively) (Figure 72).
Figure 72: Response of washed MIP nanoparticle sensor towards BSA and washed MIP/NIP
nanoparticles solution.
Fourthly, in theory, washed or non-washed NIP nanoparticles should give the same effect
when they used as template, because washing should not change the surface morphology. In
practice, out experiments confirm this assumption: Non-washed NIP nanoparticles resulted in

102
the same imprinting effect (290/70 Hz (MIPe/NIPe) sensor effect) compared to washed NIP
nanoparticles (300/90 Hz MIPe/NIPe) (Figure 73).
Figure 73: Response of difference sensor towards washed NIP nanoparticles.
Figure 74: Response behavior of a layer consisiting of R09 templated with non-washed MIP
nanoparticles exposed to 100 ppm BSA.
Fifthly, as predicted, non-washed MIP nanoparticle gave rise to increased imprinting effects,
than BSA alone as a template: Obviously, the sensor responses of MIP/NIP substantially
increase from 725/410 Hz in the case of BSA as the template to 1100/450 Hz for
nanoparticles (Figure 74). Again, the signals of the NIP are very similar. However, the
difference in frequency shift between MIP and NIP frequency increased by a factor of two
(315 Hz vs 650 Hz). This can be explained by deeper cavities forming larger interfacial area,
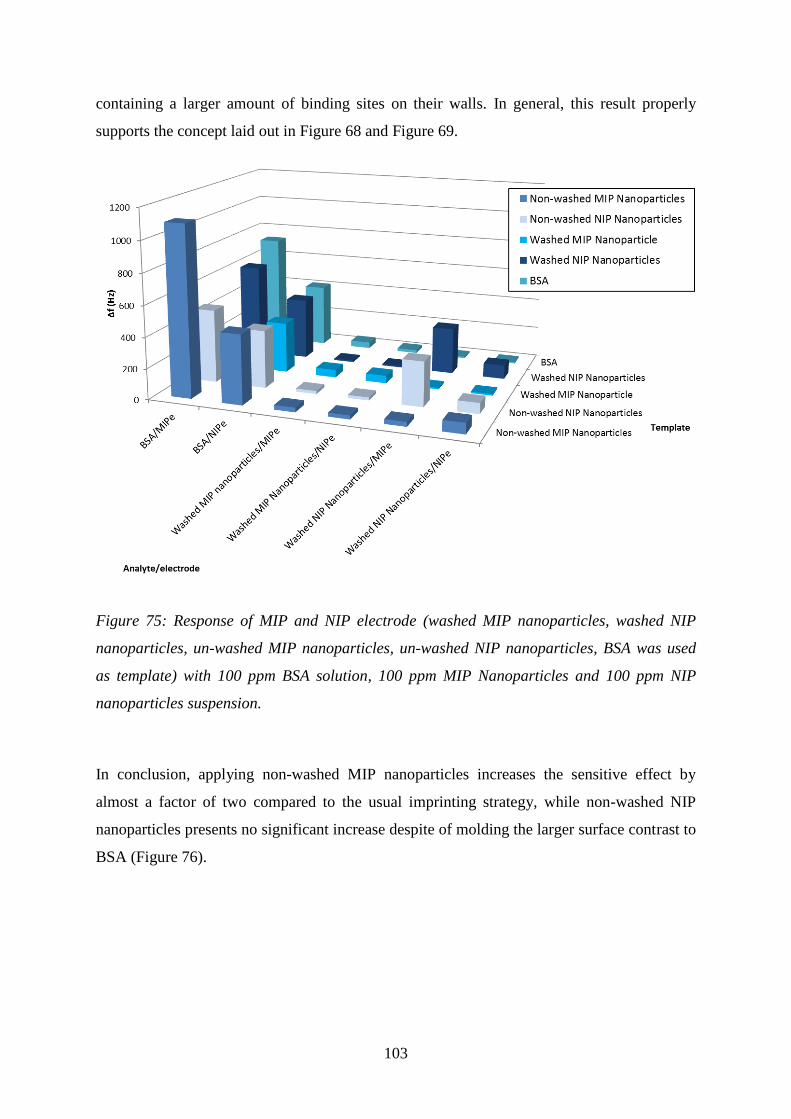
103
containing a larger amount of binding sites on their walls. In general, this result properly
supports the concept laid out in Figure 68 and Figure 69.
Figure 75: Response of MIP and NIP electrode (washed MIP nanoparticles, washed NIP
nanoparticles, un-washed MIP nanoparticles, un-washed NIP nanoparticles, BSA was used
as template) with 100 ppm BSA solution, 100 ppm MIP Nanoparticles and 100 ppm NIP
nanoparticles suspension.
In conclusion, applying non-washed MIP nanoparticles increases the sensitive effect by
almost a factor of two compared to the usual imprinting strategy, while non-washed NIP
nanoparticles presents no significant increase despite of molding the larger surface contrast to
BSA (Figure 76).

104
Figure 76: Sensor Responses of MIP and NIP electrode (prepared by different templates)
towards 100 ppm BSA solution.
5.2 Sensor characteristic: comparing BSA and non-washed MIP
nanoparticles as templates
Figure 77: QCM sensor characteristic of polymer R09 using Non-washed MIP nanoparticles as
template.
Again, the relationship between sensor response and concentration of BSA was determined in
the concentration range from 100 ppm to 10 ppm. As the result, the layer generated by the
new imprinting strategy shows the obvious, linear response behavior between 10 ppm and
100 ppm BSA. The slope of MIP linear regression (9.49) is almost three times to the NIP one
(3.39; see Figure 77). Compared to the “classical” thin film, the novel films show stronger
frequency effects at every concentration of BSA, as shown in Figure 78.

105
Figure 78: Sensor characteristics for BSA-MIP and thin film MIP templated with non-washed
nanoparticles. The sensor responses represent the difference between MIP and NIP.
Obviously, sensitivity – defined by the slope of linear regression - is more than two higher
(6.10) for the layers templated with the unwashed MIP nanoparticles, than for BSA MIP
(2.71). This impressively demonstrates a novel strategy to increase sensitivity in protein MIP.
The result again shows that increasing sensitivity can be achieved by rationally increasing the
amount of binding sites on the respective sensor surface and therefore increase the chance of
interaction between analytes and sensor layer. Augmenting the number of recognition sites on
the polymer by applying nanoparticles as the template is not only straightforward, but also
cost-effective. Furthermore, the new concept also opens another direction for improving the
quality of molecular imprinting of proteins.


107
SUMMARY (ENGLISH)
Although Bio/Chemical sensors based on Molecularly Imprinted Polymers (MIP) have
recently made substantial progress, there are still some limitations for applying them in real-
life samples, especially in the case of protein MIP. The aim of the thesis was to design sensor
materials for protein sensors and to enhance their sensitivity by implementing a MIP
nanoparticle strategy. Methacrylic acid (MAA) / N-vinylpyrrolidone (VP) copolymer systems
were systematically improved to implement QCM sensor systems for detecting Bovine
Serum Albumin (BSA). The factors of polymerization such as pH, temperature, inert
atmosphere (Nitrogen) were assessed to find out the optimized protocol for generating
polymers remained stable for more than 7 days. The efficiency of the imprinting technique
was demonstrated perfectly by UV spectrometry and STM images. ATR also was considered
for this purpose. After preliminary QCM measuring, the composition of the polymer was
screened to evaluate their roles in sensor efficiency. Sensor signals were inversely
proportional to the amount of cross-, because increasing rigidity of the polymer decreases
flexibility and hence affinity towards BSA. Materials with 70% cross-linker revealed
reasonable measuring time (t90 time = 0.78 hours), low noise (around 5 Hz), and acceptable
imprinting effects (MIP/NIP ratio was 1.58). Monomer composition also strongly influences
on the signal: Although polymers without VP (i.e. removing amino groups from the polymer
surface) showed better imprinting effects (ratio of MIP/NIP is 1.4 times higher), their
sensitivity was lower than for materials containing VP and the reaction time increased by
more than a factor of two. Thus, VP in the polymer is indispensable. Additionally, using
acrylic acid (AA) instead of MAA increased both the response and the ratio of imprinting
effect. The reason is that the methyl group in methacrylic acid causes less polar interactions
with functional group on BSA. The optimized polymer contains a ratio of 2:3 (AA:VP)
yielding a signal ratio between MIP and NIP of roughly 1.8 and the most reasonable sensor
response (t90-time < 1 hour). Besides, organic solvents were also studied concerning their
influence on the quality of MIP. Astonishingly, a small amount of DMSO (about 1%) in
water dramatically increased MIP/NIP ratio by more than 2.5 times compared to both pure
solvents.
A novel imprinting technique towards proteins consisted of synthesizing nanoparticles ,
characterizing them, and using them as templates. Acetonitrile was chosen as precipitation

108
solvent after screening. The presence of the recognition site of BSA on nanoparticles was
confirmed via QCM measurements of mixture containing nanoparticle suspensions and of
BSA. It turned out that exposing the surfaces to washed MIP nanoparticles and BSA together
leads to signal amplification on a BSA-MIP thin film. This process does not take place with
NIP nanoparticles thus showing one of the very first enhancement effects by “artificial
antibodies”.
In a final optimization attempt, non-washed BSA MIP nanoparticles served as template in
imprinting. This approach increases the sensor responses by a factor of two compared to
“classical” BSA MIP, whereas NIP nanoparticles give no effect, despite of the increased film
surface, no BSA imprints can be found. The success of using unwashed MIP nanoparticles –
i.e. polymer particles containing BSA on their surfaces, can be seen via the regression slope
of the respective sensor characteristics: MIP templated with unwashed BSA MIP
nanoparticles yielded more than twofold higher response (6.10) than the “classical” thin film
BSA MIP (2.71).

109
ZUSAMMENFASSUNG (DEUTSCH)
Biologische und chemische Sensoren, welche auf molekulargeprägten Polymeren (MIP)
basieren, haben sich wesentlich weiterentwickelt, jedoch gibt es immer noch
Einschränkungen bei Anwendungen unter realen Bedingungen. Diese Limitierungen sind
besonders stark bei proteinbasierten MIPs. Das Ziel dieser Arbeit war die Entwicklung eines
Sensormateriales für einen Proteinsensor. Zudem wurde die Sensitivität durch Einbringen
von MIP Nanopartikeln verbessert. Methacrylsäure (MAA) / N-Vinylpyrrolidon (VP)
Copolymersysteme wurden systematisch optimiert um sie in QCM Sensorsysteme für die
Detektion von Bovine Serum Albumin (BSA) einzusetzen. Die Polymerisationsbedingungen
wie pH-Wert, Temperatur und Atmosphäre (Stickstoff) wurden variiert, um die idealen
Faktoren zu ermitteln welche zu einem Polymer fühten, welches länger als sieben Tage stabil
ist. Die Effizienz der Prägetechnik kann mittels UV-Spektrometrie, STM Bildern und ATR
gezeigt werden. Nach den einleitenden QCM Messungen wurde die Zusammensetzung des
Polymers untersucht um den Mechanismus der Sensoreffizienz aufzuklären. Das Sensorsignal
war umgekehrt proportional zur Menge an Quervernetzern, weil eine Erhöhung der Festigkeit
gleichzeitig eine Erniedrigung der Flexibilität bedeutet, was wiederrum eine
Verschlechterung der Affinität zum BSA zur Folge hat. Materialien mit einem Anteil von
70% Quervernetzern zeigen eine angemessene Messzeit (t90 Zeit = 0.78 Stunden), geringes
Rauschen (etwa 5 Hz) und einen annehmbaren Imprinteffekt (MIP/NIP Verhältnis von 1.58).
Monomerzusammensetzungen beeinflussen ebenso stark das Messsignal: Bei Polymeren
ohne VP (d. h. Entfernen der Aminogruppen aus der Polymeroberfläche) war ein besserer
Imprinteffekt (MIP/NIP Verhältnis 1.4 mal höher) zu erkennen, jedoch nahm die Sensitivität
gegenüber Materialien, welche VP enthielten, stark ab und auch die Reaktionszeit
verdoppelte sich. Dies führt dazu, dass VP für das Polymer unerlässlich ist. Beim Ersetzen
von MAA durch Acrylsäure (AA) erhöhte sich sowohl das Ansprechen des Sensors als auch
der Imprinteffekt. Der Grund dafür ist, dass die Methylgruppe im MAA eine geringere polare
Interaktion mit den funktionellen Gruppen im BSA besitzt. Das optimale Polymer besitzt ein
2:3 (AA:VP) Verhältnis, welches zu einem Signalverhältnis zwischen MIP und NIP von 1.8
führt und einer angemessenen Sensoransprechzeit (t90 Zeit < 1 Stunde). Ebenfalls wurden
organische Lösungsmittel bezüglich deren Einfluss auf die Qualität des MIPs untersucht.
Erstaunlicherweise erhöhte eine kleine Menge DMSO (1%) im Wasser das MIP/NIP
Verhältnis um mehr als das 2.5fache gegenüber den reinen Lösungsmitteln.

110
Zur Entwicklung einer neuen Prägetechnik für Proteine wurden Nanopartikel (NP)
synthetisiert und als Template benutzt. Acetonitril wurde als Präzipationslösungsmittel, nach
Vorstudien, verwendet. Durch QCM Messungen konnte gezeigt werden, dass BSA mit den
NP interagiert. Die Messungen wurden mit Mischungen aus BSA und NP durchgeführt. Es
zeigte sich, dass die Zugabe der NP/BSA Mischung zu dem Dünnfilm BSA-MIP auf der
Elektrode zu einer Signalverstärkung führte. Bei dem ungeprägten Dünnfilm trat dieser
Effekt nicht auf. Dies zeigt, dass die auf BSA geprägten Polymere wie „künstliche
Antikörper“ agieren.
Zum Schluss wurde noch ungewaschene BSA-NP als Prägungstemplate verwendet. Dieser
Ansatz erhöhte die Sensorantwort um einen Faktor zwei im Vergleich zum „klassischen“
BSA MIP, wohingegen die NIP NP keinen Effekt zeigten. Der Erfolg bei der Verwendung
ungewaschener MIP NPs, d. h. Polymerpartikel mit BSA auf ihrer Oberfläche, kam durch die
Regressionssteigung der Sensorantwort: geprägtes MIP mit ungewaschenen BSA MIP NP
resultierte in einer zweifach höheren Antwort als die „klassischen“ Dünnfilm BSA MIPs.

111
REFERENCES
1. Kellner, R., Mermet, J.-M., Otto, M., Valcarcel, M., and Widmer, H. M. (Eds.). (2004)
Analytical Chemistry. A Modern Approach to Analytical Science. Second Edi., Wiley-
VCH.
2. Manz, A., Pamme, N., and Iossifidis, D. (2004) Chapter 1. Biomolecules. In
Bioanalytical Chemistry, pp 1–27, Imperial College Press.
3. Lieberzeit, P. A., and Dickert, F. L. (2009) Chemosensors in environmental
monitoring: challenges in ruggedness and selectivity., Anal. Bioanal. Chem. 393, 467–
72.
4. Dickert, F., and Lieberzeit, P. A. (2007) Imprinted Polymers in Chemical Recognition
for Mass-Sensitive Devices. In Piezoelectric Sensors SE - 5 (Janshoff, A., and
Steinem, C., Eds.), pp 173–210, Springer Berlin Heidelberg.
5. Carter, D. C., and Ho, J. X. (1994) Structure of serum albumin., Adv. Protein Chem.
45, 153–203.
6. Figge, J., Rossing, T. H., and Fencl, V. (1991) The role of serum proteins in acid-base
equilibria., J. Lab. Clin. Med. 117, 453–67.
7. Theodore Peters, J. (1995) Chapter 2. The Albumin Molecule: Its Structure and
Chemical Properties. In All About Albumin Biochemistry, Genetics, and Medical
Applications, pp 9–75, Academic Press.
8. Majorek, K. A., Porebski, P. J., Dayal, A., Zimmerman, M. D., Jablonska, K., Stewart,
A. J., Chruszcz, M., and Minor, W. (2012) Structural and immunologic
characterization of bovine, horse, and rabbit serum albumins., Mol. Immunol. 52, 174–
82.
9. Peters Jr., T. (1995) Chapter 3. Ligand Binding by Albumin. In All About Albumin
Biochemistry, Genetics, and Medical Applications, pp 76–132, Academic Press.
10. He, X. M., and Carter, D. C. (1992) Atomic structure and chemistry of human serum
albumin., Nature 358, 209–15.
11. Huang, B. X., Kim, H.-Y., and Dass, C. (2004) Probing three-dimensional structure of
bovine serum albumin by chemical cross-linking and mass spectrometry., J. Am. Soc.
Mass Spectrom. 15, 1237–47.
12. Bujacz, A. (2012) Structures of bovine, equine and leporine serum albumin., Acta
Crystallogr. D. Biol. Crystallogr. 68, 1278–89.
13. Jacobsen, J. (1969) Binding of bilirubin to human serum albumin - determination of
the dissociation constants., FEBS Lett. 5, 112–114.

112
14. Gray, R. D., and Stroupe, S. D. (1978) Kinetics and mechanism of bilirubin binding to
human serum albumin., J. Biol. Chem. 253, 4370–7.
15. Brodersen, R. (1979) Bilirubin. Solubility and interaction with albumin and
phospholipid., J. Biol. Chem. 254, 2364–9.
16. Jacobsen, J. (1977) Studies of the affinity of human serum albumin for binding of
bilirubin at different temperatures and ionic strength., Int. J. Pept. Protein Res. 9, 235–
9.
17. Beaven, G. H., D’Albis, A., and Gratzer, W. B. ( 973) The Interaction of Bilirubin
with Human Serum Albumin., Eur. J. Biochem. 33, 500–509.
18. Judis, J. (1981) Binding of prostaglandins E1 (alprostadil), E2 (dinoprostone), F1a, and
F2a (dinoprost) to human serum proteins., J. Pharm. Sci. 70, 945–946.
19. Yang, J., Petersen, C. E., Ha, C.-E., and Bhagavan, N. V. (2002) Structural insights
into human serum albumin-mediated prostaglandin catalysis., Protein Sci. 11, 538–45.
20. Westphal, U., and Harding, G. B. (1973) Steroid-protein interactions. XXVII.
Progesterone binding to polymers of human serum albumin., Biochim. Biophys. Acta
310, 518–27.
21. Adams, P. A., and Berman, M. C. (1980) Kinetics and mechanism of the interaction
between human serum albumin and monomeric haemin., Biochem. J. 191, 95–102.
22. Beaven, G. H., Chen, S.-H., D’Albis, A., and Gratzer, W. B. ( 974) A spectroscopic
study of the haemin--human-serum-albumin system., Eur. J. Biochem. 41, 539–46.
23. Savu, L., Benassayag, C., Vallette, G., Christeff, N., and Nunez, E. (1981) Mouse
alpha 1-fetoprotein and albumin. A comparison of their binding properties with
estrogen and fatty acid ligands., J. Biol. Chem. 256, 9414–8.
24. Roda, A., Cappelleri, G., Aldini, R., Roda, E., and Barbara, L. (1982) Quantitative
aspects of the interaction of bile acids with human serum albumin., J. Lipid Res. 23,
490–5.
25. Kazemi, S. Y., and Abedirad, S. M. (2012) Effect of human and bovine serum albumin
on kinetic chemiluminescence of Mn (III)-Tetrakis (4-sulfonatophenyl) porphyrin-
luminol-hydrogen peroxide system., Sci. World J. 2012, 913412.
26. Kragh-Hansen, U. (1981) Molecular aspects of ligand binding to serum albumin.,
Pharmacol. Rev. 33, 17–53.
27. Goodsell, D. S. (2003) Serum Albumin., RCSB Protein Data Bank.
28. Wetzel, R., Becker, M., Behlke, J., Billwitz, H., Bӧhm, S., Ebert, B., Hamann, H.,
Krumbiegel, J., and Lassmann, G. (1980) Temperature behaviour of human serum
albumin., Eur. J. Biochem. 104, 469–78.

113
29. Peters, T. (1985) Serum albumin., Adv. Protein Chem. 37, 161–245.
30. Haupt, K., and Mosbach, K. (2000) Molecularly imprinted polymers and their use in
biomimetic sensors., Chem. Rev. 100, 2495–504.
31. Hussain, M., Wackerlig, J., and Lieberzeit, P. (2013) Biomimetic Strategies for
Sensing Biological Species., Biosensors 3, 89–107.
32. Vo-Dinh, T., and Allain, L. (2003) Chapter 20. Biosensors for Medical Applications.
In Biomedical Photonics Handbook, CRC Press.
33. Mustafa, G., and Lieberzeit, P. A. (2013) MIP Sensors on the Way to Real-World
Applications. In Designing Receptors for the Next Generation of Biosensors SE - 21
(Piletsky, S. A., and Whitcombe, M. J., Eds.), pp 167–187, Springer Berlin Heidelberg.
34. Hayden, O., Lieberzeit, P. A., Blaas, D., and Dickert, F. L. (2006) Artificial Antibodies
for Bioanalyte Detection—Sensing Viruses and Proteins., Adv. Funct. Mater. 16,
1269–1278.
35. Dickert, F. L., Lieberzeit, P. A., and Hayden, O. (2006) Molecularly Imprinted
Polymers for Mass Sensitive Sensors – from Cells to Viruses and Enzymes. In
Molecular Imprinting of Polymers (Piletsky, S., and Turner, A., Eds.), pp 50–63,
Landes Bioscience.
36. Ye, L., and Haupt, K. (2004) Molecularly imprinted polymers as antibody and receptor
mimics for assays, sensors and drug discovery., Anal. Bioanal. Chem. 378, 1887–97.
37. Gooding, J. J. (2006) Biosensor technology for detecting biological warfare agents:
Recent progress and future trends., Anal. Chim. Acta 559, 137–151.
38. Alexander, C., Andersson, H. S., Andersson, L. I., Ansell, R. J., Kirsch, N., Nicholls, I.
A., O’Mahony, J., and Whitcombe, M. J. (2006) Molecular imprinting science and
technology: a survey of the literature for the years up to and including 2003., J. Mol.
Recognit. 19, 106–80.
39. Kotova, K., Hussain, M., Mustafa, G., and Lieberzeit, P. A. (2013) MIP sensors on the
way to biotech applications: Targeting selectivity., Sensors Actuators B Chem. 189,
199–202.
40. Lépinay, S., Kham, K., Millot, M.-C., and Carbonnier, B. (2012) In-situ polymerized
molecularly imprinted polymeric thin films used as sensing layers in surface plasmon
resonance sensors: Mini-review focused on 2010–2011., Chem. Pap. 66, 340–351.
41. Vedala, H., Chen, Y., Cecioni, S., Imberty, A., Vidal, S., and Star, A. (2010)
Nanoelectronic Detection of Lectin-Carbohydrate Interactions Using Carbon
Nanotubes., Nano Lett. 11, 170–175.
42. Marx, S., and Liron, Z. (2001) Molecular Imprinting in Thin Films of
Organic−Inorganic Hybrid Sol−Gel and Acrylic Polymers., Chem. Mater. 13, 3624–
3630.

114
43. Menaker, A., Syritski, V., Reut, J., Öpik, A., Horváth, V., and Gyurcsányi, R. E.
(2009) Electrosynthesized Surface-Imprinted Conducting Polymer Microrods for
Selective Protein Recognition., Adv. Mater. 21, 2271–2275.
44. Kriz, D., Kempe, M., and Mosbach, K. (1996) Introduction of molecularly imprinted
polymers as recognition elements in conductometric chemical sensors., Sensors
Actuators B Chem. 33, 178–181.
45. Rick, J., and Chou, T.-C. (2006) Using protein templates to direct the formation of
thin-film polymer surfaces., Biosens. Bioelectron. 22, 544–9.
46. Lieberzeit, P. A., Findeisen, A., Mähner, J., Samardzic, R., Pitkänen, J., Anttalainen,
O., and Dickert, F. L. (2010) Artificial receptor layers for detecting chemical and
biological threats., Procedia Eng. 5, 381–384.
47. Bossi, A., Bonini, F., Turner, A. P. F., and Piletsky, S. A. (2007) Molecularly
imprinted polymers for the recognition of proteins: the state of the art., Biosens.
Bioelectron. 22, 1131–7.
48. Lieberzeit, P. A., Gazda-Miarecka, S., Halikias, K., Schirk, C., Kauling, J., and
Dickert, F. L. (2005) Imprinting as a versatile platform for sensitive materials –
nanopatterning of the polymer bulk and surfaces., Sensors Actuators B Chem. 111-112,
259–263.
49. Lieberzeit, P. A., Rehman, A., Najafi, B., and Dickert, F. L. (2008) Real-life
application of a QCM-based e-nose: quantitative characterization of different plant-
degradation processes., Anal. Bioanal. Chem. 391, 2897–903.
50. Lieberzeit, P. A., Afzal, A., Glanzing, G., and Dickert, F. L. (2007) Molecularly
imprinted sol-gel nanoparticles for mass-sensitive engine oil degradation sensing.,
Anal. Bioanal. Chem. 389, 441–6.
51. Wangchareansak, T., Sangma, C., Choowongkomon, K., Dickert, F., and Lieberzeit, P.
(2011) Surface molecular imprints of WGA lectin as artificial receptors for mass-
sensitive binding studies., Anal. Bioanal. Chem. 400, 2499–506.
52. Aherne, A., Alexander, C., Payne, M. J., Perez, N., and Vulfson, E. N. (1996)
Bacteria-mediated lithography of polymer surfaces., J. Am. Chem. Soc. 7863, 8771–
8772.
53. Jenik, M., Seifner, A., Krassnig, S., Seidler, K., Lieberzeit, P. A., Dickert, F. L., and
Jungbauer, C. (2009) Sensors for bioanalytes by imprinting--polymers mimicking both
biological receptors and the corresponding bioparticles., Biosens. Bioelectron. 25, 9–
14.
54. Jenik, M., Schirhagl, R., Schirk, C., Hayden, O., Lieberzeit, P., Blaas, D., Paul, G., and
Dickert, F. L. (2009) Sensing picornaviruses using molecular imprinting techniques on
a quartz crystal microbalance., Anal. Chem. 81, 5320–6.

115
55. Dickert, F. L., Hayden, O., Lieberzeit, P., Haderspoeck, C., Bindeus, R., Palfinger, C.,
and Wirl, B. (2003) Nano- and micro-structuring of sensor materials—from molecule
to cell detection., Synth. Met. 138, 65–69.
56. Seifner, A., Lieberzeit, P., Jungbauer, C., and Dickert, F. L. (2009) Synthetic receptors
for selectively detecting erythrocyte ABO subgroups., Anal. Chim. Acta 651, 215–9.
57. Wulff, G., and Biffis, A. (2000) Chapter 4: Molecular imprinting with covalent or
stoichiometric non-covalent interactions. In Molecularly Imprinted Polymers Man-
made Mimics of Antibodies and their Aplications in Analytical Chemistry. (Sellergren,
B., Ed.), pp 71–111, Elsevier.
58. Sellergren, B. (2000) Chapter 5 The non-covalent approach to molecular imprinting. In
Techniques and Instrumentation in Analytical Chemistry (Chemistry, B. S. B. T.-T.
and I. in A., Ed.), pp 113–184, Elsevier.
59. Dickert, F. L., and Lieberzeit, P. A. (2006) Solid-State Sensors for Field
Measurements of Gases and Vapors. In Encyclopedia of Analytical Chemistry, pp
3831–3855, John Wiley & Sons, Ltd.
60. Schirhagl, R., Podlipna, D., Lieberzeit, P. A., and Dickert, F. L. (2010) Comparing
biomimetic and biological receptors for insulin sensing., Chem. Commun. (Camb). 46,
3128–30.
61. Mustafa, G., Hussain, M., Iqbal, N., Dickert, F. L., and Lieberzeit, P. A. (2012) Quartz
crystal microbalance sensor based on affinity interactions between organic thiols and
molybdenum disulfide nanoparticles., Sensors Actuators B Chem. 162, 63–67.
62. Bajwa, S. Z., Mustafa, G., Samardzic, R., Wangchareansak, T., and Lieberzeit, P. A.
(2012) Nanostructured materials with biomimetic recognition abilities for chemical
sensing., Nanoscale Res. Lett. 7, 328.
63. Ramström, O. (2004) Synthesis and Selection of Functional and Structural Monomers.
In Molecularly Imprinted Materials, pp 181–224, CRC Press.
64. Marty, J., and Mauzac, M. (2005) Molecular Imprinting: State of the Art and
Perspectives. In Microlithography · Molecular Imprinting SE - 1, pp 1–35, Springer
Berlin Heidelberg.
65. Ramström, O., and Ansell, R. J. (1998) Molecular imprinting technology: challenges
and prospects for the future, Chirality 10, 195–209.
66. Wulff, G. (1995) Molecular Imprinting in Cross-Linked Materials with the Aid of
Molecular Templates— A Way towards Artificial Antibodies., Angew. Chemie Int. Ed.
English 34, 1812–1832.
67. Turner, N. W., Jeans, C. W., Brain, K. R., Allender, C. J., Hlady, V., and Britt, D. W.
(2009) From 3D to 2D: a review of the molecular imprinting of proteins., Biotechnol.
Prog. 22, 1474–89.

116
68. Kempe, M., and Mosbach, K. (1995) Separation of amino acids, peptides and proteins
on molecularly imprinted stationary phases., J. Chromatogr. A 691, 317–23.
69. Shi, H., Tsai, W. B., Garrison, M. D., Ferrari, S., and Ratner, B. D. (1999) Template-
imprinted nanostructured surfaces for protein recognition., Nature 398, 593–7.
70. Lin, C.-Y., Tai, D.-F., and Wu, T.-Z. (2003) Discrimination of peptides by using a
molecularly imprinted piezoelectric biosensor., Chemistry 9, 5107–10.
71. Huang, J.-T., Zhang, J., Zhang, J.-Q., and Zheng, S.-H. (2005) Template imprinting
amphoteric polymer for the recognition of proteins., J. Appl. Polym. Sci. 95, 358–361.
72. Demirel, G., Ozçetin, G., Turan, E., and Caykara, T. (2005) pH/temperature - sensitive
imprinted ionic poly(N-tert-butylacrylamide-co-acrylamide/maleic acid) hydrogels for
bovine serum albumin., Macromol. Biosci. 5, 1032–7.
73. Rachkov, A., and Minoura, N. (2000) Recognition of oxytocin and oxytocin-related
peptides in aqueous media using a molecularly imprinted polymer synthesized by the
epitope approach., J. Chromatogr. A 889, 111–8.
74. Umeno, D., Kawasaki, M., and Maeda, M. (1998) Photolithographic coating of
polymers on DNA as an approach for construction of nano-structures., Supramol. Sci.
5, 427–431.
75. Uludağ, Y., Piletsky, S. A., Turner, A. P. F., and Cooper, M. A. (2007) Piezoelectric
sensors based on molecular imprinted polymers for detection of low molecular mass
analytes., FEBS J. 274, 5471–80.
76. Spivak, D. (2004) Selectivity in Molecularly Imprinted Matrices. In Molecularly
Imprinted Materials, pp 395–417, CRC Press.
77. Iqbal, N., and Lieberzeit, P. A. (2012) Artificial Receptors for Mass-Sensitive
Sensors : Targeting Analytes from Bioanalytes by Molecular Imprinting. In
Molecularly Imprinted Sensors, pp 195–235, Elsevier B.V.
78. Wang, J. (2006) Chapter 2. Study of Electrode Reactions and Interfacial Properties. In
Analytical Electrochemistry Third Edit., John Wiley & Sons, Inc.
79. Ward, M. D. (2006) Microbalance, Electrochemical Quartz Crystal. In Encyclopedia of
Analytical Chemistry, John Wiley & Sons, Ltd.
80. Hayden, O., Haderspöck, C., Krassnig, S., Chen, X., and Dickert, F. L. (2006) Surface
imprinting strategies for the detection of trypsin., Analyst 131, 1044–50.
81. Schirhagl, R., Seifner, A., Husain, F. T., Cichna-Markl, M., Lieberzeit, P. A., and
Dickert, F. L. (2010) Antibodies and Their Replicae in Microfluidic Sensor Systems—
Labelfree Quality Assessment in Food Chemistry and Medicine., Sens. Lett. 8, 399–
404.

117
82. Sontimuang, C., Suedee, R., and Dickert, F. (2011) Interdigitated capacitive biosensor
based on molecularly imprinted polymer for rapid detection of Hev b1 latex allergen.,
Anal. Biochem. 410, 224–33.
83. Birnbaumer, G. M., Lieberzeit, P. A., Richter, L., Schirhagl, R., Milnera, M., Dickert,
F. L., Bailey, A., and Ertl, P. (2009) Detection of viruses with molecularly imprinted
polymers integrated on a microfluidic biochip using contact-less dielectric
microsensors., Lab Chip 9, 3549–56.
84. Schirhagl, R., Lieberzeit, P. A., Blaas, D., and Dickert, F. L. (2010) Chemosensors for
viruses based on artificial immunoglobulin copies., Adv. Mater. 22, 2078–81.
85. Poole, S., West, S. I., and Fry, J. C. (1987) Effects of basic proteins on the
denaturation and heat-gelation of acidic proteins., Food Hydrocoll. 1, 301–316.
86. Kryscio, D. R., and Peppas, N. A. (2012) Critical review and perspective of
macromolecularly imprinted polymers., Acta Biomater. 8, 461–73.
87. Janiak, D. S., and Kofinas, P. (2007) Molecular imprinting of peptides and proteins in
aqueous media., Anal. Bioanal. Chem. 389, 399–404.
88. Zhou, X., Li, W., He, X., Chen, L., and Zhang, Y. (2007) Recent Advances in the
Study of Protein Imprinting., Sep. Purif. Rev. 36, 257–283.
89. Grdadolnik, J., and Maréchal, Y. (2001) Bovine serum albumin observed by infrared
spectrometry. I. Methodology, structural investigation, and water uptake., Biopolymers
62, 40–53.
90. Wangchareansak, T., Sangma, C., Ngernmeesri, P., Thitithanyanont, A., and
Lieberzeit, P. A. (2013) Self-assembled glucosamine monolayers as biomimetic
receptors for detecting WGA lectin and influenza virus with a quartz crystal
microbalance., Anal. Bioanal. Chem. 405, 6471–8.
91. Vaidya, A. A., Lele, B. S., Kulkarni, M. G., and Mashelkar, R. A. (2001) Creating a
macromolecular receptor by affinity imprinting., J. Appl. Polym. Sci. 81, 1075–1083.
92. Venton, D. L., and Gudipati, E. (1995) Influence of protein on polysiloxane polymer
formation: evidence for induction of complementary protein-polymer interactions.,
Biochim. Biophys. Acta 1250, 126–36.
93. Lieberzeit, P. A., Afzala, A., Podlipnaa, D., Krassniga, S., Blumenstockb, H., and
Dickert, F. L. (2007) Printing materials in micro- and nano-scale: Systems for process
control., Sensors Actuators B Chem. 126, 153–158.
94. Collier, G. S., Pratt, J. M., De Wet, C. R., and Tshabalala, C. F. (1979) Studies on
haemin in dimethyl sulphoxide/water mixtures., Biochem. J. 179, 281–9.
95. Li, W.-H., and Stöver, H. D. H. (1998) Porous monodisperse poly(divinylbenzene)
microspheres by precipitation polymerization., J. Polym. Sci. Part A Polym. Chem. 36,
1543–1551.

118
96. Dean, J. A. ( 999) Lange’s Handbook of Chmistry. Fifteenth ., McGraw-Hill, Inc.
97. Reichardt, C. (2002) Solvents and Solvent Effects in Organic Chemistry Third, Upd.,
Wiley-VCH, Weinheim, FRG.
98. Lieberzeit, P. A., Afzal, A., Rehman, A., and Dickert, F. L. (2007) Nanoparticles for
detecting pollutants and degradation processes with mass-sensitive sensors., Sensors
Actuators B Chem. 127, 132–136.

119
CURRICULUM VITAE
Nam PHAN VAN HO
Birth 21st July 1981, Ho Chi Minh City, Vietnam
Nationality Vietnamese
Email [email protected]
Education Ph.D. in Analytical Chemistry, University of Vienna, Vienna,
Austria, 2010-present
Msc. in Toxicology and Quality Control of Drugs, Medicine
and Pharmacy University of Ho Chi Minh City, Ho Chi Minh
City, Vietnam, 2006-2008
Bachelor of Pharmacy, Medicine and pharmacy University of
Ho Chi Minh City, Ho Chi Minh City, Vietnam, 1999-2004
Research experience PhD scholar in the Sensors and Rapid Analysis laboratory at
Department of Analytical Chemistry, University of Vienna
(Research supervisor: Univ.-Prof. Peter Lieberzeit), 2010-present
Lecturer in Analytical Chemistry and Quality control of drug
department, Faculty of Pharmacy, Medical and Pharmacy
University HCM City, 2004-2010
Conference Contributions
(During PhD study)
Nam V.H. Phan, H.F. Sussitz, and P.A. Lieberzeit, Increasing
sensitivity of BSA-molecularly imprinted polymer by
nanoparticles strategy, EnFI 2013 workshop, July 2003, Hasselt
University, Campus Hasselt, Belgium
Hermann F. Sussitz, N.V.H. Phan, and P.A. Lieberzeit, Novel
one-step templating strategy for protein molecularly imprinted
polymers, EnFI 2013 workshop, July 2003, Hasselt University,
120
Campus Hasselt, Belgium
Nam V.H. Phan and P.A. Lieberzeit, Molecularly imprinted
polymer (MIP) nanoparticles for protein sensing, 9. ASAC
Junganalytikerlnnen Forum, June 2013, Vienna University of
Technology, Vienna, Austria
Skill Molecular Imprinting Polymer (MIP) and Quartz crystal
Microbalance (QCM)
Atomic Force Microscopy (AFM), Scanning Tunneling
Microscopy (STM).
Fluorescence Microscopy, Fluorescence Spectrophotometer.
ATR/FT-IR Spectroscopy, UV/Visible Spectroscopy,
Atomic Absorption Spectroscopy (AAS).
Gas Chromatography /Mass Spectrometry (GC-MS) and High
performance liquid chromatography (HPLC), Chromatographic
Techniques (Paper, Column, TLC, etc.)
Quality control of drug, Quality Assurance, Validation of
analytical methods and analytical instruments.