Embed Size (px)
Citation preview

Submitted: 21 February, 2018; Revised: 27 July, 2018
© Sleep Research Society 2018. Published by Oxford University Press [on behalf of the Sleep Research Society].
1
This is an Open Access article distributed under the terms of the Creative Commons Attribution Non-Commercial License (http://creativecommons.org/licenses/by-nc/4.0/), which permits non-commercial re-use, distribution, and reproduction in any medium, provided the original work is properly cited. For commercial re-use, please contact [email protected]
Original Article
Dissociable effects of self-reported daily sleep duration
on high-level cognitive abilities
Conor J. Wild1,*, , Emily S. Nichols1, Michael E. Battista2, Bobby Stojanoski1 and Adrian M. Owen1,2
1The Brain and Mind Institute, Western University, London, ON, Canada and 2Department of Psychology, Western University, London, ON, Canada
*Corresponding author. Conor J. Wild, The Brain and Mind Institute, Western University, London, ON N6C 5B7, Canada. Email: [email protected].
AbstractMost people will at some point experience not getting enough sleep over a period of days, weeks, or months. However, the effects of this kind of everyday sleep restriction on high-level cognitive abilities—such as the ability to store and recall information in memory, solve problems, and communicate—remain poorly understood. In a global sample of over 10 000 people, we demonstrated that cognitive performance, measured using a set of 12 well-established tests, is impaired in people who reported typically sleeping less, or more, than 7–8 hours per night—which was roughly half the sample. Crucially, performance was not impaired evenly across all cognitive domains. Typical sleep duration had no bearing on short-term memory performance, unlike reasoning and verbal skills, which were impaired by too little, or too much, sleep. In terms of overall cognition, a self-reported typical sleep duration of 4 hours per night was equivalent to aging 8 years. Also, sleeping more than usual the night before testing (closer to the optimal amount) was associated with better performance, suggesting that a single night’s sleep can benefit cognition. The relationship between sleep and cognition was invariant with respect to age, suggesting that the optimal amount of sleep is similar for all adult age groups, and that sleep-related impairments in cognition affect all ages equally. These findings have significant real-world implications, because many people, including those in positions of responsibility, operate on very little sleep and may suffer from impaired reasoning, problem-solving, and communications skills on a daily basis.
Key Words: cognitive function; short-term memory; executive function; sleep duration; effects of sleep restriction on cognition
Statement of Significance
We assessed over 10 000 participants on a comprehensive battery of cognitive tests to ask whether daily sleep dura-tion is associated with high-level cognition. Overall, cognitive performance was worse for participants who reported typically sleeping less or more than 7–8 hours per night—which was roughly half the sample. Importantly, not all high-level cognitive domains exhibited this relationship; sleep duration had no bearing on short-term memory, unlike high-level reasoning and verbal skills, which were impaired by too little, or too much, sleep. This relationship between sleep and cognition did not depend on age. Broadly, these results suggest that many people, who do not get enough sleep daily, may be operating with impaired reasoning and communication skills.
SLEEPJ, 2018, 1–11
doi: 10.1093/sleep/zsy182Advance Access publication Date: 13 September 2018Original Article
Dow
nloaded from https://academ
ic.oup.com/sleep/article-abstract/41/12/zsy182/5096067 by U
niversity of Western O
ntario user on 20 January 2020

IntroductionWe all sleep, hopefully, every single day. Regular and sufficient sleep helps maintain numerous aspects of physical and mental health [1, 2], but countless ordinary life circumstances, such as parenthood, demanding professions, studying, illness, or life-style choices often prevent people from getting a full night’s sleep. In fact, in a recent US health survey [3] of approximately 250 000 people, 29.2% of respondents reported getting less than an average of 6 hours of sleep per night. Individuals who sleep this little on a day-to-day basis are considered to be experienc-ing chronic partial sleep deprivation (SD) (also known as sleep restriction), which, in a laboratory setting, has been associated with impaired physiological and cognitive functioning [4, 5]. Given the fact that so many people report sleeping so little, it seems likely that, as a population, our ability to function in the everyday world is being measurably affected. Indeed, it has been estimated that the productivity lost annually due to chronic par-tial SD costs an estimated $21.4 billion in Canada alone [6].
Solving everyday problems requires the cooperation of many different cognitive systems, from low-level functions like main-taining vigilance and attending to certain stimuli while ignoring distractions, to higher-level functions like encoding information into memory, manipulating that information, and communicat-ing the results to other people. It is well understood that many aspects of cognition, including higher-level functions like deci-sion making, are severely impaired by acute total sleep SD [7, 8]. However, the effects of naturalistic and chronic sleep restric-tion are less clear [5, 9], in part because fewer studies have been conducted about its effects on cognition than those involving total SD. In addition, those studies that do exist typically meas-ure the effects of partial SD over a short period of time in the lab, use tasks that measure low-level cognitive performance (e.g. vigilance), and when included in meta-analyses are lumped into one or two broadly-defined categories of “cognitive functioning” [4, 5, 9, 10]. As a result, while it appears that sleep restriction does impair cognition, it is not clear what cognitive domains are most affected (e.g. memory vs. problem-solving), and whether these impairments manifest from the type of chronic sleep restriction that many people are experiencing in everyday life.
Previous cross-sectional studies of large survey-type data-sets have shown that some simple measures of cognition, like performance on the Mini-Mental State Examination, are related to sleep duration [11–15]: people who report having an abnormal amount of sleep (e.g. too little or too much sleep) consistently performed worse on such tests. However, with one exception [15] these reports focused on global measures of cognitive per-formance [12–14], and/or specific tests sensitive to the onset of Alzheimer’s disease [11, 13], giving a narrow view of cognitive performance. Also, despite their large samples, none of these studies looked at whether the relationship between sleep dura-tion and cognition depended on demographic variables, like age. After all, it is commonly observed that nightly sleep decreases as we get older [16], and mounting evidence suggests that sleep is important for preserving cognitive function in older adults [17]. Current recommendations [18] suggest that people 65 years and older may need slightly less sleep than younger adults, but these guidelines are based on many factors other than just cognition.
In the current study, we leveraged the power of the Internet to investigate the relationship between everyday sleep and cog-nition in more than 10 000 individuals drawn from all walks of life, age groups, and backgrounds. Volunteers completed the
Cambridge Brain Sciences (CBS) online 12-test battery, which taps a broad range of cognitive abilities, such as aspects of inhibition, selective attention, reasoning, verbal short-term memory, spatial working memory, planning, visuospatial work-ing memory, and cognitive flexibility. The tests have been vali-dated in patients with anatomically-specific brain lesions [19, 20], in neurodegenerative populations [21, 22], in pharmaco-logical intervention studies [23, 24], and their neural correlates have been thoroughly described using functional neuroimaging [25–28].
By combining participants’ scores from the broad range of cognitive tests with self-reported information about how much they slept in the past month and on the night before testing, we investigated how real-life sleeping patterns are related to cognition. Specifically, we asked whether the typical amount of sleep was associated with cognitive performance globally, or in specific domains. Then, we looked at whether deviation from the usual amount of sleep had any bearing on cognition. Given the large and diverse sample, we were also able to ask whether the amount of sleep required for normal cognition depended on age. We hypothesized that those participants who typically slept less than (or significantly more than) some optimal amount would exhibit poorer cognition across all domains, yielding an inverted-U shaped association between cognition and sleep duration. Finally, we predicted that this effect would be modu-lated by age, such that getting too little or too much sleep would be associated with disproportionately worse performance for older, compared to younger, adults.
Materials and Methods
Participants and data selection
All data for this study were collected with the CBS (www. cambridgebrainsciences.com) online platform, which has previ-ously been used for other large-scale studies of cognition [29]. Visitors to the website could learn about and volunteer to partic-ipate in this study, which was approved by Western University’s Health Sciences Research Ethics Board. Recruitment was accom-plished through social media advertisements (Facebook and Twitter) and word of mouth, and volunteers received no com-pensation for participating in the study. Participants acknowl-edged that they could speak fluent English to read the study letter of information, letter of consent, and instructions. After providing informed consent, volunteers completed a question-naire that included items about: birthdate (used to calculate age at test), gender, level of education, frequency of anxiety- and depression-related episodes in the past month, the (self-reported) number of hours slept per night on average in the past month, and what time the volunteer went to bed and woke the night prior to participating in the study (used to estimate sleep duration the night prior to testing). See Supplementary Table S1 for a summary of these characteristics in the final sample. Completing the registration process, questionnaire, and 12 tests took approximately 60 minutes.
Overall, 40 105 people registered to participate in this study. Of those, 16 812 people completed the questionnaire and all 12 tests. Most of this attrition (N = 23 293) was due to techni-cal issues related to server performance during the initial surge of registrations that prevented participants from completing stages of the experiment. Participants were excluded from the analysis if they: reported their age to be less than 18 or more
2 | SLEEPJ, 2018, Vol. 41, No. 12D
ownloaded from
https://academic.oup.com
/sleep/article-abstract/41/12/zsy182/5096067 by University of W
estern Ontario user on 20 January 2020

than 100 years (N = 1175); reported sleeping zero or more than 16 hours per night (N = 514); or had missing data for any question-naire items or test scores (N = 3853). Test score outliers were then filtered in two passes. First, scores more than 6 SDs from the mean were removed (to account for obvious data errors, N = 54), then scores more than 4 SDs from the mean were removed (N = 242). This resulted in final sample of 10 886 participants (6797 female, 4013 male, 76 other) with a mean age of 41.7 years (SD = 14.3). Responses to optional questions regarding country of origin and languages spoken (Supplementary Table S2) showed that at least 10 314 participants in the final sample (95%) primar-ily spoke English at home.
Cognitive test battery
After the questionnaire, participants completed the 12 tests in the CBS test battery. Test order was randomized across partici-pants. Detailed descriptions of the tests (including screen shots and test-retest reliability) can found in the Supplementary Material, but in brief they are: (1) Spatial Span (short-term mem-ory); (2) Monkey Ladder (visuospatial working memory); (3) Paired Associates; (4) Token Search (working memory and strategy); (5) Odd One Out (deductive reasoning); (6) Rotations (mental rota-tion); (7) Feature Match (feature-based attention and concentra-tion); (8) Spatial Planning (planning and executive function); (9) Interlocking Polygons (visuospatial processing); (10) Grammatical Reasoning (verbal reasoning); (11) Double Trouble (a modified Stroop task); and (12) Digit Span (verbal working memory).
Cognitive performance scores
Our measures of cognitive performance comprised scores from the 12 individual tests, and four “composite” scores reflecting performance overall and in three specific domains—short-term memory (STM), reasoning, and verbal ability. These three cog-nitive domains have been found to explain a large proportion of the variability in performance across the test battery and are associated with distinct functional brain networks [29]. To calculate these composite scores, the 12 individual test scores were first normalized (M = 0.0, SD = 1.0). The three cognitive domain scores were calculated using the formula, Y X Ar T= ( )+ , where Y is the N × 3 matrix of domain scores, X is the N × 12 matrix of test z-scores, Ar is the 12 × 3 matrix of varimax-rotated principal component weights (i.e. factor loadings) from Hampshire et al. [29] (Supplementary Table S4). Simply put, all 12 tests contributed to each domain score, as determined by the component weights in Supplementary Table S4. The overall measure of performance was calculated as the average of 12 test z-scores scaled to have a mean of 0.0 and SD of 1.0 in this pop-ulation; for each individual, the overall score represents their average performance across the entire test battery.
Data analysis
Data were analyzed in Python (version 3.6.2, www.python. org. Accessed September 19, 2018) using SciPy (v0.19.1)—an open source collection of python modules for performing scien-tific and mathematical computing. Specific packages used included: NumPy (v1.13.1) to provide high-performance matrix and numeric calculation; Pandas (v0.20.3) for data organization,
manipulation, and simple analyses; and Statsmodels (v0.8.0) for building and estimating linear regression models, linear mixed effects models, and performing statistical tests (e.g. likelihood ratio [LR] tests). Figures were created using the Matplotlib (v2.0.2) and Seaborn (v0.8) python libraries, which are also part of the SciPy framework. All custom python code used for this study, including a viewable notebook that details each step of the anal-ysis, can viewed at (https://github.com/TheOwenLab/2018-Wild-et-al-Sleep-and-Cognition Accessed September 19, 2018).
Linear regression models were constructed to predict each of the 16 scores from participants’ reported sleep duration and associated questionnaire data, and were estimated using ordi-nary least squares. The relationship between cognitive perfor-mance and the “typical sleep duration” (i.e. the self-reported average number of hours slept per night in the past month) was modeled as a second-order (i.e. quadratic) polynomial, by including two regressors: the reported number of hours slept per night, and the square of this value. Continuous variables—age and sleep duration (before polynomial expansion)—were mean centered before being added as regressors in the model. The covariates of no interest—gender, level of education, frequency of anxiety, and frequency of depression—were all included as N − 1 dummy coded (0 or 1) regressors, where N is the number of categories for each variable (e.g. three levels of gender—Female/ Male/ Other—were modeled with two dummy variables). The interaction between “typical sleep duration” and age was included by specifying two additional regressors (i.e. age times each of the two sleep duration variables). With an included intercept term, the design matrix for each score’s regression model had 20 columns and 10 886 rows.
To investigate the effect of a single night’s sleep on cogni-tion—specifically, whether deviating from the usual amount of sleep was associated with performance—we introduced another factor into our regression analyses: the “sleep delta.” This term was calculated as the difference between the estimated num-ber of hours slept the night prior to testing, and the reported usual amount of sleep; that is, the former minus the latter, so that a positive delta indicated getting more sleep than usual. The second-order polynomial expansion of the sleep delta (i.e. sleep delta and delta-squared) was included in the linear regression models to test for a quadratic effect: one might expect that sleep-ing much more than usual, or much less than usual, would have similar effects. We also included typical sleep duration (and its square), and the interaction between typical sleep duration and sleep delta to account for the fact that the impact of deviating from a regular amount of sleep would likely depend on what the regular amount was. Four regressors were required to model this interaction (i.e. the expansion of the two second-order factors). Age, gender, education, and frequencies of anxiety- and depres-sion-related episodes were included as covariates of no interest.
To statistically test the relationship between test perfor-mance and specific factors of interest (e.g. age, sleep duration, and their interaction), LR tests were used to compare a full model that included all regressors to a reduced (nested) model that did not contain the set of regressors for an effect of inter-est. Calculated effect sizes include R2 (the difference in vari-ance accounted for between the full and reduced models) and Cohen’s f 2 (the proportion of variance uniquely accounted for by the full model) [30].
Results were considered statistically significant if p < 0.05 when Bonferroni-corrected for multiple comparisons. However,
Wild et al. | 3D
ownloaded from
https://academic.oup.com
/sleep/article-abstract/41/12/zsy182/5096067 by University of W
estern Ontario user on 20 January 2020
given that performance across tests was correlated (and hence the 16 measures were not completely independent), we esti-mated the effective number of comparisons using a method based on the variance of the eigenvalues derived from the cor-relation matrix of all 16 scores [31]. The estimated effective number of tests was 14.27, which corresponds to a conserva-tive p-value significance threshold of 0.0035. It was expected that many effects, including trivial relationships, might appear statistically significant given the large sample size [32], so we performed additional analyses to better characterize statisti-cal relationships. First, scores were expressed in SD units which makes it possible to interpret differences like a distance based effect size (like Cohen’s d). Second, when possible we estimated the Bayes factor in favor of the null (BF01) and alternative (BF10) hypotheses for each effect using the Bayesian Information Criterion (BIC) approximation [33]. This method compares two models like the LR test, but heavily penalizes model complex-ity given a large sample size. That is, it becomes more stringent as the sample size increases, and therefore tiny effect sizes are less likely to result in a rejection of the null hypothesis [34]. We interpret the calculated Bayes factors using Wagenmakers’ [33] heuristic, where BFs 1–3, 3–20, 20–150, and >150 constitute weak, positive, strong, and very strong evidence, respectively, for the given hypothesis.
To visualize the relationship between predictors (e.g. typi-cal duration, sleep delta) and cognitive performance, predicted score curves and their confidence intervals (CIs) were calculated from the estimated regression models by substituting a design matrix containing the prediction interval of interest (e.g. typi-cal sleep duration from 3 to 12 hours) and the mean value of the population for every other factor. These marginal plots show the expected cognitive score across a range of values for a given variable (e.g. typical sleep duration) while holding all other vari-ables constant (to their mean value in our sample). The x-coordi-nate of a parabola’s vertex (e.g. the optimal amount of sleep) was
simply calculated as xBA
= −2
where A was the estimated coef-
ficient for the variable-squared term, and B was the coefficient for the linear term. 95% CI for this parameter were estimated using Fieller’s method [35].
To test whether the effect of typical sleep duration differed between the three cognitive domains (STM, reasoning, and verbal
ability), a linear mixed effects model was constructed that mod-eled the three domain scores as repeated measurements for each subject. In addition to the random intercept for each subject, the model included the covariates described above, a set of dummy regressors to code the cognitive domain for each score (N = 2), and the interactions between domain and all other factors. These interactions were included because there is evidence that these cognitive domains are differently affected by age, education, gender, and level of anxiety [29]. The mixed-effects model was estimated using maximum likelihood, instead of restricted maxi-mum likelihood, to facilitate significance tests of fixed effects. F-tests, implemented as a Wald test using an F distribution, were used to test specific hypotheses: the overall two-way interaction between sleep duration and cognitive domain, and the simple two-way interactions contrasting pairs of cognitive domains.
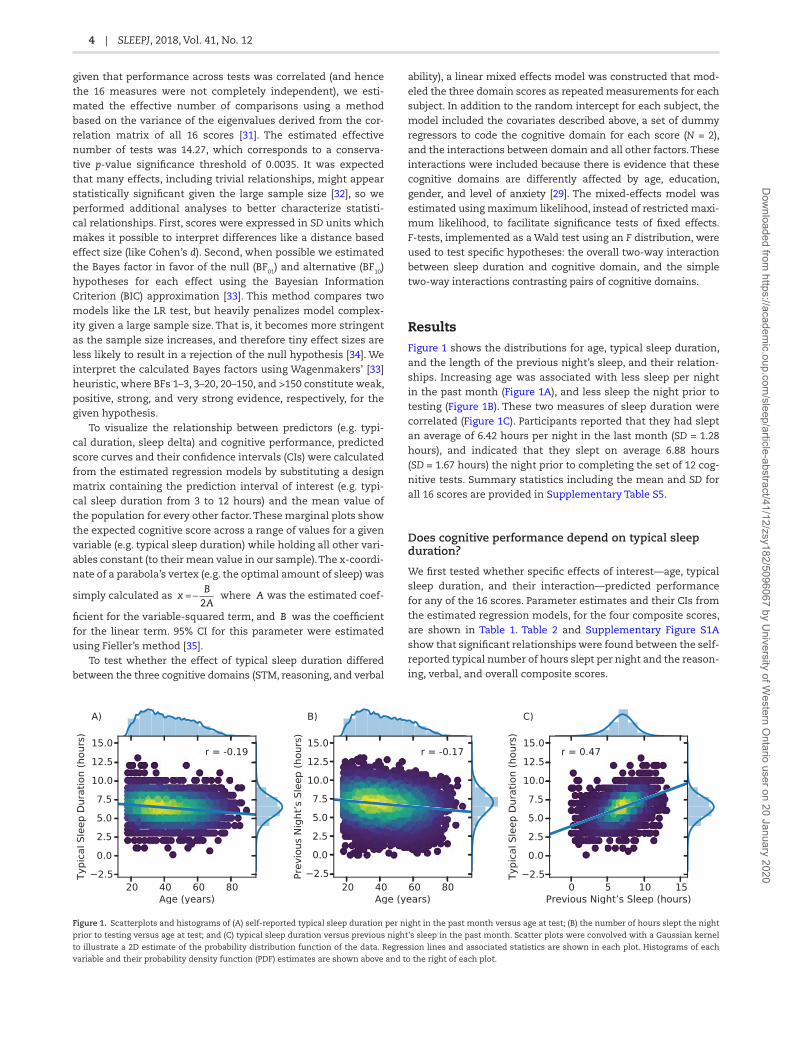
ResultsFigure 1 shows the distributions for age, typical sleep duration, and the length of the previous night’s sleep, and their relation-ships. Increasing age was associated with less sleep per night in the past month (Figure 1A), and less sleep the night prior to testing (Figure 1B). These two measures of sleep duration were correlated (Figure 1C). Participants reported that they had slept an average of 6.42 hours per night in the last month (SD = 1.28 hours), and indicated that they slept on average 6.88 hours (SD = 1.67 hours) the night prior to completing the set of 12 cog-nitive tests. Summary statistics including the mean and SD for all 16 scores are provided in Supplementary Table S5.
Does cognitive performance depend on typical sleep duration?
We first tested whether specific effects of interest—age, typical sleep duration, and their interaction—predicted performance for any of the 16 scores. Parameter estimates and their CIs from the estimated regression models, for the four composite scores, are shown in Table 1. Table 2 and Supplementary Figure S1A show that significant relationships were found between the self-reported typical number of hours slept per night and the reason-ing, verbal, and overall composite scores.
Figure 1. Scatterplots and histograms of (A) self-reported typical sleep duration per night in the past month versus age at test; (B) the number of hours slept the night
prior to testing versus age at test; and (C) typical sleep duration versus previous night's sleep in the past month. Scatter plots were convolved with a Gaussian kernel
to illustrate a 2D estimate of the probability distribution function of the data. Regression lines and associated statistics are shown in each plot. Histograms of each
variable and their probability density function (PDF) estimates are shown above and to the right of each plot.
4 | SLEEPJ, 2018, Vol. 41, No. 12D
ownloaded from
https://academic.oup.com
/sleep/article-abstract/41/12/zsy182/5096067 by University of W
estern Ontario user on 20 January 2020

No significant relationship was observed between sleep duration and performance in the STM domain. Bayesian com-parisons support these conclusions (Table 2, Supplementary Figure S1B), offering very strong evidence (BF10 > 1000) that reported sleep duration was associated with reasoning, ver-bal, and overall ability, whereas there was very strong evidence (BF01 > 150) that STM performance had no such association with sleep. The quadratic sleep-duration term was significant for these three scores as well (Table 2), and inspection of this esti-mated parameter for each model revealed that it was negative in all cases (Table 1)—implying an inverted-U shaped association between performance and sleep duration. Figure 2 illustrates
this relationship by plotting predicted overall cognitive perfor-mance as a function of hours slept. The results of these anal-yses for individual test scores are provided in Supplementary Figure S1 and Supplementary Table S6.
Supplementary analyses were carried out to investigate other explanations. First, we repeated the previous analysis including only those participants who reported typical sleep durations within ±1.5 SDs of the mean, to investigate whether the U-shaped relationship was driven by poor performers with very low or high amounts of sleep. This yielded a similar pattern of results (Supplementary Table S7), suggesting the relationship was not driven by poor performing subjects “in the tails”. We also
Table 1. OLS parameter estimates for effects of interest, from regression models estimated for each cognitive composite score
Parameter Score Coef SE t p 95% CI
Typical sleep duration STM 0.018 0.007 2.39 0.017 0.003 0.032Reasoning 0.030 0.007 4.19 0.000 0.016 0.044Verbal 0.036 0.008 4.46 0.000 0.020 0.051Overall 0.045 0.007 6.34 0.000 0.031 0.058
Typical sleep duration2 STM −0.005 0.003 −1.43 0.154 −0.011 0.002Reasoning −0.020 0.003 −6.08 0.000 −0.026 −0.014Verbal −0.017 0.004 −4.73 0.000 −0.024 −0.010Overall −0.023 0.003 −7.17 0.000 −0.029 −0.017
Age at test STM −0.025 0.001 −34.76 0.000 −0.027 −0.024Reasoning −0.022 0.001 −31.11 0.000 −0.024 −0.021Verbal −0.012 0.001 −15.23 0.000 −0.014 −0.011Overall −0.033 0.001 −48.10 0.000 −0.035 −0.032
Age at test × typical sleep duration STM 0.000 0.000 0.34 0.732 −0.001 0.001Reasoning 0.000 0.000 −0.44 0.661 −0.001 0.001Verbal 0.000 0.001 0.02 0.988 −0.001 0.001Overall 0.000 0.000 −0.07 0.945 −0.001 0.001
Age at test × typical sleep duration2 STM 0.000 0.000 1.20 0.231 0.000 0.001Reasoning 0.000 0.000 1.05 0.292 0.000 0.001Verbal 0.000 0.000 −1.45 0.148 −0.001 0.000Overall 0.000 0.000 0.73 0.464 0.000 0.001
Coef = coefficient value, SE = standard error, t = t-statistic (df = 10 885), p = uncorrected p-value for the associated t-statistic, CI = 95% confidence intervals of the
parameter estimate. Other Covariates: gender, level of education, level of anxiety, level of depression.
Table 2. Results of LR tests that compared, for each score, the full regression model to a nested model that did not include regressors for the effect of interest. Typical sleep duration (overall) indicates a test for the combined effect of the linear and quadratic terms, whereas Typical sleep duration2 is a test of only the quadratic term.
Effect Score LR p padj df ΔR2 f2 BF01 BF10
Age STM 1147.63 <0.001 <0.001* 1 0.095 0.111 <0.001 >1000Reasoning 929.04 <0.001 <0.001* 1 0.078 0.089 <0.001 >1000Verbal 230.04 <0.001 <0.001* 1 0.020 0.021 <0.001 >1000Overall 2101.18 <0.001 <0.001* 1 0.159 0.213 <0.001 >1000
Typical sleep duration (overall)
STM 8.55 0.014 0.198 2 0.001 0.001 151.113 0.007Reasoning 60.34 <0.001 <0.001* 2 0.005 0.006 <0.001 >1000Verbal 47.04 <0.001 <0.001* 2 0.004 0.004 <0.001 >1000Overall 101.64 <0.001 <0.001* 2 0.007 0.009 <0.001 >1000
Typical sleep duration2 STM 2.03 0.154 1.000 1 0.000 0.000 37.746 0.026Reasoning 36.99 <0.001 <0.001* 1 0.003 0.003 <0.001 >1000Verbal 22.40 <0.001 <0.001* 1 0.002 0.002 <0.001 701.456Overall 51.38 <0.001 <0.001* 1 0.004 0.005 <0.001 >1000
Age × Typical sleep duration (overall)
STM 1.55 0.462 1.000 2 0.000 0.000 >1000 <0.001Reasoning 1.32 0.518 1.000 2 0.000 0.000 >1000 <0.001Verbal 2.10 0.350 1.000 2 0.000 0.000 >1000 <0.001Overall 0.54 0.762 1.000 2 0.000 0.000 >1000 <0.001
padj = adjusted p-value, f2 = Cohen’s f2 effect size statistic, df = degrees of freedom.
*Significant effects corrected for multiple comparisons (N = 14.27 effective comparisons). Also listed are the corresponding Bayes factors in favor of the null (BF01) and
alternative hypotheses (BF10).
Wild et al. | 5D
ownloaded from
https://academic.oup.com
/sleep/article-abstract/41/12/zsy182/5096067 by University of W
estern Ontario user on 20 January 2020

used the estimated length of the previous night’s sleep, instead of the typical amount of sleep, to predict cognitive scores. This again produced the same pattern of results (Supplementary Figure S2, Supplementary Table S8).
What is the optimal amount of sleep?
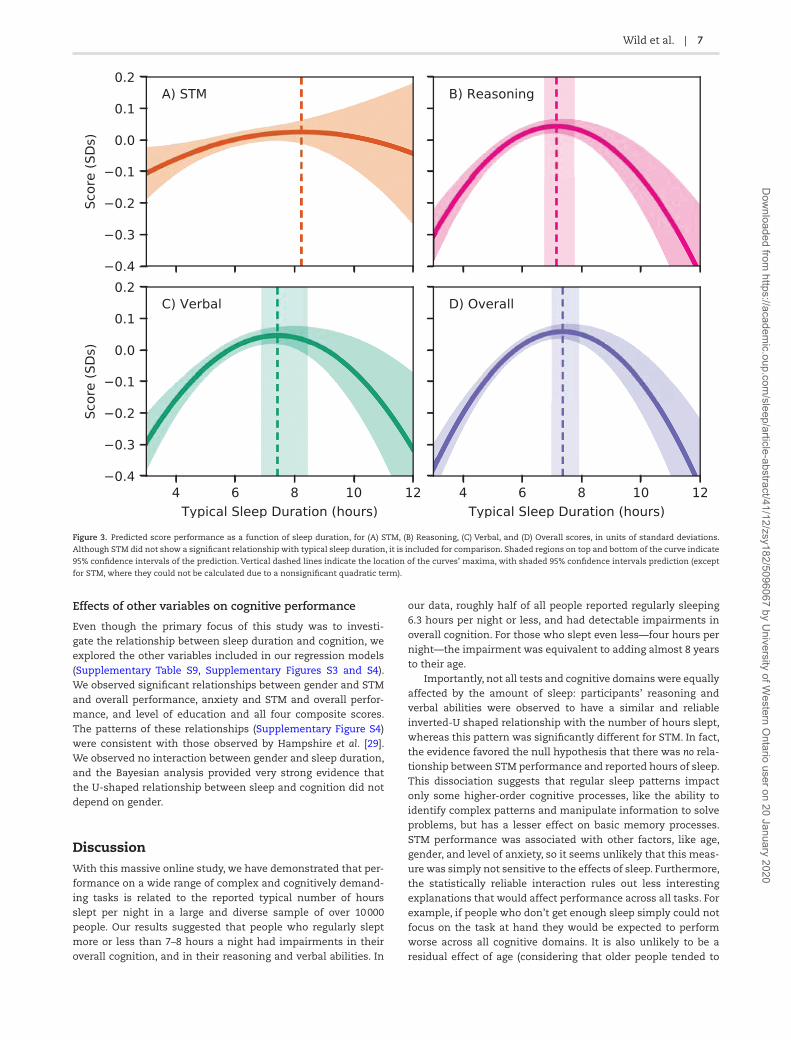
From parameter estimates of composite score models, we calcu-lated the x-coordinate of the inflection point for each fitted curve (i.e. the numbers of hours slept resulting in peak performance in our population; Figure 3), and 95% CIs around this point. The optimal amount of sleep was found to be 7.16 (95% CI = 6.78–7.74), 7.44 (95% CI = 6.92–8.43), and 7.38 (95% CI = 7.02–7.91) hours for reasoning, verbal, and overall abilities, respectively.
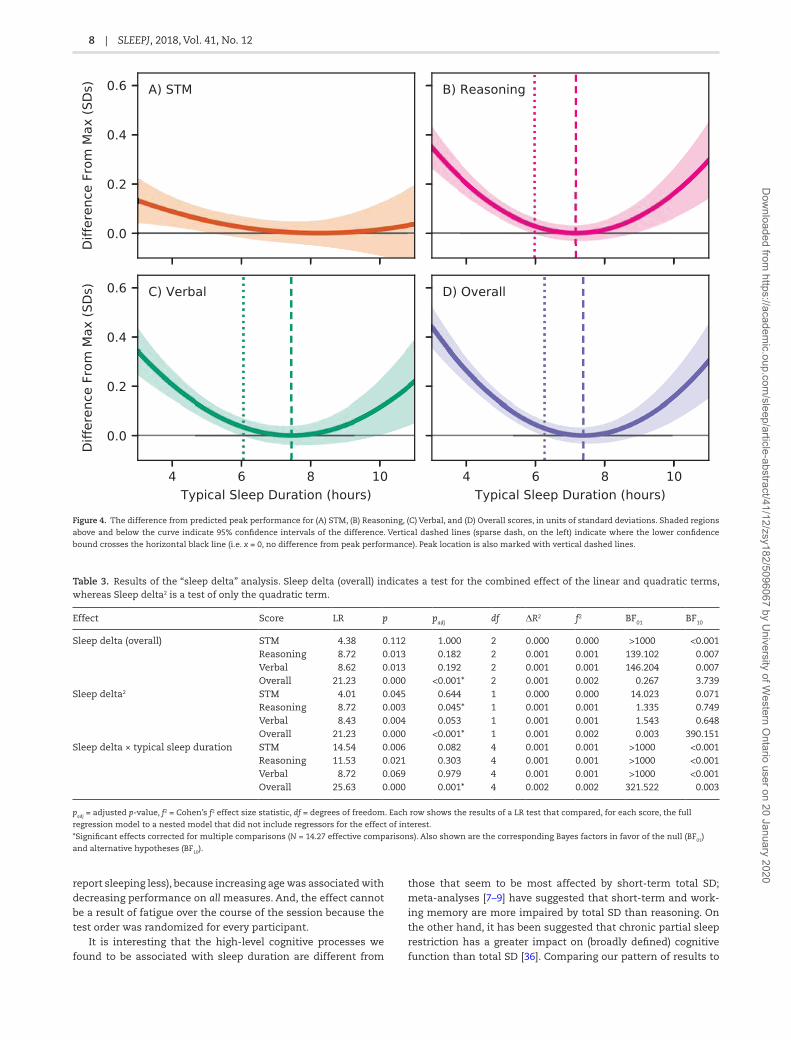
Figure 4 shows the difference between performance for a given sleep duration and maximum performance, with 95% CIs of the difference, for all four composite scores. This figure shows, for example, that reasoning, verbal, and overall perfor-mance scores for participants who reportedly slept only 4 hours per night were on average 0.20, 0.20, and 0.26 SDs lower, respec-tively, than participants who slept the optimal amount (reason-ing: t(10865) = 7.94, p < 0.001; verbal t(10865) = 7.19, p < 0.001, overall t(10865) = 10.55, p < 0.001). For context, this difference corresponds to an increase in age of 9.04, 17.0, or 7.86 years for these three scores. Figure 4 also indicates that we could reliably detect an impairment (i.e. a difference from optimal performance, p < 0.05 uncorrected) for 5.97, 6.06, and 6.26 hours of sleep for reasoning, verbal, and overall scores. In our sample, 48.9% of participants reported getting typically less than 6.30 hours of sleep per night in the past month.
Are cognitive domains affected differently?
An F-test revealed a significant cognitive domain (three levels—STM, Reasoning, Verbal ability) by sleep duration overall inter-action (F(4,32602) = 4.06, p < 0.005), suggesting that sleep affected the three domains differently. Follow-up tests indicated sig-nificant simple two-way interactions such that the relation-ship between sleep duration and performance differed between
reasoning and STM (F(2,32602) = 5.90, p < 0.005) and verbal and STM (F(2,32602) = 5.53, p < 0.005), but not between reasoning and verbal domains. Figure 3 illustrates the difference in the quadratic fit between STM and the reasoning and verbal domains.
Does the relationship between sleep and cognition depend on age?
We did not observe any significant interactions between age and sleep duration (Table 2 and Supplementary Figure S1 bot-tom rows). While we cannot accept a nonsignificant interaction as evidence that there is no such effect, the Bayesian analysis of the same data and models (Table 2) suggested that there is very strong evidence in favor of the null hypothesis—that the relationship between sleep duration and cognitive performance does not depend on age. The Bayesian statistics show, for exam-ple, that the pattern of performance across all domains was well over 1000 times more likely to occur if the relationship between sleep duration and cognitive performance did not depend on the participants’ age.
Does a single night’s sleep affect cognition?
Examination of the “sleep delta” effect revealed a signifi-cant relationship with participants’ overall cognitive per-formance that was quadratic (Table 3, Supplementary Figure S5a). Bayesian statistics provided very strong corre-sponding evidence (BF10 = 390) in favor of this effect (Table 3, Supplementary Figure 5Sb). Inspection of the parameter esti-mates (Supplementary Table S10) showed a negative coefficient of the quadratic “sleep delta,” implying an inverted U-shaped association. Reasoning scores exhibited a significant quad-ratic effect of sleep delta, but the corresponding Bayes factor suggested very weak evidence in favor of the null hypothesis (BF01 = 1.34) that there was no relationship between sleep delta and reasoning scores. Similarly, there was a significant interac-tion between sleep delta and typical sleep duration for overall performance, yet the Bayesian analysis very strongly supported the null hypothesis (BF01 = 322). The diverging nature of these latter two observations—statistically significant effects with Bayesian evidence in favor of the null hypothesis—suggests that these might be trivial results (i.e. tiny effects detected only because of the large sample).
Figure 5 shows predicted cognitive performance as a func-tion of sleep delta (i.e. the marginal effect of sleep delta while holding all else constant) for overall and (for comparison’s sake) reasoning abilities. The location of the maximum occurred at a delta of 1.30 hours (95% CI = −0.235 to 7.377) and 1.18 hours (95% CI = 0.249–2.762) for reasoning and overall scores, respec-tively. This implies that sleeping around 1.18 hours more than usual was associated with best overall cognitive performance; however, sleeping less than the usual amount, or sleeping more than 2.76 hours more than usual (i.e. the upper 95% CI or the delta maximum), was associated with decreasing performance. Given that the average amount of typical sleep for our sample was 6.41 hours, and that the optimal amount of sleep for overall cognitive performance was found to be between 7.02–7.91 hours, this finding suggests that cognitive performance is better given a night of sleep that is closer to the optimal amount than usual. In other words, sleeping closer to 7 to 8 hours on a given night was associated with better overall cognition.
Figure 2. Overall test performance versus self-reported typical sleep duration
per night in the past month, with the predicted overall performance for our pop-
ulation sample in light blue (with 95% confidence intervals). To better illustrate
the density of data points in the sample, the color of each point is scaled by a
kernel density estimate.
6 | SLEEPJ, 2018, Vol. 41, No. 12D
ownloaded from
https://academic.oup.com
/sleep/article-abstract/41/12/zsy182/5096067 by University of W
estern Ontario user on 20 January 2020
Effects of other variables on cognitive performance
Even though the primary focus of this study was to investi-gate the relationship between sleep duration and cognition, we explored the other variables included in our regression models (Supplementary Table S9, Supplementary Figures S3 and S4). We observed significant relationships between gender and STM and overall performance, anxiety and STM and overall perfor-mance, and level of education and all four composite scores. The patterns of these relationships (Supplementary Figure S4) were consistent with those observed by Hampshire et al. [29]. We observed no interaction between gender and sleep duration, and the Bayesian analysis provided very strong evidence that the U-shaped relationship between sleep and cognition did not depend on gender.
DiscussionWith this massive online study, we have demonstrated that per-formance on a wide range of complex and cognitively demand-ing tasks is related to the reported typical number of hours slept per night in a large and diverse sample of over 10 000 people. Our results suggested that people who regularly slept more or less than 7–8 hours a night had impairments in their overall cognition, and in their reasoning and verbal abilities. In
our data, roughly half of all people reported regularly sleeping 6.3 hours per night or less, and had detectable impairments in overall cognition. For those who slept even less—four hours per night—the impairment was equivalent to adding almost 8 years to their age.
Importantly, not all tests and cognitive domains were equally affected by the amount of sleep: participants’ reasoning and verbal abilities were observed to have a similar and reliable inverted-U shaped relationship with the number of hours slept, whereas this pattern was significantly different for STM. In fact, the evidence favored the null hypothesis that there was no rela-tionship between STM performance and reported hours of sleep. This dissociation suggests that regular sleep patterns impact only some higher-order cognitive processes, like the ability to identify complex patterns and manipulate information to solve problems, but has a lesser effect on basic memory processes. STM performance was associated with other factors, like age, gender, and level of anxiety, so it seems unlikely that this meas-ure was simply not sensitive to the effects of sleep. Furthermore, the statistically reliable interaction rules out less interesting explanations that would affect performance across all tasks. For example, if people who don’t get enough sleep simply could not focus on the task at hand they would be expected to perform worse across all cognitive domains. It is also unlikely to be a residual effect of age (considering that older people tended to
Figure 3. Predicted score performance as a function of sleep duration, for (A) STM, (B) Reasoning, (C) Verbal, and (D) Overall scores, in units of standard deviations.
Although STM did not show a significant relationship with typical sleep duration, it is included for comparison. Shaded regions on top and bottom of the curve indicate
95% confidence intervals of the prediction. Vertical dashed lines indicate the location of the curves’ maxima, with shaded 95% confidence intervals prediction (except
for STM, where they could not be calculated due to a nonsignificant quadratic term).
Wild et al. | 7D
ownloaded from
https://academic.oup.com
/sleep/article-abstract/41/12/zsy182/5096067 by University of W
estern Ontario user on 20 January 2020
report sleeping less), because increasing age was associated with decreasing performance on all measures. And, the effect cannot be a result of fatigue over the course of the session because the test order was randomized for every participant.
It is interesting that the high-level cognitive processes we found to be associated with sleep duration are different from
those that seem to be most affected by short-term total SD; meta-analyses [7–9] have suggested that short-term and work-ing memory are more impaired by total SD than reasoning. On the other hand, it has been suggested that chronic partial sleep restriction has a greater impact on (broadly defined) cognitive function than total SD [36]. Comparing our pattern of results to
Figure 4. The difference from predicted peak performance for (A) STM, (B) Reasoning, (C) Verbal, and (D) Overall scores, in units of standard deviations. Shaded regions
above and below the curve indicate 95% confidence intervals of the difference. Vertical dashed lines (sparse dash, on the left) indicate where the lower confidence
bound crosses the horizontal black line (i.e. x = 0, no difference from peak performance). Peak location is also marked with vertical dashed lines.
Table 3. Results of the “sleep delta” analysis. Sleep delta (overall) indicates a test for the combined effect of the linear and quadratic terms, whereas Sleep delta2 is a test of only the quadratic term.
Effect Score LR p padj df ΔR2 f2 BF01 BF10
Sleep delta (overall) STM 4.38 0.112 1.000 2 0.000 0.000 >1000 <0.001Reasoning 8.72 0.013 0.182 2 0.001 0.001 139.102 0.007Verbal 8.62 0.013 0.192 2 0.001 0.001 146.204 0.007Overall 21.23 0.000 <0.001* 2 0.001 0.002 0.267 3.739
Sleep delta2 STM 4.01 0.045 0.644 1 0.000 0.000 14.023 0.071Reasoning 8.72 0.003 0.045* 1 0.001 0.001 1.335 0.749Verbal 8.43 0.004 0.053 1 0.001 0.001 1.543 0.648Overall 21.23 0.000 <0.001* 1 0.001 0.002 0.003 390.151
Sleep delta × typical sleep duration STM 14.54 0.006 0.082 4 0.001 0.001 >1000 <0.001Reasoning 11.53 0.021 0.303 4 0.001 0.001 >1000 <0.001Verbal 8.72 0.069 0.979 4 0.001 0.001 >1000 <0.001Overall 25.63 0.000 0.001* 4 0.002 0.002 321.522 0.003
padj = adjusted p-value, f2 = Cohen’s f2 effect size statistic, df = degrees of freedom. Each row shows the results of a LR test that compared, for each score, the full
regression model to a nested model that did not include regressors for the effect of interest.
*Significant effects corrected for multiple comparisons (N = 14.27 effective comparisons). Also shown are the corresponding Bayes factors in favor of the null (BF01)
and alternative hypotheses (BF10).
8 | SLEEPJ, 2018, Vol. 41, No. 12D
ownloaded from
https://academic.oup.com
/sleep/article-abstract/41/12/zsy182/5096067 by University of W
estern Ontario user on 20 January 2020

those observed in studies of acute and total SD demonstrates that different kinds of sleep disruption affect different high-level cognitive systems, and highlights the importance of distin-guishing between acute/total SD, versus everyday sleep patterns that might—for many people—resemble prolonged periods of restricted sleep.
Supporting this idea, we also found some evidence that a single night’s sleep can affect cognition. In terms of overall per-formance, participants who, on the night before testing, slept more than their usual performed better than those who main-tained their norm. A similar pattern has been reported previ-ously [37], but the current results demonstrate that this “sleep delta” affords a benefit or disadvantage depending on whether the change was towards or away from the optimal amount of sleep. These results are consistent with the idea of a “sleep debt,” in that impairment begins to build up after a single night of restricted sleep (i.e. deviating from the optimal), and that cog-nition begins to recover as sleep duration returns to normal [4]. This suggests that people who have chronically too little or too much sleep might see a cognitive improvement with as little as one night of better sleep, whereas one night of poor sleep might well negatively impact a typically “good” sleeper.
While the relationship between too little sleep and cognitive impairment is perhaps unsurprising, it is less clear why too much sleep would produce a similar deficit. A negative effect of nightly sleep in excess of 8 hours is consistent with other similar cross-sectional studies [11–15], and is often attributed to known cor-relates of long sleep duration such as depression, failing health, increased morbidity risk, and decreased physical fitness [38–40]. However, we controlled for self-reports of depressive episodes in our analysis, and there is no obvious reason why other such fac-tors would affect specific cognitive domains, and not just overall cognitive performance (i.e. the interaction helps rule out factors that would be expected to affect performance on all tests). A more interesting interpretation is that impaired cognition seen in long sleepers is actually driven by too much sleep; for example, longer sleep is associated with longer and more intense sleep inertia [41], which has been shown to produce impairments in high-level cognitive domains, like decision making [42]. Future work could investigate how cognition varies as a function of sleep duration, wake time, and the amount of time between waking and testing.
The wide age range of our sample allowed us to test whether the relationship between reported sleep duration and cognitive performance varied as a function of age, but we found no evi-dence for such an interaction. In fact, the data were strongly in favor of the null hypothesis—that the shape and location of the inverted-U association is constant across the lifespan. Put simply, the amount of sleep that results in optimal cognitive performance (7–8 hours), and the impact of deviating from this amount, was the same for everyone—regardless of age. Somewhat counter-intui-tively, this implies that older adults who slept more or less than the optimal amount were impacted no more than younger adults who had non-optimal sleep. If sleep is especially important for staving off dementia and age-related cognitive decline [17], then one might predict that a lack of sleep (or too much sleep) would be associated with more pronounced cognitive impairment in the elderly than in younger adults. Nonetheless, given that 7–8 hours of sleep was associated with optimal cognition for all ages and that increasing age was associated with less sleep, older populations in general would likely benefit from more sleep. The age-invariant relationship between sleep and cognition that we observed is consistent with another recent large-scale study [43], that found a negative association between sleep and general cog-nitive performance, but little evidence that the effect depended on age. As far as we know, these are the only two reports that examine the interaction of sleep, cognition, and age within the same study. By far, most studies of the relationship between sleep duration and cognition focus on middle-aged to older popula-tions [8, 12, 13, 15, 37, 44], yet our finding that 7–8 hours of sleep was associated with optimal cognitive performance is consistent with all of them. One caveat to this conclusion is that our analysis may not have been sensitive to a difference in more senior par-ticipants because: (1) the number of volunteers over the age of 70 was low (N = 269) and (2) the interaction model assumed that the parameters of the quadratic curve would vary smoothly with age, whereas there could be a more sudden change in this relation-ship during early and later stages of life. We also cannot conclude that these results apply to children and adolescents, given that they were not included in the study.
There are additional limitations of this study that are com-mon to such large-scale investigations. First, a cross-sectional approach cannot truly establish a causal relationship between
−6 −4 −2 0 2 4 6
Sleep Delta (hours)
−1.0
−0.8
−0.6
−0.4
−0.2
0.0
0.2Sc
ore
(SD
s)
A) Reasoning
−6 −4 −2 0 2 4 6
Sleep Delta (hours)
B) Overall
Figure 5. Predicted (A) Reasoning and (B) Overall performance as a function of “sleep delta”—the amount of sleep the night prior to testing minus the typical amount of
sleep. Shaded regions above and below the curve depict 95% confidence intervals. The x-coordinate of the peak of the curve is indicated with a vertical line, and shaded
regions to either side indicate 95% confidence intervals on the location of this optimum.
Wild et al. | 9D
ownloaded from
https://academic.oup.com
/sleep/article-abstract/41/12/zsy182/5096067 by University of W
estern Ontario user on 20 January 2020

sleep duration and cognitive performance in different domains, and while we attempted to control for obvious confounds like age, gender, education, and levels of anxiety and depression, it is possible that there is some other unmeasured confound-ing variable driving the apparent relationship. However, as we described earlier, the significant interaction pattern allows us to rule out explanations that would be expected to affect cogni-tion across all domains, such as age or long-term psychotropic drug use [45]. The current results warrant further investigation, perhaps harnessing a large-scale within-subjects experimental design. A second potential limitation is that our primary meas-ures of sleep duration relied entirely on subjective self-report. Validation studies that have compared subjective to objective measures of average sleep duration have found that they were moderately correlated [46, 47], that people tended to over-report how much they actually slept, and that over-report was greater for people who actually slept less [47]. If this were the case in our study, then our results would slightly overestimate the size of the sleep-related effect on cognition and the optimal amount of sleep. It has also been suggested [48] that self-reports of sleep duration are most unreliable for very low and high reported amounts of sleep (i.e. “in the tails”); one reason may be that mental health factors might be associated with very high or low (and inaccurate) estimates of sleep duration [39, 49, 50]. Hence, cognitive impairments due to these factors would give rise to an apparent inverted U-shaped association with reported sleep duration. However, we attempted to control for mental health problems, and, critically, a supplementary analysis that removed the “tails” of the reported sleep duration (i.e. included only par-ticipants within 1.5 SDs of the mean) yielded similar results.
In conclusion, we have demonstrated that cognitive perfor-mance is associated with a self-reported measure of average nightly sleep duration, but the pattern of this association is dif-ferent across specific cognitive domains. Reasoning and verbal ability exhibited a reliable inverted-U shaped relationship with this measure of sleep, such that the optimal amount of sleep was found between 7 and 8 hours and worse performance was associated with more or less sleep than this amount; this pat-tern was different for short-term memory performance, which exhibited no association at all. Interestingly, the average amount of sleep reported by our population was less than 7 hours and those that slept slightly more than their usual amount the night before testing performed better, suggesting that many of us might benefit from a single night’s good sleep of 7–8 hours. These findings have significant real-world implications, because many people, including those in positions of responsibility, operate on very little sleep and hence may suffer from impaired reasoning, problem-solving, and communications skills on a daily basis. The scale of this work paves the way for continuing investigations into how day-to-day sleep patterns, and varia-tions in sleep, affect high-level cognitive functioning in the gen-eral population.
Supplementary MaterialSupplementary material is available at SLEEP online.
FundingThis research was funded by a Canada Excellence Research Chair (CERC) program grant (#215063) to A.M.O.
Conflict of interest statement. As the creator of the Cambridge Brain Sciences platform, A.M.O. owns shares in Cambridge Brain Sciences Inc, which markets the tests for commercial purposes. C.J.W. and M.E.B. own minor shares in Cambridge Brain Sciences Inc. In line with the existing free licensing agreement between Cambridge Brain Sciences Inc and the University of Western Ontario, no person, nor organization received any financial remuneration for the use of these tests in this research study.
References1. Irwin MR. Why sleep is important for health: a psy-
choneuroimmunology perspective. Annu Rev Psychol. 2015;66(1):143–172.
2. Buysse DJ. Sleep health: can we define it? Does it matter? Sleep. 2014;37(1):9–17.
3. Ford ES, et al. Trends in self-reported sleep duration among US adults from 1985 to 2012. Sleep. 2015;38(5):829–832.
4. Banks S, et al. Behavioral and physiological consequences of sleep restriction. J Clin Sleep Med. 2007;3(5):519–528.
5. Krause AJ, et al. The sleep-deprived human brain. Nat Rev Neurosci. 2017;18(7):404–418.
6. Hafner M, et al. Why sleep matters – the economic costs of insufficient sleep A cross-country comparative analysis. Rand Heal Q. 2017; 6(4): 11.
7. Lim J, et al. A meta-analysis of the impact of short-term sleep deprivation on cognitive variables. Psychol Bull. 2010;136(3):375–389.
8. Killgore WDS. Effects of sleep deprivation on cognition. Prog Brain Res. 2010;185(C):105–129.
9. Alhola P, et al. Sleep deprivation: impact on cognitive per-formance. Neuropsychiatr Dis Treat. 2007;3(5):553–567.
10. Goel N, et al. Neurocognitive consequences of sleep depri-vation. Semin Neurol. 2009;29(4):320–339.
11. Kronholm E, et al. Self-reported sleep duration and cog-nitive functioning in the general population. J Sleep Res. 2009;18(4):436–446.
12. Ramos AR, et al. Association between sleep duration and the mini-mental score: the Northern Manhattan study. J Clin Sleep Med. 2013;9(7):669–673.
13. Devore EE, et al. Sleep duration in midlife and later life in relation to cognition. J Am Geriatr Soc. 2014;62(6):1073–1081.
14. Faubel R, et al. Usual sleep duration and cognitive function in older adults in Spain. J Sleep Res. 2009;18(4):427–435.
15. Ferrie JE, et al. Change in sleep duration and cognitive function: findings from the Whitehall II Study. Sleep. 2011;34(5):565–573.
16. Ohayon MM, et al. Meta-analysis of quantitative sleep parameters from childhood to old age in healthy individu-als: developing normative sleep values across the human lifespan. Sleep. 2004;27(7):1255–1273.
17. Yaffe K, et al. Connections between sleep and cognition in older adults. Lancet Neurol. 2014;13(10):1017–1028.
18. Hirshkowitz M, et al. National Sleep Foundation’s updated sleep duration recommendations: final report. Sleep Health. 2015;1(4):233–243.
19. Owen AM, et al. Planning and spatial working memory following frontal lobe lesions in man. Neuropsychologia. 1990;28(10):1021–1034.
20. Owen AM, et al. Extra-dimensional versus intra-dimensional set shifting performance following frontal lobe excisions, temporal lobe excisions or amygdalo-hippocampectomy in man. Neuropsychologia. 1991;29(10):993–1006.
10 | SLEEPJ, 2018, Vol. 41, No. 12D
ownloaded from
https://academic.oup.com
/sleep/article-abstract/41/12/zsy182/5096067 by University of W
estern Ontario user on 20 January 2020

21. Owen AM, et al. Visuospatial memory deficits at dif-ferent stages of Parkinson’s disease. Neuropsychologia. 1993;31(7):627–644.
22. Owen AM, et al. Fronto-striatal cognitive deficits at different stages of Parkinson’s disease. Brain. 1992;115(Pt 6):1727–1751.
23. Lange KW, et al. L-dopa withdrawal in Parkinson’s disease selectively impairs cognitive performance in tests sensi-tive to frontal lobe dysfunction. Psychopharmacology (Berl). 1992;107(2-3):394–404.
24. Mehta MA, et al. Methylphenidate enhances working mem-ory by modulating discrete frontal and parietal lobe regions in the human brain. J Neurosci. 2000;20(6):RC65.
25. Owen AM, et al. Planning and spatial working memory: a positron emission tomography study in humans. Eur J Neurosci. 1996;8(2):353–364.
26. Owen AM, et al. Evidence for a two-stage model of spatial working memory processing within the lateral frontal cor-tex: a positron emission tomography study. Cereb Cortex. 1996;6(1):31–38.
27. Owen AM, et al. Abnormal basal ganglia outflow in Parkinson’s disease identified with PET. Implications for higher cortical functions. Brain. 1998;121 (Pt 5):949–965.
28. Williams-Gray CH, et al. Catechol O-methyltransferase Val158Met genotype influences frontoparietal activity dur-ing planning in patients with Parkinson’s disease. J Neurosci. 2007;27(18):4832–4838.
29. Hampshire A, et al. Fractionating human intelligence. Neuron. 2012;76(6):1225–1237.
30. Selya AS, et al. A practical guide to calculating Cohen’s f 2, a measure of local effect size, from PROC MIXED. Front Psychol. 2012;3(APR):1–6.
31. Nyholt DR. A simple correction for multiple testing for sin-gle-nucleotide polymorphisms in linkage disequilibrium with each other. Am J Hum Genet. 2004;74(4):765–769.
32. Lin M, et al. Too big to fail: large samples and the p-value problem. Inf Syst Res. 2013;24(4):906–917.
33. Wagenmakers EJ. A practical solution to the pervasive prob-lems of p values. Psychon Bull Rev. 2007;14(5):779–804.
34. Vrieze SI. Model selection and psychological theory: a dis-cussion of the differences between the Akaike information criterion (AIC) and the Bayesian information criterion (BIC). Psychol Methods. 2012;17(2):228–243.
35. Fieller EC. The distribution of the index in a normal bivari-ate population. Biometrika. 1932;24(3):428–440.
36. Pilcher JJ, et al. Effects of sleep deprivation on performance: a meta-analysis. Sleep. 1996;19(4):318–326.
37. Gamaldo AA, et al. Exploring the within-person coupling of sleep and cognition in older African Americans. Psychol Aging. 2010;25(4):851–857.
38. Stranges S, et al. Correlates of short and long sleep dura-tion: a cross-cultural comparison between the United Kingdom and the United States: the Whitehall II Study and the Western New York Health Study. Am J Epidemiol. 2008;168(12):1353–1364.
39. Patel SR, et al. Correlates of long sleep duration. Sleep. 2006;29(7):881–889.
40. Grandner MA, et al. Who are the long sleepers? Towards an understanding of the mortality relationship. Sleep Med Rev. 2007;11(5):341–360.
41. Rogers NL, et al. Sleep, waking and neurobehavioural per-formance. Front Biosci. 2003;8:s1056–s1067.
42. Bruck D, et al. The effects of sleep inertia on decision-mak-ing performance. J Sleep Res. 1999;8(2):95–103.
43. Gadie A, et al. How are age-related difference in sleep qual-ity associated with health outcomes? An epidemiologi-cal investigation in a UK cohort of 2406 adults. BMJ open. 2017;7(7):e014920.
44. Loerbroks A, et al. Nocturnal sleep duration and cognitive impairment in a population-based study of older adults. Int J Geriatr Psychiatry. 2010;25(1):100–109.
45. Barker MJ, et al. Cognitive effects of long-term benzo-diazepine use: a meta-analysis. CNS Drugs. 2004;18(1): 37–48.
46. O’Donnell D, et al. Comparison of subjective and objective assessments of sleep in healthy older subjects without sleep complaints. J Sleep Res. 2009;18(2):254–263.
47. Lauderdale DS, et al. Self-reported and measured sleep duration: how similar are they? Epidemiology. 2008;19(6):838–845.
48. Bliwise DL, et al. The parable of parabola: what the U-shaped curve can and cannot tell us about sleep. Sleep. 2007;30(12):1614–1615.
49. Rotenberg VS, et al. The relationship between subjective sleep estimation and objective sleep variables in depressed patients. Int J Psychophysiol. 2000;37(3):291–297.
50. Tamakoshi A, et al.; JACC Study Group. Self-reported sleep duration as a predictor of all-cause mortality: results from the JACC study, Japan. Sleep. 2004;27(1):51–54.
Wild et al. | 11D
ownloaded from
https://academic.oup.com
/sleep/article-abstract/41/12/zsy182/5096067 by University of W
estern Ontario user on 20 January 2020

![[Nelson 2003] dissociable neural mechanisms underlying response based and familiarity-based conflict](https://img.pdfslide.net/doc/110x75/55ca3956bb61ebc7748b472b/nelson-2003-dissociable-neural-mechanisms-underlying-response-based-and-familiarity-based.jpg)