Embed Size (px)
Citation preview

1
Dissolution and precipitation during flow in porous media
Gry Andrup-HenriksenFall 2006
Class project for GEOS 692:Transport processes and physical properties of rocks
1/25

2
Outline
• Introduction
• Theoretical study + simulation:
• Microscopic simulation of dissolution:
• Mantle
• Equations at and above the Darcy scale→ smoothly varying porosity and permeability (Aharonov et al., 1997a)
• Lattice-Boltzmann technique(Szymczak et al., 2004)
2/25

3
Introduction• Fluid flow coupled with chemical reactions ⇒ long range interactions, disequilibrium and change in solid geometry
• Influence flow patterns and chemistry within the mantle
• Diffusive porous flow unstable along adiabatic PT gradient⇒ formation of channels
• Formation of dikes
• Dissolution channels observed as dunites (cm – 100m scale)
• Dunites are formed by constant replacement of peridotite as a result of dissolution of pyroxene + crystallization of olivine in a liquid migration by porous flow through mantle
(Kelemen et al., 1995)3/25
4
Theoretical study
Based on: • Conservation of mass
• Darcy’s law
• Single component system
• Densities s, f constant
• Linear gradient of solubility
• Dispersion/diffusion coefficient equal in all directions
Assumptions:
4/25
5
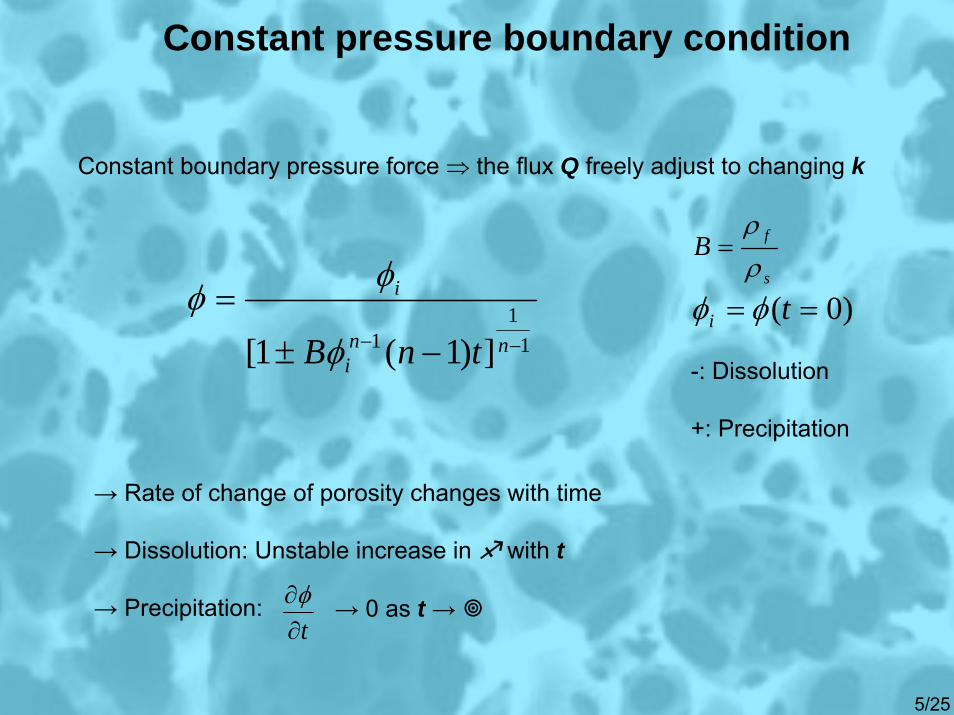
Constant pressure boundary condition
Constant boundary pressure force ⇒ the flux Q freely adjust to changing k
-: Dissolution
+: Precipitation
→ Rate of change of porosity changes with time
→ Dissolution: Unstable increase in with t
→ Precipitation: → 0 as t →
11
1 ])1(1[ −− −±=
nni
i
tnBφ
φφ
s
fBρρ
=
)0( == ti φφ
t∂∂φ
5/25
6
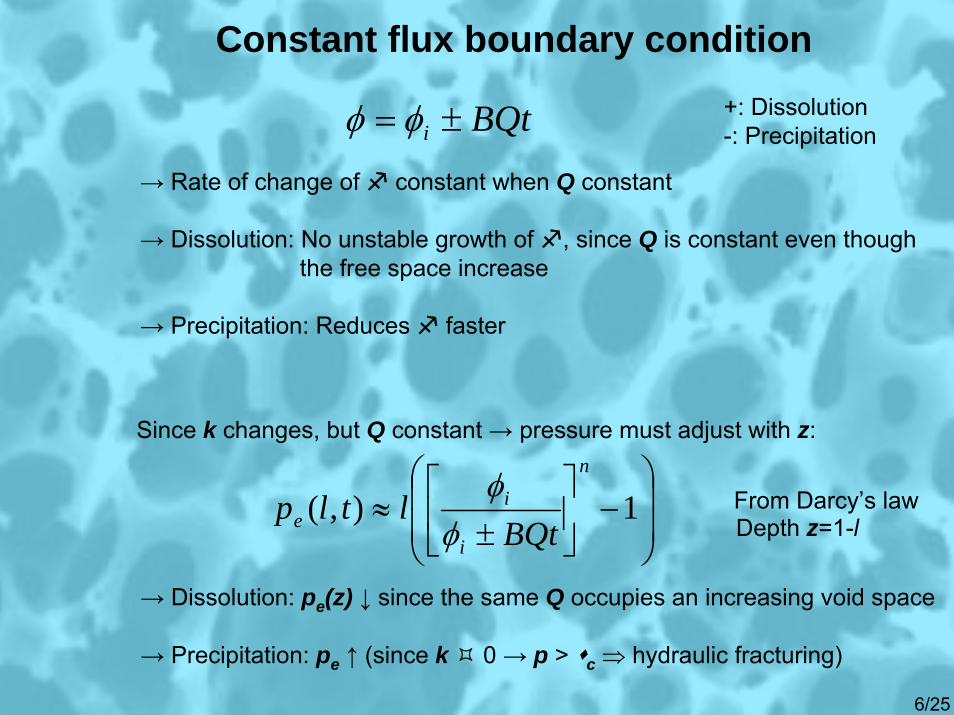
Constant flux boundary condition
→ Rate of change of constant when Q constant
→ Dissolution: No unstable growth of , since Q is constant even though the free space increase
→ Precipitation: Reduces faster
Since k changes, but Q constant → pressure must adjust with z:
From Darcy’s lawDepth z=1-l
+: Dissolution-: Precipitation
→ Dissolution: pe(z) ↓ since the same Q occupies an increasing void space
→ Precipitation: pe ↑ (since k 0 → p > c ⇒ hydraulic fracturing)
BQti ±= φφ
⎟⎟
⎠
⎞
⎜⎜
⎝
⎛−⎥
⎦
⎤⎢⎣
⎡±
≈ 1),(n
i
ie BQt
ltlpφ
φ
6/25

7
Controlling parameters
Damkhöler number:
Ration between the size of the system L and the chemical equilibrium length Leq:
Peclet number:
Ratio between rate of transport by combined diffusion and dispersion to rate of transport by advection.
eqLLDa =
DLPe 0ω=
0: characteristic fluid velocity
D: diffusion/dispersion coefficient
7/25
8
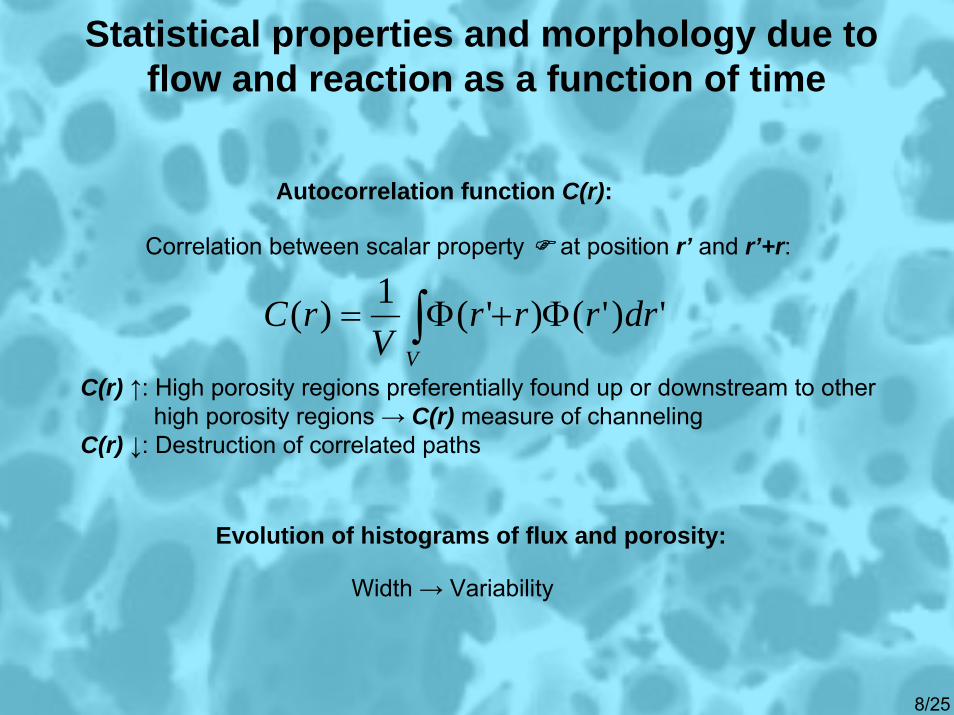
Statistical properties and morphology due to flow and reaction as a function of time
Autocorrelation function C(r):
C(r) ↑: High porosity regions preferentially found up or downstream to other high porosity regions → C(r) measure of channeling
C(r) ↓: Destruction of correlated paths
Correlation between scalar property at position r’ and r’+r:
Evolution of histograms of flux and porosity:
Width → Variability
∫ Φ+Φ=V
drrrrV
rC ')'()'(1)(
8/25
9
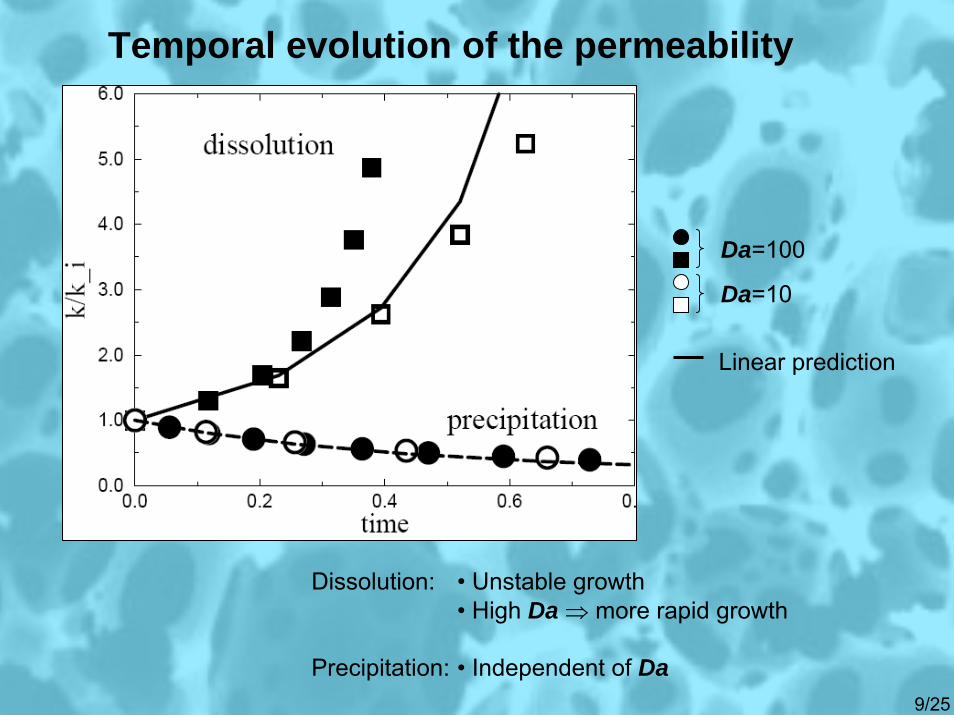
Temporal evolution of the permeability
Da=100
Da=10
Linear prediction
Dissolution:
Precipitation:
• Unstable growth• High Da ⇒ more rapid growth
• Independent of Da9/25

10
3D isosurface of Q for dissolution
• Elongated permeability structures parallel to flow direction
• k0 > <k0> ⇒ flux ↑⇒ dissolution ↑⇒ positive feedback
Main flow direction
t=0.4Da=100Pe=200
10/25
11
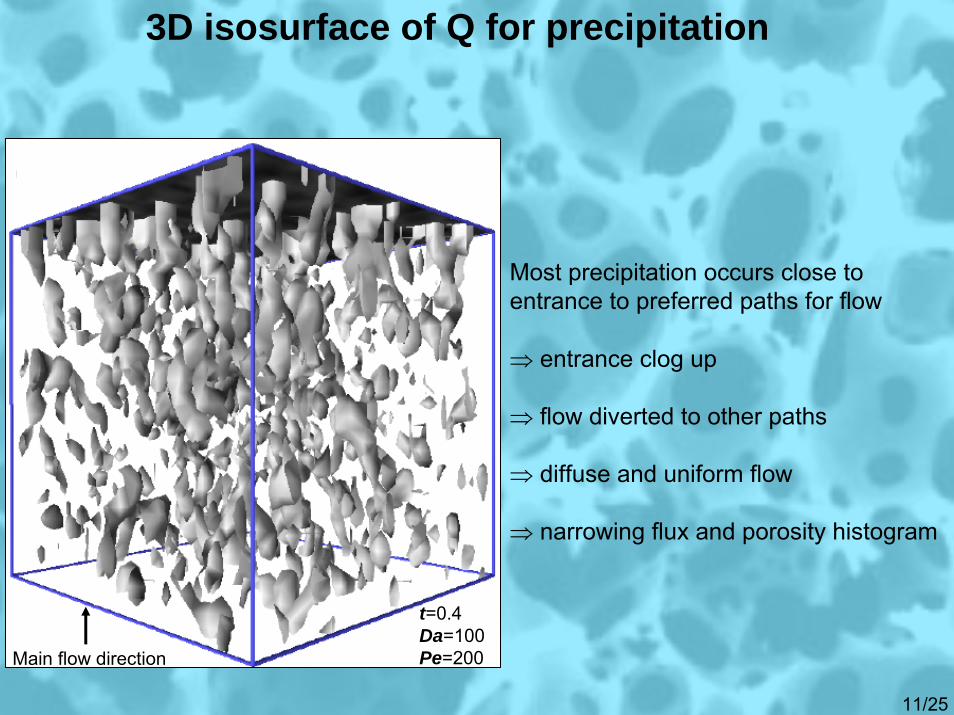
3D isosurface of Q for precipitation
t=0.4Da=100Pe=200
Most precipitation occurs close to entrance to preferred paths for flow
⇒ entrance clog up
⇒ flow diverted to other paths
⇒ diffuse and uniform flow
⇒ narrowing flux and porosity histogram
Main flow direction
11/25

12
Histograms of flux and porosity
+ Precipitation
Dissolution
- Initial random configuration for dissolution
• Dissolution: Variability in Q ↑
• Precipitation: smoothing effect
• Change in variability in smaller,but same characteristics as for Q
Initial=
12/25

13
Histogram of correlation function of porosity
• Dissolution: C(r) || to flow direction , - consistent with elongated channel formation
• Precipitation: C(r) || to flow direction , ~ overlapping the random initial correlations
+ PrecipitationDissolution
- Initial random configuration for dissolution
Initial=
13/25

14
Porosity correlation function along flow direction at a given lag of 1/6 for dissolution
• Da=100 ⇒ unstable growth of C
• Da ↓⇒ channels growth
• Da=5: Pe=200: C ↑, but not unstable growth
Pe=10: No increase → uniform
14/25
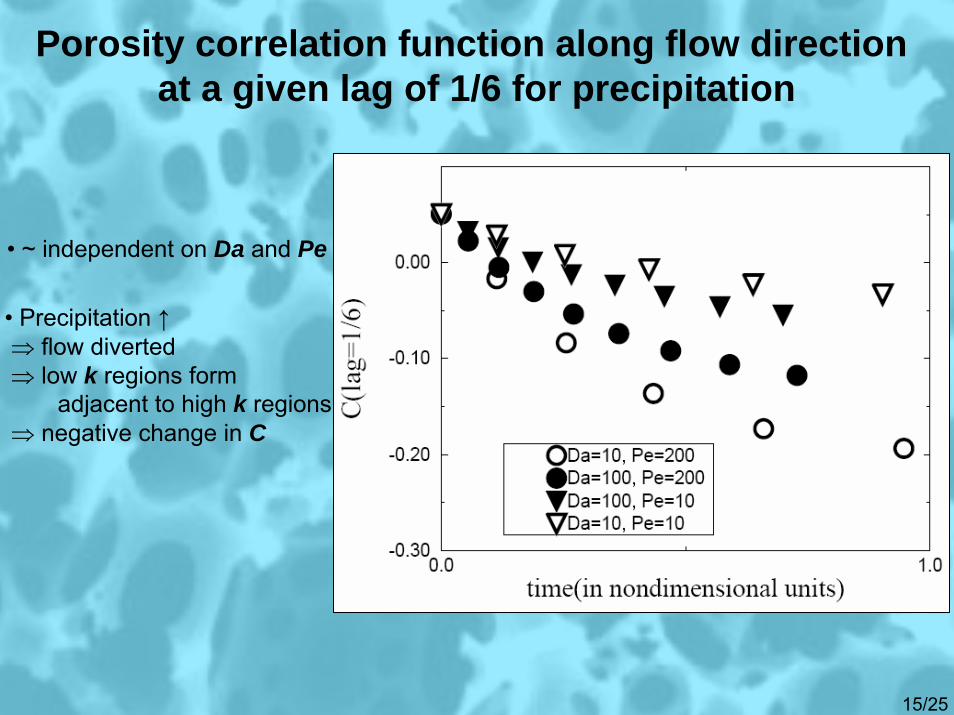
15
Porosity correlation function along flow direction at a given lag of 1/6 for precipitation
• Precipitation ↑⇒ flow diverted ⇒ low k regions form
adjacent to high k regions⇒ negative change in C
• ~ independent on Da and Pe
15/25

16
Porosity profile over transition zone
Initial
average over x and yt=0.5
Precipitation
Dissolution
• Difference between dissolving and precipitation regions ↑ with time
16/25

17
Excess pressure profile for transition zone
Precipitation
Dissolution
• Overpressure ↑ close to transition
• Difference between dissolving and precipitation regions ↑ with time
t=0.5
17/25

18
Dissolution
• Elongated channels in flow direction
• Depends strongly on Da and Pe
• Channels form for Da >> 1
• Channel growth for Da
• Unstable growth of permeability
• Minor increase in correlation perpendicular to flow ⇒ matrix anisotropic
• Pe ↓⇒ width of channels ↑, spacing between channels ↑, channel growth rate ↓
18/25
19
Precipitation
• Permeability ↓ with time
• Rate of decrease ↓ with time
• Increasing uniform flow with time
• No significant difference for different Da and Pe
19/25
20
Transition zone• Monotonically increasing overpressure
• Permeability ↓in precipitation region ⇒ overpressure ↑
• Overpressure ↑ until >strength of porous matrix → fractures
System• Da and Pe are the controlling parameters in a coupled flow and reaction system
• Da and Pe depend on system size
• The evolution of the system is highly dependent on boundary conditions (constant flux/pressure)
20/25

21
Limitations and improvements
• Dissolution and precipitation differ only by sign and are reversible in the model
• Only looked at single mineral component and fluid component
• Need a better description of porosity-permeability relation and microscopic distribution of precipitation
• Need to consider compaction of solid phase
21/25
22
Microscopic numerical simulation of dissolution(Szymczak et al., 2004)
• Stokes flow
• Lattice-Boltzmann with continuous bounce back at solid-fluid boundaries
• Transport of dissolved species in pore spaces is modeled by an innovative random walk algorithm that incorporates chemical reactions at pore surface
22/25

23
Iteration: 0
Iteration: 8
Iteration: 16
Iteration: 24
Iteration: 32
Iteration: 40 23/25
Results for Da=0.1 Pe=10
24
Mantle(Aharonov et al., 1995 + Kelemen et al., 1995)
• Potentially existing channeling instability in Earth’s upper mantle:Melt ↑⇒ decompression ⇒ dissolution ↑⇒ pertubation in porosity ⇒ flow ↑⇒ dissolution ↑⇒ porosity ↑
Positive feedback
• Development of low porosity cap overlying high porosity conduits ⇒ hydrostatic overpressure ↑⇒ fracture and magma transport to surface in dikes
24/25

25
References
• Aharonov, E., Spiegelman, M., 1997a, Three-dimensional flow and reaction in porous media: Implications for the Earth’s mantle and sedimentary basins: Journal of Geophysical Research, v. 102, p. 14,821-14,834.
• Aharonov, E. , Rothman, D.H., Thompson, A.H., 1997b, Transport properties and diagenesis in sedimentary rocks: The role of micro-scale geometry: Geology, v. 25, no. 6, p. 547-550.
• Aharonov, E., Whitehead, J., Kelemen, P. B., Spiegelman, M., 1995, Channeling instability of upwelling melt in the mantle, J. Geophys. Res., 100, 20,433–20,450
• Kelemen, P., J. Whitehead, E. Aharonov, and K. Jordahl, 1995, Experiments on flow focusing in soluble porous media with applications to melt extraction from the mantle, J. Geophys. Res., 100, 475–496
• Szymczak, P., Ladd, T., 2004, Microscopic simulation of the dissolution of rock fractures: XXI ICTAM, August 15-21, 2004, Warsaw, Poland
25/25
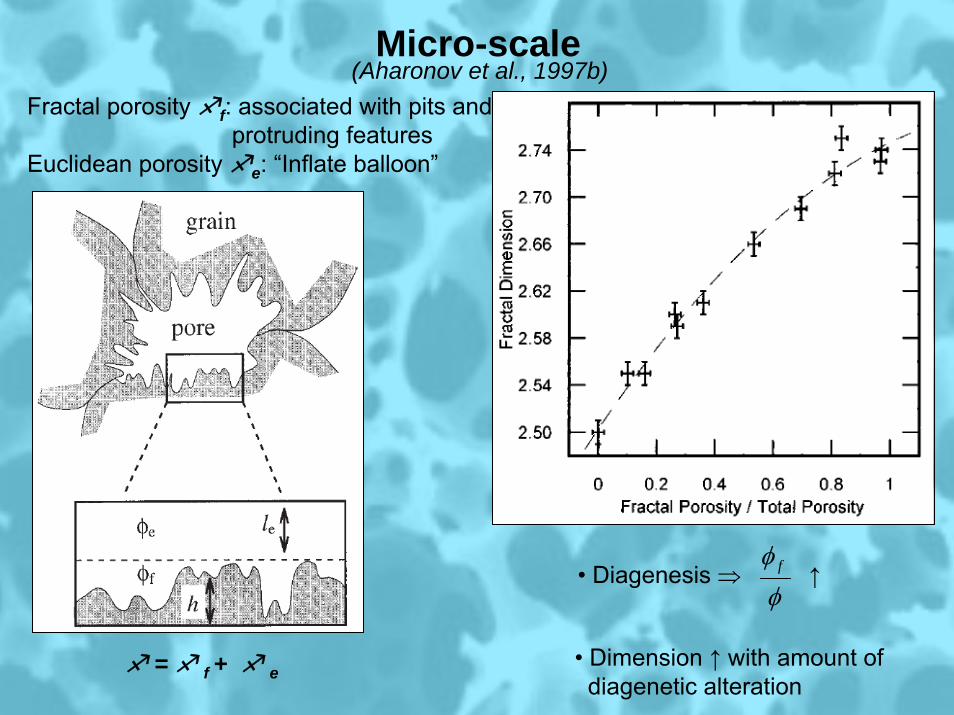
26= f + e
Fractal porosity f: associated with pits and protruding features
Euclidean porosity e: “Inflate balloon”
• Diagenesis ⇒ ↑
• Dimension ↑ with amount of diagenetic alteration
Micro-scale(Aharonov et al., 1997b)
φφ f
27
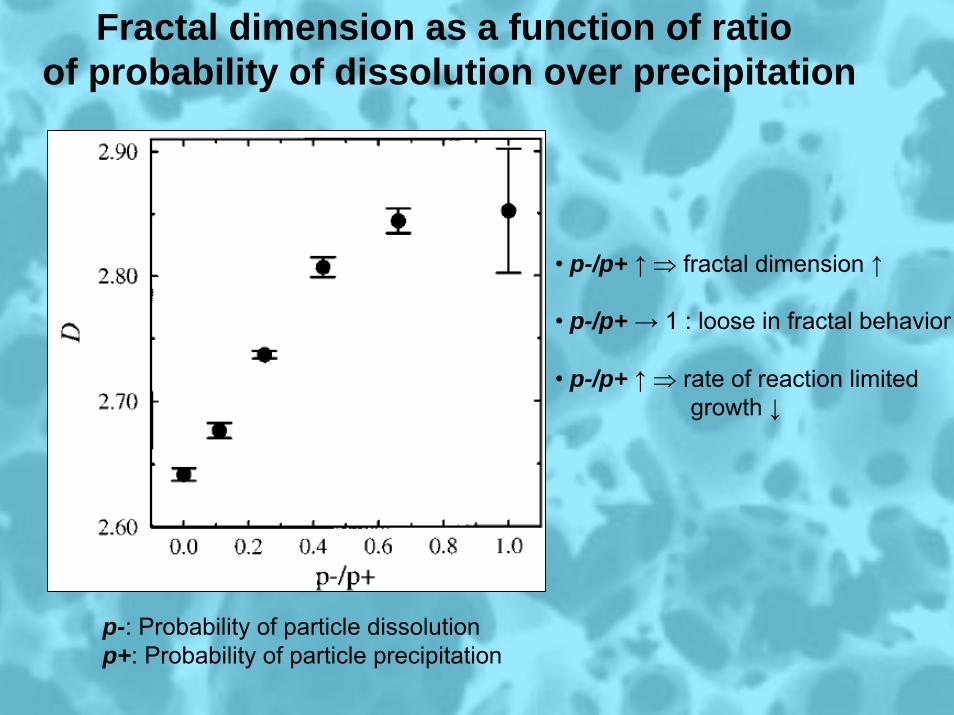
p-: Probability of particle dissolutionp+: Probability of particle precipitation
• p-/p+ ↑⇒ fractal dimension ↑
• p-/p+ → 1 : loose in fractal behavior
• p-/p+ ↑⇒ rate of reaction limited growth ↓
Fractal dimension as a function of ratio of probability of dissolution over precipitation
28
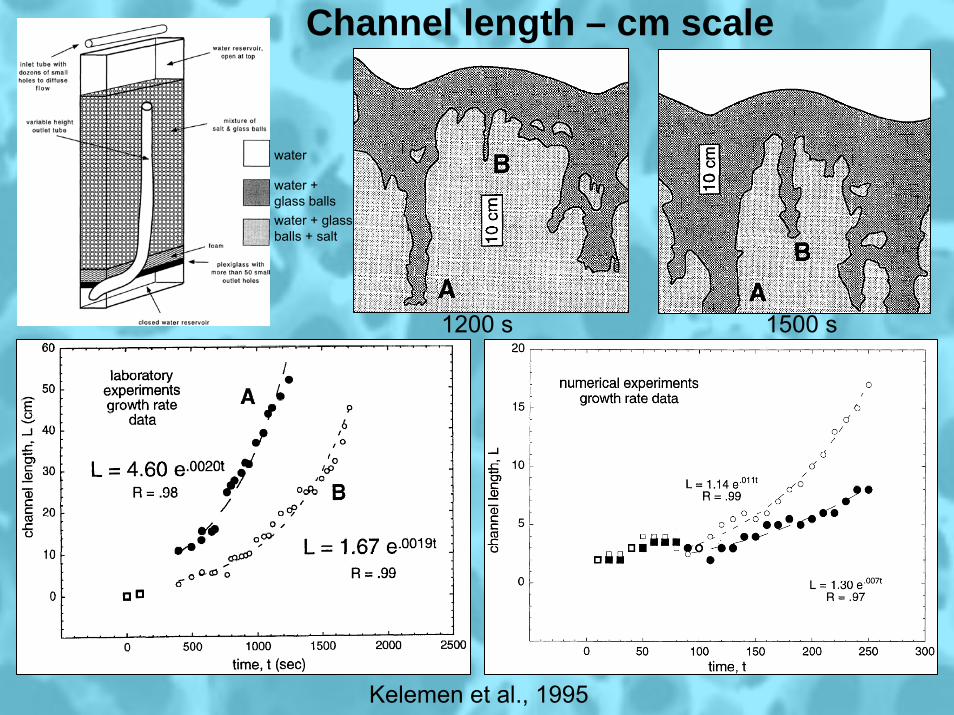
Channel length – cm scale
Kelemen et al., 1995
1200 s 1500 s
water
water +glass ballswater + glass balls + salt

29
Assumptions
• Single soluble component (cis=1) ⇒ Fluid phase: • Carrier fluid (1-ci) (no solid phase)
• Dissolved component (ci)
• Densities ρ s, ρ f constant
• Dispersion/diffusion coefficient D equal in all directions
• Specific surface area A constant
• Linear gradient of solubility
30
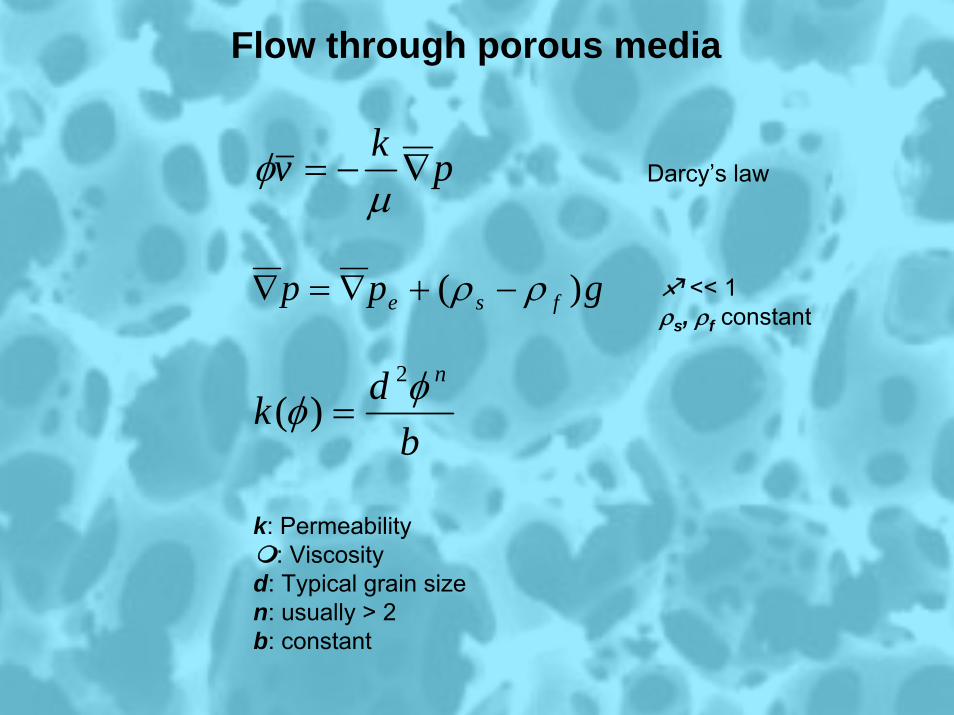
Flow through porous media
Darcy’s law
<< 1ρs, ρf constant
k: Permeability: Viscosity
d: Typical grain sizen: usually > 2b: constant
pkv ∇−=μ
φ
gpp fse )( ρρ −+∇=∇
bdk
nφφ2
)( =
31
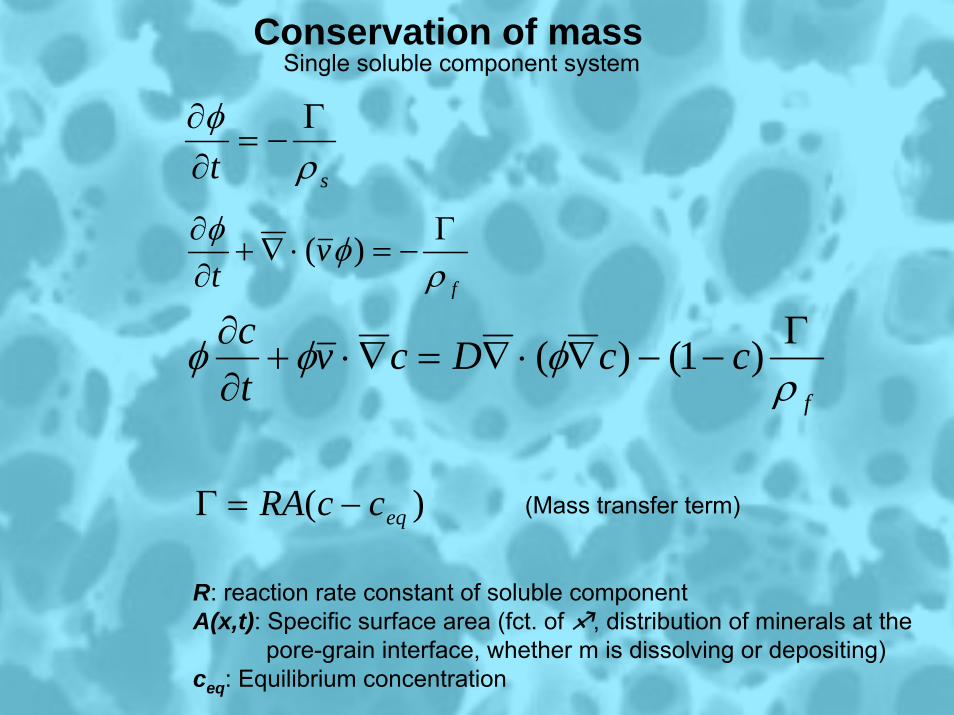
Conservation of massSingle soluble component system
(Mass transfer term)
R: reaction rate constant of soluble componentA(x,t): Specific surface area (fct. of , distribution of minerals at the
pore-grain interface, whether m is dissolving or depositing)ceq: Equilibrium concentration
st ρφ Γ
−=∂∂
f
vt ρ
φφ Γ−=⋅∇+
∂∂ )(
f
ccDcvtc
ρφφφ Γ
−−∇⋅∇=∇⋅+∂∂ )1()(
)( eqccRA −=Γ
32
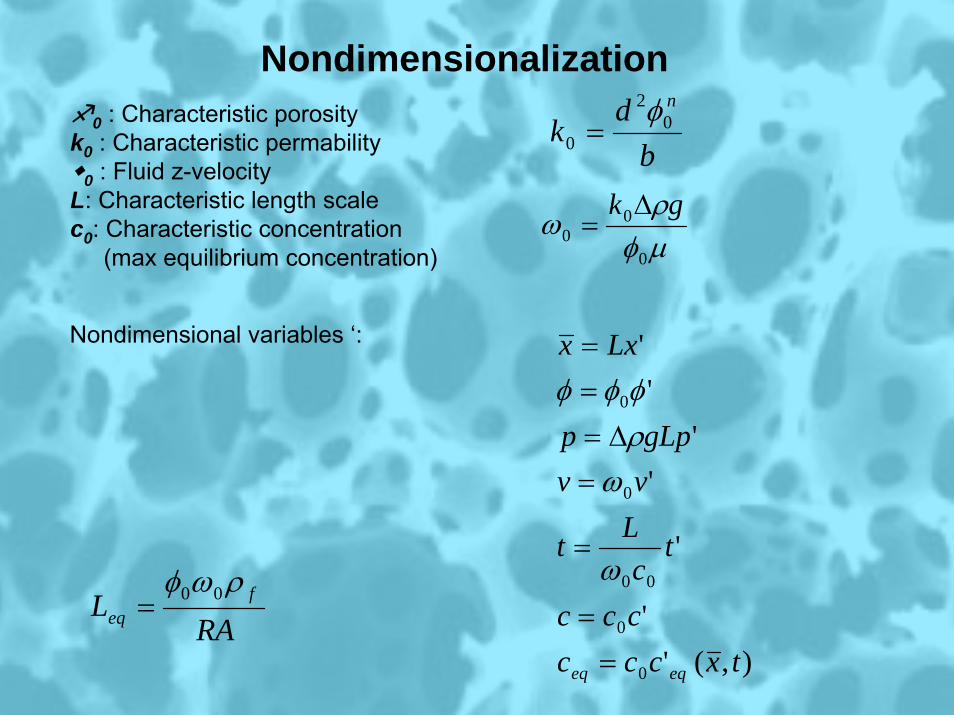
Nondimensionalization0 : Characteristic porosity
k0 : Characteristic permability0 : Fluid z-velocity
L: Characteristic length scalec0: Characteristic concentration
(max equilibrium concentration)
Nondimensional variables ‘:
bdk
n0
2
0φ
=
μφρ
ω0
00
gk Δ=
),(''
'
''
''
0
0
00
0
0
txcccccc
tc
Lt
vvgLpp
Lxx
eqeq ==
=
=Δ=
==
ω
ωρφφφ
RAL f
eq
ρωφ 00=
33
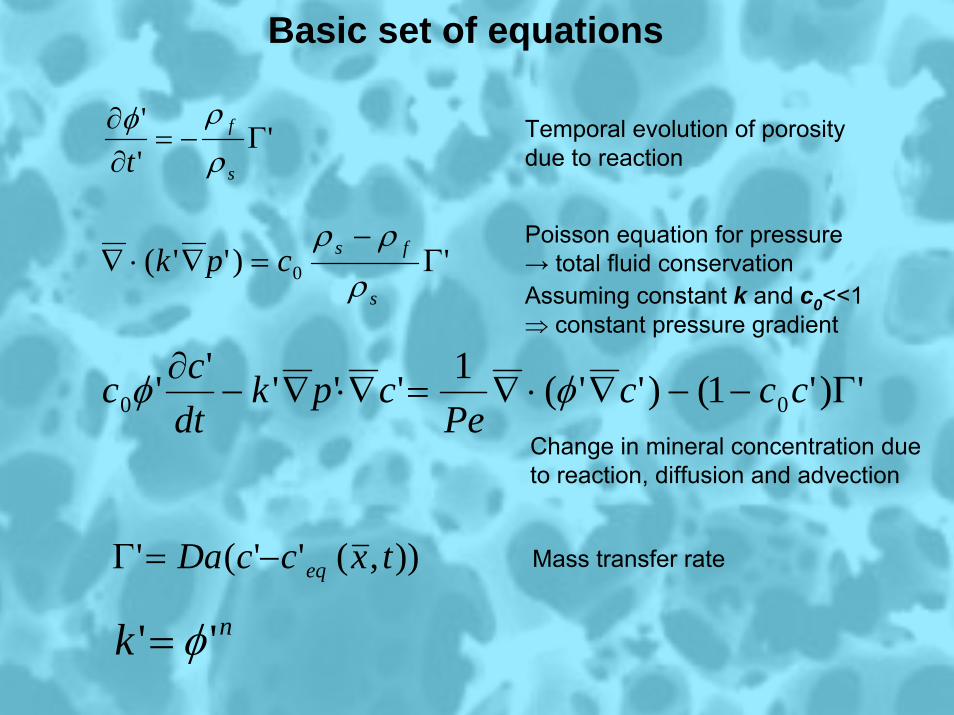
Basic set of equations
Temporal evolution of porosity due to reaction
Poisson equation for pressure → total fluid conservation
Change in mineral concentration due to reaction, diffusion and advection
Assuming constant k and c0<<1 ⇒ constant pressure gradient
Mass transfer rate
'''
Γ−=∂∂
s
f
t ρρφ
')''( 0 Γ−
=∇⋅∇s
fscpkρρρ
')'1()''(1''''' 00 Γ−−∇⋅∇=∇⋅∇−∂ ccc
Pecpk
dtcc φφ
)),(''(' txccDa eq−=Γ
nk '' φ=

34
Numerical experiment using modified relaxation Boltzmann Method
(Kelemen et al., 1995)
Saturation concentration of soluble material in fluid: Top: 0
Bottom: 0.05
Initial undersaturated fluid No solubility gradient
.constdzdp
=
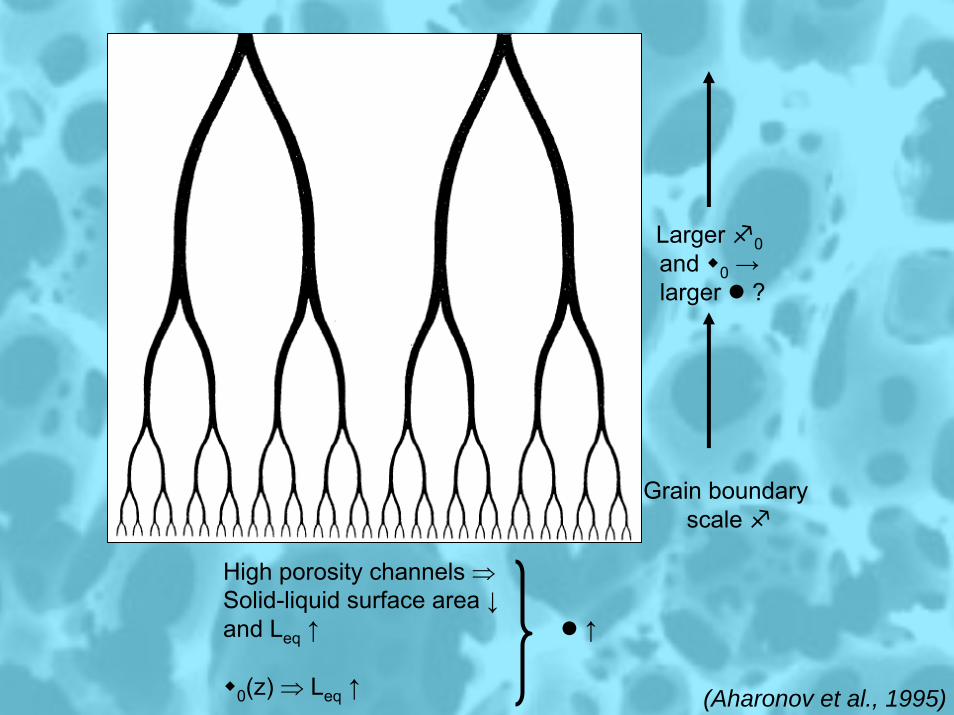
35
Larger 0and 0 →larger ?
Grain boundary scale
High porosity channels ⇒Solid-liquid surface area ↓and Leq ↑
0(z) ⇒ Leq ↑
↑
(Aharonov et al., 1995)

36
Conservation of massMulti component system
Total mass:
Each mineral component:
M: Mineral phasesim: Stoichiometric propotion of component i in mineral m.
Rm: Dissolution or precipitation rate ci: Mass fraction (Σici=1)
∑Γ=∂−∂
ii
s
t)1( φρ
∑Γ−=⋅∇+∂
∂
iif
f vt
)( φρφρ
isis
si
sis cD
tc
Γ−∇−⋅∇=∂−∂
])1([)1(
φρφρ
iififif cDv
tc
Γ−∇⋅∇=⋅∇+∂
∂][)( φρφρ
φρ
mimM
i Rν1Σ=Γ (Mass transfer term)

37
Mantle(Aharonov et al., 1997a)
• Modes of melt extraction from mantle may be controlled by whether melt partially dissolve the surroundings or crystallize during upwelling
• Flow through an increasing solubility gradient causes dissolution with negative mass transfer from rock to fluid
• Flow through decreasing solubility gradient causes precipitation
•Transition zone: • occurs near base of the conductively cooled lithosphere
• Where it occurs depends on advective heat transfere – not included in the model
• Calculations shows that advective heat transfere will not distort a regional steady state geotherm until channels << 0.1% of solid
• Speculations that melt will pond in sills within transition zone
• Increasing overpressure may lead to hydrofracturing
• Precipitation faster in fractures than matrix according to simulation, since fractures are highest permeability channels → healing → cycle (consistent with presence of dikes)

38
Mantle(Aharonov et al., 1995)

39
Mantle• Diffusive porous flow of melt may be unstable in regions in the upper mantle where liquid ascends along an adiabatic PT gradient (like MOR and hot spots)
• Dissolution channels are observed as replacive dunites (cm – 100m scale)
• Dunites are formed by constant replacement of peridotite as a result of dissolution of pyroxene + crystallization of olivine in a liquid migration by porous flow through mantle
(Kelemen et al., 1995)