Embed Size (px)
Citation preview
Pergamon Geochimica et Cosmochimica Acta, Vol. 61, No. 14, pp. 2879-2889, 1997
Copyright 0 1997 Elsevier Science Ltd Printed in the USA. All rights reserved
0016.7037/97 $17.00 + .OO
R A V D r F c c=T P [ ‘;’ ( ) t w
s” a
PI1 SOO16-7037( 97)00143-9
Dissolution kinetics of calcium carbonate minerals in H20-CO2 solutions in turbulent flow: The role of the diffusion boundary layer
and the slow reaction Hz0 + CO2 G H + + HCO;
ZAIHUA LIU ‘J and WOLFGANG DREYBRODT’.*
‘Institute of Experimental Physics, University of Bremen, D-28334 Bremen, Germany ZInstitute of Karst Geology, Guilin, China
(Received July 30, 1996; accepted in revised form March 24, 1997)
Abstract-Dissolution and precipitation of calcium carbonate minerals in aqueous solutions with turbu- lent flow are controlled by a diffusion boundary layer (DBL) adjacent to the surface of the mineral, across which mass transfer is effected by molecular diffusion. A rotating disk technique was used to investigate the effect of the DBL on the dissolution rates of CaC03. This technique allows an exact adjustment of the thickness of the DBL by controlling the rotation speed of a circular sample of CaC03. Measurements of the dissolution rates in H20-CO*-CaZt -solutions in equilibrium with various partial pressures of CO2 from 1. 10e3 up to 1 atm showed a dependence of the rates R on the rotation frequency w, given by R w wn. The exponent n varies from 0.25 at low PcO, to about 0.01 at a P,,, of 1 atm. This reveals that the rates are not controlled by mass transport only, which would require n = 0.5. The experimental data can be explained employing a theoretical model, which also takes into account the slow reaction CO2 + HZ0 f H’ + HCO, and the chemical reactions at the surface (Dreybrodt and Buhmann, 1991). Interpretation of the experimental data in view of this model reveals that conversion of CO1 plays an important role in the control of the rates. At high P,-,z and large DBL thickness (e > 0.001 cm), conversion of CO* occurs mainly in the DBL and, therefore, becomes rate limiting. This is corroborated by the observation that upon addition of the enzyme carbonic anhydrase, which catalyzes CO,-conversion, the dissolution rates are enhanced by 1 order of magnitude. From our experimental observations we conclude that the theoretical model above enables one to predict dissolution rates with satisfactory precision. Since the precipitation rates from supersaturated solutions are determined by the same mechanisms as dissolution, we infer that this model is also valid to predict precipitation rates. The predicted rates for both dissolution and precipitation can be approximated by a linear rate law R = (Y * ( ceq - c) , where C~ is the equilibrium concentration with respect to calcite and (Y a rate constant, dependent on temperature, Pcoz, DBL thickness (E), and the thickness of the water sheet flowing on the mineral. Values of cr are listed that can be used for a variety of geologically relevant conditions. Copyright 0 1997 Elsevier Science Ltd
NOTATION
dissolution rate mmole crnm2 S-I surface area of rotating disk cm* volume of the solution cm3 coefficient of diffusion cm’s_’ radius of rotating disk cm diffusional flux mmole cm-’ s-l concentration mmole cmm3 equilibrium concentration mmole cmm3 partial pressure of CO1 atm concentration mmole cm-3 activity mmole cme3 thickness of DBL cm angular velocity SC’ kinematic viscosity of water cm2 ss’ thickness of turbulent core cm rate constant cm ss’
1. INTRODUCTION
such as diagenesis of calcareous deep-sea sediments (Bemer, 1980; Boudreau and Canfield, 1993), the formation of karst in limestone terranes (Dreybrodt, 1988; Ford and Williams, 1989; White, 1988), the evolution of water chemistry in calcite depositing stream systems (Hermann and Lorah, 1987; Dreybrodt et al., 1992; Liu et al., 1995), and the global cycle of CO2 (Archer and Maier-Reimer, 1994; Kempe, 1977). Both the precipitation and the dissolution rates in the system HZO-C02-CaC03 are controlled by three rate de- termining processes: ( 1) The kinetics at the mineral surface, which is given by the mechanistic rate equation (called PWP equation) proposed for dissolution by Plummer et al. ( 1978) and which has later been verified also for precipitation (Bu- senberg and Plummer, 1986; Reddy et al., 1981; Inskeep and Bloom, 1985). This PWP-equation reads
R = K,(H+) + K~(H$O::)
Dissolution and precipitation of calcite in a CO? - HZ0 system play an important role in many geological processes,
*Author to whom correspondence should be addressed.
+ K3 - K4(CaL+) (HCO,) (1)
where the rate R is given in mmol cm-* s-’ ; and K, , K*, ~3,
and K~ are temperature dependent rate constants and the parentheses denote activities in mmole cmm3 of the corre- sponding species at the surface of the mineral; (2) The slow
2879
2880 Z. Liu and W. Dreybrodt
reaction Hz0 + CO* f H+ + HCOF exerts a significant influence on the rates because stochiometry requires that for each calcium ion released from the solid one CO* molecule must react to form H’ + HCO,. At large mineral surface areas and small volumes of the solution this slow reaction can be rate determining. Its kinetics has been reviewed by Kern ( 1960) and Usdowski ( 1982); (3) Mass transport of the reacting species away from and towards the mineral surface by molecular diffusion. Taking into account these three processes, Buhmann and Dreybrodt (1985a,b, 1987) put forward a model from which dissolution and precipita- tion rates can be calculated for a sheet of water of given thickness, covering the surface of the mineral. They have shown that due to CO, conversion the rates depend on the thickness of this water sheet. The influence of mass transport is significant when the water is stagnant or flows laminarly on the calcite. If, however, the flow becomes turbulent, mo- lecular diffusion is enhanced by turbulent eddies, such that under otherwise unchanged conditions the rates of dissolu- tion or precipitation, respectively, can increase by almost 1 order of magnitude.
Thus the rates are also controlled to a significant extent by the hydrodynamic conditions under which dissolution or precipitation occurs. This was first observed in the field. Deposition rates of calcite from water flowing turbulently across rimstone dams were found to be higher by a factor of up to 5 compared to those observed in the corresponding pools, with identical chemical composition, but almost stag- nant water (Liu et al., 1995). Recently, it has been shown experimentally (Dreybrodt et al., 1996a,b) that the model of Buhmann and Dreybrodt ( 1985a,b) is also valid for solutions contained in porous media of calcite both for dissolution and precipitation, respectively, thus proving its basic assump- tions. This model, however, is too crude to treat correctly the case of turbulence. Therefore, Dreybrodt and Buhmann ( 199 1) extended it by introducing a diffusion boundary layer separating the bulk of the solution from the surface of the mineral. Mass transport through this layer proceeds by mo- lecular diffusion, whereas in the turbulent bulk complete mixing occurs within extremely short time spans. This ex- tended model predicts rates, which depend on the thickness of the diffusion boundary layer. An experimental means to create such diffusion boundary layers of well-defined thick- ness is the rotating disk technique (Levich, 1962; Pleskov and Filinovskii, 1976). In this paper we report on measure- ments of dissolution rates of marble and limestone for vari- ous boundary layer thicknesses under COz-pressures from 10-j atm up to 1 atm. These experiments agree satisfactorily with the rates predicted by the diffusion boundary-layer (DBL) model and offer a deeper understanding of the disso- lution and precipitation rates under turbulent flow in natural systems.
2. EXPERIMENTAL METHODS
2.1. Materials
Marble and limestone (from Guilin, China) disks, 3 cm in diame- ter, were cored from marble slabs of 5 mm thickness. These samples were cemented into the holder of the rotating disk apparatus. This was then mounted to the shaft of the rotating disk equipment and polished during rotation by using progressively 400 (64 pm), 800
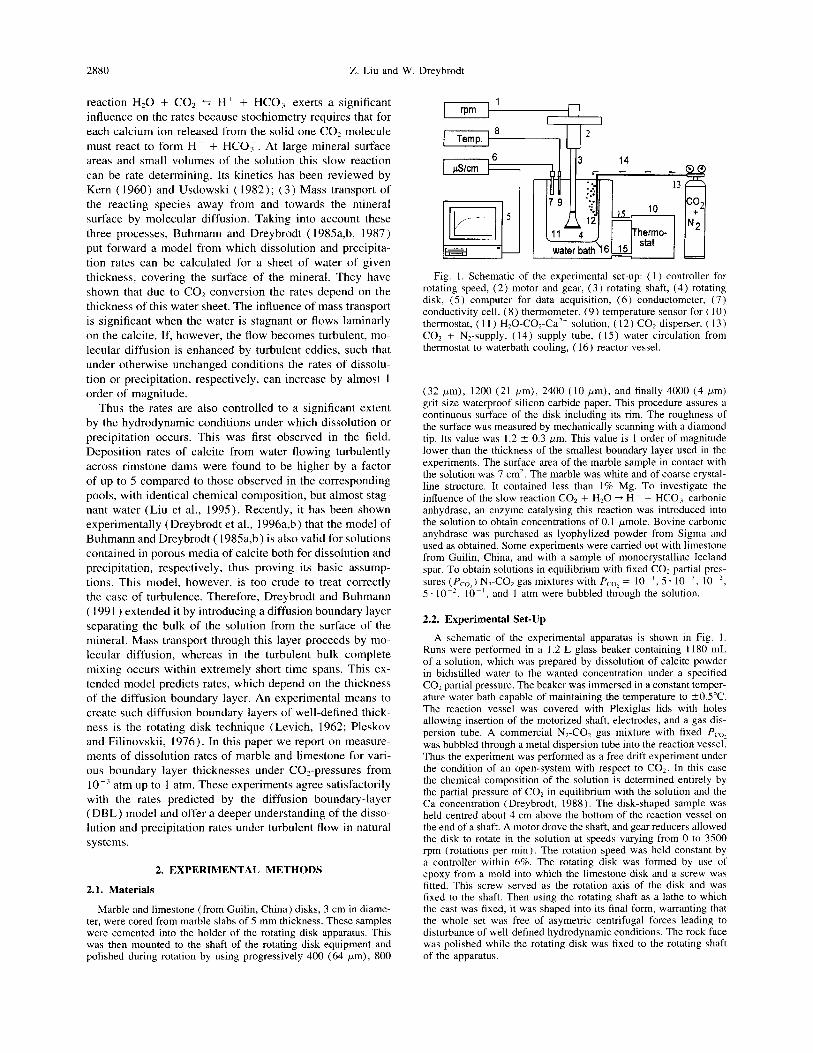
Fig. 1. Schematic of the experimental set-up: ( I ) controller for rotating speed, (2) motor and gear, (3) rotating shaft, (4) rotating disk, (5) computer for data acquisition, (6) conductometer, (7) conductivity cell, (8) thermometer, (9) temperature sensor for ( 10) thermostat, ( I I ) H,O-CO*-Ca’+ solution, ( 12) CO* disperser, ( 13) CO* + NZ-supply, (14) supply tube, ( 15) water circulation from thermostat to waterbath cooling, (16) reactor vessel.
(32 wm), 1200 (21 pm), 2400 (10 pm), and finally 4000 (4 pm) grit size waterproof silicon carbide paper. This procedure assures a continuous surface of the disk including its rim. The roughness of the surface was measured by mechanically scanning with a diamond tip. Its value was 1.2 2 0.3 pm. This value is 1 order of magnitude lower than the thickness of the smallest boundary layer used in the experiments. The surface area of the marble sample in contact with the solution was 7 cm’. The marble was white and of coarse crystal- line structure. It contained less than 1% Mg. To investigate the influence of the slow reaction CO1 + H20 + H+ + HCO; carbonic anhydrase, an enzyme catalysing this reaction was introduced into the solution to obtain concentrations of 0.1 pmole. Bovine carbonic anyhdrase was purchased as lyophylized powder from Sigma and used as obtained. Some experiments were carried out with limestone from Guilin, China, and with a sample of monocrystalline Iceland spar. To obtain solutions in equilibrium with fixed CO2 partial pres- sures (Pro*) N,-CO2 gas mixtures with PccIi = lo-‘, 5. 10 ‘. IO -‘, 5. lo-‘, IO-‘, and 1 atm were bubbled through the solution.
2.2. Experimental Set-Up
A schematic of the experimental apparatus is shown in Fig. 1. Runs were performed in a 1.2 L glass beaker containing I 180 mL of a solution, which was prepared by dissolution of calcite powder in bidistilled water to the wanted concentration under a specified CO, partial pressure. The beaker was immersed in a constant temper- ature water bath capable of maintaining the temperature to ?O.YC. The reaction vessel was covered with Plexiglas lids with holes allowing insertion of the motorized shaft, electrodes, and a gas dis- persion tube. A commercial N,-CO, gas mixture with fixed I’,,,> was bubbled through a metal dispersion tube into the reaction vessel. Thus the experiment was performed as a free drift experiment under the condition of an open-system with respect to CO,. In this case the chemical composition of the solution is determined entirely by the partial pressure of CO> in equilibrium with the solution and the Ca concentration (Dreybrodt, 1988). The disk-shaped sample was held centred about 4 cm above the bottom of the reaction vessel on the end of a shaft. A motor drove the shaft, and gear reducers allowed the disk to rotate in the solution at speeds varying from 0 to 3500 rpm (rotations per min) The rotation speed was held constant by a controller within 6%. The rotating disk was formed by use of epoxy from a mold into which the limestone disk and a screw was fitted. This screw served as the rotation axis of the disk and was fixed to the shaft. Then using the rotating shaft as a lathe to which the cast was fixed, it was shaped into its final form, warranting that the whole set was free of asymetric centrifugal forces leading to disturbance of well-defined hydrodynamic conditions. The rock face was polished while the rotating disk was fixed to the rotating shaft of the apparatus.
Dissolution kinetics of calcium carbonate 2881
n- 3.12
E S
j 3.09 0 c
‘5 3.06
$ c
:=
T: 20°C Pco,: 1x10” atm
/
6
0 1 2 3 4 5 6 7 8
Experimental time (hours)
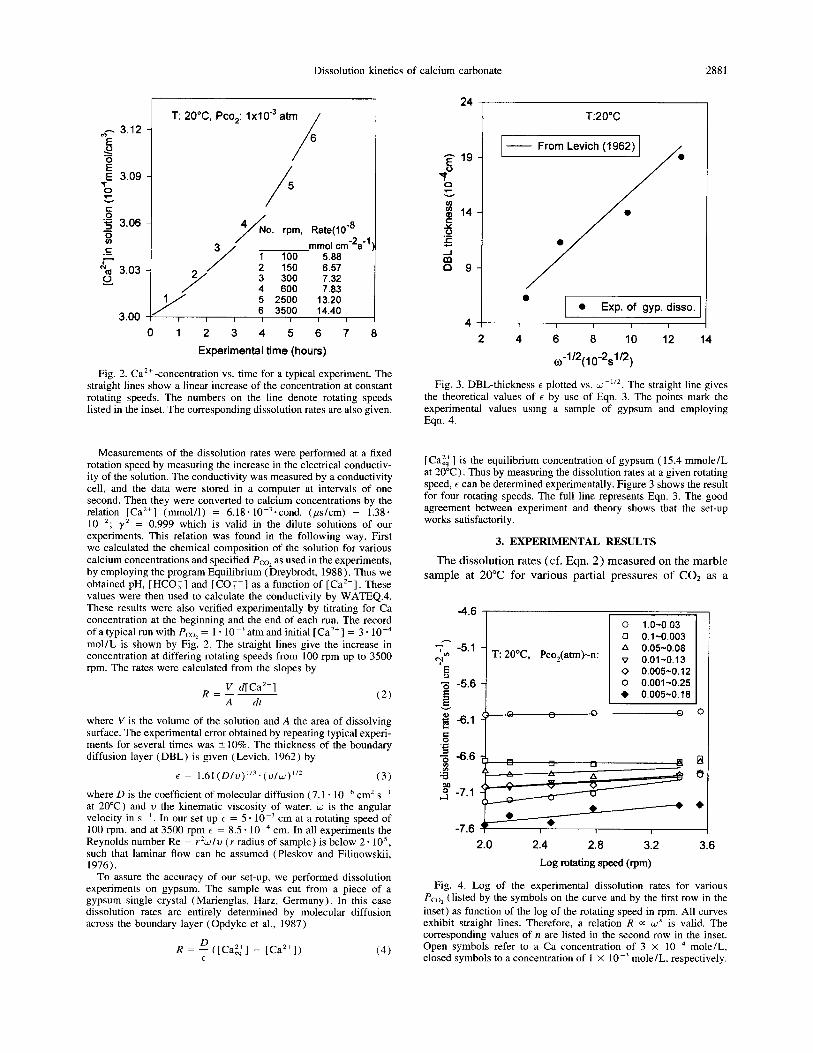
Fig. 2. Ca’+ -concentration vs. time for a typical experiment. The straight lines show a linear increase of the concentration at constant rotating speeds. The numbers on the line denote rotating speeds listed in the inset. The corresponding dissolution rates are also given.
Measurements of the dissolution rates were performed at a fixed rotation speed by measuring the increase in the electrical conductiv- ity of the solution. The conductivity was measured by a conductivity cell, and the data were stored in a computer at intervals of one second. Then they were converted to calcium concentrations by the relation [Ca’+] (mmol/l) = 6.18. IO-‘*cond. (&cm) - 1.38. 10-Z; yz = 0.999 which is valid in the dilute solutions of our experiments. This relation was found in the following way. First we calculated the chemical composition of the solution for various calcium concentrations and specified Pco, as used in the experiments, by employing the program Equilibrium (Dreybrodt, 1988). Thus we obtained pH, [ HCO;] and [CO;-] as a function of [ Ca’+] These values were then used to calculate the conductivity by WATEQ.4. These results were also verified experimentally by titrating for Ca concentration at the beginning and the end of each run. The record of a typical run with P,oz = 1 . 10 m3 atm and initial [Ca”] = 3. 10m4 mol/L is shown by Fig. 2. The straight lines give the increase in concentration at differing rotating speeds from 100 rpm up to 3500 rpm. The rates were calculated from the slopes by
R = 1 d[Ca*+l A dt
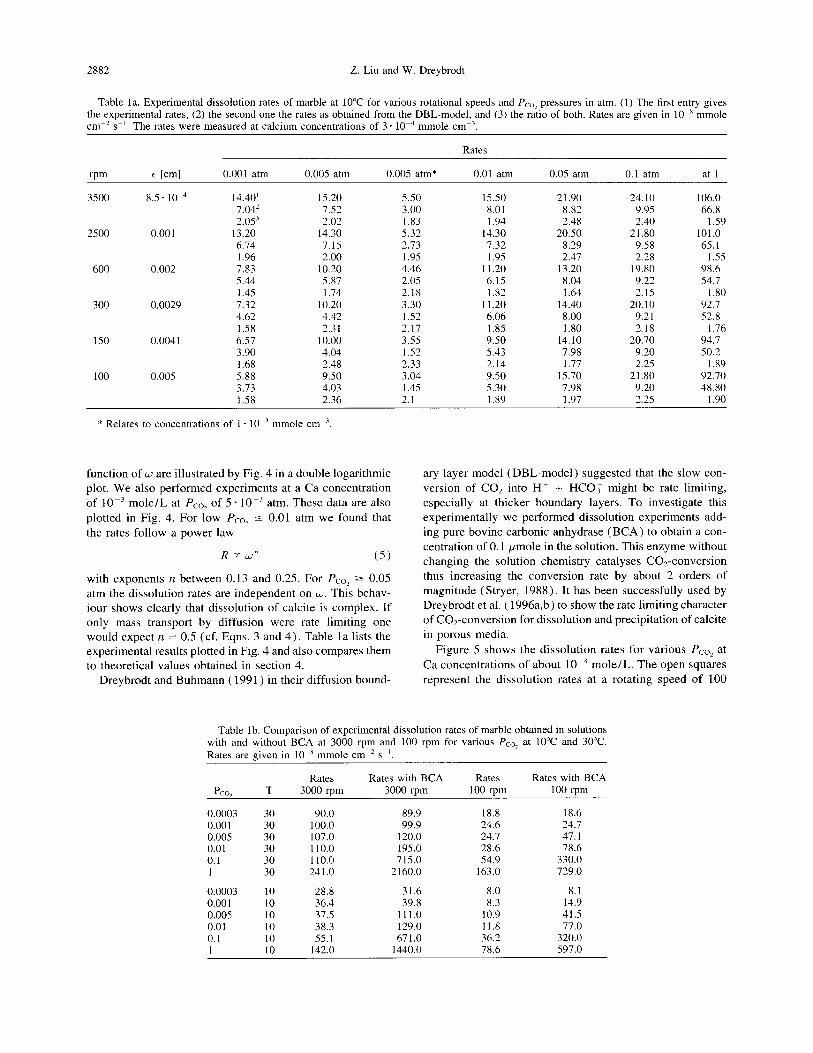
where V is the volume of the solution and A the area of dissolving surface. The experimental error obtained by repeating typical experi- ments for several times was +lO%. The thickness of the boundary diffusion layer (DBL) is given (Levich, 1962) by
t = 1.61(Dlv)“‘~(v/w)“* (3)
where D is the coefficient of molecular diffusion (7.1. 10 + cm’ s -’ at 20°C) and v the kinematic viscosity of water. w is the angular velocity in s -‘. In our set-up E = 5 * lO-3 cm at a rotating speed of 100 rpm, and at 3500 rpm e = 8.5 * 10m4 cm. In all experiments the Reynolds number Re = &J/V (r radius of sample) is below 2. 105, such that laminar flow can be assumed (Pleskov and Filinowskii, 1976).
To assure the accuracy of our set-up, we performed dissolution experiments on gypsum. The sample was cut from a piece of a gypsum single crystal (Marienglas, Harz, Germany). In this case dissolution rates are entirely determined by molecular diffusion across the boundary layer (Opdyke et al., 1987)
R = 4 ([Gag] - [Ca”]) (4)
T:20”C
- From Levich (1962) 0
/
???? Exp. of gyp. disso.
2 4 6 8 IO 12 14
Fig. 3. DBL-thickness E plotted vs. w-I’*. The straight line gives the theoretical values of E by use of Eqn. 3. The points mark the experimental values using a sample of gypsum and employing Eqn. 4.
[Cazl] is the equilibrium concentration of gypsum ( 15.4 mmole/L at 20°C). Thus by measuring the dissolution rates at a given rotating speed, t can be determined experimentally. Figure 3 shows the result for four rotating speeds. The full line represents Eqn. 3. The good agreement between experiment and theory shows that the set-up works satisfactorily.
3. EXPERIMENTAL RESULTS
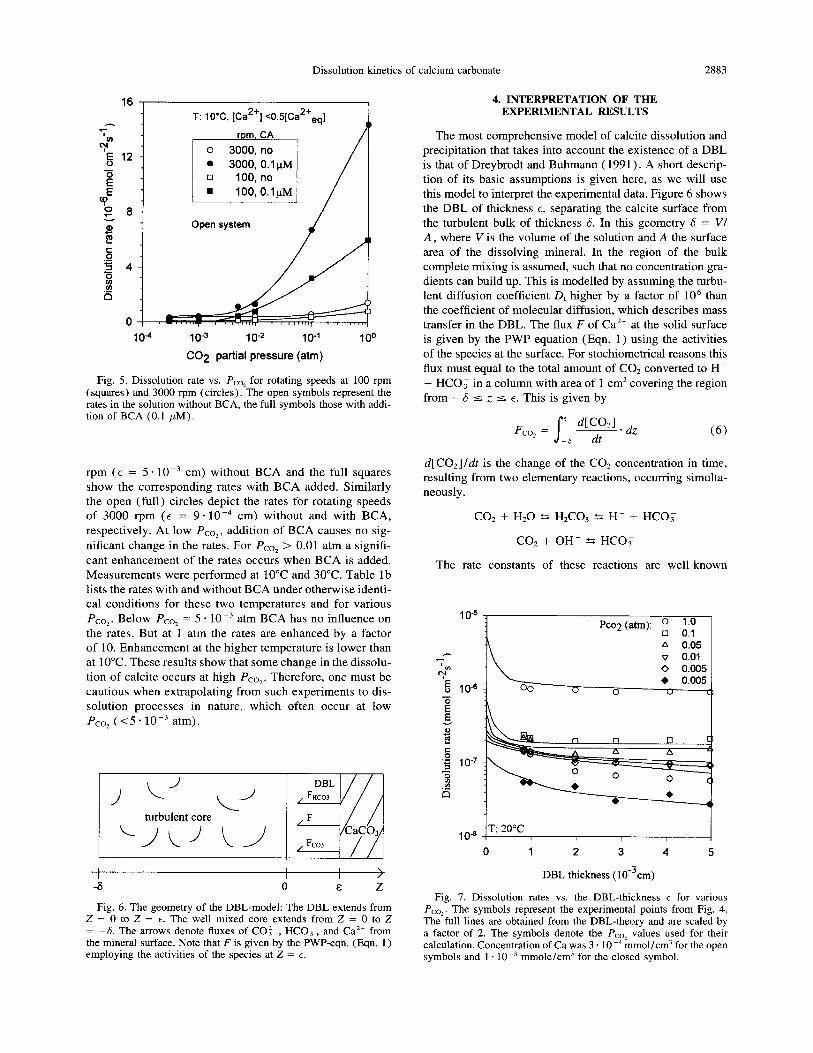
The dissolution rates (cf. Eqn. 2) measured on the marble sample at 20°C for various partial pressures of CO* as a
-4.6
0 -
0.1-0.003 c;v, -5.1 - c( T: 2O”C, Pco,(atm)-n:
A 0.05-0.08
‘E v 0.01-0.13
; -5.6 - 0 0.005-O. 12 0 0.001-0.25 ?? 0.005-0.18
p6.1~~ n - 0
2.0 2.4 2.8 3.2
Log rotating speed (rpm)
3.6
Fig. 4. Log of the experimental dissolution rates for various Pcol (listed by the symbols on the curve and by the first row in the inset) as function of the log of the rotating speed in rpm. All curves exhibit straight lines. Therefore, a relation R o( un is valid. The corresponding values of n are listed in the second row in the inset. Open symbols refer to a Ca concentration of 3 x 10m4 mole/L, closed symbols to a concentration of 1 X 10m3 mole/L, respectively.
2882 2. Liu and W. Dreybrodt
Table la. Experimental dissolution rates of marble at 10°C for various rotational speeds and P co2 pressures in atm. (1) The first entry gives the experimental rates, (2) the second one the rates as obtained from the DBL-model, and (3) the ratio of both. Rates are given in lo-’ mmole cm-* s-‘. The rates were measured at calcium concentrations of 3. lo-“ mmole cmm3.
Rates
mm t lcml 0.001 atm 0.005 atm 0.005 atm* 0.01 atm 0.05 atm 0.1 atm at 1
3500 8.5. IO-” 14.40’ 7.042 2.05’
2500 0.001 13.20 6.74 I .96
600 0.002 7.83 5.44 1.45
300 0.0029 7.32 4.62 1.58
150 0.004 1 6.57 3.90 1.68
100 0.005 5.88 3.13 1 58
15.20 5.50 15.50 21.90 24.10 106.0 7.52 3.00 8.01 8.82 9.95 66.8 2.02 1.83 1.94 2.48 2.40 1.59
14.30 5.32 14.30 20.50 21.80 101.0 7.15 2.73 7.32 8.29 9.58 65.1 2.00 1.95 I .95 2.47 2.28 I .55
IO.20 4.46 11.20 13.20 19.80 98.6 5.87 2.05 6.15 8.04 9.22 54.7 1.74 2.18 I .82 I .64 2.15 1.80
10.20 3.30 11.20 14.40 20.10 92.7 4.42 1.52 6.06 8.00 9.21 52.8 2.31 2.17 1.85 I .80 2.18 1.76
10.00 3.55 9.50 14.10 20.70 94.7 4.04 1.52 5.43 7.98 9.20 50.2 2.48 2.33 2.14 1 .I7 2.25 1.89 9.50 3.04 9.50 15.70 21.80 92.70 4.03 1.45 5.30 7.98 9.20 48.80 2.36 2.1 I .x9 1.97 2.25 1.90
* Relates to concentrations of I . lo-’ mmole cm-’
function of w are illustrated by Fig. 4 in a double logarithmic plot. We also performed experiments at a Ca concentration
of 10m3 mole/L at Pco, of 5 - 10 m3 atm. These data are also plotted in Fig. 4. For low PC,? 5 0.01 atm we found that the rates follow a power law
R 3: W" (5)
with exponents n between 0.13 and 0.25. For Pco, 2 0.05 atm the dissolution rates are independent on ti. This behav- iour shows clearly that dissolution of calcite is complex. If only mass transport by diffusion were rate limiting one would expect n = 0.5 (cf. Eqns. 3 and 4). Table la lists the experimental results plotted in Fig. 4 and also compares them to theoretical values obtained in section 4.
Dreybrodt and Buhmann ( 199 1) in their diffusion bound-
ary layer model (DBL-model) suggested that the slow con- version of CO2 into H+ + HCOi might be rate limiting, especially at thicker boundary layers. To investigate this experimentally we performed dissolution experiments add- ing pure bovine carbonic anhydrase (BCA) to obtain a con- centration of 0.1 pmole in the solution. This enzyme without changing the solution chemistry catalyses CO,-conversion thus increasing the conversion rate by about 2 orders of magnitude (Stryer, 1988). It has been successfully used by Dreybrodt et al. ( 1996a,b) to show the rate limiting character of CO,-conversion for dissolution and precipitation of calcite in porous media.
Figure 5 shows the dissolution rates for various PC,, at
Ca concentrations of about 10 m4 mole/L. The open squares represent the dissolution rates at a rotating speed of 100
Table lb. Comparison of experimental dissolution rates of marble obtained in solutions with and without BCA at 3000 rpm and 100 rpm for various Pco2 at 10°C and 30°C. Rates are given in lo-* mmole cm-’ s-‘.
P i-0, Rates Rates with BCA Rates Rates with BCA
T 3000 rpm 3000 rpm 100 rpm 100 rpm
0.0003 0.00 1 0.005 0.01 0.1 1
0.0003 0.001 0.005 0.01 0.1
30 90.0 30 100.0 30 107.0 30 110.0 30 110.0 30 241.0
10 28.8 10 36.4 10 37.5 10 38.3 10 55.1 10 142.0
89.9 18.8 18.6 99.9 24.6 24.7
120.0 24.7 47.1 195.0 28.6 78.6 715.0 54.9 330.0
2160.0 163.0 729.0
31.6 8.0 8.1 39.8 8.3 14.9
111.0 10.9 41.5 129.0 11.8 77.0 671.0 36.2 320.0
1440.0 78.6 597.0
Dissolution kinetics of calcium carbonate 2883
16 T: lo”C, [Ca2+] <0.5[Ca2+aq] 1
. 3000, O.lpM
104 IO-3 1 o-2 1 o-1
CO2 partial pressure (atm)
100
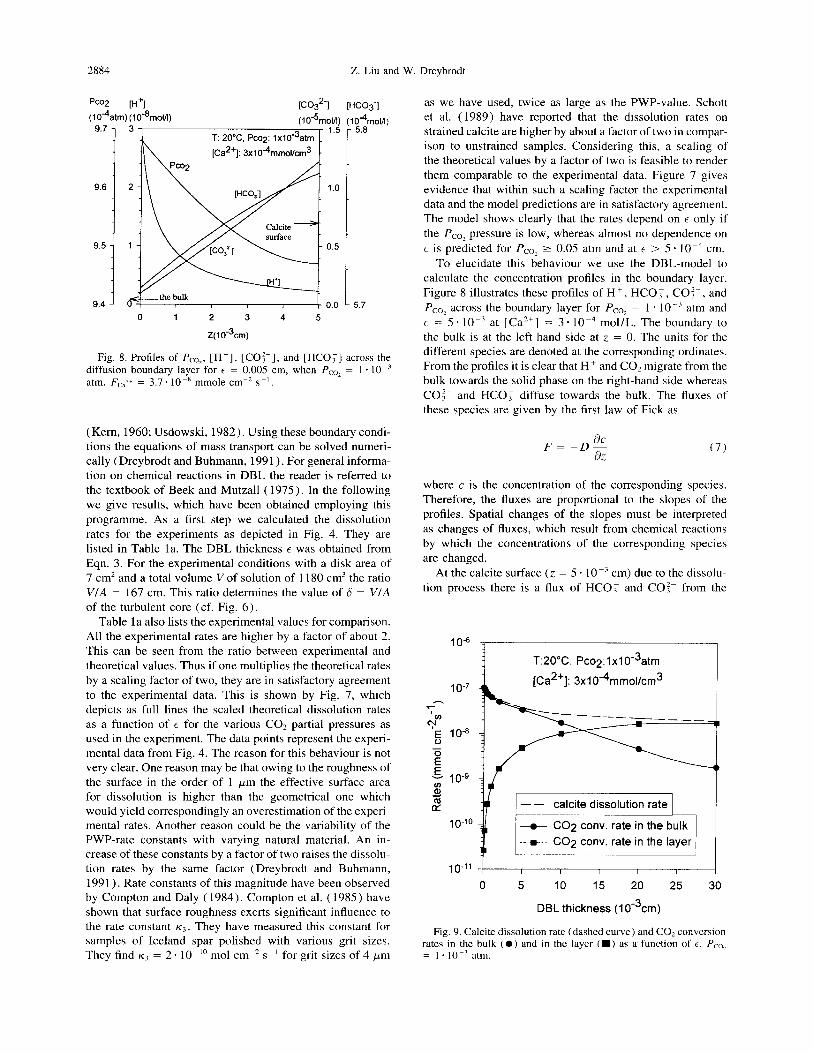
Fig. 5. Dissolution rate vs. Pco, for rotating speeds at 100 rpm (squares) and 3000 rpm (circles). The open symbols represent the rates in the solution without BCA, the full symbols those with addi- tion of BCA (0.1 PM).
rpm (E = 5 - 10m3 cm) without BCA and the full squares show the corresponding rates with BCA added. Similarly the open (full) circles depict the rates for rotating speeds of 3000 rpm (t = 9 * 10m4 cm) without and with BCA,
respectively. At low Pco,, addition of BCA causes no sig-
nificant change in the rates. For Pco, > 0.01 atm a signifi- cant enhancement of the rates occurs when BCA is added.
Measurements were performed at 10°C and 30°C. Table lb lists the rates with and without BCA under otherwise identi-
cal conditions for these two temperatures and for various
Pco,. Below Pco, = 5 * 10 m3 atm BCA has no influence on the rates. But at 1 atm the rates are enhanced by a factor of 10. Enhancement at the higher temperature is lower than at 10°C. These results show that some change in the dissolu- tion of calcite occurs at high Pco,. Therefore, one must be cautious when extrapolating from such experiments to dis- solution processes in nature, which often occur at low Pco, (<5 * 10m3 atm).
turbulent core
I I I
I I >
-6 0 E Z
Fig. 6. The geometry of the DBL-model: The DBL extends from Z = 0 to Z = E. The well mixed core extends from Z = 0 to Z = -6. The arrows denote fluxes of CO:-, HCO;, and Ca*+ from the mineral surface. Note that F is given by the PWP-eqn. (Eqn. 1) employing the activities of the species at Z = E.
4. INTERPRETATION OF THE EXPERIMENTAL RESULTS
The most comprehensive model of calcite dissolution and precipitation that takes into account the existence of a DBL is that of Dreybrodt and Buhmann ( 1991). A short descrip- tion of its basic assumptions is given here, as we will use this model to interpret the experimental data. Figure 6 shows the DBL of thickness t, separating the calcite surface from the turbulent bulk of thickness 6. In this geometry 6 = V/ A, where V is the volume of the solution and A the surface area of the dissolving mineral. In the region of the bulk complete mixing is assumed, such that no concentration gra- dients can build up. This is modelled by assuming the turbu- lent diffusion coefficient D, higher by a factor of lo6 than the coefficient of molecular diffusion, which describes mass transfer in the DBL. The flux F of Ca2+ at the solid surface is given by the PWP equation (Eqn. 1) using the activities of the species at the surface. For stochiometrical reasons this flux must equal to the total amount of CO2 converted to H+ + HCO; in a column with area of 1 cm* covering the region from -6 5 z 5 E. This is given by
F co1 = s e !!yLdz -6
(6)
d[ C02]ldt is the change of the CO? concentration in time, resulting from two elementary reactions, occurring simulta- neously.
CO2 + HZ0 f H2C03 f H + + HCO;
CO?; + OH- = HCO,
The rate constants of these reactions are well-known
PC02 (atm): z A::
Ii A 0.05 v 0.01 0 0.005
1‘ 00 ?? 0.005
0 0 ”
T: 20°C I I I
0 1 2 3 4 5
DBL thickness (1 Om3cm)
Fig. 7. Dissolution rates vs. the DBL-thickness E for various PCo2. The symbols represent the experimental points from Fig. 4. The full lines are obtained from the DBL-theory and are scaled by a factor of 2. The symbols denote the Pcol values used for their calculation. Concentration of Ca was 3 * 10m4 mmol/cm for the open symbols and 1. lo-’ mmole/cm’ for the closed symbol.
2884 Z. Liu and W. Dreybrodt
Pa2 [H+l (10%?l)(l0-%lol/l)
(Co327 MC03‘1 ~lo-%lol/l) (1
T: 20% Pcoq: lxl0-3atm
[Ca2+]:3x1044mmol/cm3
9.6
9.5
9.4
l0%01/1) 5.8
5.7
Fig. 8. Profiles of P,,,, [H+], [CO:-], and [HCO;] across the diffusion boundary layer for t = 0.005 cm, when Pco, = 1. lo-’ atm. F,,z* = 3.7’ IO-’ mmole cm-’ SK’.
(Kern, 1960; Usdowski, 1982). Using these boundary condi- tions the equations of mass transport can be solved numeri- cally (Dreybrodt and Buhmann, 1991). For general informa- tion on chemical reactions in DBL the reader is referred to the textbook of Beek and Mutzall ( 1975). In the following we give results, which have been obtained employing this programme. As a first step we calculated the dissolution rates for the experiments as depicted in Fig. 4. They are listed in Table la. The DBL thickness t was obtained from Eqn. 3. For the experimental conditions with a disk area of 7 cm’ and a total volume V of solution of 1 180 cm3 the ratio V/A = 167 cm. This ratio determines the value of 6 = V/A of the turbulent core (cf. Fig. 6).
Table la also lists the experimental values for comparison. All the experimental rates are higher by a factor of about 2. This can be seen from the ratio between experimental and theoretical values. Thus if one multiplies the theoretical rates by a scaling factor of two, they are in satisfactory agreement to the experimental data. This is shown by Fig. 7, which depicts as full lines the scaled theoretical dissolution rates as a function of c for the various CO* partial pressures as used in the experiment. The data points represent the experi- mental data from Fig. 4. The reason for this behaviour is not very clear. One reason may be that owing to the roughness of the surface in the order of 1 pm the effective surface area for dissolution is higher than the geometrical one which would yield correspondingly an overestimation of the experi- mental rates. Another reason could be the variability of the PWP-rate constants with varying natural material. An in- crease of these constants by a factor of two raises the dissolu- tion rates by the same factor (Dreybrodt and Buhmann, 199 1 ). Rate constants of this magnitude have been observed by Compton and Daly ( 1984). Compton et al. ( 1985) have shown that surface roughness exerts significant influence to the rate constant K~. They have measured this constant for samples of Iceland spar polished with various grit sizes. They find K? = 2. lo-” mol cm-’ s-’ for grit sizes of 4 pm
as we have used, twice as large as the PWP-value. Schott et al. (1989) have reported that the dissolution rates on strained calcite are higher by about a factor of two in compar- ison to unstrained samples. Considering this, a scaling of the theoretical values by a factor of two is feasible to render them comparable to the experimental data. Figure 7 gives evidence that within such a scaling factor the experimental data and the model predictions are in satisfactory agreement. The model shows clearly that the rates depend on t only if the Pco, pressure is low, whereas almost no dependence on 6 is predicted for Pco, 2 0.05 atm and at t > 5 * 10 -a cm.
To elucidate this behaviour we use the DBL-model to calculate the concentration profiles in the boundary layer. Figure 8 illustrates these profiles of H+ , HCO, , CO:-, and PCoL across the boundary layer for Pco, = 1 * lOem atm and E = 5 * 10m3 at [Ca”] = 3 * lo-“ mol/L. The boundary to the bulk is at the left-hand side at z = 0. The units for the different species are denoted at the corresponding ordinates. From the profiles it is clear that H+ and CO2 migrate from the bulk towards the solid phase on the right-hand side whereas CO:- and HCO, diffuse towards the bulk. The fluxes of these species are given by the first law of Fick as
FE_& i3Z
where c is the concentration of the corresponding species. Therefore, the fluxes are proportional to the slopes of the profiles. Spatial changes of the slopes must be interpreted as changes of fluxes, which result from chemical reactions by which the concentrations of the corresponding species are changed.
At the calcite surface (z = 5 * 10 m3 cm) due to the dissolu- tion process there is a flux of HC0.y and CO:- from the
10s
1 o-7
‘v) v g 10-a 0
E ‘;; IO-9 s cz
1 O-10
1 O-1’
T:20”C, Pco2:lx10-3atm
[Ca2+]: 3x10~4mmol/cm3
0 5 10 15 20 25 30
DBL thickness ( 103cm)
Fig. 9. Calcite dissolution rate (dashed curve) and CO2 conversion rates in the bulk (0) and in the layer (M) as a function of c. Pco. = 1. lo-? atm.
Dissolution kinetics of calcium carbonate 2885
[c03~-] WC03‘1
T: 2o"C, Pcog: O.latm
1.069- 2-
1.067- l-
I I I I , I 0 1 2 3 4 5
Z(10-3cm)
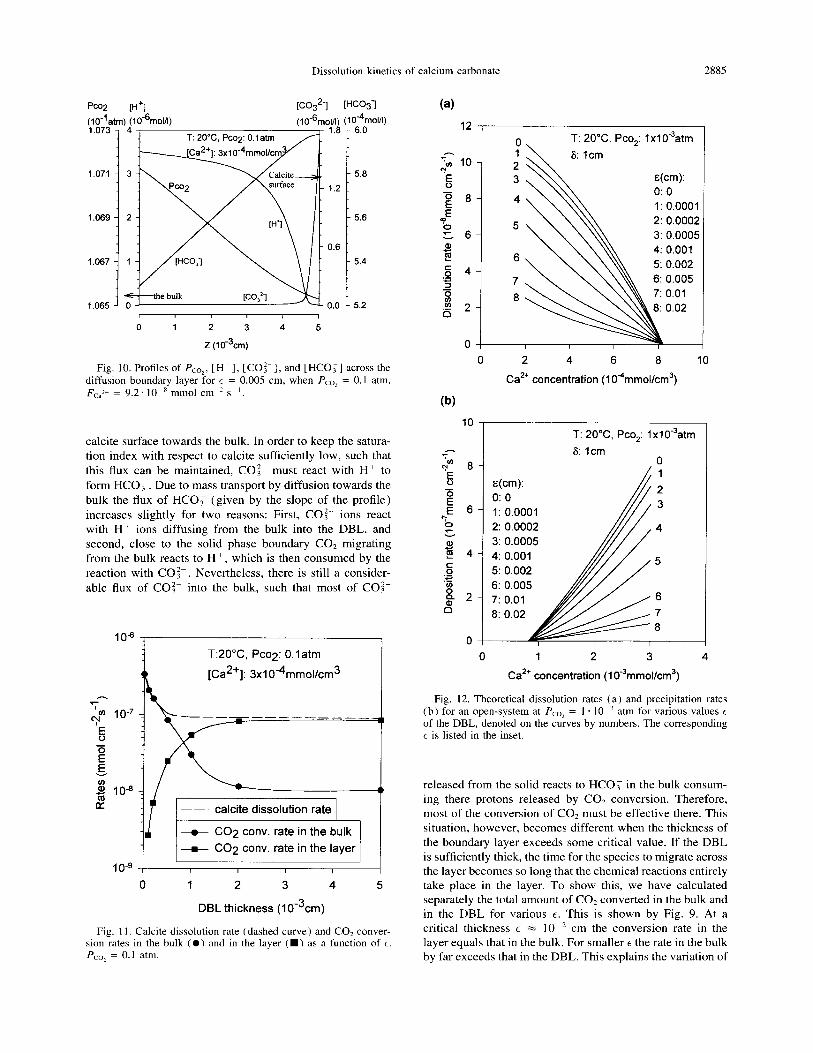
Fig. 10. Profiles of Pco2, [H+], [CO:-], and [HCO;] across the diffusion boundary layer for E = 0.005 cm, when Pco2 = 0.1 atm. Fca*+ = 9.2. lo-” mmol cm-’ SK’.
calcite surface towards the bulk. In order to keep the satura- tion index with respect to calcite sufficiently low, such that this flux can be maintained, CO:- must react with H’ to form HCO, . Due to mass transport by diffusion towards the bulk the flux of HCO, (given by the slope of the profile) increases slightly for two reasons: First, CO:- ions react with H+ ions diffusing from the bulk into the DBL, and second, close to the solid phase boundary CO2 migrating from the bulk reacts to H + , which is then consumed by the reaction with CO:-. Nevertheless, there is still a consider- able flux of CO:- into the bulk, such that most of CO:-
0
- - calcite dissolution rate
,o_9 r -1 ( 0 1 2 3 4 5
DBL thickness (1 0m3cm)
Fig. Il. Calcite dissolution rate (dashed curve) and CO* conver- sion rates in the bulk (0) and in the layer (W) as a function of t. Pco2 = 0.1 atm.
(a) 12
0, T: 2O”C, Pco,: l~lO_~atrn
b 1
c 6
E(cm): 0: 0
1: 0.0001
2: 0.0002 3: 0.0005
4: 0.001 5: 0.002
6: 0.005 7: 0.01
8: 0.02
0 2 4 6 6 10
Ca*+ concentration (1 O~mmol/cm3)
(W
10 ,
- 1 ;m a
T: 2O”C, Pco,: 1 xl Oe3atm
6: lcm
‘6 - E(cm):
5
j 6 0: 1: 0 0.0001
0 =.
1 2: 0.0002
9 3: 0.0005
!! 4 4: 0.001 _
0 1 2 3 4
Ca*+ concentration (1 0”mmol/cm3)
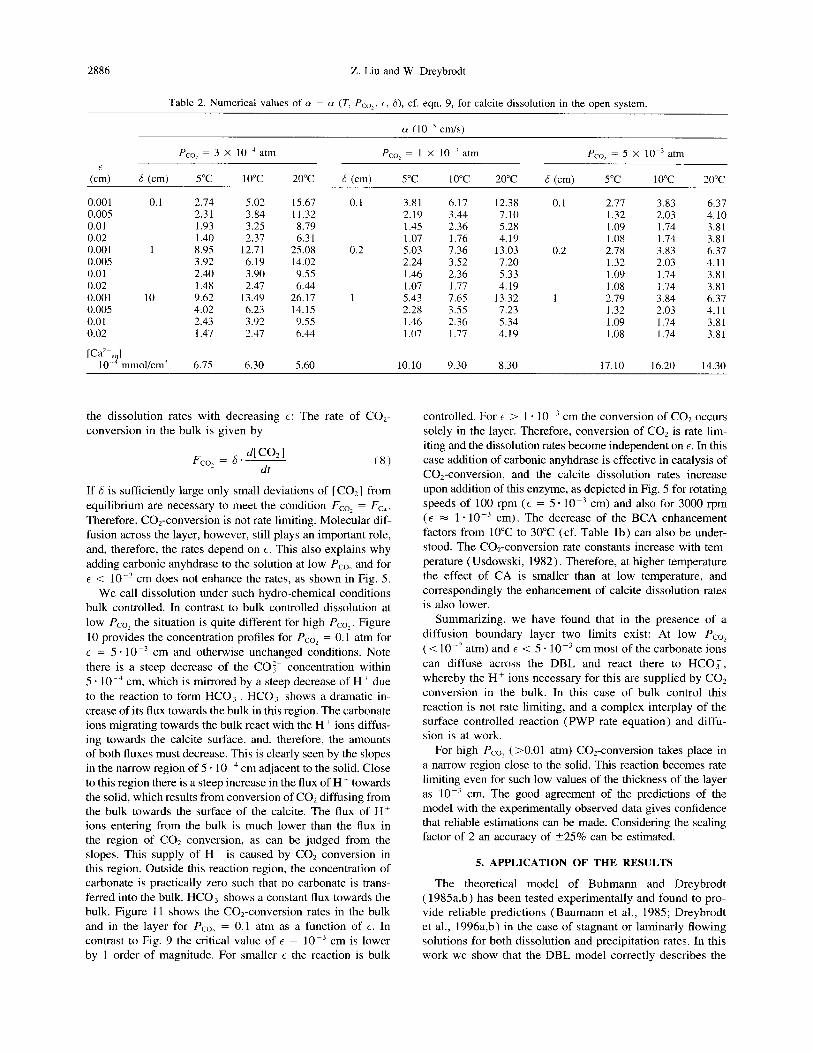
Fig. 12. Theoretical dissolution rates (a) and precipitation rates (b) for an open-system at Pcol = 1 . lo-’ atm for various values t of the DBL, denoted on the curves by numbers. The corresponding E is listed in the inset.
released from the solid reacts to HC0.y in the bulk consum- ing there protons released by CO2 conversion. Therefore, most of the conversion of CO, must be effective there. This situation, however, becomes different when the thickness of the boundary layer exceeds some critical value. If the DBL is sufficiently thick, the time for the species to migrate across the layer becomes so long that the chemical reactions entirely take place in the layer. To show this, we have calculated separately the total amount of CO? converted in the bulk and in the DBL for various t. This is shown by Fig. 9. At a critical thickness E = lo-* cm the conversion rate in the layer equals that in the bulk. For smaller t the rate in the bulk by far exceeds that in the DBL. This explains the variation of
2886 Z. Liu and W. Dreybrodt
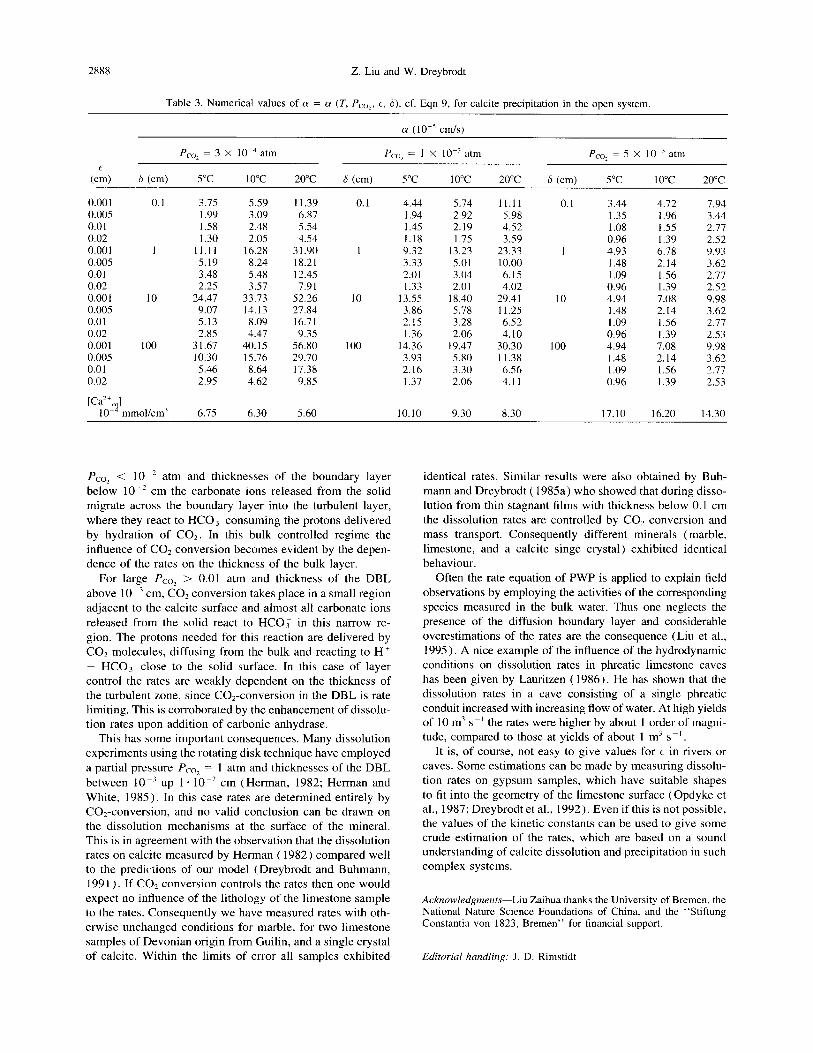
Table 2. Numerical values of 01 = 01 (T, P,,,,, t, 6), cf. eqn. 9, for calcite dissolution in the open system.
cy (lo-5 cm/s)
Pcoz = 3 X lo-’ atm Pco, = 1 X IO-’ atm Pro, = 5 X 10m3 atm c
(cm) 6 (cm) 5°C 10°C 20°C 5 (cm) 5°C 10°C 20°C 6 (cm) 5°C 10°C 20°C
0.001 0.1 0.005 0.01 0.02 0.001 1 0.005 0.01 0.02 0.001 10 0.005 0.01 0.02
[Ca’+ ] 10” mmol/cmi
2.74 5.02 2.3 1 3.84 1.93 3.25 1.40 2.37 8.95 12.71 3.92 6.19 2.40 3.90 1.48 2.47 9.62 13.49 4.02 6.23 2.43 3.92 1.47 2.47
6.75 6.30
15.67 0.1 3.81 6.17 12.38 0.1 2.77 3.83 6.37 11.32 2.19 3.44 7.10 1.32 2.03 4.10 8.79 1.45 2.36 5.28 1.09 1.74 3.81 6.3 1 1.07 1.76 4.19 1.08 1.74 3.81
25.08 0.2 5.03 7.36 13.03 0.2 2.78 3.83 6.37 14.02 2.24 3.52 7.20 1.32 2.03 4.11 9.55 1.46 2.36 5.33 1.09 1.74 3.81 6.44 1.07 1.77 4.19 1.08 1.74 3.81
26.17 1 5.43 7.65 13.32 1 2.79 3.84 6.37 14.15 2.28 3.55 7.23 1.32 2.03 4.11 9.55 1.46 2.36 5.34 1.09 1.74 3.81 6.44 1.07 1.77 4.19 1.08 1.74 3.81
5.60 10.10 9.30 8.30 17.10 16.20 14.30
the dissolution rates with decreasing e: The rate of CO,- conversion in the bulk is given by
If 5 is sufficiently large only small deviations of [CO,] from equilibrium are necessary to meet the condition Fco, = F,,. Therefore, CO,-conversion is not rate limiting. Molecular dif- fusion across the layer, however, still plays an important role, and, therefore, the rates depend on e. This also explains why adding carbonic anyhdrase to the solution at low PC,, and for e < 10e3 cm does not enhance the rates, as shown in Fig. 5.
We call dissolution under such hydro-chemical conditions bulk controlled. In contrast to bulk controlled dissolution at low Pco, the situation is quite different for high Pcoz. Figure 10 provides the concentration profiles for P,,, = 0.1 atm for E = 5 * 10m3 cm and otherwise unchanged conditions. Note there is a steep decrease of the CO:- concentration within 5 - 1O-4 cm, which is mirrored by a steep decrease of H+ due to the reaction to form HCO;. HCOT shows a dramatic in- crease of its flux towards the bulk in this region. The carbonate ions migrating towards the bulk react with the Ht ions diffus- ing towards the calcite surface, and, therefore, the amounts of both fluxes must decrease. This is clearly seen by the slopes in the narrow region of 5 . 10 m4 cm adjacent to the solid. Close to this region there is a steep increase in the flux of H + towards the solid, which results from conversion of CO2 diffusing from the bulk towards the surface of the calcite. The flux of H’ ions entering from the bulk is much lower than the flux in the region of CO? conversion, as can be judged from the slopes. This supply of H’ is caused by CO, conversion in this region. Outside this reaction region, the concentration of carbonate is practically zero such that no carbonate is trans- ferred into the bulk. HCO; shows a constant flux towards the bulk. Figure 11 shows the CO+onversion rates in the bulk and in the layer for Pcoz = 0.1 atm as a function of E. In contrast to Fig. 9 the critical value of t = 10 m3 cm is lower by 1 order of magnitude. For smaller E the reaction is bulk
controlled. For t > 1 * 10-j cm the conversion of CO2 occurs solely in the layer. Therefore, conversion of CO, is rate lim- iting and the dissolution rates become independent on E. In this case addition of carbonic anyhdrase is effective in catalysis of CO,-conversion, and the calcite dissolution rates increase upon addition of this enzyme, as depicted in Fig. 5 for rotating speeds of 100 rpm (E = 5 * 10e3 cm) and also for 3000 rpm (E = 1.10 -3 cm). The decrease of the BCA enhancement factors from 10°C to 30°C (cf. Table lb) can also be under- stood. The CO,-conversion rate constants increase with tem- perature (Usdowski, 1982). Therefore, at higher temperature the effect of CA is smaller than at low temperature, and correspondingly the enhancement of calcite dissolution rates is also lower.
Summarizing, we have found that in the presence of a diffusion boundary layer two limits exist: At low Pco, (<lo-' atm) and E < 5 * 10m3 cm most of the carbonate ions can diffuse across the DBL and react there to HCO;, whereby the H+ ions necessary for this are supplied by CO? conversion in the bulk. In this case of bulk control this reaction is not rate limiting, and a complex interplay of the surface controlled reaction (PWP rate equation) and diffu- sion is at work.
For high Pco, ( >O.Ol atm) CO*-conversion takes place in a narrow region close to the solid. This reaction becomes rate limiting even for such low values of the thickness of the layer as 10 -’ cm. The good agreement of the predictions of the model with the experimentally observed data gives confidence that reliable estimations can be made. Considering the scaling factor of 2 an accuracy of +-25% can be estimated.
5. APPLICATION OF THE RESULTS
The theoretical model of Buhmann and Dreybrodt ( 1985a,b) has been tested experimentally and found to pro- vide reliable predictions (Baumann et al., 1985; Dreybrodt et al., 1996a,b) in the case of stagnant or laminarly flowing solutions for both dissolution and precipitation rates. In this work we show that the DBL model correctly describes the
Dissolution kinetics of calcium carbonate 2887
behaviour of dissolution rates for turbulent flow. In view of these results and the fact that both dissolution and precipita- tion are determined by the same physical and chemical mech- anism, we suggest that the predictions of this model are also valid for precipitation. Initial applications of this model for the interpretation of precipitation rates in natural stream sys- tems (Dreybrodt et al., 1992; Liu et al., 1995) have yielded good results. For example growth rates of stalagmites in cave environments are in reasonable agreement to predic- tions from our models (Dreybrodt, 1988; Baker and Smart, 1995).
We, therefore, feel encouraged to list results obtained from the DBL model for dissolution and precipitation rates for various natural occurring conditions. These can be used to give at least a first estimation, when applied to geological problems. Figure 12 illustrates dissolution rates (a) and pre- cipitation rates (b) for Pco, = 1 * 10e3 atm for various thick- ness of E. The thickness 6 of the turbulent bulk is 6 = 1 cm. For large values of E > 0.005 cm rates are drastically re- duced, compared to the top curve, which gives the maximal rates from the PWP-equation using the bulk activities of the species (E = 0). There is a significant change in the rates for 5 - 10 m3 cm 5 E 5 1. 10m3 cm. Little influence of the DBL occurs when E < 2 - 10 m4 cm.
All the rate curves in Figs. 12 and 13 to a reasonable extent of accuracy (‘25%) can be approximated by a linear relation.
R = cz*([Ca*+],, - [Ca*‘]) (9)
where (Y is a rate constant in cm s-l and [ Ca”],, is the Ca equilibrium concentration. It should be noted that close to equilibrium for both dissolution and precipitation, inhibition mechanisms due to impurities in the limestone are operative (Busenberg and Plummer, 1986; Dreybrodt, 1988; Svensson and Dreybrodt, 1992; Dreybrodt et al., 1996a,b). Therefore, Eqn. 9 is valid only for concentrations c/c, 5 0.9 for disso- lution and c/c,, 2 1.2 for precipitation, respectively.
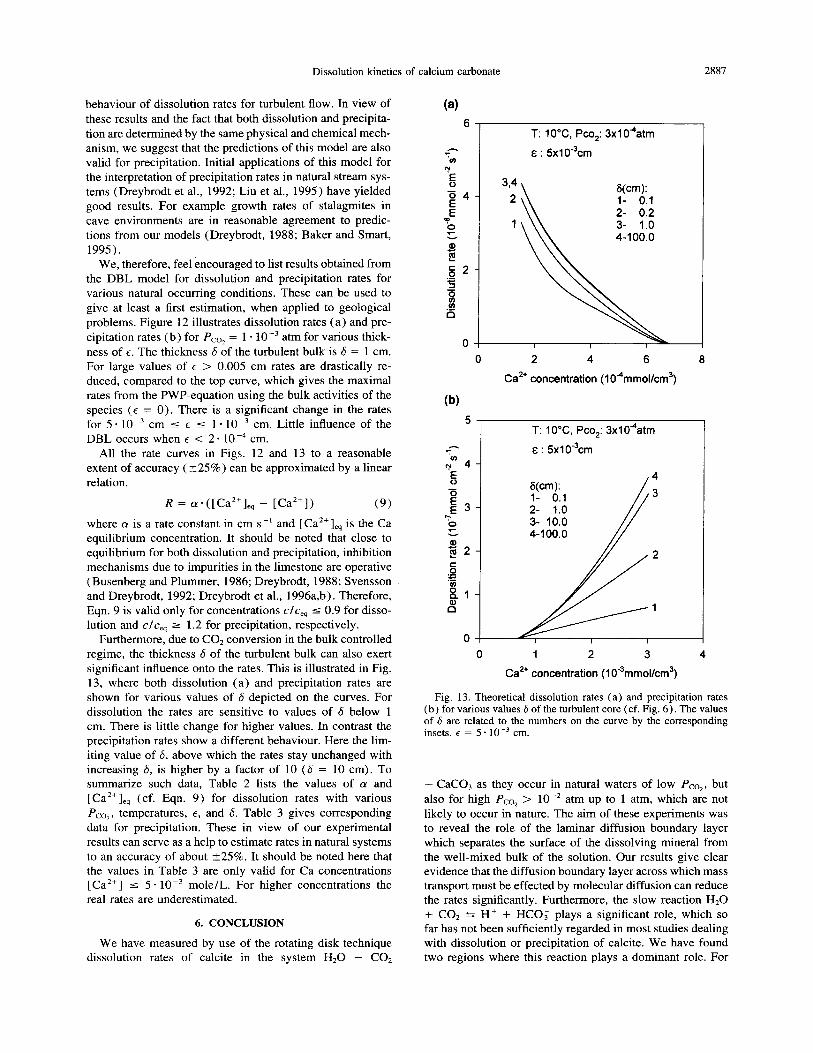
Furthermore, due to CO, conversion in the bulk controlled regime, the thickness S of the turbulent bulk can also exert significant influence onto the rates. This is illustrated in Fig. 13, where both dissolution (a) and precipitation rates are shown for various values of S depicted on the curves. For dissolution the rates are sensitive to values of S below 1 cm. There is little change for higher values. In contrast the precipitation rates show a different behaviour. Here the lim- iting value of S, above which the rates stay unchanged with increasing 6, is higher by a factor of 10 (6 = 10 cm). To summarize such data, Table 2 lists the values of a and [Ca*+],, (cf. Eqn. 9) for dissolution rates with various Pco,, temperatures, E, and 6. Table 3 gives corresponding data for precipitation. These in view of our experimental results can serve as a help to estimate rates in natural systems to an accuracy of about 225%. It should be noted here that the values in Table 3 are only valid for Ca concentrations [Ca”] 5 5. 10e3 mole/L. For higher concentrations the real rates are underestimated.
6. CONCLUSION
We have measured by use of the rotating disk technique dissolution rates of calcite in the system H20 - CO2
(a)
T: lO”C, Pco,: 3x1 04atm
E : 5xlO%m
334
2 6(cm): l- 0.1 2- 0.2
1 3- 1.0
0 I I 0 2 4 6 8
Ca” concentration (10‘4mmol/cm3)
(W
5 T: 10X, Pco,: 3x10⁴atm
‘; E : 5~1O-~crn rn
?g 4- 4
5
E 3-
3
$ 0 c
$2- 2
S ._ .= ES al- 0” 1
0 I I I
1
0 1 2 3 4
Ca*+ concentration (1 0‘3mmol/cm3)
Fig. 13. Theoretical dissolution rates (a) and precipitation rates (b) for various values 6 of the turbulent core (cf. Fig. 6). The values of 6 are related to the numbers on the curve by the corresponding insets. E = 5. 10e3 cm.
- CaC03 as they occur in natural waters of low Pco,, but also for high Pco, > lo-* atm up to 1 atm, which are not likely to occur in nature. The aim of these experiments was to reveal the role of the laminar diffusion boundary layer which separates the surface of the dissolving mineral from the well-mixed bulk of the solution. Our results give clear evidence that the diffusion boundary layer across which mass transport must be effected by molecular diffusion can reduce the rates significantly. Furthermore, the slow reaction H20 + co* f H+ + HCO; plays a significant role, which so far has not been sufficiently regarded in most studies dealing with dissolution or precipitation of calcite. We have found two regions where this reaction plays a dominant role. For
0.001 0.1 0.005 0.01 0.02 0.001 1 0.005 0.01 0.02 0.001 10 0.005 0.01 0.02 0.001 100 0.005 0.01 0.02
lCa”$ IO- mmol/cm’
3.75 5.59 11.39 0.1 4.44 5.74 11.11 0.1 3.44 4.72 7.94 1.99 3.09 6.87 1.94 2.92 5.98 1.35 1.96 3.44 1.58 2.48 5.54 1.45 2.19 4.52 1.08 1.55 2.77 1.30 2.05 4.54 1.18 1.75 3.59 0.96 1.39 2.52
11.11 16.28 31.90 1 9.32 13.23 23.33 1 4.93 6.78 9.93 5.19 8.24 18.21 3.33 5.01 10.00 1.48 2.14 3.62 3.48 5.48 12.45 2.0 1 3.04 6.15 1.09 1.56 2.77 2.25 3.57 7.9 1 1.33 2.01 4.02 0.96 1.39 2.52
24.47 33.73 52.26 IO 13.55 18.40 29.41 10 4.94 7.08 9.98 9.07 14.13 27.84 3.86 5.78 11.25 1.48 2.14 3.62 5.13 8.09 16.71 2.15 3.28 6.52 1.09 1.56 2.77 2.85 4.47 9.35 1.36 2.06 4.10 0.96 1.39 2.53
31.67 40.15 56.80 100 14.36 19.47 30.30 100 4.94 7.08 9.98 10.30 15.76 29.70 3.93 5.80 11.38 1.48 2.14 3.62 5.46 8.64 17.38 2.16 3.30 6.56 1.09 1.56 2.77 2.95 4.62 9.85 1.37 2.06 4.11 0.96 1.39 2.53
6.75 6.30 5.60 10.10 9.30 8.30 17.10 16.20 14.30
2888 Z. Liu and W. Dreybrodt
Table 3. Numerical values of cy = LY (T, Pco,, t, 6), cf. Eqn 9, for calcite precipitation in the open system.
Ly (lo-1 cm/s)
P ro2 = 3 X 10m4 atm Pco, = 1 X IO-’ atm P co2 = 5 X lo-’ atm c
(cm) S (cm) 5°C 10°C 20°C 6 (cm) 5°C 10°C 20°C 6 (cm) 5°C 10°C 20°C
Pco2 < IO-* atm and thicknesses of the boundary layer identical rates. Similar results were also obtained by Buh- below lo-* cm the carbonate ions released from the solid mann and Dreybrodt ( 1985a) who showed that during disso- migrate across the boundary layer into the turbulent layer, lution from thin stagnant films with thickness below 0.1 cm where they react to HCO.7 consuming the protons delivered the dissolution rates are controlled by CO? conversion and by hydration of CO*. In this bulk controlled regime the mass transport. Consequently different minerals (marble, influence of CO2 conversion becomes evident by the depen- limestone, and a calcite singe crystal) exhibited identical dence of the rates on the thickness of the bulk layer. behaviour.
For large PC,, > 0.01 atm and thickness of the DBL above 10 -’ cm, CO2 conversion takes place in a small region adjacent to the calcite surface and almost all carbonate ions released from the solid react to HCO; in this narrow re- gion. The protons needed for this reaction are delivered by CO* molecules, diffusing from the bulk and reacting to H’ + HCO, close to the solid surface. In this case of layer control the rates are weakly dependent on the thickness of the turbulent zone, since CO*-conversion in the DBL is rate limiting. This is corroborated by the enhancement of dissolu- tion rates upon addition of carbonic anhydrase.
This has some important consequences. Many dissolution experiments using the rotating disk technique have employed a partial pressure Pcoz = 1 atm and thicknesses of the DBL between 10-j up l-10-’ cm (Herman, 1982; Herman and White, 1985). In this case rates are determined entirely by CO*-conversion, and no valid conclusion can be drawn on the dissolution mechanisms at the surface of the mineral. This is in agreement with the observation that the dissolution rates on calcite measured by Herman ( 1982) compared well to the predic,tions of our model (Dreybrodt and Buhmann, 199 1) . If CO? conversion controls the rates then one would expect no influence of the lithology of the limestone sample to the rates. Consequently we have measured rates with oth- erwise unchanged conditions for marble, for two limestone samples of Devonian origin from Guilin, and a single crystal of calcite. Within the limits of error all samples exhibited
Often the rate equation of PWP is applied to explain tield observations by employing the activities of the corresponding species measured in the bulk water. Thus one neglects the presence of the diffusion boundary layer and considerable overestimations of the rates are the consequence (Liu et al., 1995 ) . A nice example of the influence of the hydrodynamic conditions on dissolution rates in phreatic limestone caves has been given by Lauritzen ( 1986). He has shown that the dissolution rates in a cave consisting of a single phreatic conduit increased with increasing how of water. At high yields of 10 m’ s-’ the rates were higher by about 1 order of magni- tude, compared to those at yields of about 1 m3 ss’ .
It is, of course, not easy to give values for c in rivers or caves. Some estimations can be made by measuring dissolu- tion rates on gypsum samples, which have suitable shapes to fit into the geometry of the limestone surface (Opdyke et al., 1987; Dreybrodt et al., 1992). Even if this is not possible, the values of the kinetic constants can be used to give some crude estimation of the rates, which are based on a sound understanding of calcite dissolution and precipitation in such complex systems.
Acknowledgmenfs-Liu Zaihua thanks the University of Bremen, the National Nature Science Foundations of China, and the “Stiftung Constantia van 1823, Bremen” for financial support.
Editorial handling: J. D. Rimstidt
Dissolution kinetics of calcium carbonate 2889
REFERENCES
Archer D. and Maier-Reimer E. ( 1994) Effect of deep-sea sedimen- tary calcite preservation on atmospheric CO1 concentration. Nu- ture 367, 260-263.
The conversion to CO, by the slow process H+ + HCOj --t CO* + Hz0 as a rate limiting step. Geochim. Cosmochim. Acta (in press).
Ford D. C. and Williams P. W. (1989) Karst Geomorphology and Hydrology. Unwin Hyman.
Baker A. and Smart P. L. (1995) Recent flowstone growth rates: Field measurements in comparison to theoretical predictions. Chem. Geol. 122, 121-128.
Herman J. S. (1982) The dissolution kinetics of calcite, dolomite, and dolomite rocks in carbon dioxide water system. Ph.D. Thes. Pennsylvania State Univ.
Baumann J., Buhmann D., Dreybrodt W., and Schulz H. D. (1985) Herman J. S. and Lorah M. M. (1987) CO2 outgassing and calcite Calcite dissolution kinetics in porous media. Chem. Geol. 53, precipitation in Falling Spring Creak, USA. Chem. Geol. 62,251- 219-228. 262.
Beek W. .I. and Mutzall K. M. K. (1975) Transport Phenomena. Wiley.
Bemer R. A. (1980) Early Diagenesis: A Theoretical Approach. Princeton Univ. Press.
Herman J. S. and White W. B. (1985) Dissolution kinetics of dolo- mite: Effects of lithology and fluid flow velocity. Geochim. Cos- mochim. Acta 49, 2017-2026.
Boudreau B. P. and Canfield D. (1993) A comparison of closed- and open-system models for porewater pH and calcite saturation state. Geochim. Cosmochim. Acta 57, 317-334.
Buhmann D. and Dreybrodt W. (1985a) The kinetics of calcite dissolution and precipitation in geologically relevant situations of karst areas. 1. Open-system. Chem. Geol. 48, 189-211.
Buhmann D. and Dreybrodt W. (1985b) The kinetics of calcite dissolution and precipitation in geologically relevant situations of karst areas. 2. Closed-system. Chem. Geol. 53, 109-124.
Buhmann D. and Dreybrodt W. ( 1987) Calcite dissolution kinetics in the system H20-C02-CaC03 with participation of foreign ions. Chem. Geol. 64, 89-102.
Inskeep W. S. and Bloom P. R. (1985) An evaluation of rate equa- tions for calcite precipitation at p less than 0.01 atm and pH greater than 8. Geochim. Cosmochim Actu 49, 2165-2180.
Kempe S. (1977) Carbon in the rock cycle. In: The Global Carbon Cycle (ed. B. Bolin et al.), pp. 343-377. Wiley.
Kern M. D. ( 1960) The hvdration of carbon dioxide. J. Chem. Educ 37, 14-2j. +
Lauritzen S. E. ( 1986) Hydraulics and dissolution kinetics of a phre- atic conduit. Proc. 9th Intl. Gong.-Speleol. 1, 20-22.
Levich V. G. ( 1962) Physicochemical Hydrodynamics. Prentice- Hall.
Liu Z. H., Svensson U., Dreybrodt W., Yuan D. X., and Buhmann D. ( 1995) Hydrodynamic control of inorganic calcite precipitation in Huanglong Ravine, China: Field measurements and theoretical prediction of deposition rates. Geochim. Cosmochim. Acta 59, 3087-3097.
Busenbera E. and Plummer L. N. (1986) A comparative study of the dissolution and crystal growth kinetics of calcite and aragonite. In Studies in Diagenesis (ed. F. A. Mumpton); US Geol. Surv. Bull. 1578, 139-169.
Compton R. G. and Daly P. J. (1984) The dissolution kinetics of iceland spar single crystals. J. Colloid Znterface Sci. 101, 159- 166.
Compton R. G., Daly P. J., and House W. A. (1985) The dissolution of iceland spar crystals: The effect of surface morphology. J. Colloid Interface Sci. 113, 12-20.
Dreybrodt W. (1988) Processes in Karst Systems. Springer Ser. Phys. Environ.
Dreybrodt W. and Buhmann D. (1991) A mass transfer model for dissolution and precipitation of calcite from solutions in turbulent motion. Chem. Geol. 90, 107-122.
Dreybrodt W., Buhmann D., Michaelis J., and Usdoswski E. (1992) Geochemically controlled calcite precipitation by COz outgassing: Field measurements of precipitation rates to theoretical predic- tions. Chem. Geol. 97, 287-296.
Dreybrodt W., Lauckner J., Liu Z. H., Svensson U., and Buhmann D. (1996a) The kinetics of the reaction CO* + HZ0 + H+ + HCO; as one of the rate limiting steps for the dissolution of calcite in the system CO*-HZO-CaCO,. Geochim. Cosmochim. Acta 60, 3375-3381.
Dreybrodt W., Eisenlohr L., Madary B., and Ringer S. (1996b) Precipitation kinetics of calcite in the system CO*-H20-CaC03:
Opdyke B. N., Gust D., and Ledwell J. R. (1987) Mass transfer from smooth alabaster surfaces in turbulent flows. Geophys. Res. Lett. 14, 1131-1134.
Pleskov Y. V. and Filinovskii V. Y. (1976) The Rotating Disc Elec- trode. Consultants Bureau.
Plummer L. N., Wigley T. M. L., and Parkhurst D. L. (1978) The kinetics of calcite dissolution in CO,-water systems at 5-60°C and 0.0-1.0 atm CO*. Amer. J. Sci. 278, 179-216.
Reddy M. M., Plummer L. N., and Bursenberg E. (1981) Crystal growth of calcite from bicarbonate solutions at constant P,Q and 25°C: A test of calcite dissolution model. Geochim. Cosmochim. Actu 45, 1281-1289.
Schott J., Brantley S., Crerar D., Guy C., Borcsik M., and Willaime C. ( 1989) Dissolution kinetics on strained calcite. Geochim. Cos- mochim. Acta 53, 373-382.
Stryer L. (1988) Biochemistry. W. H. Freeman Co. Svensson U. and Dreybrodt W. ( 1992) Dissolution kinetics of natu-
ral calcite minerals in COT-water systems approaching calcite equilibrium. Chem. Geol. 100, 129%i45. _. - ‘-
Usdowski E. ( 1982) Reactions and eauilibria in the systems CO-- Hz0 and CaC04-C02-H20. A review. N. J. Mineral. Abh 14, 1488171.
White W. B. (1988) Geomorphology and Hydrology of Karst Ter- ruins. Oxford Univ. Press.