Embed Size (px)
Citation preview
Vol.:(0123456789)1 3
Acta Neuropathol (2017) 134:941–956 DOI 10.1007/s00401-017-1771-1
ORIGINAL PAPER
Distinct molecular profile of diffuse cerebellar gliomas
Masashi Nomura1,2 · Akitake Mukasa1 · Genta Nagae2 · Shogo Yamamoto2 · Kenji Tatsuno2 · Hiroki Ueda2 · Shiro Fukuda2 · Takayoshi Umeda2 · Tomonari Suzuki3 · Ryohei Otani4 · Keiichi Kobayashi5 · Takashi Maruyama6 · Shota Tanaka1 · Shunsaku Takayanagi1 · Takahide Nejo1 · Satoshi Takahashi1 · Koichi Ichimura7 · Taishi Nakamura8 · Yoshihiro Muragaki6 · Yoshitaka Narita9 · Motoo Nagane5 · Keisuke Ueki4 · Ryo Nishikawa3 · Junji Shibahara10 · Hiroyuki Aburatani2 · Nobuhito Saito1
Received: 18 June 2017 / Revised: 21 August 2017 / Accepted: 21 August 2017 / Published online: 29 August 2017 © The Author(s) 2017. This article is an open access publication
a truncating mutation in SETD2 (n = 4), which resulted in loss of H3K36 trimethylation and was mutually exclu-sive with H3F3A K27M mutation (n = 3), suggesting that epigenetic dysregulation may lead to DCG tumorigenesis. Alterations that cause loss of p53 function including TP53 mutation (n = 9), PPM1D mutation (n = 2), and a novel type of PPM1D fusion (n = 1), were also frequent. On the other hand, mutations and copy number changes commonly observed in cerebral gliomas were infrequent. DNA meth-ylation profile analysis demonstrated that all DCGs except for those with H3F3A mutations were categorized in the “RTK I (PDGFRA)” group, and those DCGs had a gene expression signature that was highly associated with PDG-FRA. Furthermore, compared with the data of 315 gliomas derived from different brain regions, promoter methylation
Abstract Recent studies have demonstrated that tumor-driving alterations are often different among gliomas that originated from different brain regions and have underscored the importance of analyzing molecular characteristics of gliomas stratified by brain region. Therefore, to elucidate molecular characteristics of diffuse cerebellar gliomas (DCGs), 27 adult, mostly glioblastoma cases were analyzed. Comprehensive analysis using whole-exome sequencing, RNA sequencing, and Infinium methylation array (n = 17) demonstrated their distinct molecular profile compared to gliomas in other brain regions. Frequent mutations in chro-matin-modifier genes were identified including, noticeably,
Electronic supplementary material The online version of this article (doi:10.1007/s00401-017-1771-1) contains supplementary material, which is available to authorized users.
* Akitake Mukasa [email protected]
* Hiroyuki Aburatani [email protected]
1 Department of Neurosurgery, Graduate School of Medicine, The University of Tokyo, 7-3-1 Hongo, Bunkyo-ku, Tokyo 113-8655, Japan
2 Genome Science Division, Research Center for Advanced Science and Technology (RCAST), The University of Tokyo, 4-6-1 Komaba, Meguro-ku, Tokyo 153-8904, Japan
3 Department of Neuro-Oncology/Neurosurgery, Saitama International Medical Center, Saitama Medical University, 1397-1 Yamane, Hidaka-shi, Saitama 350-1298, Japan
4 Department of Neurosurgery, Dokkyo Medical University, 880 Kitakobayashi, Mibu-machi, Shimotsuga-gun, Tochigi 321-0293, Japan
5 Department of Neurosurgery, Kyorin University Faculty of Medicine, 6-20-2 Shinkawa, Mitaka, Tokyo 181-8611, Japan
6 Department of Neurosurgery, Tokyo Women’s Medical University, 8-1, Kawada-cho, Shinjuku-ku, Tokyo 162-8666, Japan
7 Division of Brain Tumor Translational Research, National Cancer Center Research Institute, 5-1-1 Tsukiji, Chuo-ku, Tokyo 104-0045, Japan
8 Department of Neurosurgery, Graduate School of Medicine, Yokohama City University, 3-9, Fukuura, Kanazawa-ku, Yokohama 236-0004, Japan
9 Department of Neurosurgery and Neuro-Oncology, National Cancer Center Hospital, 5-1-1 Tsukiji, Chuo-ku, Tokyo 104-0045, Japan
10 Department of Pathology, Kyorin University Faculty of Medicine, 6-20-2 Shinkawa, Mitaka, Tokyo 181-8611, Japan
942 Acta Neuropathol (2017) 134:941–956
1 3
of transcription factors genes associated with glial devel-opment showed a characteristic pattern presumably reflect-ing their tumor origin. Notably, SOX10, a key transcription factor associated with oligodendroglial differentiation and PDGFRA regulation, was up-regulated in both DCG and H3 K27M-mutant diffuse midline glioma, suggesting their developmental and biological commonality. In contrast, SOX10 was silenced by promoter methylation in most cer-ebral gliomas. These findings may suggest potential tailored targeted therapy for gliomas according to their brain region, in addition to providing molecular clues to identify the region-related cellular origin of DCGs.
Keywords Glioma · Cerebellum · Genomics · Gene expression · DNA methylation
Introduction
Diffuse glioma in the cerebellum is infrequent, accounting for 0.6–3.3% of all gliomas [1, 10, 18]. Previous studies reported that patients with diffuse cerebellar glioma (DCG) are younger in general, and that DCGs have a relatively smaller tumor volume compared to cerebral gliomas [1, 18].
Recent comprehensive genetic analysis of gliomas dem-onstrated that common alterations that contribute to tumo-rigenesis differ according to the original tumor region in the central nervous system as well as with the patient’s age [47]. For example, a K27M mutation in H3F3A, which encodes the replication-independent histone 3 variant H3.3, is pre-dominantly found in pediatric and young adult high-grade gliomas located in a midline structure such as the brainstem, thalamus, or spinal cord, whereas the G34R/V mutation is associated with adolescent glioblastoma (GBM) in cerebral hemispheres [2, 16, 43, 48]. Ependymoma, a different histo-logical type of glioma, was also demonstrated to have a dif-ferent molecular profile according to the anatomical region of the original tumor; oncogenic fusions involving RELA or YAP1 were generally seen in supratentorial ependymomas, whereas posterior fossa ependymomas had an extremely low number of mutations, and their pediatric subset showed a typical DNA methylation pattern [26, 31, 32]. Importantly, tumors of different molecular backgrounds show different responses to therapy, leading to different prognoses. Further-more, identification of tumor-driving molecular alterations in each case would allow selection of relevant molecular targeting drugs that may become available through exten-sive research in the era of precision medicine. Thus, it is of increasing importance to clarify the molecular back-ground of tumors that may have specific biological traits. However, DCGs, which may be biologically different from common types of gliomas such as those located in cerebral hemispheres, have not been well characterized molecularly,
partly due to their relative rarity. As a consequence, it is still unclear whether the diagnostic or therapeutic approaches for cerebral gliomas are applicable to cerebellar gliomas.
To determine the characteristics of cerebellar glioma, we here performed comprehensive molecular profiling of these gliomas including whole-exome sequencing (WES), Infin-ium methylation array, and RNA sequencing and compared their profile with that of gliomas derived from other ana-tomical regions. We demonstrated that DCGs have a region-related characteristic molecular profile that may shed light on the cellular origin of DCG, and also could be specifically targeted as a future treatment strategy.
Materials and methods
Clinical samples
Clinical samples were obtained from individuals who under-went surgery at The University of Tokyo Hospital, Kyorin University Hospital, Dokkyo Medical University Hospital, Saitama Medical University International Medical Center, Tokyo Women’s Medical University Hospital, Yokohama City University Hospital, and the National Cancer Center Hospital, with the patient’s informed consent. This study was approved by the ethics committees of each institute.
We only used samples that were radiographically con-fined to the cerebellum, and cases that had multiple lesions located outside of the cerebellum or had a tumor extend-ing to the brainstem were excluded (Online Resource 1: Fig. S1). Samples were histologically diagnosed according to 2016 World Health Organization (WHO) classification by an experienced neuropathologist in each hospital and were further reviewed by a senior neuropathologist (J.S.) [25]. Of the 27 DCGs available in this study, 22 were freshly fro-zen tumors and five were formalin-fixed paraffin-embedded (FFPE) tissues. Of the 22 freshly frozen tumors, matched normal blood was obtained in 17 cases. Only these 17 sam-ples could be analyzed by WES and methylation array, and such comprehensive analyses were not possible for the other 10 cases, because only a small amount or low-quality DNA was obtained from these remaining cases.
For comparison of the gene expression profile, eight cer-ebral GBM samples were also analyzed. Detailed informa-tion of the samples used in this study is provided in Online Resource 2: Table S1.
DNA and RNA extraction
The DNeasy Blood and Tissue kit (Qiagen) was used to extract DNA from tumor tissue and paired normal blood according to the manufacturer’s instructions. The RNeasy Mini kit (Qiagen) was used to extract RNA from freshly
943Acta Neuropathol (2017) 134:941–956
1 3
frozen tumor tissue. The Qubit fluorometer (Life Technol-ogies) was used to measure the concentration of double-stranded DNA. The Tape station (Agilent Technologies) was used to measure the quality of RNA.
Sanger sequencing
Sanger sequencing was performed to detect the hotspot mutation of IDH1 (R132), IDH2 (R172), TERT promoter (C228 and C250), and H3F3A (K27). The oligo primers used for PCR amplification of these genes and the annealing tem-perature for each primer set are shown in Online Resource 2: Table S2. The high-fidelity DNA polymerase KOD-Plus-Neo (Toyobo) was used for PCR, and optimized thermal conditions were used. For each primer set, the PCR ampli-con was gel-purified and then sequenced. Sanger sequencing was also performed for validation of mutations identified by WES.
Immunohistochemistry
Immunohistochemical analysis was performed with 4-μm-thick FFPE tumor tissue sections. Briefly, after depar-affinization, antigen retrieval was performed for 30 min in citrate buffer (pH 6.0). The slides were then incubated with the following primary antibodies: H3 K27M (Millipore, ABE419, 1:500), H3K36 trimethylation (Abcam, ab9050, 1:2000).
WES
WES was performed for 17 DCGs and matched blood sam-ples (Online Resource 2: Table S1) as previously described [3, 20, 51]. In brief, DNA was fragmented using the Covaris SS Ultrasonicator. Exome capture was performed with Agi-lent SureSelect V6 plus COSMIC (Agilent Technologies). Each sample was sequenced with the HiSeq 2000 (Illumina) as 100-bp pair-ended reads. Sequencing data are summa-rized in Online Resource 2: Table S3. The Burrows–Wheeler Aligner (BWA) and NovoAlign software (Novocraft Tech-nologies) were used to align next-generation sequencing reads to the human reference genome GRCh37/hg19. After removal of PCR duplicates, the Short-Read Micro re-Aligner (SRMA) [17] was used to improve variant discovery through local realignments.
Mutation detection and copy number analysis
To detect somatic mutations, copy number variations, and tumor purity, we used integrated genotyper software (karki-nos: http://github.com/genome-rcast/karkinos) as previ-ously reported [3, 20, 51]. For each sample, tumor purity was estimated from allelic imbalance in the matched tumor
and normal samples with a program that examined the allelic fractions of heterozygous single nucleotide polymorphisms (SNPs) in regions of loss of heterozygosity (LOH). This algorithm is similar to that described in a previous report from another group [9]. In some cases where LOH regions were not detected, tumor content ratios were estimated from the distribution of mutant allele frequencies. When both cal-culations failed to estimate tumor cellularity, we presumed it to be 0.2 for the correction of mutant allele frequencies. Somatic mutant allele frequencies adjusted by estimated tumor content ratios, that were ≥15% were retained. Arti-facts originating from errors in the sequencing and map-ping were also filtered by heuristic filtering and Fisher’s test. To eliminate germline variations in this study, we carried out comparative analyses using paired tumor and normal samples from the same cases for all the samples analyzed, and we extracted the somatic events detected only in tumor tissues. Mutations were validated by Sanger sequencing or RNA sequencing. For validation of mutations, variant allele reads of each RNA-sequencing BAM files were counted using SAMtools v1.2 mpileup (http://www.htslib.org/). Sanger sequencing was also performed for the validation.
To analyze copy number changes, the read depth was compared between normal and tumor for each capture tar-get region. After normalizing by the number of total reads and the GC content bias, the tumor/normal depth ratio was calculated, and values were smoothed using a moving aver-age. Copy number peaks were then estimated using wavelet analysis, and each peak was approximated using complex Gaussian models. A hidden Markov model with calculated Gaussian models was constructed, and copy number peaks were linked to genomic regions. The allelic imbalance for each copy number peak was then calculated, and imbalance information and peak distance were further analyzed by model fitting, yielding integer copy number annotation and tumor purity.
RNA sequencing
RNA sequencing was performed as previously described [22] for 14 DCG and eight cerebral GBM samples that had RNA of sufficient quality and quantity (Online Resource 2: Table S1). An RNA-sequencing library was prepared using the TruSeq Stranded mRNA LT Sample Prep Kit (Illumina) according to the manufacturer’s protocol. Briefly, 1 µg of total RNA was purified using oligo dT magnetic beads, and poly A+RNA was fragmented at 94 °C for 2 min. cDNA was synthesized using SuperScript II (Invitrogen), and adapter-ligated cDNA was amplified with 12 cycles of PCR. Each library was sequenced using HiSeq 2000, loading four librar-ies per lane of the flowcell, which produced an average of 59.2 million reads of 101-cycle reads for each sample. RNA-sequencing reads were aligned to a human transcriptome
944 Acta Neuropathol (2017) 134:941–956
1 3
database (UCSC genes) and the reference genome (GRCh37/hg19) using the BWA. If multiple isoforms existed in each annotated gene, the longest isoform was selected. After the transcript coordinate was converted to the genomic position, an optimal mapping result was chosen either from transcript or genome mapping by comparing the minimal edit distance to the reference. Local realignment was then performed within an in-house short reads aligner with small seed size (k = 11). Finally, fragments per kilobase of exon per mil-lion fragment mapped (FPKM) values were calculated for each UCSC gene while considering strand-specific informa-tion. The gene set used in the Gene Set Enrichment Analysis (GSEA) was composed of 320 genes that were up-regulated in “PDGFRA-amplified GBMs” and used in previous reports [34, 38]. The gene set of “Proneural GBMs” was obtained from the GSEA website (http://www.broadinstitute.org/gsea/index.jsp).
Fusion transcript detection and validation
Fusion analysis was performed with RNA-sequencing data of DCGs in this study and data of 173 GBM samples obtained from The Cancer Genome Atlas (TCGA) web-site (https://tcga-data.nci.nih.gov). Fastq files from RNA sequencing were used to detect fusion genes using Geno-mon-fusion (https://genomon-project.github.io/Genomon-PagesR/) with default parameters. At least 12 bases matching both sides of the fusion in each read and more than four reads spanning the candidate breakpoint were required to call the fusion transcript. When two sides resided on the same chromosome, we chose a minimum distance of 100,000 bp to reduce read-through transcripts. To validate fusion transcripts, tumor RNA was reverse-transcribed using Superscript III (Invitrogen) according to the manufacturer’s instructions, and the obtained cDNAs were used as PCR templates. Oligo primers for PCR amplification of the three fusion isoforms were designed to amplify only the fusion transcript. Designed primers, the annealing temperature for each set, and the estimated size of the PCR products are shown in Online Resource 2: Table S2. PCR was performed with KOD-Plus-Neo, and optimized thermal conditions were used. PCR products were evaluated on an agarose gel, and purified products were sequenced to validate the presence of the fusion product.
Microarray data processing
The gene expression microarray data (Affymetrix U133 plus 2.0 platform) reported by Sturm et al. were obtained from National Center for Biotechnology Information (NCBI)’s Gene Expression Omnibus (GEO, http://www.ncbi.nlm.nih.gov/geo) and are accessible through GEO Series accession number GSE36245. These data were normalized to examine
the correlation between SOX10 promoter methylation and expression [48]. Overwrapping expression data with meth-ylation data (GSE36278) was used for correlation analysis.
Methylation analysis
The Infinium MethylationEpic BeadChip (Illumina) was used to analyze the genome-wide methylation profile of 17 DCGs (Online Resource 2: Table S1) and one non-neoplastic frontal lobe sample as a control following the manufacturer’s instructions. The beta-value was calculated for each CpG site using the following equation as previously reported [3]. Intensity of the methylated allele (M)/[intensity of the unmethylated allele (U) + intensity of the methylated allele (M) + 100] [5]. This beta-value ranged from 0 (unmethyl-ated) to 1 (fully methylated) and reflected the methylation level of each CpG site represented by the probe.
For clustering analysis of methylation data, the Methyla-tion450K BeadChip methylation data from 210 high-grade gliomas and normal cerebellum samples (two normal adult brains and four normal fetal brains) reported by Sturm et al. were obtained from GSE36278 and TCGA website (https://tcga-data.nci.nih.gov) [48]. The information of the tumor region of TCGA samples was obtained from pathological reports in cBioPortal (http://www.cbioportal.org). Meth-ylation data of 224 gliomas including the 14 DCGs in this study were used for clustering analysis. Because three tumor samples (DCG_01, 13, and 14) were determined to have a low tumor content by exome WES data, they were excluded from the clustering analysis. After excluding probes target-ing the X and Y chromosomes, and probes associated with an SNP according to TCGA, extraction of common probes between EPIC and 450K probes was performed, and the remaining 300,870 probes in total were used for the follow-ing analysis. The standard deviation of beta-values for each probe was calculated, and the top 8000 most variable probes were selected. Unsupervised consensus clustering was then performed utilizing the R package (ConsensusClusterPlus), and the k-means algorithm (10 random starting sets, maxi-mum of 1000 iterations) was used to calculate the consensus matrix; k = 6 was selected as previously reported [48].
Probes within 1500 bp from the transcription start site (TSS) of protein-coding transcripts (UCSC genes and GRCh37/hg19) were considered to be located in a promoter region, and the mean beta-value of all probes in each pro-moter for each sample was calculated to represent the pro-moter methylation status of each gene. To identify genes showing a significantly different methylation status in the promoter between 18 DCGs and 123 cerebral gliomas, the mean beta-value of each promoter for both groups was cal-culated. Welch’s t test and the Benjamini–Hochberg method were used to calculate p values and q values, respectively. A promoter of a gene was considered to be significantly
945Acta Neuropathol (2017) 134:941–956
1 3
methylated when the following criteria were fulfilled: q val-ues <0.01 and difference >0.2. To validate promoter meth-ylation of significantly methylated genes with additional data, the Methylation450K BeadChip methylation data in Fontebasso et al. (GSE55712), Zhang et al. (GSE50774), and Aihara et al. (JGAS00000000106) [2, 14, 55] were used.
Motif analysis
A total of 224 samples from the studies of Sturm et al. and from TCGA in addition to the samples of the current study were divided into three groups according to SOX10 promoter methylation levels (i.e., “SOX10 promoter hypomethyla-tion” group, beta-value <0.5; “SOX10 promoter interme-diate methylation” group, 0.5 ≤ beta-value <0.7; “SOX10 promoter hypermethylation” group, beta-value ≥0.7) [48]. To select significantly hypomethylated probes in distal ele-ments (distance from TSS >1500 bp) of the “SOX10 pro-moter hypomethylation” group compared to the “SOX10 promoter hypermethylation” group, the average beta-values of each probe for each group were calculated. P values were calculated using Welch’s t test, and the Benjamini–Hochberg method was used to calculate q values. We chose relatively strict criteria of q values <1 × 10¹⁰ and difference <−0.25 to select nearly top 1000 probes, and a final total of 1070 probes was selected. Windows of 1000 bp around these probes were searched for motifs. De novo motif discovery was performed by using HOMER (v4.9 2-20-2017).
Statistical analysis
Statistical comparisons of mutated genes were performed using Fisher’s exact test. Overall survival curves were calcu-lated according to the Kaplan–Meier method, and univariate assessment of Kaplan–Meier plots were performed using the log-rank test. Statistical comparisons of gene expression were performed using the Wilcoxon rank-sum test. P values less than 0.05 were considered statistically significant.
Results
Characteristics of DCGs
We analyzed 27 diffuse gliomas that originated from the cerebellum radiographically (Online Resource 1: Fig. S1). All patients were adults (median age 64 years, range 28–81 years), and WHO histological grades were grade IV in 19 cases, grade III in five, and grade II in three. Detailed patient characteristics are shown in Online Resource 2: Table S1.
The prevalence of common driver gene mutations observed in cerebral gliomas was examined in these 27
DCGs by direct Sanger sequencing (Online Resource 2: Table S4). We found no IDH1/2 mutation and only one TERT promoter mutation (3.7%) in these DCGs, indicating their distinctive molecular background compared to cerebral gliomas. Although DCGs are located near the brainstem, H3F3A K27M mutations were detected in only three cases (11%). We further performed H3 K27M staining for all sam-ples to examine whether K27M was present in other H3 vari-ants. Although H3F3A K27M was detected in three cases with Sanger sequencing and these three cases were positive with immunohistochemical staining, all other cases showed negative staining (Online Resource 1: Fig. S2).
Mutation analysis by WES
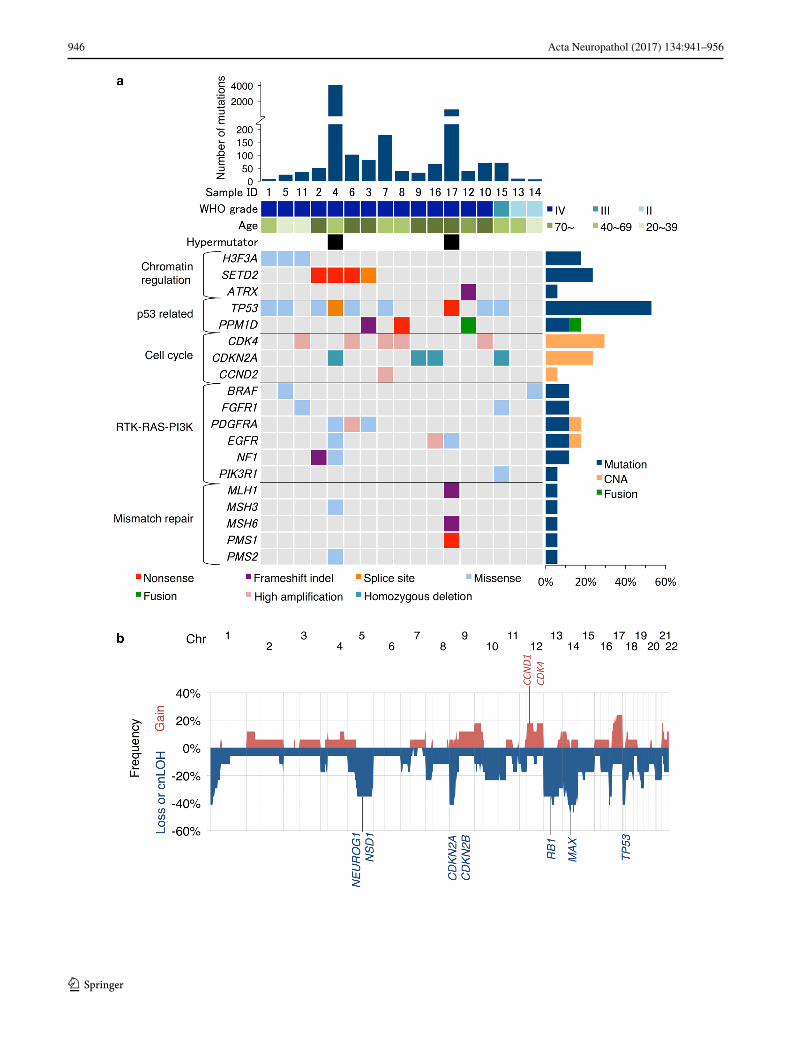
To explore driver mutations of DCGs, WES was performed using Illumina HiSeq. Seventeen tumors (14 WHO grade IV, one grade III, and two grade II) and matched normal blood samples were analyzed (Online Resource 2: Table S1). Mean coverage of the coding sequence for tumors and nor-mal blood samples was 122.3× and 97.7×, respectively, with 96.8 and 96.6%, respectively, of bases covered more than 20× (Online Resource 2: Table S3). The tumor content ratio as calculated by the karkinos computational pipeline had a mean value of 61.0%, ranging from 12.0 to 91.3% (Online Resource 2: Table S5). In total, 17,682 tumor-specific somatic mutations were identified, of which 5735 (32.4%) were non-synonymous (Online Resource 2: Table S6). For validation of mutation detection, each position in matched RNA-sequencing reads was examined. Of all positions where non-synonymous mutation was detected, 3021 (2952 substitutions and 69 indels) positions had more than 10 reads in RNA sequencing, and 2647 (2605 substitutions and 42 indels) positions (87.6%) had the same mutation reads, indi-cating a reasonably high reliability of the WES consider-ing the limited sensitivity of RNA sequencing in detecting mutations. Two cases (DCG_04 and 17) had higher num-bers of mutations with loss-of-function mutations in mis-match repair genes, indicating that they were hypermutators (Fig. 1a). The total number of non-synonymous mutations in other non-hypermutator cases was 818 (average 54.5, range 7–178), which included less than 20% of truncating muta-tions (Online Resource 1: Fig. S3).
The mutational landscape of the 17 DCGs is shown in Fig. 1a and Online Resource 1: Fig. S4. All 35 mutations including five indels in Fig. 1a were validated either by RNA-sequencing reads (28 mutations) or Sanger sequenc-ing (seven mutations) (Online Resource 1: Fig. S5). Among genes related to chromatin regulation, the H3F3A K27M mutation, which constitutes a diagnostic criterion for H3 K27M-mutant diffuse midline glioma in the 2016 WHO classification, was observed in three DCGs. All three had pathological features of GBM and were not particularly
946 Acta Neuropathol (2017) 134:941–956
1 3
947Acta Neuropathol (2017) 134:941–956
1 3
located near the brainstem compared to other DCGs (Online Resource 1: Fig. S1). Notably, loss-of-function mutations in SETD2 were found in four GBM cases, and SETD2 mutations were mutually exclusive with the H3F3A K27M mutation. SETD2 regulates chromatin function by methyl-ating histone H3K36. However, no mutation in other genes responsible for H3K36 mono- or di-methylation such as NSD1-3, ASH1L, or SMYD2 was detected except for in the two hypermutator cases.
Disruption of p53 function was common in DCGs, and TP53 was the most frequently mutated gene (58.9%). Acti-vation of PPM1D suppresses p53 function [41, 55]. The activating truncation mutation of PPM1D was found in two cases, and was mutually exclusive with TP53 mutation.
FGFR1 mutation in the tyrosine kinase domain, which has been reported in pilocytic astrocytomas, diffuse brain-stem gliomas, and thalamic gliomas, was identified in two DCGs (DCG_11 and _15) [14, 19]. Both cases had p.K656E mutation, and p.V472M mutation was also found in DCG_11. FGFR1 mutation harboring p.K656E, whose bio-logical effect in promoting tumor growth has been demon-strated, has been reported in pediatric diffuse midline glioma H3 K27M-mutant and pilocytic astrocytomas [14, 19, 24]. BRAF mutations, which included the p.V600E mutation in DCG_14, were detected in two cases. PDGFRA extracellular domain mutations, which potentially disrupt ligand inter-action, were identified in two cases [38]. Although EGFR mutations were found in two hypermutators (p.E451K in DCG_04 and p.T680M in DCG_17), these mutations were not located at positions where mutation has been frequently observed in GBMs [6].
Copy number aberrations (CNAs)
Copy number variations estimated from WES data revealed frequent loss of chromosomes 1p, 5q, 9p, 13, 14, 17p, and 18p (Fig. 1b; Online Resource 1: Fig. S6). Homozy-gous deletion of CDKN2A located on chromosome 9p was observed in four cases. Also, focal high amplification of CDK4 (n = 5), CCND2 (n = 1), EGFR (n = 1), and PDG-FRA (n = 1) was observed (Fig. 1a). Amplification of EGFR, gain of chromosome 7, and loss of chromosome 10 were
infrequent in adult DCGs compared to large-scale genetic analysis data of GBMs [6].
SETD2 mutation and H3K36 trimethylation
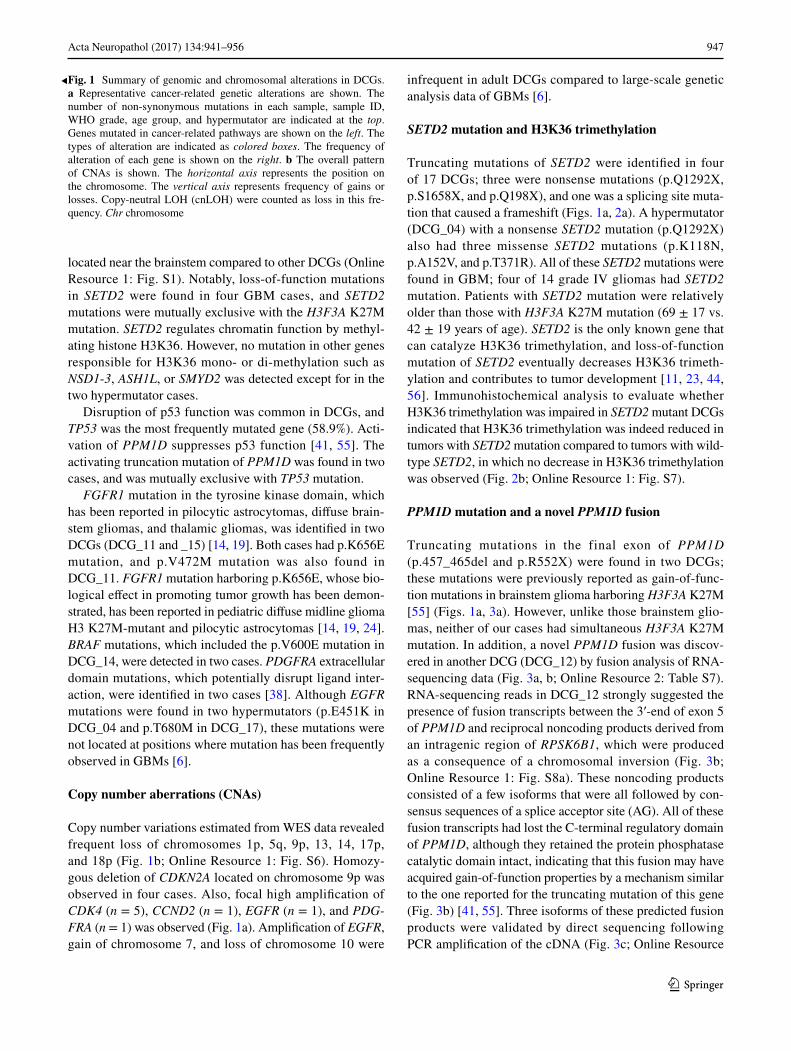
Truncating mutations of SETD2 were identified in four of 17 DCGs; three were nonsense mutations (p.Q1292X, p.S1658X, and p.Q198X), and one was a splicing site muta-tion that caused a frameshift (Figs. 1a, 2a). A hypermutator (DCG_04) with a nonsense SETD2 mutation (p.Q1292X) also had three missense SETD2 mutations (p.K118N, p.A152V, and p.T371R). All of these SETD2 mutations were found in GBM; four of 14 grade IV gliomas had SETD2 mutation. Patients with SETD2 mutation were relatively older than those with H3F3A K27M mutation (69 ± 17 vs. 42 ± 19 years of age). SETD2 is the only known gene that can catalyze H3K36 trimethylation, and loss-of-function mutation of SETD2 eventually decreases H3K36 trimeth-ylation and contributes to tumor development [11, 23, 44, 56]. Immunohistochemical analysis to evaluate whether H3K36 trimethylation was impaired in SETD2 mutant DCGs indicated that H3K36 trimethylation was indeed reduced in tumors with SETD2 mutation compared to tumors with wild-type SETD2, in which no decrease in H3K36 trimethylation was observed (Fig. 2b; Online Resource 1: Fig. S7).
PPM1D mutation and a novel PPM1D fusion
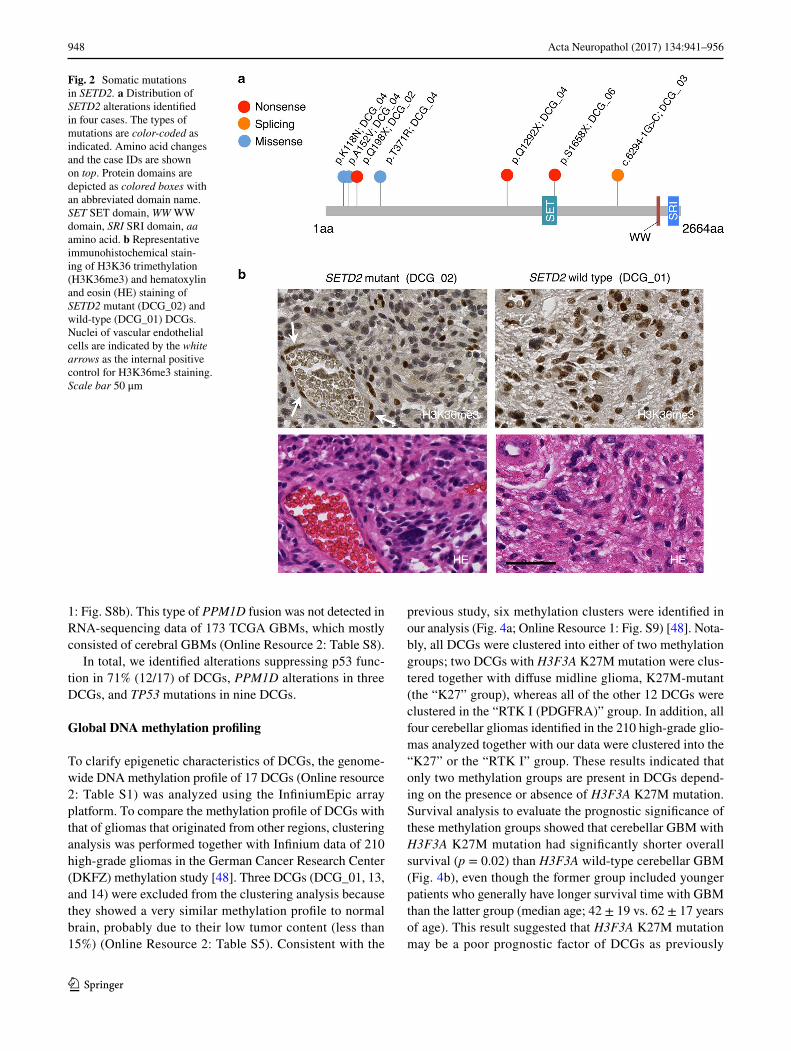
Truncating mutations in the final exon of PPM1D (p.457_465del and p.R552X) were found in two DCGs; these mutations were previously reported as gain-of-func-tion mutations in brainstem glioma harboring H3F3A K27M [55] (Figs. 1a, 3a). However, unlike those brainstem glio-mas, neither of our cases had simultaneous H3F3A K27M mutation. In addition, a novel PPM1D fusion was discov-ered in another DCG (DCG_12) by fusion analysis of RNA-sequencing data (Fig. 3a, b; Online Resource 2: Table S7). RNA-sequencing reads in DCG_12 strongly suggested the presence of fusion transcripts between the 3′-end of exon 5 of PPM1D and reciprocal noncoding products derived from an intragenic region of RPSK6B1, which were produced as a consequence of a chromosomal inversion (Fig. 3b; Online Resource 1: Fig. S8a). These noncoding products consisted of a few isoforms that were all followed by con-sensus sequences of a splice acceptor site (AG). All of these fusion transcripts had lost the C-terminal regulatory domain of PPM1D, although they retained the protein phosphatase catalytic domain intact, indicating that this fusion may have acquired gain-of-function properties by a mechanism similar to the one reported for the truncating mutation of this gene (Fig. 3b) [41, 55]. Three isoforms of these predicted fusion products were validated by direct sequencing following PCR amplification of the cDNA (Fig. 3c; Online Resource
Fig. 1 Summary of genomic and chromosomal alterations in DCGs. a Representative cancer-related genetic alterations are shown. The number of non-synonymous mutations in each sample, sample ID, WHO grade, age group, and hypermutator are indicated at the top. Genes mutated in cancer-related pathways are shown on the left. The types of alteration are indicated as colored boxes. The frequency of alteration of each gene is shown on the right. b The overall pattern of CNAs is shown. The horizontal axis represents the position on the chromosome. The vertical axis represents frequency of gains or losses. Copy-neutral LOH (cnLOH) were counted as loss in this fre-quency. Chr chromosome
◂
948 Acta Neuropathol (2017) 134:941–956
1 3
1: Fig. S8b). This type of PPM1D fusion was not detected in RNA-sequencing data of 173 TCGA GBMs, which mostly consisted of cerebral GBMs (Online Resource 2: Table S8).
In total, we identified alterations suppressing p53 func-tion in 71% (12/17) of DCGs, PPM1D alterations in three DCGs, and TP53 mutations in nine DCGs.
Global DNA methylation profiling
To clarify epigenetic characteristics of DCGs, the genome-wide DNA methylation profile of 17 DCGs (Online resource 2: Table S1) was analyzed using the InfiniumEpic array platform. To compare the methylation profile of DCGs with that of gliomas that originated from other regions, clustering analysis was performed together with Infinium data of 210 high-grade gliomas in the German Cancer Research Center (DKFZ) methylation study [48]. Three DCGs (DCG_01, 13, and 14) were excluded from the clustering analysis because they showed a very similar methylation profile to normal brain, probably due to their low tumor content (less than 15%) (Online Resource 2: Table S5). Consistent with the
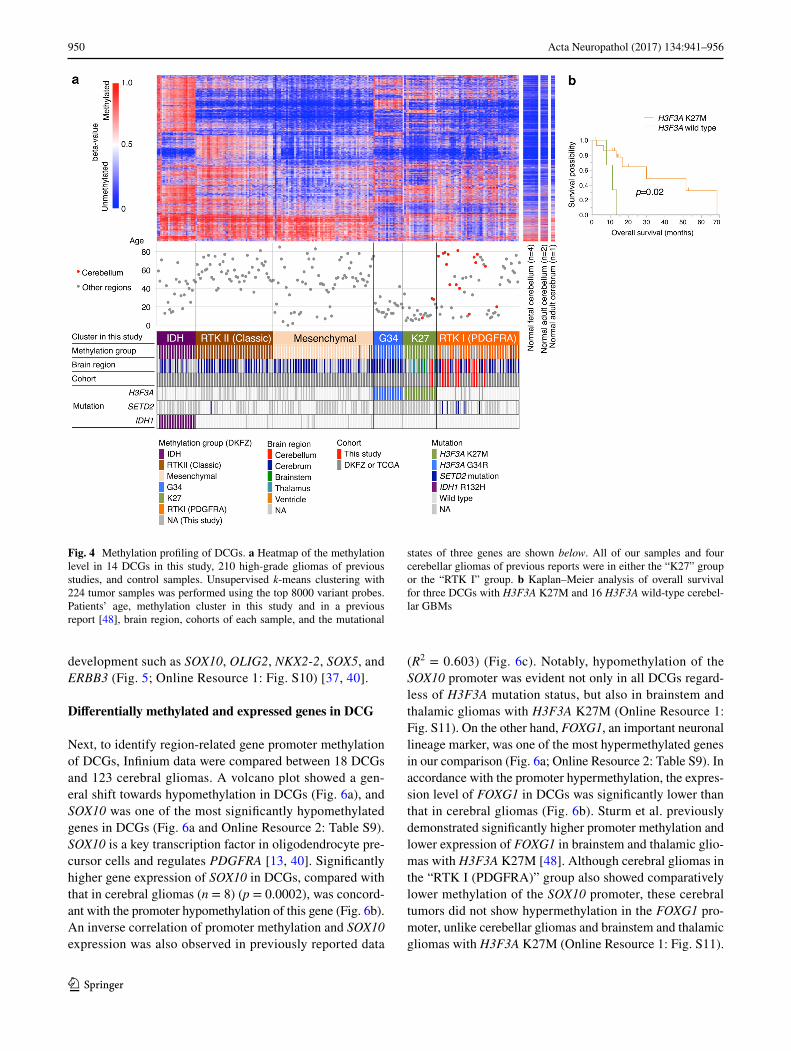
previous study, six methylation clusters were identified in our analysis (Fig. 4a; Online Resource 1: Fig. S9) [48]. Nota-bly, all DCGs were clustered into either of two methylation groups; two DCGs with H3F3A K27M mutation were clus-tered together with diffuse midline glioma, K27M-mutant (the “K27” group), whereas all of the other 12 DCGs were clustered in the “RTK I (PDGFRA)” group. In addition, all four cerebellar gliomas identified in the 210 high-grade glio-mas analyzed together with our data were clustered into the “K27” or the “RTK I” group. These results indicated that only two methylation groups are present in DCGs depend-ing on the presence or absence of H3F3A K27M mutation. Survival analysis to evaluate the prognostic significance of these methylation groups showed that cerebellar GBM with H3F3A K27M mutation had significantly shorter overall survival (p = 0.02) than H3F3A wild-type cerebellar GBM (Fig. 4b), even though the former group included younger patients who generally have longer survival time with GBM than the latter group (median age; 42 ± 19 vs. 62 ± 17 years of age). This result suggested that H3F3A K27M mutation may be a poor prognostic factor of DCGs as previously
Fig. 2 Somatic mutations in SETD2. a Distribution of SETD2 alterations identified in four cases. The types of mutations are color-coded as indicated. Amino acid changes and the case IDs are shown on top. Protein domains are depicted as colored boxes with an abbreviated domain name. SET SET domain, WW WW domain, SRI SRI domain, aa amino acid. b Representative immunohistochemical stain-ing of H3K36 trimethylation (H3K36me3) and hematoxylin and eosin (HE) staining of SETD2 mutant (DCG_02) and wild-type (DCG_01) DCGs. Nuclei of vascular endothelial cells are indicated by the white arrows as the internal positive control for H3K36me3 staining. Scale bar 50 μm
949Acta Neuropathol (2017) 134:941–956
1 3
demonstrated in pediatric diffuse intrinsic pontine glioma [21].
Gene expression profiling
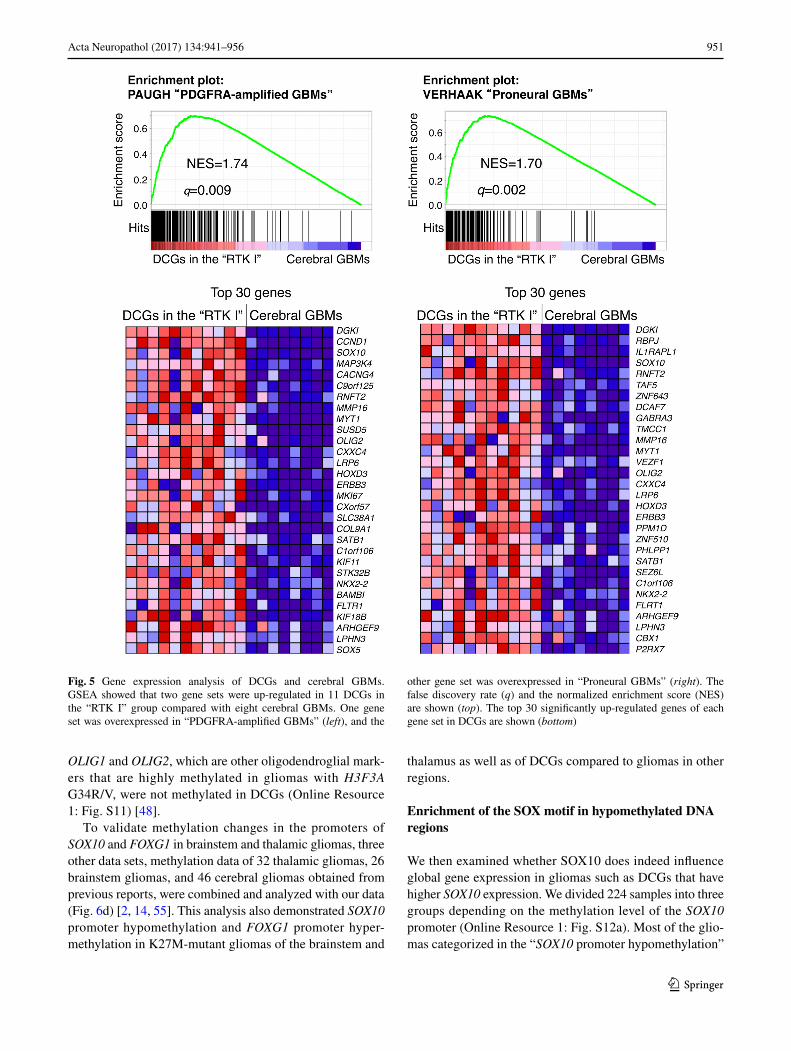
Because all DCGs without H3 K27M mutation in this study were clustered in the “RTK I” methylation group, we next examined whether DCGs in this “RTK I” group have a similar gene expression pattern to other gliomas in this group, which often have PDGFRA amplification [48]. Gene Set Enrichment Analysis demonstrated that com-pared with adult cerebral GBMs (n = 8) that we analyzed
by RNA sequencing, DCGs in the “RTK I” group (n = 11) were enriched for the gene set associated with the signature of “PDGFRA-amplified GBMs” (q = 0.009, normalized enrichment score (NES) = 1.74) and of “Proneural GBMs” (q = 0.002, NES = 1.70) described in the TCGA study (Fig. 5) [34, 52]. A similar trend in gene set enrichment was also obtained even when DCGs in both the “RTK I” group and the “K27” group (n = 14) were compared with cerebral GBMs (n = 8) (Online Resource 1: Fig. S10). Significantly up-regulated genes in these DCGs included transcriptional factors important for oligodendroglial
Fig. 3 Gain-of-function mutations and fusion PPM1D. a Distribu-tion of PPM1D alterations identified in DCGs. The types of muta-tions and a fusion are color-coded as indicated. The protein phos-phatase domain is depicted as a colored box. All alterations were in the C-terminal domain without affecting the protein phosphatase domain. Amino acid changes and case IDs are shown on top. Chr chromosome, aa amino acid. b Scheme of a chromosomal inversion in DCG_12. The new oncogenic transcript lost the C-terminal domain in PPM1D exon 6, leaving the protein phosphatase domain in exons
1–5, which underwent fusion with an intragenic region of RPSK6B1 as a consequence of a chromosomal inversion, giving rise to three fusion isoforms as shown. c Validation PCR for isoform 1 of the PPM1D-noncoding (antisense RPS6KB1 isoform 1) fusion. The PCR primers were designed to specifically amplify fusion products (top). A PCR band of the estimated size was detected in DCG_12 (middle). In the negative control lane (N), PCR product was amplified without template DNA and electrophoresed. The predicted sequence was con-firmed by Sanger sequencing (bottom)
950 Acta Neuropathol (2017) 134:941–956
1 3
development such as SOX10, OLIG2, NKX2-2, SOX5, and ERBB3 (Fig. 5; Online Resource 1: Fig. S10) [37, 40].
Differentially methylated and expressed genes in DCG
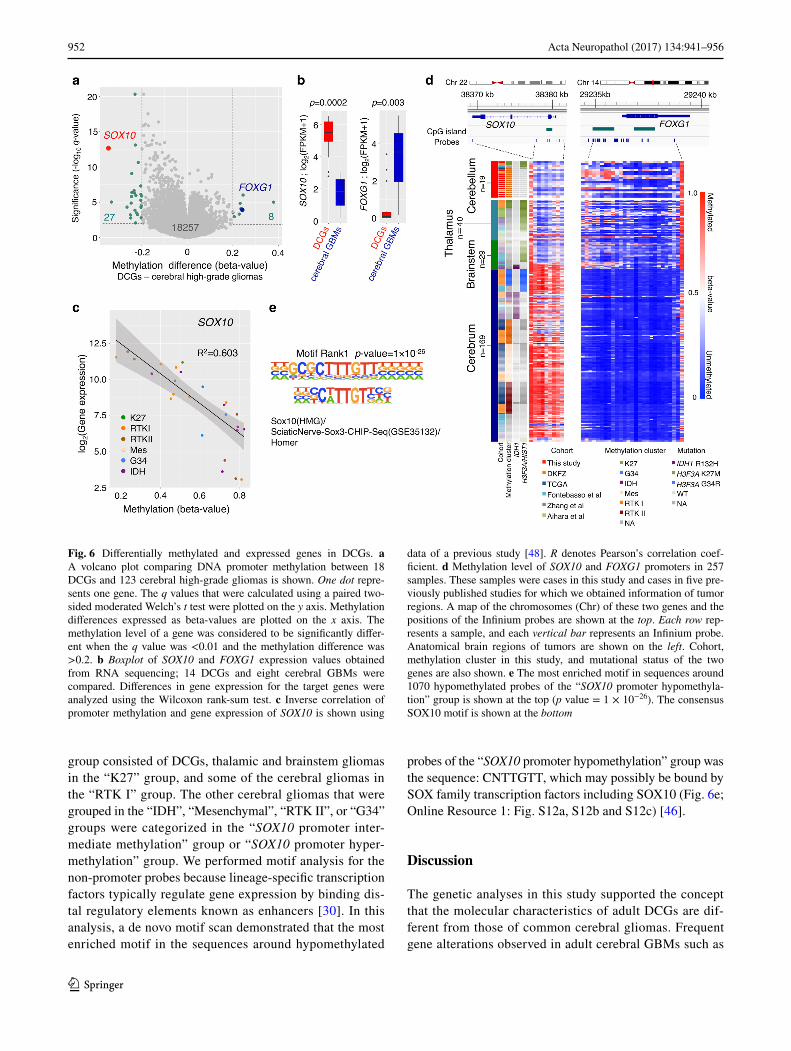
Next, to identify region-related gene promoter methylation of DCGs, Infinium data were compared between 18 DCGs and 123 cerebral gliomas. A volcano plot showed a gen-eral shift towards hypomethylation in DCGs (Fig. 6a), and SOX10 was one of the most significantly hypomethylated genes in DCGs (Fig. 6a and Online Resource 2: Table S9). SOX10 is a key transcription factor in oligodendrocyte pre-cursor cells and regulates PDGFRA [13, 40]. Significantly higher gene expression of SOX10 in DCGs, compared with that in cerebral gliomas (n = 8) (p = 0.0002), was concord-ant with the promoter hypomethylation of this gene (Fig. 6b). An inverse correlation of promoter methylation and SOX10 expression was also observed in previously reported data
(R2 = 0.603) (Fig. 6c). Notably, hypomethylation of the SOX10 promoter was evident not only in all DCGs regard-less of H3F3A mutation status, but also in brainstem and thalamic gliomas with H3F3A K27M (Online Resource 1: Fig. S11). On the other hand, FOXG1, an important neuronal lineage marker, was one of the most hypermethylated genes in our comparison (Fig. 6a; Online Resource 2: Table S9). In accordance with the promoter hypermethylation, the expres-sion level of FOXG1 in DCGs was significantly lower than that in cerebral gliomas (Fig. 6b). Sturm et al. previously demonstrated significantly higher promoter methylation and lower expression of FOXG1 in brainstem and thalamic glio-mas with H3F3A K27M [48]. Although cerebral gliomas in the “RTK I (PDGFRA)” group also showed comparatively lower methylation of the SOX10 promoter, these cerebral tumors did not show hypermethylation in the FOXG1 pro-moter, unlike cerebellar gliomas and brainstem and thalamic gliomas with H3F3A K27M (Online Resource 1: Fig. S11).
Fig. 4 Methylation profiling of DCGs. a Heatmap of the methylation level in 14 DCGs in this study, 210 high-grade gliomas of previous studies, and control samples. Unsupervised k-means clustering with 224 tumor samples was performed using the top 8000 variant probes. Patients’ age, methylation cluster in this study and in a previous report [48], brain region, cohorts of each sample, and the mutational
states of three genes are shown below. All of our samples and four cerebellar gliomas of previous reports were in either the “K27” group or the “RTK I” group. b Kaplan–Meier analysis of overall survival for three DCGs with H3F3A K27M and 16 H3F3A wild-type cerebel-lar GBMs
951Acta Neuropathol (2017) 134:941–956
1 3
OLIG1 and OLIG2, which are other oligodendroglial mark-ers that are highly methylated in gliomas with H3F3A G34R/V, were not methylated in DCGs (Online Resource 1: Fig. S11) [48].
To validate methylation changes in the promoters of SOX10 and FOXG1 in brainstem and thalamic gliomas, three other data sets, methylation data of 32 thalamic gliomas, 26 brainstem gliomas, and 46 cerebral gliomas obtained from previous reports, were combined and analyzed with our data (Fig. 6d) [2, 14, 55]. This analysis also demonstrated SOX10 promoter hypomethylation and FOXG1 promoter hyper-methylation in K27M-mutant gliomas of the brainstem and
thalamus as well as of DCGs compared to gliomas in other regions.
Enrichment of the SOX motif in hypomethylated DNA regions
We then examined whether SOX10 does indeed influence global gene expression in gliomas such as DCGs that have higher SOX10 expression. We divided 224 samples into three groups depending on the methylation level of the SOX10 promoter (Online Resource 1: Fig. S12a). Most of the glio-mas categorized in the “SOX10 promoter hypomethylation”
Fig. 5 Gene expression analysis of DCGs and cerebral GBMs. GSEA showed that two gene sets were up-regulated in 11 DCGs in the “RTK I” group compared with eight cerebral GBMs. One gene set was overexpressed in “PDGFRA-amplified GBMs” (left), and the
other gene set was overexpressed in “Proneural GBMs” (right). The false discovery rate (q) and the normalized enrichment score (NES) are shown (top). The top 30 significantly up-regulated genes of each gene set in DCGs are shown (bottom)
952 Acta Neuropathol (2017) 134:941–956
1 3
group consisted of DCGs, thalamic and brainstem gliomas in the “K27” group, and some of the cerebral gliomas in the “RTK I” group. The other cerebral gliomas that were grouped in the “IDH”, “Mesenchymal”, “RTK II”, or “G34” groups were categorized in the “SOX10 promoter inter-mediate methylation” group or “SOX10 promoter hyper-methylation” group. We performed motif analysis for the non-promoter probes because lineage-specific transcription factors typically regulate gene expression by binding dis-tal regulatory elements known as enhancers [30]. In this analysis, a de novo motif scan demonstrated that the most enriched motif in the sequences around hypomethylated
probes of the “SOX10 promoter hypomethylation” group was the sequence: CNTTGTT, which may possibly be bound by SOX family transcription factors including SOX10 (Fig. 6e; Online Resource 1: Fig. S12a, S12b and S12c) [46].
Discussion
The genetic analyses in this study supported the concept that the molecular characteristics of adult DCGs are dif-ferent from those of common cerebral gliomas. Frequent gene alterations observed in adult cerebral GBMs such as
Fig. 6 Differentially methylated and expressed genes in DCGs. a A volcano plot comparing DNA promoter methylation between 18 DCGs and 123 cerebral high-grade gliomas is shown. One dot repre-sents one gene. The q values that were calculated using a paired two-sided moderated Welch’s t test were plotted on the y axis. Methylation differences expressed as beta-values are plotted on the x axis. The methylation level of a gene was considered to be significantly differ-ent when the q value was <0.01 and the methylation difference was >0.2. b Boxplot of SOX10 and FOXG1 expression values obtained from RNA sequencing; 14 DCGs and eight cerebral GBMs were compared. Differences in gene expression for the target genes were analyzed using the Wilcoxon rank-sum test. c Inverse correlation of promoter methylation and gene expression of SOX10 is shown using
data of a previous study [48]. R denotes Pearson’s correlation coef-ficient. d Methylation level of SOX10 and FOXG1 promoters in 257 samples. These samples were cases in this study and cases in five pre-viously published studies for which we obtained information of tumor regions. A map of the chromosomes (Chr) of these two genes and the positions of the Infinium probes are shown at the top. Each row rep-resents a sample, and each vertical bar represents an Infinium probe. Anatomical brain regions of tumors are shown on the left. Cohort, methylation cluster in this study, and mutational status of the two genes are also shown. e The most enriched motif in sequences around 1070 hypomethylated probes of the “SOX10 promoter hypomethyla-tion” group is shown at the top (p value = 1 × 10⁻²⁶). The consensus SOX10 motif is shown at the bottom
953Acta Neuropathol (2017) 134:941–956
1 3
mutations in the TERT promoter, PIK3CA, PTEN, and RB1 were not detected in DCGs, and the rates of chromosome 10 loss, chromosome 7 gain, and mutation or amplification of EGFR were much lower than those of common cerebral high-grade gliomas [4, 6]. The IDH1 mutation, which is very frequent in diffuse lower-grade gliomas [8, 29], was rare in DCGs. In addition, subsequent integrated omics analysis in the present study clearly demonstrated the brain region-related distinct characteristics of DCGs.
WES analysis identified recurrent loss-of-function muta-tion of SETD2 in DCGs. All SETD2 mutations were present in GBMs that had neither the H3F3A K27M nor the G34R/V mutation. A previous report demonstrated that the SETD2 mutation frequently observed in pediatric GBM located in cerebral hemispheres occurred mutually exclusively with H3F3A G34R/V mutation [15]. In this study, we showed that SETD2 mutation was also frequent in DCGs in elderly adults. The frequency of SETD2 mutation (24%, 4/17) in DCGs was significantly higher than those in previous large-scale genetic analyses of adult gliomas, which showed a SETD2 mutation rate of 1.7% in GBM (5/292, p = 0.0007) and 2.1% in lower-grade glioma (3/283, p = 0.0002) [6, 8]. SETD2 mutation was quite rare in previous reports analyzing brainstem or thalamic gliomas in either adults or children [14, 15, 50, 54, 55].
In addition to pediatric cerebral GBM, inactivating muta-tion of SETD2 has been reported as a driver gene mutation in clear cell renal cell carcinoma (ccRCC), leukemia, and breast cancer [11, 23, 56]. The study of ccRCC demonstrated that SETD2 mutation causes loss of H3K36 trimethylation and consequently leads to altered chromatin accessibility and widespread defects in transcript processing that eventually result in promotion of cancer development [23, 44]. Like in other cancers, reduced H3K36 trimethylation in DCGs with SETD2 mutation was confirmed by immunohistochem-istry [39], indicating that epigenetic regulation was altered in these tumors. Because H3F3A K27M mutation, which we found in three DCGs, also results in the loss of H3K27 trimethylation, such epigenetic alterations may play major roles in the pathogenesis of DCG. Recent studies have iden-tified potential drugs targeting epigenetic alterations such as H3F3A K27M [28, 36]. Another study showed that the WEE1 inhibitor selectively kills H3K36-deficient cancers through dNTP starvation resulting from ribonucleotide reductase subunit M2 depletion [35]. Therefore, assessment of these mutations may lead to new drugs for patients with these ominous diseases in the future.
We showed that the p53 pathway is frequently disrupted, and that PPM1D is one of the recurrently altered genes in DCGs. The protein encoded by PPM1D is a p53-depend-ent serine/threonine protein phosphatase that negatively regulates molecules such as p53, CHK2, H2AX, and ATM, which are related to cell stress response pathways.
High DNA copy-number amplification or overexpression of PPM1D has been detected in several tumors including breast cancer, ovarian cancer, and medulloblastoma [7, 27, 49]. Mosaic PPM1D truncating mutation, which is found in the germline DNA of a small population of breast or ovarian cancer patients, was recently determined to be a genetic risk factor for those cancers [41]. Such truncation was shown to enhance PPM1D stability, and consequently, works as a gain-of-function oncogenic mutation. A previous report demonstrated that a similar somatic truncating mutation was also frequent in brainstem glioma, and that PPM1D trunca-tion and TP53 mutation were found mutually exclusively in six and 19 samples, respectively, in 33 brainstem glio-mas, whereas PPM1D truncation was detected in only one of 57 cerebral gliomas and was absent in thalamic glioma [55]. In this study, we identified a novel PPM1D fusion, in addition to the truncating mutations in exon 6, neither of which has been previously reported in cerebellar gliomas. This fusion is a novel mechanism of PPM1D alteration that was identified by RNA sequencing, but should have been missed by WES only. Therefore, the same mutations may exist in brainstem gliomas and other cancers if appropriately examined. Because PPM1D alterations have been a target of drug development, novel therapeutic opportunities may be available in the future for cerebellar and brainstem gliomas with PPM1D truncating mutation or fusion [12].
Some transcription factors play critical roles in the determination of cell fate. For example, SOX10, which is repressed by polycomb repressor in neural stem cells and is induced in oligodendroglial precursor cells, is a key tran-scription factor for the oligodendroglial lineage [37, 40]. In this study, we demonstrated that the CpG island promoter methylation status of such developmental genes, particularly of SOX10 and FOXG1, was remarkably different between gliomas that originated from different regions. Furthermore, DCGs were characterized by hypomethylation of the SOX10 promoter and hypermethylation of the FOXG1 promoter regardless of the presence or absence of K27M mutation, which resulted in upregulation of SOX10 (SOX10+) and downregulation of FOXG1 (FOXG1−). Previously, Sturm et al. showed that epigenetic silencing of FOXG1 was charac-teristic of diffuse midline gliomas that are H3 K27M-mutant and located in the brainstem or thalamus, and that this type of glioma has a distinct cell of origin characterized by OLIG1+, OLIG2+, and FOXG1− [48]. Notably, our analy-sis revealed not only that the status of OLIG1+, OLIG2+, and FOXG1− was shared between DCGs and K27M mid-line gliomas, but also that SOX10 promoter hypomethylation and consequent gene overexpression was commonly found among these tumors, whereas SOX10 expression is repressed by promoter hypermethylation in most other cerebral high-grade gliomas. Because most of the tumor-specific targets of de novo CpG island methylation are genes that are silenced
954 Acta Neuropathol (2017) 134:941–956
1 3
by the polycomb repressor, hypermethylation of promoter CpG islands in key developmental transcription factor genes in tumors may reflect their repressed status in the tumor’s tissue of origin; thus, the methylation status of these genes may reflect the regulation of dominant transcription fac-tors during their developmental course [42, 45, 53]. In that regard, we think that it is especially interesting that DCGs and K27M midline gliomas had a similar methylation pat-tern in the promoters of key developmental transcription factors such as SOX10, FOXG1, OLIG1, and OLIG2, sug-gesting a particular commonality in their cell of origin or tumor developmental process that appears to be distinct from other cerebral gliomas.
In contrast to the similarity in the methylation status of CpG islands of the developmental transcription factors, our global methylation profile analysis of adult DCGs demon-strated that all DCGs were clustered into either the “K27” group or the “RTK I (PDGFRA)” group, indicating two rep-resentative epigenetic profiles are present in adult DCGs. In accordance with these methylation patterns, gene expres-sion analysis demonstrated that adult DCGs were signifi-cantly enriched for the PDGFRA-associated genes that were observed in the “PDGFRA-amplified GBMs” in the TCGA project; these GBMs were mostly classified as the “Proneu-ral type” GBMs based on their gene expression profile [34, 52]. Upregulation of SOX10, which positively regulates PDGFRA in the oligodendroglial lineage, may explain why DCGs showed the “RTK I (PDGFRA)” methylation pattern [13, 40], whereas only a few had PDGFRA amplification. Indeed, diffuse intrinsic pontine gliomas, which often har-bor H3 K27M mutation and SOX10 upregulation, also fre-quently show higher expression of PDGFRA and a specific PDGFRA-related gene expression signature, indicating that the PDGFRA-related gene expression signature is shared by “K27” gliomas and DCGs categorized in the “RTK I (PDGFRA)” methylation group [33, 34]. Nonetheless, it is noteworthy that the prognosis of patients with DCG was quite different between the “K27” group and the “RTK I (PDGFRA)” group, thus emphasizing the clinical impor-tance of distinguishing these two groups.
In summary, we demonstrated that compared to most cerebral gliomas, adult DCGs had characteristic genetic alterations and epigenetic profiles, which included frequent SETD2 and PPM1D alteration and PDGFRA-related genetic and epigenetic signatures, and that these DCGs were char-acterized by upregulation of SOX10 and downregulation of FOXG1, which possibly reflects their cell of origin and developmental course. Notably, such a characteristic expres-sion pattern of developmental transcription factors was com-monly observed in diffuse midline glioma H3 K27M-mutant, which is a newly defined entity in the 2016 WHO classifi-cation of brain tumors. We think that further studies will clarify differences in the cell of origin among tumors that
originated from different brain regions and refine the tumor classification, and that tailored therapy that considers tumor molecular characteristics related to the tumor region will be available in the future.
Acknowledgements We are grateful to the patients for donating their tissue for research. We acknowledge the excellent technical assistance of Hiroko Meguro for performing the Infinium Methylation Assays, Kaori Shiina and Saori Kawanabe for gene sequencing, Reiko Matsuura for immunostaining, Yuko Matsushita and Saki Shimizu for extracting DNA from tumor and blood, and Hideyuki Arita, Sakura Kuzuoka, Kuniaki Saito, Masayuki Nitta, Soko Ikuta, Takayuki Yasuda, and Takashi Sakayori for assisting with the analysis of patient informa-tion. This work was funded by the Japan Society for the Promotion of Science KAKENHI Grant numbers JP23134501, JP26293321, and JP17H04300 (A.M.). This research was also supported by a research program of the Project for Development of Innovative Research on Cancer Therapeutics (P-Direct) (A.M., G.N., K.I., Y.N., M.N., K.U., R.N., H.A., and N.S.) and the Project for Cancer Research and Thera-peutic Evolution (P-CREATE) from the Japan Agency for Medical Research and Development, AMED (A.M., G.N., S.T., T.N., Y.M., Y.N., M.N., K.U., and R.N.). The datasets generated and analyzed dur-ing the current study are available in the Japanese Genotype-phenotype Archive (JGA, http://trace.ddbj.nig.ac.jp/jga) under accession number JGAS00000000106.
Compliance with ethical standards
Conflict of interest The authors declare no conflict of interest re-lated to this work.
Ethical approval All procedures performed in studies involving human participants were conducted in accordance with the ethical standards of the institution and with the 1964 Helsinki declaration and its later amendments or comparable ethical standards.
Informed consent Informed consent was obtained from all indi-vidual participants included in the study.
Open Access This article is distributed under the terms of the Creative Commons Attribution 4.0 International License (http://crea-tivecommons.org/licenses/by/4.0/), which permits unrestricted use, distribution, and reproduction in any medium, provided you give appro-priate credit to the original author(s) and the source, provide a link to the Creative Commons license, and indicate if changes were made.
References
1. Adams H, Chaichana KL, Avendano J, Liu B, Raza SM, Qui-nones-Hinojosa A (2013) Adult cerebellar glioblastoma: under-standing survival and prognostic factors using a population-based database from 1973 to 2009. World Neurosurg 80:e237–e243. doi:10.1016/j.wneu.2013.02.010
2. Aihara K, Mukasa A, Gotoh K, Saito K, Nagae G, Tsuji S, Tatsuno K, Yamamoto S, Takayanagi S, Narita Y et al (2014) H3F3A K27M mutations in thalamic gliomas from young adult patients. Neuro Oncol 16:140–146. doi:10.1093/neuonc/not144
3. Aihara K, Mukasa A, Nagae G, Nomura M, Yamamoto S, Ueda H, Tatsuno K, Shibahara J, Takahashi M, Momose T et al (2017) Genetic and epigenetic stability of oligodendrogliomas
955Acta Neuropathol (2017) 134:941–956
1 3
at recurrence. Acta Neuropathol Commun 5:18. doi:10.1186/s40478-017-0422-z
4. Arita H, Narita Y, Fukushima S, Tateishi K, Matsushita Y, Yoshida A, Miyakita Y, Ohno M, Collins VP, Kawahara N et al (2013) Upregulating mutations in the TERT promoter commonly occur in adult malignant gliomas and are strongly associated with total 1p19q loss. Acta Neuropathol 126:267–276. doi:10.1007/s00401-013-1141-6
5. Bibikova M, Barnes B, Tsan C, Ho V, Klotzle B, Le JM, Delano D, Zhang L, Schroth GP, Gunderson KL et al (2011) High density DNA methylation array with single CpG site resolution. Genomics 98:288–295. doi:10.1016/j.ygeno.2011.07.007
6. Brennan CW, Verhaak RG, McKenna A, Campos B, Noushmehr H, Salama SR, Zheng S, Chakravarty D, Sanborn JZ, Berman SH et al (2013) The somatic genomic landscape of glioblastoma. Cell 155:462–477. doi:10.1016/j.cell.2013.09.034
7. Bulavin DV, Demidov ON, Saito S, Kauraniemi P, Phillips C, Amundson SA, Ambrosino C, Sauter G, Nebreda AR, Ander-son CW et al (2002) Amplification of PPM1D in human tumors abrogates p53 tumor-suppressor activity. Nat Genet 31:210–215. doi:10.1038/ng894
8. Brat DJ, Verhaak RG, Aldape KD, Yung WK, Salama SR, Cooper LA, Rheinbay E, Miller CR, Vitucci M, Morozova O et al (2015) Comprehensive, integrative genomic analysis of diffuse lower-grade gliomas. N Engl J Med 372:2481–2498. doi:10.1056/NEJMoa1402121
9. Carter SL, Cibulskis K, Helman E, McKenna A, Shen H, Zack T, Laird PW, Onofrio RC, Winckler W, Weir BA et al (2012) Abso-lute quantification of somatic DNA alterations in human cancer. Nat Biotechnol 30:413–421. doi:10.1038/nbt.2203
10. Committee of Brain Tumor Registry of Japan (2017) Brain tumor registry of Japan (2005–2008) 14th edition. Neurol Med Chir (Tokyo) 57:1–102. doi:10.2176/nmc.sup.2017-0001
11. Dalgliesh GL, Furge K, Greenman C, Chen L, Bignell G, Butler A, Davies H, Edkins S, Hardy C, Latimer C et al (2010) System-atic sequencing of renal carcinoma reveals inactivation of histone modifying genes. Nature 463:360–363. doi:10.1038/nature08672
12. Esfandiari A, Hawthorne TA, Nakjang S, Lunec J (2016) Chemi-cal inhibition of wild-type p53-induced phosphatase 1 (WIP1/PPM1D) by GSK2830371 potentiates the sensitivity to MDM2 inhibitors in a p53-dependent manner. Mol Cancer Ther 15:379–391. doi:10.1158/1535-7163.MCT-15-0651
13. Finzsch M, Stolt CC, Lommes P, Wegner M (2008) Sox9 and Sox10 influence survival and migration of oligodendrocyte pre-cursors in the spinal cord by regulating PDGF receptor alpha expression. Development 135:637–646. doi:10.1242/dev.010454
14. Fontebasso AM, Papillon-Cavanagh S, Schwartzentruber J, Nik-bakht H, Gerges N, Fiset PO, Bechet D, Faury D, De Jay N, Ram-kissoon LA et al (2014) Recurrent somatic mutations in ACVR1 in pediatric midline high-grade astrocytoma. Nat Genet 46:462–466. doi:10.1038/ng.2950
15. Fontebasso AM, Schwartzentruber J, Khuong-Quang DA, Liu XY, Sturm D, Korshunov A, Jones DT, Witt H, Kool M, Albrecht S et al (2013) Mutations in SETD2 and genes affecting histone H3K36 methylation target hemispheric high-grade gliomas. Acta Neuropathol 125:659–669. doi:10.1007/s00401-013-1095-8
16. Gessi M, Gielen GH, Dreschmann V, Waha A, Pietsch T (2015) High frequency of H3F3A (K27M) mutations characterizes pedi-atric and adult high-grade gliomas of the spinal cord. Acta Neu-ropathol 130:435–437. doi:10.1007/s00401-015-1463-7
17. Homer N, Nelson SF (2010) Improved variant discovery through local re-alignment of short-read next-generation sequenc-ing data using SRMA. Genome Biol 11:R99. doi:10.1186/gb-2010-11-10-r99
18. Jeswani S, Nuno M, Folkerts V, Mukherjee D, Black KL, Patil CG (2013) Comparison of survival between cerebellar and
supratentorial glioblastoma patients: surveillance, epidemiol-ogy, and end results (SEER) analysis. Neurosurgery 73:240–246. doi:10.1227/01.neu.0000430288.85680.37
19. Jones DT, Hutter B, Jager N, Korshunov A, Kool M, Warnatz HJ, Zichner T, Lambert SR, Ryzhova M, Quang DA et al (2013) Recurrent somatic alterations of FGFR1 and NTRK2 in pilo-cytic astrocytoma. Nat Genet 45:927–932. doi:10.1038/ng.2682
20. Kakiuchi M, Nishizawa T, Ueda H, Gotoh K, Tanaka A, Hayashi A, Yamamoto S, Tatsuno K, Katoh H, Watanabe Y et al (2014) Recurrent gain-of-function mutations of RHOA in diffuse-type gastric carcinoma. Nat Genet 46:583–587. doi:10.1038/ng.2984
21. Khuong-Quang DA, Buczkowicz P, Rakopoulos P, Liu XY, Fontebasso AM, Bouffet E, Bartels U, Albrecht S, Schwartzen-truber J, Letourneau L et al (2012) K27M mutation in histone H3.3 defines clinically and biologically distinct subgroups of pediatric diffuse intrinsic pontine gliomas. Acta Neuropathol 124:439–447. doi:10.1007/s00401-012-0998-0
22. Kondo A, Yamamoto S, Nakaki R, Shimamura T, Hamakubo T, Sakai J, Kodama T, Yoshida T, Aburatani H, Osawa T (2017) Extracellular acidic pH activates the sterol regulatory element-binding protein 2 to promote tumor progression. Cell Rep 18:2228–2242. doi:10.1016/j.celrep.2017.02.006
23. Li J, Duns G, Westers H, Sijmons R, van den Berg A, Kok K (2016) SETD2: an epigenetic modifier with tumor suppres-sor functionality. Oncotarget 7:50719–50734. doi:10.18632/oncotarget.9368
24. Liu A, Li JY, Bromleigh C, Lao Z, Niswander LA, Joyner AL (2003) FGF17b and FGF18 have different midbrain regulatory properties from FGF8b or activated FGF receptors. Develop-ment 130:6175–6185. doi:10.1242/dev.00845
25. Louis DN, Ohgaki H, Wiestler OD, Cavenee WK (2016) World Health Organization histological classification of tumours of the central nervous system. International Agency for Research on Cancer, France
26. Mack SC, Witt H, Piro RM, Gu L, Zuyderduyn S, Stutz AM, Wang X, Gallo M, Garzia L, Zayne K et al (2014) Epigenomic alterations define lethal CIMP-positive ependymomas of infancy. Nature 506:445–450. doi:10.1038/nature13108
27. Mendrzyk F, Radlwimmer B, Joos S, Kokocinski F, Benner A, Stange DE, Neben K, Fiegler H, Carter NP, Reifenberger G et al (2005) Genomic and protein expression profiling identifies CDK6 as novel independent prognostic marker in medulloblastoma. J Clin Oncol 23:8853–8862. doi:10.1200/JCO.2005.02.8589
28. Mohammad F, Weissmann S, Leblanc B, Pandey DP, Hojfeldt JW, Comet I, Zheng C, Johansen JV, Rapin N, Porse BT et al (2017) EZH2 is a potential therapeutic target for H3K27M-mutant pedi-atric gliomas. Nat Med. doi:10.1038/nm.4293
29. Mukasa A, Takayanagi S, Saito K, Shibahara J, Tabei Y, Furuya K, Ide T, Narita Y, Nishikawa R, Ueki K et al (2012) Signifi-cance of IDH mutations varies with tumor histology, grade, and genetics in Japanese glioma patients. Cancer Sci 103:587–592. doi:10.1111/j.1349-7006.2011.02175.x
30. Ong CT, Corces VG (2011) Enhancer function: new insights into the regulation of tissue-specific gene expression. Nat Rev Genet 12:283–293. doi:10.1038/nrg2957
31. Pajtler KW, Witt H, Sill M, Jones DT, Hovestadt V, Kratochwil F, Wani K, Tatevossian R, Punchihewa C, Johann P et al (2015) Molecular classification of ependymal tumors across all CNS compartments, histopathological grades, and age groups. Cancer Cell 27:728–743. doi:10.1016/j.ccell.2015.04.002
32. Parker M, Mohankumar KM, Punchihewa C, Weinlich R, Dalton JD, Li Y, Lee R, Tatevossian RG, Phoenix TN, Thiruvenkatam R et al (2014) C11orf95-RELA fusions drive oncogenic NF-kappaB signalling in ependymoma. Nature 506:451–455. doi:10.1038/nature13109
956 Acta Neuropathol (2017) 134:941–956
1 3
33. Paugh BS, Broniscer A, Qu C, Miller CP, Zhang J, Tatevossian RG, Olson JM, Geyer JR, Chi SN, da Silva NS et al (2011) Genome-wide analyses identify recurrent amplifications of receptor tyrosine kinases and cell-cycle regulatory genes in diffuse intrinsic pontine glioma. J Clin Oncol 29:3999–4006. doi:10.1200/JCO.2011.35.5677
34. Paugh BS, Qu C, Jones C, Liu Z, Adamowicz-Brice M, Zhang J, Bax DA, Coyle B, Barrow J, Hargrave D et al (2010) Inte-grated molecular genetic profiling of pediatric high-grade glio-mas reveals key differences with the adult disease. J Clin Oncol 28:3061–3068. doi:10.1200/JCO.2009.26.7252
35. Pfister SX, Markkanen E, Jiang Y, Sarkar S, Woodcock M, Orlando G, Mavrommati I, Pai CC, Zalmas LP, Drobnitzky N et al (2015) Inhibiting WEE1 selectively kills histone H3K36me3-deficient cancers by dNTP starvation. Cancer Cell 28:557–568. doi:10.1016/j.ccell.2015.09.015
36. Piunti A, Hashizume R, Morgan MA, Bartom ET, Horbinski CM, Marshall SA, Rendleman EJ, Ma Q, Takahashi YH, Woodfin AR et al (2017) Therapeutic targeting of polycomb and BET bromo-domain proteins in diffuse intrinsic pontine gliomas. Nat Med. doi:10.1038/nm.4296
37. Pozniak CD, Langseth AJ, Dijkgraaf GJ, Choe Y, Werb Z, Pleas-ure SJ (2010) Sox10 directs neural stem cells toward the oligo-dendrocyte lineage by decreasing Suppressor of Fused expres-sion. Proc Natl Acad Sci USA 107:21795–21800. doi:10.1073/pnas.1016485107
38. Puget S, Philippe C, Bax DA, Job B, Varlet P, Junier MP, Andrei-uolo F, Carvalho D, Reis R, Guerrini-Rousseau L et al (2012) Mesenchymal transition and PDGFRA amplification/mutation are key distinct oncogenic events in pediatric diffuse intrinsic pontine gliomas. PLoS One 7:e30313. doi:10.1371/journal.pone.0030313
39. Roberti A, Dobay MP, Bisig B, Vallois D, Boechat C, Lanitis E, Bouchindhomme B, Parrens MC, Bossard C, Quintanilla-Martinez L et al (2016) Type II enteropathy-associated T-cell lymphoma features a unique genomic profile with highly recur-rent SETD2 alterations. Nat Commun 7:12602. doi:10.1038/ncomms12602
40. Rowitch DH, Kriegstein AR (2010) Developmental genet-ics of vertebrate glial-cell specification. Nature 468:214–222. doi:10.1038/nature09611
41. Ruark E, Snape K, Humburg P, Loveday C, Bajrami I, Brough R, Rodrigues DN, Renwick A, Seal S, Ramsay E et al (2013) Mosaic PPM1D mutations are associated with predisposition to breast and ovarian cancer. Nature 493:406–410. doi:10.1038/nature11725
42. Schlesinger Y, Straussman R, Keshet I, Farkash S, Hecht M, Zim-merman J, Eden E, Yakhini Z, Ben-Shushan E, Reubinoff BE et al (2007) Polycomb-mediated methylation on Lys27 of histone H3 pre-marks genes for de novo methylation in cancer. Nat Genet 39:232–236. doi:10.1038/ng1950
43. Schwartzentruber J, Korshunov A, Liu XY, Jones DT, Pfaff E, Jacob K, Sturm D, Fontebasso AM, Quang DA, Tonjes M et al (2012) Driver mutations in histone H3.3 and chromatin remod-elling genes in paediatric glioblastoma. Nature 482:226–231. doi:10.1038/nature10833
44. Simon JM, Hacker KE, Singh D, Brannon AR, Parker JS, Weiser M, Ho TH, Kuan PF, Jonasch E, Furey TS et al (2014) Variation
in chromatin accessibility in human kidney cancer links H3K36 methyltransferase loss with widespread RNA processing defects. Genome Res 24:241–250. doi:10.1101/gr.158253.113
45. Sproul D, Kitchen RR, Nestor CE, Dixon JM, Sims AH, Harrison DJ, Ramsahoye BH, Meehan RR (2012) Tissue of origin deter-mines cancer-associated CpG island promoter hypermethylation patterns. Genome Biol 13:R84. doi:10.1186/gb-2012-13-10-r84
46. Srinivasan R, Sun G, Keles S, Jones EA, Jang SW, Krueger C, Moran JJ, Svaren J (2012) Genome-wide analysis of EGR2/SOX10 binding in myelinating peripheral nerve. Nucleic Acids Res 40:6449–6460. doi:10.1093/nar/gks313
47. Sturm D, Bender S, Jones DT, Lichter P, Grill J, Becher O, Hawk-ins C, Majewski J, Jones C, Costello JF et al (2014) Paediatric and adult glioblastoma: multiform (epi)genomic culprits emerge. Nat Rev Cancer 14:92–107. doi:10.1038/nrc3655
48. Sturm D, Witt H, Hovestadt V, Khuong-Quang DA, Jones DT, Konermann C, Pfaff E, Tonjes M, Sill M, Bender S et al (2012) Hotspot mutations in H3F3A and IDH1 define distinct epigenetic and biological subgroups of glioblastoma. Cancer Cell 22:425–437. doi:10.1016/j.ccr.2012.08.024
49. Tan DS, Lambros MB, Rayter S, Natrajan R, Vatcheva R, Gao Q, Marchio C, Geyer FC, Savage K, Parry S et al (2009) PPM1D is a potential therapeutic target in ovarian clear cell carcinomas. Clin Cancer Res 15:2269–2280. doi:10.1158/1078-0432.CCR-08-2403
50. Taylor KR, Mackay A, Truffaux N, Butterfield Y, Morozova O, Philippe C, Castel D, Grasso CS, Vinci M, Carvalho D et al (2014) Recurrent activating ACVR1 mutations in diffuse intrinsic pontine glioma. Nat Genet 46:457–461. doi:10.1038/ng.2925
51. Totoki Y, Tatsuno K, Covington KR, Ueda H, Creighton CJ, Kato M, Tsuji S, Donehower LA, Slagle BL, Nakamura H et al (2014) Trans-ancestry mutational landscape of hepatocellular carcinoma genomes. Nat Genet 46:1267–1273. doi:10.1038/ng.3126
52. Verhaak RG, Hoadley KA, Purdom E, Wang V, Qi Y, Wilker-son MD, Miller CR, Ding L, Golub T, Mesirov JP et al (2010) Integrated genomic analysis identifies clinically relevant subtypes of glioblastoma characterized by abnormalities in PDGFRA, IDH1, EGFR, and NF1. Cancer Cell 17:98–110. doi:10.1016/j.ccr.2009.12.020
53. Widschwendter M, Fiegl H, Egle D, Mueller-Holzner E, Spizzo G, Marth C, Weisenberger DJ, Campan M, Young J, Jacobs I et al (2007) Epigenetic stem cell signature in cancer. Nat Genet 39:157–158. doi:10.1038/ng1941
54. Wu G, Diaz AK, Paugh BS, Rankin SL, Ju B, Li Y, Zhu X, Qu C, Chen X, Zhang J et al (2014) The genomic landscape of diffuse intrinsic pontine glioma and pediatric non-brainstem high-grade glioma. Nat Genet 46:444–450. doi:10.1038/ng.2938
55. Zhang L, Chen LH, Wan H, Yang R, Wang Z, Feng J, Yang S, Jones S, Wang S, Zhou W et al (2014) Exome sequencing iden-tifies somatic gain-of-function PPM1D mutations in brainstem gliomas. Nat Genet 46:726–730. doi:10.1038/ng.2995
56. Zhu X, He F, Zeng H, Ling S, Chen A, Wang Y, Yan X, Wei W, Pang Y, Cheng H et al (2014) Identification of functional coop-erative mutations of SETD2 in human acute leukemia. Nat Genet 46:287–293. doi:10.1038/ng.2894