Embed Size (px)
Citation preview

DISTRIBUTED DENIAL OF SERVICE (DDOS) ATTACK
DETECTION AND PREVENTION MECHANISMS FOR
CLOUD- ASSISTED WIRELESS BODY AREA
NETWORKS (WBAN)
By
Rabia Latif
A thesis submitted to the faculty of Department of Information Security,Military College of Signals, National University of Sciences and Technology,
Islamabad, Pakistan, in partial fulfillment of the requirements for the degree of PhD inInformation Security
February 2016
ABSTRACT
Distributed Denial of Service (DDoS) attack does not aims to disrupts or interfere with the
real sensor data, rather they take advantage of disparity that exists between the network
bandwidth and the limited resource availability of the victim. Detecting and preventing such
attacks in cloud- assisted Wireless Body Area Networks (WBANs) is an important concern.
Such attacks can be avoided by first detecting followed by prevention and mitigation. Attack
detection is an initial step of any defense approach that needs to be taken prior to attack
mitigation techniques. Similarly, attack prevention also plays an important role in protecting
a network from malicious attacks. This research is mainly focused on the DDoS attack
detection and prevention algorithms and propose a novel solution that not only consumes
less resources but also produce efficient results.
The limited resources of WBAN are not enough to mitigate the huge amount of traffic
generated by DDoS attack. Therefore, there is a need for lightweight approaches and ca-
pable of handling real-time high speed sensor data for detection of such attacks in cloud-
assisted WBAN environment. The concern of detecting and preventing the DDoS attack
in cloud- assisted WBAN remains unresolved, existing solutions proposed for such attacks
in conventional networks are not directly applicable in cloud-assisted WBAN environment
due to the resource scarceness of these networks. Moreover, multiple entry points into these
networks leave them more vulnerable to such attacks which makes the attack detection and
prevention process a challenging task.
The aim of this research is to design a lightweight, in-network, distributed and scalable
approach for detecting DDoS attack that is capable of handling high speed streaming data
generated by WBAN sensors in cloud- assisted WBAN environment. The goal is to propose
the attack detection technique with improved performance when compared with existing
techniques in terms of: i) improved attack detection accuracy; ii) minimizing overall re-
source usage and iii) reducing overall computational cost. Analyzing and comparing the
existing techniques for detecting attacks in both conventional and wireless sensor networks
concludes that Very Fast Decision Tree (VFDT) has proved to be the most promising solu-
tion for identifying the malicious behavior of nodes in these networks through pattern dis-
covery. Therefore, in this research , we have selected and explored VFDT technique that is
lightweight and have further optimized it for handling high-speed streaming data originating
from WBAN sensors.
The performance evaluation is done through simulation experiments and real-time WBAN
ii

testbed deployment to test the effectiveness of proposed attack detection approach. In addi-
tion, the quantitative results obtained from the simulation experiments are benchmarked with
corresponding results acquired from the existing techniques. The results comparison shows
the advantages and significance of deploying stream mining approach in such networks, for
detecting DDoS attacks in an efficient and timely manner.
Another objective of this research is to propose an efficient traceback technique specif-
ically for cloud- assisted WBAN environment that incur minimal overhead on the WBAN
network. The goal is to propose a technique that is efficient in packet marking and path
reconstruction procedures in order to traceback and identify the source of DDoS attack with
less convergence time. Different traceback techniques have been analyzed and their compar-
ison drawn to the conclusion that Probability Packet Marking (PPM) is most appropriate and
widely used approach in both conventional and wireless sensor networks. The key issue of
PPM lies in assigning the marking probability for path reconstruction. Therefore, we model
the traceback of DDoS attack as a marking probability assignment problem and further op-
timized it for efficient traceback of DDoS attack in cloud- assisted WBAN environment.
The evaluation is performed through simulation experiments to test the effectiveness of
the proposed traceback technique. In addition, the quantitative results acquired from the
simulations are benchmarked with equivalent results acquired from a fish bone traceback
technique. The result comparisons prove the effectiveness of proposed traceback technique
in WBAN networks, for identifying the source of DDoS attacks with less convergence time
and minimum overhead.
iii

TABLE OF CONTENTS
ABSTRACT ii
TABLE OF CONTENTS iii
LIST OF FIGURES viii
LIST OF TABLES x
DEDICATION xi
ACKNOWLEDGEMENTS xii
PUBLICATIONS xiii
ACRONYMS xiv
NOTATIONS xvi
1 INTRODUCTION 1
1.1 Introduction . . . . . . . . . . . . . . . . . . . . . . . . . . . . . . . . . . 1
1.2 Security Requirements for Cloud- Assisted WBAN in context of Confiden-
tiality, Integrity and Availability (CIA) . . . . . . . . . . . . . . . . . . . . 2
1.3 Distributed Denial of Service Attack . . . . . . . . . . . . . . . . . . . . . 3
1.3.1 Distributed Denial of Service Attack: Conventional Network . . . . 3
1.3.2 Distributed Denial of Service Attack: Cloud-assisted WBAN . . . . 4
1.4 Motivation and Problem Statement . . . . . . . . . . . . . . . . . . . . . . 5
1.5 Contributions and Outcomes . . . . . . . . . . . . . . . . . . . . . . . . . 7
1.6 Thesis Outline . . . . . . . . . . . . . . . . . . . . . . . . . . . . . . . . . 8
2 DISTRIBUTED DENIAL OF SERVICE ATTACK: A Review 11
2.1 Cloud- Assisted Wireless Body Area Networks . . . . . . . . . . . . . . . 12
2.1.1 Integrating WBAN with Cloud Computing Technology . . . . . 12
2.1.2 Terminologies . . . . . . . . . . . . . . . . . . . . . . . . . . . . 14
2.1.3 Cloud- Assisted WBAN Applications . . . . . . . . . . . . . . . . 15
2.2 Distributed Denial of Service (DDoS) Attack in Cloud- Assisted WBAN . . 15
iv

2.2.1 Classification of DDoS Attack . . . . . . . . . . . . . . . . . . . . 16
2.2.2 A Taxonomy of Distributed Denial of Service Attack Defense Mech-
anisms . . . . . . . . . . . . . . . . . . . . . . . . . . . . . . . . 19
2.3 Role of Data Mining in Distributed Denial of Service Attack Detection . . . 22
2.3.1 Existing Data Mining Techniques for DDoS Attack Detection . . . 25
2.4 Stream Mining Techniques . . . . . . . . . . . . . . . . . . . . . . . . . . 27
2.4.1 Preliminaries . . . . . . . . . . . . . . . . . . . . . . . . . . . . . 28
2.4.2 Very Fast Decision Tree (VFDT) . . . . . . . . . . . . . . . . . . . 29
2.4.3 Very Fast Decision Tree based on Predefined Threshold (VFDT-) . 29
2.4.4 Optimized Very Fast Decision Tree (OVFDT) . . . . . . . . . . . . 29
2.4.5 Concept Adaptive VFDT (CVFDT) . . . . . . . . . . . . . . . . . 30
2.5 Effect of Noise in Streaming Data . . . . . . . . . . . . . . . . . . . . . . 30
2.6 Traceback Techniques for Distributed Denial of Service (DDoS) Attack . . 30
2.6.1 Existing Traceback Techniques for Standard IP- Based Networks . 31
2.6.2 Traceback techniques for Mobile Ad-hoc Networks . . . . . . . . . 32
2.7 Conclusion . . . . . . . . . . . . . . . . . . . . . . . . . . . . . . . . . . 33
3 PROPOSED DDoS ATTACK DETECTION AND PREVENTION FRAME-
WORK FOR CLOUD-ASSISTED WBAN 35
3.1 Requirements for DDoS Attack Detection in Cloud- Assisted WBAN envi-
ronment . . . . . . . . . . . . . . . . . . . . . . . . . . . . . . . . . . . . 36
3.2 Proposed Cloud- Assisted WBAN Architecture . . . . . . . . . . . . . . . 37
3.2.1 Formulation of Cloud- Assisted WBAN Architecture . . . . . . . . 37
3.2.2 Proposed Cloud-assisted WBAN Architecture . . . . . . . . . . . . 40
3.3 Proposed Framework for Detecting and Preventing DDoS Attack . . . . . . 45
3.4 Conclusion . . . . . . . . . . . . . . . . . . . . . . . . . . . . . . . . . . 47
4 EVFDT: An Enhanced Very Fast Decision Tree Algorithm for Detecting DDoS
Attack in Cloud- Assisted WBAN 48
4.1 Proposed Distributed Denial of Service attack detection system . . . . . . . 50
4.1.1 Data Collection Phase . . . . . . . . . . . . . . . . . . . . . . . . 51
4.1.2 Pre-Processing Phase . . . . . . . . . . . . . . . . . . . . . . . . . 51
4.1.3 Attack Classification . . . . . . . . . . . . . . . . . . . . . . . . . 53
4.1.4 Attack Response . . . . . . . . . . . . . . . . . . . . . . . . . . . 53
4.2 Enhanced Very Fast Decision Tree (EVFDT): A Proposed Classification Al-
gorithm . . . . . . . . . . . . . . . . . . . . . . . . . . . . . . . . . . . . 53
v

4.2.1 EVFDT Tree Building Process . . . . . . . . . . . . . . . . . . . . 55
4.3 Conclusion . . . . . . . . . . . . . . . . . . . . . . . . . . . . . . . . . . 59
5 ATTACK DETECTION SCHEME: PERFORMANCE ANALYSIS AND
BENCHMARKING 61
5.1 Performance Evaluation Metrics . . . . . . . . . . . . . . . . . . . . . . . 62
5.1.1 Attack Detection Accuracy . . . . . . . . . . . . . . . . . . . . . . 62
5.1.2 False Alarm Rate (FAR) . . . . . . . . . . . . . . . . . . . . . . . 63
5.1.3 Computational Cost . . . . . . . . . . . . . . . . . . . . . . . . . 64
5.1.4 Sensitivity vs Specificity . . . . . . . . . . . . . . . . . . . . . . . 65
5.1.5 Tree Size . . . . . . . . . . . . . . . . . . . . . . . . . . . . . . . 65
5.1.6 Computational Time . . . . . . . . . . . . . . . . . . . . . . . . . 66
5.1.7 Memory Usage . . . . . . . . . . . . . . . . . . . . . . . . . . . . 66
5.2 Simulation- Based Experiments . . . . . . . . . . . . . . . . . . . . . . . 66
5.2.1 Synthetic Datasets . . . . . . . . . . . . . . . . . . . . . . . . . . 66
5.2.2 DDoS Attack Strategy: Generation and Analysis . . . . . . . . . . 68
5.2.3 Performance Evaluation and Comparative Analysis . . . . . . . . . 69
5.3 Hardware- Based Experiments . . . . . . . . . . . . . . . . . . . . . . . . 75
5.3.1 Experimental TestBed . . . . . . . . . . . . . . . . . . . . . . . . 75
5.3.2 Traffic Generation . . . . . . . . . . . . . . . . . . . . . . . . . . 78
5.3.3 Performance Evaluation and Comparative Analysis . . . . . . . . . 80
5.4 Qualitative Comparison of Classification Algorithms . . . . . . . . . . . . 86
5.5 Conclusion . . . . . . . . . . . . . . . . . . . . . . . . . . . . . . . . . . 87
6 PROPOSED TRACEBACK SCHEME FOR DISTRIBUTED DENIAL OF
SERVICE ATTACK 89
6.1 Preliminaries . . . . . . . . . . . . . . . . . . . . . . . . . . . . . . . . . 90
6.1.1 Probabilistic Packet Marking . . . . . . . . . . . . . . . . . . . . . 91
6.1.2 Key Issues in Selecting Probability . . . . . . . . . . . . . . . . . 91
6.2 Proposed Traceback Technique . . . . . . . . . . . . . . . . . . . . . . . . 95
6.2.1 Finding the Traveling Distance . . . . . . . . . . . . . . . . . . . . 96
6.2.2 Uniform Residual Probability . . . . . . . . . . . . . . . . . . . . 100
6.3 DDoS Attacker Traceback and Path Reconstruction . . . . . . . . . . . . . 100
6.3.1 Procedure for Aggregate Node Path Reconstruction . . . . . . . . . 100
6.3.2 Procedure for Sensor Node Path Reconstruction . . . . . . . . . . . 101
6.4 Conclusion . . . . . . . . . . . . . . . . . . . . . . . . . . . . . . . . . . 102
vi

7 TRACEBACK SCHEME: PERFORMANCE EVALUATION AND BENCH-
MARKING 104
7.1 Simulation Setup . . . . . . . . . . . . . . . . . . . . . . . . . . . . . . . 104
7.2 Evaluation and Comparative Analysis . . . . . . . . . . . . . . . . . . . . 105
7.2.1 Convergence time . . . . . . . . . . . . . . . . . . . . . . . . . . . 106
7.2.2 Uncertainty . . . . . . . . . . . . . . . . . . . . . . . . . . . . . . 107
7.2.3 Overhead on Nodes . . . . . . . . . . . . . . . . . . . . . . . . . . 108
7.3 Conclusion . . . . . . . . . . . . . . . . . . . . . . . . . . . . . . . . . . 109
8 CONCLUSION AND FUTURE DIRECTIONS 111
8.1 Summary . . . . . . . . . . . . . . . . . . . . . . . . . . . . . . . . . . . 111
8.2 Future Work . . . . . . . . . . . . . . . . . . . . . . . . . . . . . . . . . . 114
REFERENCES 115
vii

LIST OF FIGURES
1.1 DDoS Attack in Conventional Network . . . . . . . . . . . . . . . . . . . 4
1.2 DDoS Attack Illustration in WBANs . . . . . . . . . . . . . . . . . . . . . 5
2.1 Cloud-Assisted WBAN Conceptual Architecture for E-Health Monitoring . 13
2.2 DDoS Attack Classification . . . . . . . . . . . . . . . . . . . . . . . . . . 17
2.3 Taxonomy of DDoS Defense Mechanism . . . . . . . . . . . . . . . . . . 20
2.4 Data Mining Process . . . . . . . . . . . . . . . . . . . . . . . . . . . . . 23
2.5 Effect of Noisy Data . . . . . . . . . . . . . . . . . . . . . . . . . . . . . 31
3.1 Flat Topology . . . . . . . . . . . . . . . . . . . . . . . . . . . . . . . . . 36
3.2 Flat Topology . . . . . . . . . . . . . . . . . . . . . . . . . . . . . . . . . 38
3.3 Cluster-based Topology . . . . . . . . . . . . . . . . . . . . . . . . . . . . 39
3.4 Data Aggregation Topology . . . . . . . . . . . . . . . . . . . . . . . . . . 39
3.5 Proposed cloud-assisted WBAN Architecture . . . . . . . . . . . . . . . . 41
3.6 Sequence of Operations from Patient to Healthcare Professional . . . . . . 42
3.7 Workflow of Attack Detection Node at Cloud . . . . . . . . . . . . . . . . 45
3.8 Proposed Framework for Detecting and Preventing DDoS Attacks . . . . . 46
4.1 Proposed DDoS Attack Detection System . . . . . . . . . . . . . . . . . . 50
4.2 Proposed EVFDT Flowchart . . . . . . . . . . . . . . . . . . . . . . . . . 54
5.1 Illustration of LEACH Protocol . . . . . . . . . . . . . . . . . . . . . . . . 67
5.2 Accuracy in different Noise Percentage . . . . . . . . . . . . . . . . . . . 70
5.3 Accuracy vs In in different Noise Percentages . . . . . . . . . . . . . . . . 70
5.4 FPR and FNR vs In (a) False Positive Rate (b) False Negative Rate . . . . . 71
5.5 Tree Size vs Noise Percentage . . . . . . . . . . . . . . . . . . . . . . . . 73
5.6 Computational Time vs Number of Instances In . . . . . . . . . . . . . . . 74
5.7 Memory Usage vs Number of Instances In . . . . . . . . . . . . . . . . . . 75
5.8 Arduino XBee Shield . . . . . . . . . . . . . . . . . . . . . . . . . . . . . 76
5.9 ’Arduino XBee shield’ over e-Health sensor shield complete kit . . . . . . 76
5.10 Complete WBAN Demonstration . . . . . . . . . . . . . . . . . . . . . . . 78
5.11 Arduino IDE serial monitor . . . . . . . . . . . . . . . . . . . . . . . . . . 79
5.12 Attack Detection Accuracy for Different Noise(%) . . . . . . . . . . . . . 81
viii
5.13 Attack Detection Accuracy Comparison with Different Noise(%) . . . . . 81
5.14 Effect of Noise% on FPR and FNR (a) False Positive Rate (b) False Negative
Rate . . . . . . . . . . . . . . . . . . . . . . . . . . . . . . . . . . . . . . 82
5.15 Effect of In on FPR and FNR (a) False Positive Rate (b) False Negative Rate 83
5.16 Sensitivity vs Specificity (a) VFDT-τ (b) CVFDT (c) OVFDT (d) EVFDT . 84
5.17 ROC curves showing the tradeoff between Sensitivity and false-positive rate
(100-Specificity) of DDoS attacks . . . . . . . . . . . . . . . . . . . . . . 85
5.18 Computational Cost Comparison . . . . . . . . . . . . . . . . . . . . . . . 85
5.19 Computational Time Comparison . . . . . . . . . . . . . . . . . . . . . . . 86
5.20 Memory Usage Comparison . . . . . . . . . . . . . . . . . . . . . . . . . 87
6.1 Graphical Network Topology . . . . . . . . . . . . . . . . . . . . . . . . . 91
6.2 Residual Probability ϕ1 for node n1 . . . . . . . . . . . . . . . . . . . . . 93
6.3 Unmarked Probability ϕ0 . . . . . . . . . . . . . . . . . . . . . . . . . . . 94
6.4 Falsify Paths . . . . . . . . . . . . . . . . . . . . . . . . . . . . . . . . . . 94
6.5 WBAN Network Topology . . . . . . . . . . . . . . . . . . . . . . . . . . 96
6.6 IEEE 802.15.4 with DPPM label . . . . . . . . . . . . . . . . . . . . . . . 97
6.7 DPPM label . . . . . . . . . . . . . . . . . . . . . . . . . . . . . . . . . . 97
6.8 Sensor Nodes Connecting with an Edge . . . . . . . . . . . . . . . . . . . 97
6.9 (a): Multi-Hop WBAN Topology . . . . . . . . . . . . . . . . . . . . . . . 99
6.10 (b): Sequence of Packet Traveling Along the Path . . . . . . . . . . . . . . 99
7.1 Number of packets required by proposed technique and FBT (τi = 0.08) . . 106
7.2 Uncertainty values for PPM with Different Marking Probabilities . . . . . . 107
7.3 A Comparison of Overhead on Individual Nodes . . . . . . . . . . . . . . 109
ix

LIST OF TABLES
2.1 DDoS Defense Mechanisms based on Deployment Location . . . . . . . . 21
2.2 Data Mining Techniques . . . . . . . . . . . . . . . . . . . . . . . . . . . 24
2.3 Comparison of existing DDoS attack detection mechanisms . . . . . . . . . 26
5.1 Performance evaluation metrics . . . . . . . . . . . . . . . . . . . . . . . . 62
5.2 Confusion Matrix . . . . . . . . . . . . . . . . . . . . . . . . . . . . . . . 63
5.3 Cost Matrix . . . . . . . . . . . . . . . . . . . . . . . . . . . . . . . . . . 64
5.4 Simulation Parameters . . . . . . . . . . . . . . . . . . . . . . . . . . . . 67
5.5 FPR and FNR of Classification Algorithms in Percentage . . . . . . . . . . 71
5.6 Sensitivity and Specificity of Classification Algorithms in Percentage . . . 72
5.7 Tree Size Comparison with different Noise Percentage . . . . . . . . . . . 73
5.8 List of Statistical Features . . . . . . . . . . . . . . . . . . . . . . . . . . 79
5.9 Experimental Results of Attack Detection Accuracy(%) for real-time datasets 82
5.10 Sensitivity and Specificity of Existing Proposed Classification Algorithms
in Percentage . . . . . . . . . . . . . . . . . . . . . . . . . . . . . . . . . 83
5.11 Qualitative Comparison of Proposed and Existing Classification Algorithms 88
7.1 Simulation Parameters . . . . . . . . . . . . . . . . . . . . . . . . . . . . 105
7.2 Convergence Time Comparison of FBT and proposed Technique . . . . . . 107
7.3 Total Overhead on Nodes . . . . . . . . . . . . . . . . . . . . . . . . . . . 109
x

DEDICATION
This thesis is dedicated to
MY BELOVED PARENTS, HUSBAND,
AND MY DAUGHTER
for their love, endless support and encouragement
xi

ACKNOWLEDGEMENTS
I am grateful to God Almighty who has bestowed me with the strength and the passion to
accomplish this thesis and I am thankful to Him for His mercy and benevolence. Without
His consent I could not have indulged myself in this task.
I would like to express my sincere gratitude to my advisor Dr. Haider Abbas for his
continuous support throughout my degree, for his patience, motivation, enthusiasm, and
immense knowledge. His guidance helped me in all the time of research and writing of this
thesis.
I am grateful to my thesis guidance and evaluation committee members including Dr.
Asif Masood , Dr. Hammad Afzal, and Dr. Mehreen Afzal for their constant supervision
and support.
A very special thanks goes out to Dr. Seemab Latif, without her efforts my job would
have undoubtedly been more difficult. I greatly benefitted from her keen scientific insight,
and her ability to put complex ideas into simple terms.
I am very grateful to my parents for the endless support they provided me through my
entire life and in particular during my studies. I must acknowledge my husband, without
whose love, encouragement and editing assistance, I would not have finished this thesis.
xii

PUBLICATIONS
The following relevant publications have been produced during PhD period.
1. R. Latif, H. Abbas, S. Latif, A. Masood, ”DDOS Attack Source Detection Using Effi-
cient Traceback Technique (ETT) in Cloud-Assisted Healthcare Environment”, Jour-
nal of Medical Systems. Impact factor 2.24, (Under Review).
2. R. Latif, H. Abbas, S. Latif, A. Masood, ”EVFDT: An Enhanced Very Fast Deci-
sion Tree Algorithm for Detecting Distributed Denial of Service Attack in Cloud-
Assisted Wireless Body Area Network”, Mobile Information Systems, Hindawi Pub-
lishing Coorporation, Article ID 260594, 2015. Impact factor 0.94.
3. R. Latif, H. Abbas, S. Latif, A. Masood, ”Performance Evaluation of Enhanced Very
Fast Decision Tree (EVFDT) Mechanism for Distributed Denial of Service Attack
Detection in Healthcare Systems”, Healthcare on Smart and Mobile Devices, Annals
of Telecommunications, 2015. Impact factor 0.699.
4. R. Latif, H. Abbas, S. Latif, ”Distributed Denial of Service DDoS attack detection
using data mining approach in cloud Assisted Wireless Body Area Networks”, In-
ternational Journal of Ad hoc and Ubiquitous Computing (IJAHUC), 2014. Impact
factor: 0.55.
5. R. Latif, H. Abbas, Sad Assar , ”Distributed Denial of Service (DDoS) Attack in
Cloud-Assisted Wireless Body Area Network: A Systematic Literature Review”, Jour-
nal of Medical Systems (JoMS), vol. 38, no. 128, November 2014. Impact factor: 2.24.
6. R. Latif, H. Abbas, S. Latif, ”Analyzing Feasibility for Deploying Very Fast Decision
Tree for DDoS Attack Detection in Cloud Assisted WBAN”, Published in the proceed-
ings of 2014 International Conference on Intelligent Computing (ICIC2014). August
3- 6, 2014, Taiyuan, China.
7. R. Latif, H. Abbas, S. Assar, Q. Ali ”Cloud Computing Risk Assessment: A Sys-
tematic Literature Review” (2013) Springer Lecture Notes in Electrical Engineering
Vol:276, pp:285-295.
xiii

ACRONYMS
Wireless Body Area Network WBAN
Denial of Service DoS
Distributed Denial of Service DDoS
Confidentiality Integrity Availability CIA
Very Fast Decision Tree VFDT
Enhanced Very Fast Decision Tree EVFDT
Concept Adaptive Very Fast Decision Tree CVFDT
Optimized Very Fast Decision Tree OVFDT
Network Simulator-2 NS-2
Efficient Traceback Technique ETT
Body Control Unit BCU
Transport Control Protocol TCP
User Datagram Protocol UDP
Electrocardiogram ECG
Internet Control Message Protocol ICMP
Intrusion detection System IDS
Intrusion Prevention System IPS
Genetic Algorithm GA
K- Nearest Neighbor KNN
Hoeffding Bound HB
Mobile AdHoc Networks MANET
Wireless Sensor Network WSN
Probabilistic Packet Marking PPM
Deterministic Packet Marking DPM
Dynamic Probability Packet Marking DPPM
Cumulative Path CP
xiv

Marking Probability Distribution Function MPDF
Electromyography EMG
Secure Socket Layer SSL
Transport Layer Security TLS
Secure Shell SSH
Role Based Access Control RBAC
Quality of Service QoS
Hoeffding Tree HT
Low Energy Adaptive Clustering Hierarchy LEACH
False Alarm Rate FAR
False Positive Rate FPR
False Negative Rate FNR
Very Fast Machine Learning VFML
Receiver Operating Characteristics ROC
Fish Bone Traceback FBT
Media Access Control MAC
Time To Live TTL
MAC Protocol Data Unit MPDU
xv

NOTATIONS
τ Threshold
AN Aggregate Node
BS Base Station
CH Cluster Head
t Flow of Traffic
s Sensor Node
M Malicious Nodes
k Number of Malicious Nodes in a Network
r Critical Node
ε Hoeffding Bound
G(.)+ Upper Bound
G(.)− Lower Bound
Tr Adaptive Threshold
In Number of Instances
ϕi Residual Proability
l Leaf
HBCount Total Number of Values in Sorted List
XS Sorted List of HB Values
S Stream of Samples
xvi

HT Hoeffding Tree
c Number of Classes
lp Length of Prunned Tree
ETT Efficient Traceback Technique
A Attack Path
a Attacker
v Victim
N Total Number of Nodes
τi Marking Probability
ϕi Residual Probability
p Attack Measure from a to v
K Uncertainty Factor
li Legitimate Node
d Travelling Distance
i Total Number of Nodes Along Attack Path
P (s) Label
m Maximum Uncertainty
HN Nth Harmonic Number
xvii

Chapter 1
INTRODUCTION
1.1 Introduction
Wireless Body Area Networks (WBANs) have emerged as a promising technology that has
shown enormous potential for improving the quality of healthcare and has thus, found a
broad range of medical applications from ubiquitous health monitoring to emergency medi-
cal response systems. The WBANs has a potential to reduce health monitoring costs and im-
prove the quality of a patients’ life. However, the efficient management of the huge amount
of highly sensitive data collected and generated by WBAN sensor nodes requires an ascend-
able and secure storage and processing infrastructure. Given the limited resources of WBAN
sensors for power, storage and processing, the integration of WBANs and cloud computing
provides a powerful, viable and hybrid platform to process the enormous amount of data col-
lected from multiple WBAN nodes. It must also be able to realize long term patient health
monitoring and the analysis of his/her health records under different situations [1] [2].
In cloud computing, wireless devices do not need computing facilities, data storage, pow-
erful configuration such as high speed CPUs, and other software services, since their data
and complicated computing operations can be shifted and processed in the cloud, which sig-
nificantly reduces the operational and maintenance costs [3] [4]. The seamless integration
of WBAN and cloud computing will provide several benefits to e-Healthcare, including bet-
ter patient care, cost reduction, solution to resource scarceness, better health quality, and
research and strategic planning support [5].
However, despite the benefits of cloud-assisted WBAN, several security issues and chal-
lenges remain unresolved. Among these, data availability is the most nagging security issue.
The most serious threat to data availability is a Distributed Denial of Service (DDoS) attack
that directly affects the all-time availability of a patients data [1]. The existing solutions
for standalone WBANs and sensor networks are not applicable in the cloud. For detect-
ing a DDoS attack in cloud-assisted WBAN, there is a need for a defensive approach that
1

understands the network semantics and flow of traffic in the networks.
This chapter is organized as follows. Section 1.1 introduces the basic concept of cloud-
assisted WBAN. Section 1.2 highlights the security requirements of Cloud- Assisted WBAN
in context of Confidentiality, Integrity and Availability (CIA). In section 1.3, a brief overview
of DDoS attack is given both in conventional networks and cloud-assisted WBAN environ-
ment. Section 1.4 highlights the motivation and objectives of this research work. Section 1.5
summarizes the research contributions and outcomes of the research. Finally, in section 1.6,
the overall structure of the thesis is given.
1.2 Security Requirements for Cloud- Assisted WBAN in context of Confidentiality,
Integrity and Availability (CIA)
The security of sensors, the data collection at aggregate nodes and the transmission of that
data over cloud via an unsecured network is an important and critical issue. As in other se-
cure systems, key security requirements are also required for cloud- assisted WBAN applica-
tions. These requirements are confidentiality, integrity and availability (CIA) [6]. Therefore,
it is important to understand these security requirements before integrating adequate security
solutions. Following are the fundamental security requirements for provisioning security in
cloud- assisted WBAN:
1. Data Confidentiality: Data confidentiality is required to protect sensitive data from
eavesdropping by a rouge sensor or intruder. In e-Health applications, the WBAN sen-
sors send sensitive information about patient health status. An adversary can eaves-
drops on the communication and can overhear the critical information, which may
cause a severe damage to the patient data. Achieving confidentiality requires a crypto-
graphic key for encrypting patients data. But due the resource scarce nature of WBAN
sensors, it is very challenging to generate, store and use cryptographic keys for en-
cryption [6] [7].
2. Data Integrity: Lack of data integrity mechanism allows an adversary to modify or
tamper the patients information when transmitted over an insecure channel. It is very
hazardous especially for life critical events. Therefore, it is essential to ensure the
presence of adequate data integrity mechanism [6] [7].
2

3. Availability: Attacks on network availability (like DoS, DDoS attacks), where the
attacker tries to reduce the networks capacity and performance and even make the
network unavailable to legitimate users [6] [7].
Several popular schemes [8] [9] [10] have been proposed in the literature to satisfy the data
authentication, integrity and confidentiality requirements for provisioning security in sensor
networks. However, very little research has been done to address the issue of availability of
sensor nodes under attack.
1.3 Distributed Denial of Service Attack
A Distributed Denial of Service (DDoS) attack is defined as an explicit attempt by an at-
tacker to exhaust the resources of a victim node. Multiple nodes are deployed to launch an
attack by sending a stream of packets towards the victim, thus consuming the key resources
of victim node and making them unavailable to legitimate nodes.These resources mainly
include the network bandwidth, computing power, and memory resources [13] . Section
1.3.1 and section 1.3.2 explains the DDoS attack in conventional networks cloud- assisted
WBANs respectively.
1.3.1 Distributed Denial of Service Attack: Conventional Network
A Distributed Denial of Service (DDoS) attack is defined as an explicit attempt by the mali-
cious nodes to launch an attack against victim node in order to exhaust the victim resources
and prevent it from providing services to legitimate users. This type of attack is distributed
in nature, i.e. multiple nodes are deployed to launch an attack by sending a stream of pack-
ets towards the victim, thus, consuming the key resources of victim node and making them
unavailable to legitimate nodes. These resources mainly include the network bandwidth,
computing power and memory resources [11].
In conventional networks, a DDoS attack can be launched by either vulnerability (i.e.
exploiting a protocol or a running application by sending malformed packets towards the
victim) or by overwhelming the victim in order to exhaust the resources of victim machine
[11].
In DDoS attack, the attacker follow the principle: ”Power of many is greater than few to
launch an attack”. These attacks aim to compromise the legitimate machines in the network
which then participate in the attack process as governed by the master attacker [12].
3

The attacker initiates an attack by first inspecting the vulnerable machines in the network
through network scanning. After identifying the vulnerable machines, the attacker exploits
the identified vulnerabilities to gain access to these machines and infect them with malicious
code or install attack patches on them. These vulnerable machines are thus, compromised
and used by an attacker to launch DDoS attack against the selected victim machines to either
overwhelm their resources or crash them [13].
The compromised nodes, also called zombies, are widely scattered over the network and
are remotely controlled by the attacker. The attack code installed on these zombies are
triggered simultaneously by the attacker in order to launch a DDoS attack towards the victim
machine. The complete scenario of DDoS attack in conventional network is depicted in
Figure 1.1. As a result, the victim machine is overwhelmed by receiving a huge amount of
Figure 1.1: DDoS Attack in Conventional Network
traffic from all directions and is unable to respond to legitimate requests.
1.3.2 Distributed Denial of Service Attack: Cloud-assisted WBAN
In cloud- assisted WBAN, an attacker launched a DDoS attack by triggering attack code
on multiple compromised sensor nodes simultaneously in order to send hoax messages to a
victim node in very short intervals of time. As a result the victim node is overwhelmed with
4

huge amount of traffic then its maximum processing power thus, exhausting its resources
and prevent it from providing services to its legitimate users [1].
In cloud-assisted WBAN, the attacker node is several order of magnitude higher process-
ing power than a regular sensor node. These attack nodes compromised the legitimate sensor
nodes in the network and forged their identities with an intention to launch an attack by send-
ing the huge inflows of traffic towards the victim node [1]. Before designing any security
scheme for detecting DDoS attack in cloud- assisted WBAN environment, there is a need to
understand the network semantic and flow of traffic in these networks.
Figure 1.2 illustrates the DDoS attack mechanism in WBANs. The cloud follow the mech-
anism of conventional network shown in Figure 1.1. As given in Figure 1.2, the attacker
launch DDoS attack from multiple points towards a single victim sensor node in order to
overwhelm it with huge number of hoax requests.
Figure 1.2: DDoS Attack Illustration in WBANs
The attacker can be one of the following: a malicious node injected in the network by an
attacker, legitimate node compromised by an attacker by forging its identity and laptop class
node having additional processing capabilities. The intention of any attack category is to
exhaust the energy resources of the victim node.
1.4 Motivation and Problem Statement
Besides other open issues in WBAN environment such as energy efficiency, quality of ser-
vice, and standardization; security and privacy are the key issues that need special attention.
Among these security issues, data availability is the most nagging security issue. Availability
determines whether a sensor node has the ability to use the resources and whether the net-
work is available for data communication. However, failure of the base station or aggregate
5

nodes availability will eventually threaten the entire sensor network for health critical appli-
cations. Thus availability is of utmost importance for maintaining an operational network.
The DDoS attack is one of the most powerful attacks on the availability of patients health
data and services of health care professional. DDoS attack severely affects the capacity and
performance of a WBAN network if not handled in a timely and appropriate manner [14].
DDoS attack does not aim at disruption or interference with the real sensor data. Rather
they take advantage of disparity present between the network bandwidth and limited re-
source availability of the victim. Detecting and preventing against such attacks in cloud-
assisted WBAN is an important concern. Attacks can be avoided by first detecting an attack
followed by attack prevention and mitigation. Attack detection is an initial step of any de-
fense approach that needs to be taken prior to attack mitigation techniques. Similarly, attack
prevention also plays an important role in protecting a network from malicious attacks. This
thesis mainly focused on the DDoS attack detection and prevention algorithms and proposed
a novel solution that not only consumes less resources but also produce accurate results.
The limited resources of WBANs are not enough to mitigate the huge amount of traffic
generated by DDoS attack. Therefore, there is a need for an approach that is light weight
and capable of handling real-time high speed sensor data for the detection of such attacks
in cloud- assisted WBAN environment. The concern of detecting and preventing the DDoS
attack in cloud- assisted WBAN remains unresolved. All the solutions proposed for such
attacks in conventional networks are not directly applicable in cloud-assisted WBAN envi-
ronment due to the resource scarceness of these networks. The multiple entry points into
these networks leave them more vulnerable to such attacks which makes the attack detection
and prevention process more complicated.
The aim of this research is to design a light-weight, in-network, distributed and scalable
approach for detecting DDoS attack that is capable of handling high- speed streaming data
generated by WBAN sensors in cloud- assisted WBAN environment. The goal is to propose
the attack detection technique with improved performance when compared to exiting tech-
niques in terms of: i) improved attack detection accuracy; ii) minimizing overall resource
usage and iii) reducing overall computational cost. Analyzing and comparing the existing
techniques for detecting attacks in both conventional and wireless sensor networks concludes
that the data mining techniques have proved to be the most promising solution for identifying
6

the malicious behavior of nodes in these networks through pattern discovery. Therefore, in
this research we have explored the data mining technique that is light-weight and have fur-
ther optimized it for handling high-speed streaming data originating from WBAN sensors.
Another objective of this research is to propose an efficient traceback technique specifi-
cally for cloud- assisted WBAN environment that incur minimal overhead on the network.
The proposed technique is efficient in packet marking and path reconstruction procedures for
tracebacking and identifying the source of DDoS attack with less convergence time. Differ-
ent traceback techniques have been analyzed and their comparison drawn to the conclusion
that Probability Packet Marking (PPM) is the most appropriate and widely used approach in
both conventional and wireless sensor networks [15] [16]. The key issue of PPM lies in as-
signing the marking probability for path reconstruction. Therefore, we model the traceback
of DDoS attack as a marking probability assignment problem and further optimize it for ef-
ficient traceback of DDoS in cloud- assisted WBAN environment. The purpose of selecting
PPM technique is to reduce the overhead on sensor nodes.
1.5 Contributions and Outcomes
Specifically this research has resulted in the following contributions and research outcomes:
Contribution 1: A cloud- assisted WBAN architecture is proposed that integrates a wireless
body area network with cloud computing to store and process the data collected by WBAN
sensors for patients eHealth monitoring. The proposed system architecture is scalable and is
able to store the huge amount of data generated by WBAN sensors. Based on the proposed
architecture, a framework has been proposed for the detection and prevention of DDoS at-
tack in cloud- assisted WBAN environment. Further, we have identified the possible attack
points where DDoS attack occurs and for which the solutions have been proposed.
Contribution 2: Proposed, deployed and analyzed an efficient destination-based attack
detection technique for detecting DDoS attack in cloud-assisted WBAN environment.
• Proposed a distributed denial of service attack detection system.
• An algorithm for attack classification has been proposed that is capable of handling
noisy data and detects a DDoS attack efficiently with high accuracy and low false
7

alarm rates.
• Performance evaluation and comparative analysis has been performed on both syn-
thetic data generated by simulation and real-time data generated by deploying actual
WBAN hardware testbed.
Contribution 3: Proposed, deployed and analyzed an efficient traceback technique to trace
the source of a DDoS attack in cloud- assisted WBAN environment.
• A novel packet marking technique has been proposed for both single-hop and multi-
hop WBAN topology.
• A novel labeling technique has been proposed to find the traveling distance of node
from the source.
• An aggregate node path reconstruction algorithm is proposed to reconstruct the path
from victim to the aggregate node of the cluster that contains the attacker and the
source node.
• A sensor node path reconstruction algorithm has been proposed to perform the path
reconstruction from aggregate node to the source node from where the attack origi-
nates.
• Simulations have been performed to evaluate the performance of proposed traceback
technique. Finally, a comparative analysis has been done to show the dominance of
proposed technique over existing techniques.
1.6 Thesis Outline
This thesis is divided into eight chapters. A brief overview of each chapter is given in this
section.
Chapter 2 introduces the role of data mining in the detection of DDoS attack. Further,
the chapter provides the background information on existing data mining and stream mining
techniques. The advantages and limitations of different techniques are also presented along
with their implications when applied in cloud- assisted WBAN environment. The effect of
noise on streaming data is then discussed. Finally, for the prevention of DDoS attack, the
8

background information on existing traceback mechanisms are discussed in details along
with their drawbacks and limitations when used in cloud-assisted WBAN environment.
In Chapter 3, the proposed cloud- assisted WBAN architecture is presented. Each module
of proposed architecture is discussed in detail. Further, we highlighted the possible areas that
are vulnerable to DDoS attack and require a security mechanism for the prevention of DDoS
attack. Based on the proposed cloud-assisted architecture, a novel framework for detecting
and preventing DDoS attack in cloud- assisted is proposed. For evaluating the proposed
framework, a DDoS attack detection technique is proposed in Chapter 4 and DDoS attack
prevention technique is proposed in Chapter 6.
In Chapter 4, the proposed DDoS attack detection system is presented. Each phase of
attack detection system is elaborated. Further, the statistical features are identified that helps
in the detection of DDoS attack. An improvement of Very Fast Decision Tree (VFDT) [53]
namely Enhanced VFDT (EVFDT) is then proposed that is capable of handling noisy data
and detects a DDoS attack efficiently with high accuracy and low false alarm rate. Different
procedures of proposed EVFDT are given and discussed in detail along with the algorithms.
Chapter 5 discusses the performance evaluation and benchmarking of proposed DDoS at-
tack detection technique. The basis of performance evaluation is to analyze the effectiveness
of attack detection technique in detecting DDoS attack. Likewise, the comparative anal-
ysis is performed to show the dominance of proposed technique over existing techniques
for detecting DDoS attack. The complete evaluation and comparison process is performed
separately on both synthetic datasets generated by simulation in NS-2 and dataset generated
by deploying actual WBAN hardware testbed environment. The performance metrics that
are used to evaluate and compare the simulation results includes: attack detection accuracy,
false alarm rate, sensitivity vs specificity, computational cost, tree size and resource usage.
In Chapter 6, a traceback technique called Efficient Traceback Technique (ETT) is pro-
posed, to be deployed specifically in resource constrained WBAN for both multi-hop and
single- hop topology. For packet marking, a novel labeling technique is proposed. Subse-
quently, a working example is given to show the effectiveness of proposed technique. Fur-
ther, a DDoS attacker traceback algorithms are proposed for path reconstruction and attacker
identification. This mechanism comprises of two procedures: Procedure for Aggregate Node
Path Reconstruction (to reconstructs the path from victim to the aggregate node of the cluster
9

that contains the attacker and the source node), and Procedure for Sensor Node Path Recon-
struction (to perform the path reconstruction from aggregate node to the source node from
where the attack originates.
In Chapter 7, the performance of proposed traceback technique is evaluated through sim-
ulation and experiments. The proposed technique assigns the dynamic marking probability
to each node along the path, and further reconstructs the attack path to efficiently traceback
the attacker and making subsequent decisions. The performance of proposed scheme is af-
fected by few network parameters. The variation in these parameters are used to quantify the
results, based on simulation experiments. The network Simulator NS-2 is used to compared
and analyze the performance metrics including: convergence time, overhead and uncertainty.
The acquired simulation results are compared with corresponding results obtained from the
simulation of existing traceback techniques for both multi-hop and single-hop WBAN net-
work. Simulation results show that the proposed technique yields superior results compared
to existing techniques.
Finally, Chapter 8 concludes the thesis with future directions
10

Chapter 2
DISTRIBUTED DENIAL OF SERVICE ATTACK: A Review
With the increasing popularity of cloud- assisted WBAN for e-Health applications, the de-
mand for securing these networks is also increasing. Existing security attacks on high speed
networks (internet) and their solutions are not directly applicable on cloud assisted WBAN
environment. The underlying reasons for this lack of applicability are: a) It is fairly new
technology which includes the limitations of both WBAN and cloud; b) Resource scarce
nature of WBAN sensor nodes: limited processing power, low computation capabilities and
less memory; c) Multiple entry points to WBAN network; d) Non- triviality in selecting
particular critical sensor node [17].
For detecting security attacks in these networks, there is a need for the development of
attack defensive approaches that understand and analyze the network semantics and flow of
the traffic in these networks. Attacks can be avoided by first detecting an attack followed by
attack mitigation and prevention. Attack detection is an initial step of any defense approach
that needs to be taken prior to attack mitigation techniques. Similarly, attack prevention also
plays an important role in protecting a network from malicious attacks.
This chapter is organized as follow. Section 2.1 introduces cloud- assisted WBAN, with
emphasis on the security issues related to this technology. Section 2.2 provides an in-depth
analysis of the classification of DDoS attack, focusing on the types of DDoS attack and
their targets. In section 2.3, we present an overview of data mining techniques and their
importance in detecting malicious behavior of a network. Further, the existing data mining
techniques and for DDoS attack detection along with their limitations are discussed in this
section. Section 2.4 discusses the stream mining techniques for mining high speed stream
data. In section 2.5, we discuss the effect of noise on stream data. Section 2.6 provides a
detailed analysis of the existing traceback mechanisms for DDoS attack and their limitations
for resource constrained WBAN. Finally, the chapter is summarized in section 2.7.
11

2.1 Cloud- Assisted Wireless Body Area Networks
Due to advancements in wireless technologies and emerging ideas such as wireless sensor
networks, wireless body area networks, and other types of low power wireless communica-
tion networks, patient health monitoring and other related services are becoming more and
more popular. These networks will reduce health monitoring costs and improve the quality
of a patients life [14] [18]. However, the efficient management of the massive amount of
monitored data gathered by various WBAN sensors is a key problem for their large scale
adaptation in healthcare services. Therefore, there is a need for innovative solutions to meet
the growing challenges of handling the exponential growth in data generated by WBAN
sensor nodes. WBAN nodes have limited power, energy, capacity, and computation and
communication capabilities. Yet, at the same time, they need to be scalable and power-
ful, with secure storage and high-performance computation, and they require real time data
processing and storage, especially for e-health applications [19] [20].
2.1.1 Integrating WBAN with Cloud Computing Technology
Cloud computing is a promising technology that is expected to play an important role in
attaining the afore stated goals [21] for healthcare management. The integration of a WBAN
with cloud computing introduces a hybrid and feasible platform to process the enormous
amount of data gathered from various WBAN sensor nodes. It must also be able to realize
long term patient health monitoring and the analysis of patients health records under differ-
ent situations. In cloud computing, wireless devices do not need computing facilities, data
storage, powerful configuration such as a high speed CPU, and other software services, since
their data and extensive computing operations can be shifted and processed on the cloud, thus
significantly reducing the operational and maintenance costs [3] [5]. The flawless integra-
tion of WBAN and cloud computing will provide several benefits to e-healthcare, including
better patient health care, reduced cost, solution for resource scarceness, and research and
strategic planning support [2]. This cloud-assisted WBAN will enable medical servers and
physicians to universally access the storage and processing infrastructure on a pay-as-you-go
pricing model [22].
Figure 2.1 depicts the typical cloud-assisted WBAN conceptual architecture for the e-
health monitoring solution being considered in this research. The architecture is multi-tiered
12

Figure 2.1: Cloud-Assisted WBAN Conceptual Architecture for E-Health Monitoring
and described below:
1. Tier 1 - WBANs: It represents WBANs and incorporates a set of small, intelligent,
wireless in-body and on-body sensors that are placed purposely on the patients body.
These sensors monitor, process, and store information about the patients physiological
parameters. The mobile devices (PDAs and smart phones) serve as gateways for the
WBAN, also known as the Body Control Unit (BCU). Because the WBAN application
is related to patients health, there is a need for a reliable packet delivery system for data
from a WBAN node to the BCU, i.e., acknowledgments of delivered packets and the
retransmission of lost packets. This tier will emphasize the communication channel
used as a transport layer protocol [1].
2. Tier 2 - Transmission: Depicts the transmission medium, in which the mobile de-
vices transmit the sensed data to the e-health care service provider over the cloud for
performing health care related tasks. The base station or an access point is respon-
sible for collecting data from tier-1 and transferred it to cloud via insecure network
(internet) for further processing. The transport layer of the network stack specifies
the protocol (TCP/UDP) through which the BCU and e-healthcare service provider
communicate [1].
13
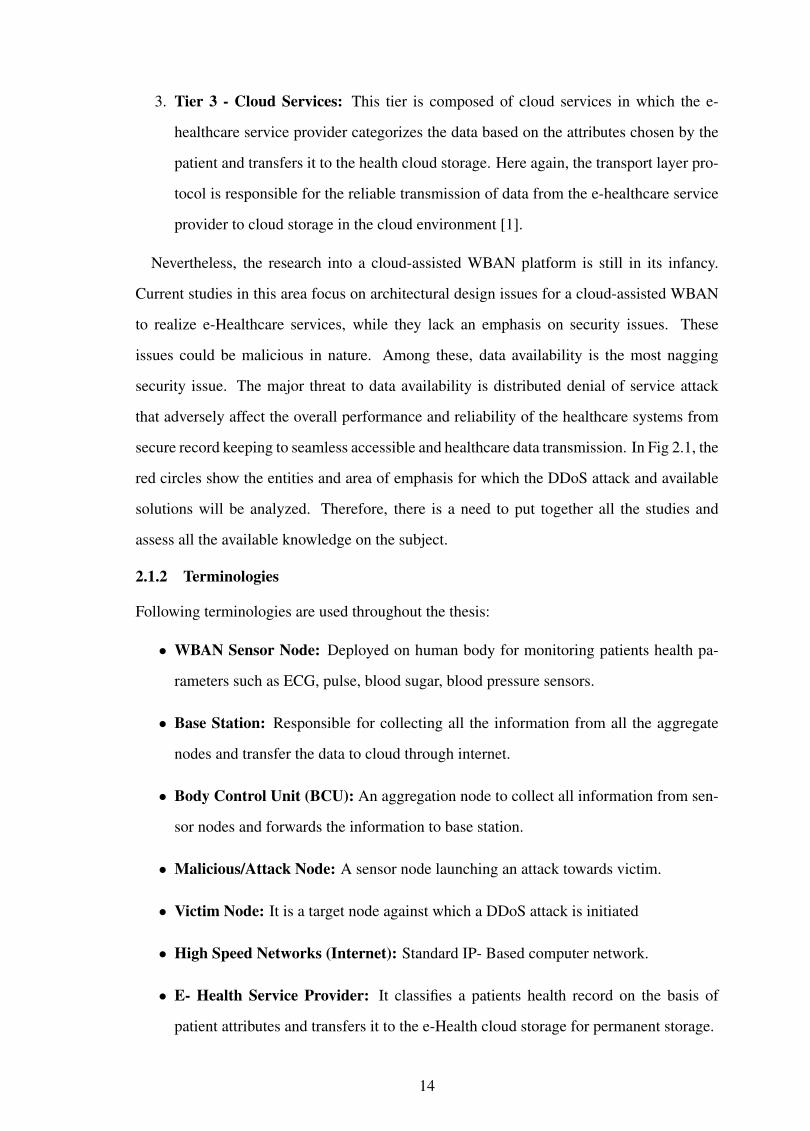
3. Tier 3 - Cloud Services: This tier is composed of cloud services in which the e-
healthcare service provider categorizes the data based on the attributes chosen by the
patient and transfers it to the health cloud storage. Here again, the transport layer pro-
tocol is responsible for the reliable transmission of data from the e-healthcare service
provider to cloud storage in the cloud environment [1].
Nevertheless, the research into a cloud-assisted WBAN platform is still in its infancy.
Current studies in this area focus on architectural design issues for a cloud-assisted WBAN
to realize e-Healthcare services, while they lack an emphasis on security issues. These
issues could be malicious in nature. Among these, data availability is the most nagging
security issue. The major threat to data availability is distributed denial of service attack
that adversely affect the overall performance and reliability of the healthcare systems from
secure record keeping to seamless accessible and healthcare data transmission. In Fig 2.1, the
red circles show the entities and area of emphasis for which the DDoS attack and available
solutions will be analyzed. Therefore, there is a need to put together all the studies and
assess all the available knowledge on the subject.
2.1.2 Terminologies
Following terminologies are used throughout the thesis:
• WBAN Sensor Node: Deployed on human body for monitoring patients health pa-
rameters such as ECG, pulse, blood sugar, blood pressure sensors.
• Base Station: Responsible for collecting all the information from all the aggregate
nodes and transfer the data to cloud through internet.
• Body Control Unit (BCU): An aggregation node to collect all information from sen-
sor nodes and forwards the information to base station.
• Malicious/Attack Node: A sensor node launching an attack towards victim.
• Victim Node: It is a target node against which a DDoS attack is initiated
• High Speed Networks (Internet): Standard IP- Based computer network.
• E- Health Service Provider: It classifies a patients health record on the basis of
patient attributes and transfers it to the e-Health cloud storage for permanent storage.
14

• Health cloud Storage: Responsible for storing and retrieving data upon request by
authorized users (pharmacists, doctors, health workers, etc.).
• Data Requesters: These include healthcare professionals (doctors, nurses, health
workers) that use application specific services (SaaS) to access a patients stored data.
2.1.3 Cloud- Assisted WBAN Applications
Cloud- assisted WBANs are deployed for various applications [6]. Some of these are dis-
cussed below:
1. Medical Application: As the proposed solution helps in monitoring patients health in
hospitals and disastrous areas. In both scenarios, there is a demand for highest levels
of security, i.e. the medical information should not be leaked and only accessible to
authorized personals. Similarly, the information should be available continuously to
ensure better health monitoring.
2. Gaming, entertainment and consumer electronics: The gaming applications need
wireless devices that can sense different body postures and provide input to the appli-
cations. For example, body position and movement sensors. Entertainment systems
like wireless headphones demand for higher bandwidth and consume high power since
duty cycling cannot be used. Typically, gaming sensors connect a gaming console
where the data is collected for interactive gaming and entertainment systems connect
to a device which provides data.
3. Lifestyle: These application environments and devices around the user are sensitive
to the users, their moods and their activities. One can achieve the goals of these ap-
plications using WBAN, which can provide facilities to uniquely identify each user,
recognize his/ her mood and monitor activities. WBAN sensors can connect to ac-
cess points that activate personalization, identify the users using digital signatures and
periodically transmit sensors data to the which system that recognizes the mood and
activity of the user.
2.2 Distributed Denial of Service (DDoS) Attack in Cloud- Assisted WBAN
A Distributed Denial of Service (DDoS) attack is defined as an explicit attempt by an attacker
to exhaust the resources of a victim node. Multiple nodes are deployed to launch an attack
15

by sending a flow of data packets to the victim, thus consuming the key resources of victim
node and make them unavailable to legitimate nodes. These resources mainly includes the
network bandwidth, computing power and memory resources [11]. A detailed analysis of
distributed denial of service attack in cloud- assisted WBAN environment and its implication
shows that DDoS attack has following characteristics:
1. During an attack, the packet length, sequence number and window size remains fixed.
2. Source IP and destination IP address along with port numbers are spoofed and gener-
ated randomly.
3. Packet throughput decreases for legitimate users, which is defined as the number of
bytes transferred from source to destination per unit time.
4. Packet loss increases for legitimate users, which occurs due to the interaction of legit-
imate traffic with attack traffic.
5. Packet delays increases as network congestion builds up.
2.2.1 Classification of DDoS Attack
Under DDoS attack, the sensor node or the base station of a wireless body area network is
similar to the system or a server of a standard IP- based network, under DDoS attack. As
shown in Figure 2.2, DDoS attack can be classified into two broad categories namely band-
width depletion attack and resource depletion attack. Each of these broad categories can
be further classified into two subcategories. Bandwidth depletion attack can be subdivided
into flood attack and amplification attack whereas resource depletion attack can be subdi-
vided into protocol exploitation and malformed packet attack. Each of these attacks and
their subcategories are discussed in this section.
Bandwidth Depletion Attack
In bandwidth depletion attack, the goal of an attacker is to flood the victim node with huge
amount of traffic to prevent the legitimate traffic to reach the victim node. It is further divided
into flood attack and amplification attack [11].
• Flood Attack: In flood attack, zombies send huge amount of traffic towards a vic-
tim node in order to congest the network bandwidth of victim node with IP traffic.
16

Figure 2.2: DDoS Attack Classification
As a result, the victim node crashes, slows down or get affected from overwhelmed
networks bandwidth. Thus blocking the legitimate users to access the victim node.
These attacks are generally launched using UDP (User Datagram Protocol) and ICMP
(Internet Control Message Protocol) packets [11].
In UDP flood attack, an excessive amount of UDP packets are forwarded to selected
or random port of the victim node. If no application is running on the specified port of
the victim node, an ICMP packet is send as a message reply stating that the destination
port is unreachable. The DDoS attacking program will spoof the source IP address of
the attacked packet which helps to conceal the identity of the secondary victim nodes.
The packet returned from the victim node will not be sent back to zombies but instead
send to spoofed addresses.UDP flood attacks also utilize the connections bandwidth
near the victim system [11].
In ICMP flood attack, zombies send an excessive amount of ICMP-ECHO-REPLY
packets ping to the targeted node. These packets prompt the victim node to reply and
the combination of traffic overload the connection bandwidth of the victims network.
During an ICMP attack, the attacker also spoof the source IP address of the ICMP
packet [11].
• Amplification Attack: In an amplification attack, an attacker sends a large number
of messages to a broadcast IP address. Doing this will enable all the nodes in the
network that receives the broadcasted message to send a reply to a victim node. The
17

attacker will use amplification in order to raise the attack traffic volume. It includes
smurf attack and fragile attack [11].
Smurf Attack: A smurf attack involves an attacker to send packets to the IP address of
victim using amplification [11].
Fragile Attack: In fragile attack, the attacker sends packets to the network amplifier
using the UDP ECHO packets. Fragile attacks generate additional malicious traffic,
thus, causing more damage to the victim [11].
Resource Depletion Attack
In resource depletion attack, the goal of an attacker is to block the critical resources (pro-
cessor and memory) of a victim node in order to prevent the legitimate user from using
these resources. It is further divided into protocol exploitation attack and malformed packet
attacks [11].
• Protocol Exploitation Attack: The protocol exploitation attack can be further divided
into PUSH + ACK attack and TCP SYN attack [11].
TCP SYN Attack:In TCP SYN attack, an attacker programs zombies to send RCP SYN
requests to victim node in order to consume victim resources and prevents it from
responding to legitimate requests. It is a three- way handshake between the source and
the destination node in which source node spoof the IP address of victim and sends a
huge volume of TCP SYN packets to the victim node. In response, the victim node
sends ACK+SYN but did not receive the final ACK from the sender. This results in the
exhaustion of victim resources and the victim node is unable to respond to legitimate
requests [11].
PUSH+ACK Attack: PUSH+ACK attack involves the attacker sending TCP packets
and PUSH+ACK bits simultaneously. It will be prompt in the TCP packet header and
command the victim to offload data in TCP buffer and send acknowledgement once it
is completed [11].
• Malformed Packet Attacks: Malformed packet attack involves the attacker to in-
struct the zombies to send wrong IP packets to victim node in order to crash it. It is
further divided into IP address attack and IP packet attacks [11].
18

On the basis of DDoS attack classification discussed above, a complete DDoS attack tax-
onomy is discussed in section 2.2.2 according to which the existing DDoS defense mecha-
nisms are studied and analyzed.
2.2.2 A Taxonomy of Distributed Denial of Service Attack Defense Mechanisms
To combat DDoS attack, various mechanisms have been proposed to date in literature. All
of the existing techniques are proposed and implemented for high speed networks or wire-
less sensor networks. None of the mechanism is suitable for resource constrained WBAN
networks. This section classifies the DDoS defense mechanisms against two types of DDoS
attacks (bandwidth depletion attacks and resource depletion attacks) discussed in section
2.2.1 on the basis of two criterias. These classification criteria are crucial for the formula-
tion of efficient and robust defense strategy against DDoS attacks [11].
1. The first criteria for classification is based on the location at which the defense mech-
anism is deployed. Based on this criteria, the defense mechanisms are classified into
three categories: source-based, destination-based and network-based defense mecha-
nisms [11].
2. The second criteria for classification is the time at which the defense mechanism is
deployed in order to response to DDoS attack. Depending on this criteria, the defense
mechanisms are divided into three categories: before the attack, during the attack and
after the attack [11].
Figure 2.3 shows the taxonomy of DDoS defense mechanism according to which the
existing DDoS defense mechanism are studied and analyzed. The detail of DDoS attack
taxonomy is given below:
Deployment Location
1. Source-Based Defense Mechanisms: Source-based mechanisms are deployed close to
the source of the attack in order to prevent network users from generating DDoS at-
tacks. Source-based mechanisms are deployed either at the entry point (edge router) of
the sources core network or at the at the access router of a routing domain that connects
to the sources local network through edge router. Several source-based mechanisms
19

Figure 2.3: Taxonomy of DDoS Defense Mechanism
have been proposed for detecting DDoS attack at the source and are discussed later in
this section [17].
2. Destination-Based Defense Mechanisms: Destination-based mechanism are deployed
close to the victim of the attack. Both attack detection and response is performed at the
destination of the attack. These mechanisms must be capable of observing the victim
model and its behavior in order to detect anomalies [17].
3. Network Based Defense Mechanisms: Network-based defense mechanism are de-
ployed inside the network. The objective of these mechanisms are to detect the attack
traffic and create response to stop t at intermediate network [17].
4. Hybrid (Distributed) Defense Mechanisms: Hybrid defense mechanisms are deployed
at various locations such as source, destination or intermediate networks and there
is usually collaboration among the deployment points. Detection can be done at the
victim or intermediate network and the response can be initiated and distributed to
other nodes by the victim [17].
Table 2.1 summarizes the defense mechanisms based on deployment location along with the
features and enumerates the pros and cons of each category.
20

Table 2.1: DDoS Defense Mechanisms based on Deployment Location
Features Pros ConsSource-Based
Detection and responseare deployed at source
Helps in Preventing theloss of resources by fil-tering the traffic at thesource
It is difficult to detect anattack traffic at source dueto less volume of traffic
Destination-Based
Detection and responseare deployed at victim
These defense mech-anisms are easier andcheaper to deploy be-cause of their access tothe aggregate traffic nearthe victim node
The detection and re-sponse of the attackcannot be done untilit reaches the victimwhich cause the resourcewastage on the pathstowards the victim
Network-Based
Detection and responseare deployed at inter-mediate network
Detection and tracebackof attack source is easybecause the aim is to fil-ter attack traffic as closeto source as possible
- Excessive storage andprocessing overheadsat intermediate points.- Less traffic availablefor attack detection at in-termediate access points.- Difficult deploymentbecause it requires thereconfiguration of allrouter on the network.
Hybrid(Dis-tributed)
Both detection andresponse occurs atdifferent locations:Detection takes placeeither at intermediatenetwork or destinationnode whereas responsetakes place at thesource node
- More robust againstDDoS attack. -More resources availableat various levels to han-dle DDoS attack effi-ciently.
- Strong collaborationamong the deploymentpoints is required.- Comlexity and overheaddue to the communicationbetween distributed com-ponents spread all overthe network.
Time at Which the Defense Mechanism is deployed
1. Before an Attack (Attack Prevention): The best time to stop a DDoS attack is at its
initial stage when it is launched. It is done by deploying attack prevention mechanisms
at source, destination and intermediate network. Attack prevention can be done by
employing filters, installing Intrusion Detection Systems (IDS), firewalls and Intrusion
Prevention Systems (IPS) [11].
2. During an Attack (Attack Detection): Attack detection is the key step in defending
against DDoS attack that occurs during the attack. These mechanism can also be de-
21

ployed at source, destination, intermediate networks and hybrid locations. A number
of attack detection mechanisms exists in literature and discussed in section 2.3.1.
3. After an Attack (Traceback the Source of an Attack and Response): The main focus
of DDoS attack mechanism is to minimize the impact of an attack and maximize the
availability of resources and services for legitimate users. Therefore, the DDoS de-
tection mechanism must be followed by the two main categories of after the attack
mechanisms: (a) the first category is traceback mechanism which is responsible to
identify (trace) the source of the attack. These are discussed later in Chapter 6, (b)
the second category is responsible for initiating an appropriate response to the attack.
The most common response mechanism is throttling (rate- limit) applied on identified
attack flows [3].
To overcome the effects of DDoS attack in cloud-assisted WBAN environment various tech-
niques have been studied and explored during this research according to the classification
and taxonomy of DDoS attack. Among these, data mining classification techniques have
proven itself as a valuable tool to identify misbehaving nodes and thus for detecting DDoS
attacks. Therefore, in section 2.3, data mining technique are studied and analyzed for their
effectiveness and efficiency in detecting DDoS attacks.
2.3 Role of Data Mining in Distributed Denial of Service Attack Detection
Data mining, also known as knowledge discovery, is a under studied topic in the field of com-
puter science that employs a number of existing computational techniques from statistics,
information retrieval, machine learning and pattern recognition [23]. According to Patcha
et al. [24], ”Data mining is concerned with learning patterns, association, changes anoma-
lies and statistically significant structures and events from large quantities of data”. Fig 2.4
depicts the process of data mining that transforms the raw data to valuable knowledge.
Data miners are trained at using specialized automated software to discover regularities
and irregularities in large and complex data sets. In the recent past, data mining techniques
have been considered as one of the most promising solution for identifying the malicious
behavior of nodes in the network and became an important component for the detection and
prevention of DoS and DDoS attacks [25].
The aim of deploying WBAN for e-health applications is to make the real-time decisions
22

Figure 2.4: Data Mining Process
efficiently, which seems to be a very challenging task due to the highly resource constrained
computing, communication capacities and high speed of non-stationary data generated by
WBAN sensors. This challenge is the source of motivation to select and explore the data
mining techniques that is light-weight and deals with discovering patterns from large con-
tinuous stream of WBAN sensors data. Specific tasks that data mining might contribute to a
DDoS attack detection in Cloud-assisted WBAN are as follows:
1. Help to mine the sensor data for uncovering patterns in order to make intelligent deci-
sions immediately after an attack occurs.
2. Detect anomalous activities that expose a real attack .
3. Identify large continuous patterns in ongoing streams of sensor data i.e., different IP
address, same activity etc.
4. Identify bad sensors signatures .
5. Detect previously unknown network anomalies.
To fulfill these specific tasks, data miners utilize a single or a combination of data min-
ing techniques. These includes: statistical techniques, data summarization, visualiza-
tion, clustering, association rule and classification techniques [26]. The effectiveness
of each technique depends upon the application scenario on which it is applied. Table
2.2 shows the details of these techniques along with their pros and cons [27] [28].
Finally, we analyze the consequences of choosing data mining techniques in cloud-
assisted WBAN environment.
23

Table 2.2: Data Mining Techniques
Description Pros Cons ConsequencesA
ssoc
iatio
nR
ule
Min
ing These are focused on
the discovery of pat-terns and dependen-cies in data sets. Itis an expression of theform X ⇒ Y , whereX and Y are sets ofitems. Make use oftwo measures: sup-port and confidence[27].
Formulated to lookfor sequential patterns[27].
It is difficult to de-tect an attack traffic atsource due to less vol-ume of traffic
As WBAN sensorshas less compu-tational capacity,therefore buildingcomplex algorithmsis not a good choice
Clu
ster
ing Grouping together ob-
jects that are similarto each other but dif-ferent to the object be-longing to other clus-ter. These algorithmsare used for the de-tection of underlyingstructures within thedata [28].
Provides end userswith abstract view ofdatabase operations.Very fast computationon databases [9].
The effectiveness ofclustering techniquesdepends on the appli-cations. Once a mergeor a split is commit-ted, it cannot be un-done or refined [28].
As WBAN data ishigh speed continuousdata streams, whichleads to missing datavalues within the in-put data
Vis
ualiz
atio
n Visualization is a wayto transform poor datainto meaningful formby using a wide va-riety of data miningtechniques in order todiscover hidden pat-terns [28].
Visualization is a wayto transform poor datainto meaningful formby using a wide va-riety of data miningtechniques in order todiscover hidden pat-terns [28].
Difficult to under-stand when buildhierarchically . Asit is difficult forhumans to understandnumbers, so the sum-marization is requiredto put the data intographical form [28].
Computational inten-sive for WBAN be-cause summarizationis required to put thedata into human un-derstandable form.
Stat
istic
s Statistics is a branchof mathematics deal-ing with collectingdata and countingit [27].
Gives a high- levelview of the database.Provides a usefuland important in-formation about thedatabase [27].
These techniquesmake certain as-sumptions aboutdata [27].
As we are dealingwith human health,making assumptionsabout data is not agood idea.
Cla
ssifi
catio
n Classification Tech-niques predicts thecategory to whicha particular recordbelongs [28].
Simplicity and in-terpretability oftheir rules. Betterperformance and un-derstanding then otherDM techniques [28].
Data preparation pro-cedures are not re-stricted and imposedby any requirements[28].
Appropriate forWBAN due to theirsimplicity and inter-pretability of theirrules, derived easilyfrom the organizationof the tree in case ofdecision trees
24

2.3.1 Existing Data Mining Techniques for DDoS Attack Detection
In past, data mining techniques have been considered as one of the most promising so-
lutions for identifying the malicious behavior of nodes in the network. For this research,
data mining techniques have been studied and evaluated for the detection of DDoS attack
in cloud-assisted WBAN environment. From the perspective of DDoS attack detection, ex-
isting data mining techniques (Subbulakshmi [29], Wu et al. [30], Lee et al. [31], Arun et
al. [32], Thwe et al. [33]) can be broadly classified into source- based and destination- based
detection techniques. Source- based detection techniques are deployed near the source of
an attack whereas destination based detection techniques are deployed near the victim of an
attack. These detection techniques are discussed below:
Source- Based Detection Techniques
Lee et al. [31], have proposed an enhanced traffic matrix-based approach in which the traffic
matrix parameters are optimized using a Genetic Algorithm (GA). Only two features of the
IP header, namely packet arrival time and source IP address, are used to construct a traffic
matrix. From this traffic matrix, the variance is calculated and used to categorize the traffic
as normal (high variance) or a DDoS attack (low variance). Finally, upon the detection of an
attack, alerts are generated.
Arun and Selvakumar [32] investigated ensemble-based neuro-fuzzy classifiers. The key
contributions of the authors include a weight-update distribution policy, reduction in the
error cost, and ensemble output combination approach. The performance was evaluated
using attack test data, which was not included in the training data set. The results showed
that the proposed scheme is able to detect new attacks.
Destination Based Detection Techniques
In Wu et al. [30], a destination-based technique is proposed that deploys a decision tree at the
victim node and a traffic pattern matching technique for attack identification and traceback at
the source of an attack. For the classification of the tree, fifteen distinct network and packet
features were chosen to monitor the packet rate and byte rate to reveal the traffic flow pattern.
For the data classification, C4.5 classification algorithm was applied on chosen network and
packet features as tests to observe abnormal traffic flow.
25

Table 2.3: Comparison of existing DDoS attack detection mechanisms
Scheme Type Advantages Disadvantages
DDoS attackdetection withdecision treeC4.5 [30]
Destinationbased
-Capable of handlingfuture attacks-Efficient trace backprocedure-Suitable for any net-work topology
-Low classification ac-curacy when trainingdata is large-Requires an entiredataset to remain per-manently in memoryresults in memoryconsumption
DDoS attackdetection us-ing EnhancedSupportVector Ma-chines [29]
Destinationbased
-Fast Computation-Does not requiredataset to be stored inmemory
-Evaluate on obsoletedata set (KDD Cup)-Detection reliability isnot very high-Low accuracy
DDoS attackdetectionusing opti-mized trafficmatrix [31]
Sourcebased
-Time based windowis replaced with packetbased window size toreduce the computationoverhead-Increases the detectionrate by optimizing thefeatures of traffic ma-trix using Genetic algo-rithm
-Not suitable for realtime network traffic-Detection delay is high-May generate exces-sive alerts
DDoS attackdetectionusing an en-semble ofadaptive andhybrid neuro-fuzzy [32]
Sourcebased
-Suitable for handlinglarge stream of networkdata-No retraining of classi-fiers-Capable of incremen-tal learning-Better performance ascompared to other algo-rithms
-Hybrid approach mak-ing it complex in cloud-assisted WBAN envi-ronment-Prior knowledge ofdata distribution isneeded
DDoS attackdetection Us-ing K-NearestNeigh-bour [33]
Destinationbased
-Discovered unknownattacks-Attack characteristicscan be analyzed usingstatistical values
-Very high complexitydealing with large datasets-Computationallyexpensive-Not suitable for realtime data mining
Subbulakshmi et al. [29] proposed an Intrusion Detection System (IDS) based defense
26

mechanism to counter DDoS attack. The IDS is trained using the datasets obtain from the
extraction of attack traffic features. To strengthen the detection process, weights are added
with these datasets at regular intervals.
Thwe and Thandar [33] proposed a statistical anomaly detection technique based on K-
Nearest Neighbor (KNN) deployed at the victim node. A user specified threshold is defined.
When the current state of the system differs from the defined model by a specified threshold,
an anomaly is raised. At this stage KNN is used to detect an attack.
A comparative analysis of the existing data mining techniques for the detection of a DDoS
attack is given in Table 2.3. It provides evidence that the existing techniques have high
complexity and low accuracy when a large amount of training data is used. None of the
existing schemes is suitable for the real-time data mining of the high-speed streaming data
coming from a sensor network. Therefore in this research, stream mining techniques are
analyzed that has the ability to handle real- time streams of data and detect a DDoS attack
efficiently and in less time. Stream mining techniques are discussed in next section.
2.4 Stream Mining Techniques
Stream mining is concerned with extracting significant knowledge structures from continu-
ous and rapid stream of data. Further, a data stream is an organized sequence of instances
that can be read a small number of times using less computational and memory resources.
Taking into account the resource constrained nature of WBAN sensors, Very Fast Decision
Tree (VFDT) proves to be a light weight data mining technique that is able to process a large
amount of high speed streaming data consuming less memory space. It turns out to be effi-
cient in the detection of DDoS attack at any stage due to its ability of building decision tree
from scratch. In [17], VFDT is applied for detection of DDoS attack and objective based
comparison is done. The results show that the VFDT proves to be an accurate tool for DDoS
attack detection. Therefore, in this research VFDT is selected and improved for detecting
DDoS attack efficiently. This section explains the preliminaries for VFDT and discusses its
variants along with their limitation when used for DDoS attack detection in cloud- assisted
WBAN.
27

2.4.1 Preliminaries
VFDT is a stream-based data classification method that learns using a complete set of
N training samples expressed as (X, y), where X is a vector of n attributes given as
{X1, X2...Xn}. The aim is to construct a model of a mapping function y = f(X) that will
predict the classes of subsequent samples x with maximum accuracy. To design a VFDT
for DDoS attack detection, the mathematical preliminaries used for the classification are
discussed below [34] [53].
Hoeffding Bound: This gives a certain level of confidence about the best attribute to split
the node. Suppose we have N independent observations of a real-valued random variable r
whose bounded range is R. The Hoeffding bound states that with confidence level 1− δ, the
true mean of variable r is at least r − ε, where ε can be calculated using equation 2.1 [53].
ε =
√R2ln(1/δ)
2N(2.1)
Information Gain: VFDT uses the information gain as a heuristic evaluation function to
find the upper and lower bounds with high confidence. The upper bound G(.)+ and lower
bound G(.)− are calculated using equation 2.2 and 2.3 [53].
G(A, T )+ =∑vεA
P (T,A, v) +
√ln(1/δ)
2NH(Sel(T,A, v))+ (2.2)
G(A, T )− =∑vεA
P (T,A, v) +
√ln(1/δ)
2NH(Sel(T,A, v))− (2.3)
where A is an attribute in the T set of training samples. P (T,A, v) is a fragment of the
training samples in set T that holds the value v for attribute A. Sel(T,A, v) selects all the
training samples having value v for attribute A from set T .
Although VFDT classifies stream data efficiently, but it has limitations for example, it
cannot handle noisy data and classification accuracy decreases with the increase in noise.
In recent past, few variations of VFDT have been proposed. In this section, VFDT and its
variants are discussed and briefly analyzed for their feasibility long with their limitations
when used for DDoS attack detection in cloud- assisted WBAN.
28

2.4.2 Very Fast Decision Tree (VFDT)
Domingos et al, [53] proposed VFDT based on hoeffding bound (HB) using equation 2.1 to
control over error in the attribute splitting distribution selection. Information gainG(.) given
in equation 2.2 and equation 2.3 is used as a Heuristic Evaluation Function (HEF) in order
to decide the split attribute to convert the decision nodes to leaves. ∆G = G(Xa)− G(Xb)
defines the difference between the two best attributesXa (highestG(.))andXb (second high-
est G(.)). If ∆G > ε, then Xa considered as highest value attribute in G(.). At this stage,
the splitting occurs on attribute Xa and the decision node is converted into leaf node. The
major drawback of this technique lies in the fact that there exists certain cases, when the two
information gains has very small differences and are equally good to become a leaf node.
At this stage, a tie condition occurs and the process gets stuck. Resolving the tie- breaking
is a computation intensive task that increases the processing time and decreases the overall
accuracy of decision tree. At the same time, it is considered to be inappropriate for resource
constrained WBAN.
2.4.3 Very Fast Decision Tree based on Predefined Threshold (VFDT-)
To overcome the limitation of VFDT, Hilton et al, [34] proposed a fixed tie- breaking thresh-
old τ . Whenever the difference between two information gains is very small, τ acts as a
quick decisive parameter to solve the tie condition. The node splitting occurs on the present
best attribute despite of how good the second best attribute might be. The value of τ is
chosen randomly and remains fixed throughout the process. An excessive tie- breaking con-
ditions reduces the performance of VFDT-τ significantly on noisy and complex streaming
data, even with the use of parameter τ . VFDT-τ does not support pruning as the tree size
itself is very small. While improving the accuracy, the tree size explodes. Therefore, a
suitable pruning mechanism is required at this stage.
2.4.4 Optimized Very Fast Decision Tree (OVFDT)
To overcome the limitation of fixed tie- breaking threshold, Yang et al, [35] proposed an
algorithm based on adaptive tie- breaking threshold computed directly from the Hoeffding
Bound (HB) mean. The value of HB mean fluctuates intensively with the increase in the
noise percentage thus, reducing the accuracy of attack classification.
29

2.4.5 Concept Adaptive VFDT (CVFDT)
CVFDT [36] maintains two trees simultaneously in memory. The tree with the shortest
depth is retained and the other one is discarded. The main drawback of this technique is that
it consumes more memory and time to maintain two trees. Also CVFDT does not handle
noisy data efficiently.
2.5 Effect of Noise in Streaming Data
Noisy data is considered as a meaningless or extraneous data that makes the identification
of data patterns more difficult. As the noise increases in data stream, the number of outliers
also increases. In sensor networks, noise arises due to the changes in system behavior and
malicious activity in the network. There are two major sources of noise [37]
Error: An error is defined as a noisy value coming from an erroneous sensor. Outliers
caused by such errors have a very high probability of occurrence.
Event: An event refers to a particular phenomenon which, in this case, is an attack occur-
rence event that changes the state of a system. Outliers caused by events occur with small
probability but they are lasting and modify the historical patterns of sensor data.
In both cases, the presence of outliers due to noisy data decrease the attack detection
accuracy and increase the false alarm rate. At the same time, the tree size increases which
results in added memory consumption. The goal is to detect and remove these outliers
from the sensor data in order to ensure the high attack detection accuracy while keeping the
resource consumption of the network to minimum. Figure 2.5 shows the detrimental effect
of noisy data on classification accuracy (figure 2.5(a)) and tree size (figure 2.5(b)). The
experimental data is synthetic and supplied as input to VFDT-τ algorithm with τ=0.05 [36].
The error rate significantly affects both the accuracy and tree size of decision tree when the
number of instances increases manifold. Even a small error rate leads to increase in tree size
by several times.
2.6 Traceback Techniques for Distributed Denial of Service (DDoS) Attack
In DDoS attack, the key issue lies in detecting an attack and invoking the appropriate trace-
back mechanism. Several techniques are available in literature for detecting DDoS attack
in sensor networks as discussed in section 2.3.1, but very limited amount of work is found
on traceback mechanism. Traceback requires reconstructing the attack path and identifying
30

(a) Effect of Noise on Accuracy (b) Effect of Noise on Tree Size
Figure 2.5: Effect of Noisy Data
the source of DDoS attack [46]. Traceback techniques proposed for conventional IP- based
networks [38], [39], [40], [41] are not directly applicable on resource constrained WBAN
environment due to additional overhead requirements and high convergence time. Similarly,
several traceback techniques are also available for Mobile Adhoc Network (MANET) [42]
and Wireless Sensor Networks (WSN) [43] that overcome the limitation of overhead but at
the cost of additional processing and storage requirements.
2.6.1 Existing Traceback Techniques for Standard IP- Based Networks
There are four major techniques to tackle with traceback problem in standard IP- based
networks. These include: hash- based traceback [39], Internet Control Message Protocol
(ICMP) based traceback [38], Probabilistic Packet Marking (PPM) [40] and Deterministic
Packet Marking (DPM) [41] techniques. However, these techniques are not appropriate
when deployed in resource constrained WBAN environment because they requires extra
computation and implementation resources. These techniques are discussed as follow:
Hash- Based Traceback techniques
Hash- bases IP traceback generates audit trails for network traffic and can detect the source
of a single packet delivered by the network recently. These techniques require adequate
amount of memory and storage space to record and transfer these network audit trails. The
implementation of hash- based traceback in WBAN is not practical but explanatory. These
techniques are only good for traceback in conventional IP based networks where storage
space is sufficient for logging packets [39].
31

ICMP- Based Traceback techniques
ICMP traceback techniques utilizes ICMP packets that contains the information about the
previous and the following routers and sends this information to the source and the desti-
nation of the original packet. Using this additional ICMP packet, the victim node easily
reconstructs the attack path. However, this technique is not appropriate for resource con-
straint WBAN network because it requires the WBAN network to make use of full TCP/IP
protocol stack. Also maintaining extra ICMP packet throughout the transmission and trace-
back requires huge amount of memory and computational resources [38].
Probabilistic Packet Marking (PPM) Techniques
In PPM techniques, each router not only forwards the packet but also marks individual pack-
ets with a low marking probability. This mark is a unique identifier analogous to that specific
router. As compared to other techniques, PPM has small implementation and management
overhead due to the probabilistic nature of algorithm. However, the computational overhead
and the convergence time is high, which is the time taken by victim node to reconstruct the
attack path by collecting at least one marked packet from each intermediate router. This
results in limiting the usefulness of PPM for fast traceback in WBAN environment [40].
Deterministic Packet Marking (DPM) Techniques
Like PPM, DPM also requires each router to mark individual packets. Moreover, the DPM
approach requires all the internet routers to be updated for every packet marking, which in
turn requires a huge amount of spare bits in IP packets. Therefore, the scalability of DPM is
very limited. Also it requires a huge amount of storage space for packet logging for routers.
For this reason, DPM is not a good solution for traceback in WBAN [41].
All of the traceback techniques discussed above are for conventional IP- based network. A
number of traceback approaches exists in literature that are proposed specifically for Mobile
Ad-Hoc Networks (MANETs).
2.6.2 Traceback techniques for Mobile Ad-hoc Networks
Jin et al. [42], proposed traceback technique based on node sampling in which a complete
network is split into various zones and each node knows its zone ID to which it belongs.
Upon the arrival of packet, each node first writes its zone ID into the packet with a certain
32

probability and then passes it. Upon the detection of DDoS attack, the victim node recon-
structs the complete path by collecting sufficient number of these marked packets. Analysis
shows that the reconstruction process of this technique is less accurate to efficiently trace-
back the source of an attack.
Things et al. [45], proposed a scheme for MANET named ICMP traceback with Cumula-
tive Path (CP). This scheme conceals the complete attack path information in ICMP trace-
back CP message. However, this scheme requires to overload some fields of the IP header
and thus, needs a heavy protocol stack which is unavailable in resource constraint WBAN
environment.
Bo Chao et al. [44] proposed a traceback scheme specifically for hierarchical WSN en-
vironment. The proposed scheme is based on two layer labeling technique and a Marking
Probability Distribution Function (MPDF) that offers a fixed marking probability assign-
ment to each node for simplicity. Using fixed marking probability requires a large number
of packets for attack path reconstruction which results in high convergence time. As the
packets are overwritten with same marking probability by all routers, which results in un-
fairness marking. The proposed scheme is evaluated in term of qualitative comparison, no
quantitative comparison is done.
2.7 Conclusion
A Distributed Denial of Service (DDoS) attack is defined as an explicit attempt by an attacker
to exhaust the resources of a victim node. Multiple nodes are deployed to launch an attack by
sending a stream of packets towards the victim, thus consuming the key resources of victim
node and make them unavailable to legitimate nodes. These resources mainly includes the
network bandwidth, computing power and memory resources.
To overcome the effects of DDoS attack in cloud-assisted WBAN environment various
techniques have been studied and explored during this research according to the classifica-
tion and taxonomy of DDoS attack. Among these, data mining classification techniques have
proven itself as a valuable tool to identify misbehaving nodes and thus for detecting DDoS
attacks. The simulation result shows that the existing data mining techniques for DDoS
attack detection have high complexity and low attack detection accuracy when applied on
high- speed streaming data. Therefore, stream mining techniques were selected and explored
33

as a solution towards the detection of DDoS attack in cloud- assisted WBAN environment.
The detailed analysis shows that the mining accuracy of stream data is effected by the noise
present in the data. Therefore, handling the noise significantly improves the results of accu-
racy. Finally, for the prevention of distributed denial of service attack, traceback techniques
in standard IP- based network and mobile Ad-hoc networks were studied and explored. The
study shows that the traceback techniques in standard IP- based networks are not appropriate
for cloud- assisted WBAN environment due to additional computation and implementation
resource requirements. Further, traceback techniques for mobile Ad-hoc networks have high
convergence time and extra overhead on nodes.
The detailed analysis of DDoS attack detection and prevention techniques shows that the
topological aspects of WBAN network plays an important role and must be incorporated into
proposed attack detection and prevention techniques in order to achieve better results.
34

Chapter 3
PROPOSED DDoS ATTACK DETECTION AND PREVENTION
FRAMEWORK FOR CLOUD-ASSISTED WBAN
Distributed denial of service (DDoS) attack aims to generate a huge volume of attack traffic
towards a victim node in order to deplete the energy resources of a victim node rapidly. The
attacker node launches an attack by compromising the legitimate sensor node and partici-
pate in the network operation with malicious intent. As we are dealing with critical health
monitoring application of wireless body area networks, the effect of such an attack can be
disastrous to the network operations. The distributed nature of DDoS attacks in WBAN
environment demands the need for innovative solutions in order to successfully detect an
attack [18] [19].
In this chapter, first we propose a cloud- assisted WBAN architecture and discusses its
modules in detail. Secondly, based on the proposed architecture, a framework is presented
for the detection and prevention of DDoS attack in cloud- assisted WBAN environment.
Based on the framework, two techniques were proposed:
1. A distributed attack detection technique is proposed in Chapter 4 that efficiently de-
tects DDoS attack in these networks.
2. A traceback technique is proposed in Chapter 6 that efficiently identify the source of
an attack and block an attacker.
In section 3.1, we discuss the requirements for detecting DDoS attack in cloud- assisted
WBAN environment. In section 3.2, a proposed cloud- assisted WBAN architecture is dis-
cussed in detail along with its modules. A proposed framework for detecting and preventing
DDoS attack in cloud- assisted WBAN environment is presented in section 3.3. Finally, the
concluding remarks are given in section 3.4.
35

3.1 Requirements for DDoS Attack Detection in Cloud- Assisted WBAN environment
Due to the wireless communication medium and limited resources of cloud- assisted WBAN
environment, it becomes extremely difficult to detect and traceback the DDoS attack in these
networks. The attack class observes the traffic flow in the network and mark the nodes that
are actively taking part in transmitting and receiving data packets. The marked nodes are
named as critical nodes and are considered as a target of DDoS attack. In this research, we
refer these critical nodes as target or victim nodes.
The nodes from attack class launches DDoS attack towards the victim nodes from multiple
locations of the network in order to deplete the limited energy resources of victim node and
make them unavailable for legitimate users. The wireless nature of cloud- assisted WBAN
network allows multiple entry points which makes it more difficult to detect and traceback
the attack in these networks. The attack class intending to initiate DDoS attack can be
categorize into following classes:
1. Injected Sensor Nodes: This class contains either regular sensor nodes with normal
sensing powers or more powerful nodes like a base station.
2. Compromised Sensor Nodes: This class contains the legitimate sensor nodes that are
compromised by attack nodes in order to disrupt the normal operation of the network.
3. Laptop Class Nodes: This class consists of sensor nodes with additional communi-
cation resources for transmitting and receiving data packets. In addition, the sensor
nodes of this class has more power and computational resources.
Figure 3.1: Flat Topology
36

DDoS attack model containing attacker classes is shown in Figure 3.1. The base station,
regular sensor nodes and aggregate nodes are the legitimate nodes of a network. Where as,
the compromised node, laptop class nodes and malicious nodes are the attack nodes that
launches attack towards the legitimate nodes.
3.2 Proposed Cloud- Assisted WBAN Architecture
The integration of WBAN and cloud computing technology provides a platform to create a
new digital paradigm with leading features called cloud-assisted WBAN. In this section, the
proposed cloud-assisted WBAN architecture is discussed.
3.2.1 Formulation of Cloud- Assisted WBAN Architecture
Before formulating the cloud-assisted WBAN architecture, there is a need to understand the
factors that contribute towards the efficient modeling of cloud-assisted WBAN architecture.
These factors includes:
Sensor Data
Sensor data can be seen as a huge volume of high speed real-time stream data collected
continuously from WBAN sensors and transferred to the cloud via a base station for fur-
ther processing and storage. Because we are dealing with data mining techniques that can
identify the relationship between data attributes, the attributes can either be homogeneous
or heterogeneous [47]. Homogeneous attribute allows sensing single- value attribute, for
example, blood pressure only. In case of heterogeneous attributes, each node is fitted with
multiple sensors that allows to sense multiple attributes at one time, for example, ECG, tem-
perature, EEG etc. In proposed architecture, WBAN sensors have homogeneous attributes,
i.e., they can only sense a single value, e.g., ECG sensors and EEG sensors, whereas the
entire WBAN network is heterogeneous.
Network Topology
Network topology is defined as a data delivery model which gives the routing path for trans-
fer of data from the sensor node to the base station. The network topology is classified into
three main categories depending upon the flow of traffic in the network. These include:
1. Flat Topology: In flat topology, the readings of each sensor node are transmitted
directly to the base station using a single-hop communication mode [48]. The flow of
37

traffic from sensor node to base station is expressed as t = (t(s,BS)) and is illustrated
in Figure 3.2, where t is a traffic from sensor node s to Base station BS.
Figure 3.2: Flat Topology
2. Cluster-based Topology: In cluster-based topology, each cluster contains few sensor
nodes and an Aggregate Node (AN) that acts as Cluster Head (CH). Each aggregate
node sends data to the base station directly. Aggregate nodes are also sensor nodes
but with additional capabilities like memory, computation, and communication re-
sources. These nodes perform data aggregation and control a set of predefined clusters
of sensor nodes in a network. Finally, the aggregated data is forwarded to a base sta-
tion either directly or via other aggregate nodes. The data aggregation topology is
deployed for the proposed cloud- assisted WBAN architecture and illustrated in Fig-
ure 3.3 [48]. The flow of traffic from sensor node to base station is represented as:
t = (t(s,AN(s)), t(AN(s),AN(s)), t(AN(s),BS)), where t(s,AN(s)) is a traffic from sensor node
to its aggregate node, t(AN(s),AN(s)) is a traffic from one aggregate node of cluster A to
the aggregate node of cluster B and t(AN(s),BS) is a traffic from aggregate node to base
station.
3. Data Aggregation Topology: In this topology, individual sensor readings come from
different sensors to the base station via a well-defined tree of interconnected inter-
mediary nodes called aggregate nodes. This helps to reduce the total traffic flow in
the network and minimizes the number of data transmissions, which saves sensor
energy [48]. Data aggregation topology is shown in Figure 3.4 and expressed as:
t = ts1, ts2, ..., t(sN,BS), where t(sN,BS) is the total number of intermediary nodes to
reach the base station.
38

Figure 3.3: Cluster-based Topology
Figure 3.4: Data Aggregation Topology
Processing Architecture
Classification techniques process data either in a centralized or distributed manner [47].
Since we are dealing with resource-constrained WBAN nodes, choosing an appropriate pro-
cessing architecture is an important concern. Implementing a centralized approach in a
WBAN network causes a huge amount of data flow and communication towards the base
station, which can create a bottleneck and waste communication bandwidth. On the other
hand, the distributed approach has the advantage of performing classification locally at ag-
gregate nodes and then passing on the results to upper nodes (base station). Since only the
classification result will be forwarded to upper node (base station), the overall energy con-
sumption for transmission can be significantly reduced. A novel classification technique is
proposed for attack detection (discussed in Chapter 4).
39

Selection of Data Mining Technique
Based upon the general data mining approaches discussed in chapter 2, we have selected
decision tree as a classification techniques for detecting a DDoS attack in a cloud-assisted
WBAN environment. In chapter 4, a decision tree based classification technique is proposed
that is lightweight, capable of incremental learning during online mining, and effectively
used for stream mining classification [1].
Application Area
As we are dealing with patients health monitoring application, security is of utmost impor-
tance. The application area of the proposed cloud-assisted WBAN architecture is a patient
e-Health monitoring system.
Evaluation Method
Evaluations can be done through analytical modeling, simulation, or the real-time deploy-
ment of sensors. Among these, simulation and real- time environment are most widely used
and effective approach to design and test any proposed solution in terms of the accuracy,
computation, and communication complexities. To evaluate the performance of proposed
architecture, both simulation and real-time testbed are deployed. For simulation experi-
ments, Network Simulator (NS-2) is used and for real-time WBAN test-bed environment,
real sensors nodes are deployed.
Data Sets
Data sets are used to validate the proposed scheme experimentally. They can be either syn-
thetic or real. Which data set is more appropriate depends upon the application scenario and
criticality of the situation and results. For this research, both synthetic and real-time datasets
are used.
3.2.2 Proposed Cloud-assisted WBAN Architecture
The proposed architecture integrates a WBAN with cloud computing technology in order to
store and process the data collected by WBAN nodes for patient e-Health monitoring. The
proposed system architecture is scalable and is able to store the enormous amount of data
generated by WBAN sensors. Since the data from these sensors are highly sensitive and
vulnerable to many attacks, a security mechanism is proposed in Chapter 4 to ensure data
40

availability at all times. DDoS is a major attack that affects the availability of a patient’s
data to data access requesters [49]. Figure 3.5 shows our proposed cloud-assisted WBAN
architecture. The green dotted circle shows the entities that are the victims of DDoS attacks.
Figure 3.5: Proposed cloud-assisted WBAN Architecture
Based on the cloud- assisted WBAN architecture, Figure 3.6 shows the sequence of steps
from transferring a patient’s data to the cloud until its supervision by a healthcare profes-
sional.
The proposed cloud- assisted WBAN architecture consists of the following entities:
1. WBAN Sensor Network: The WBAN is composed of an infinite number of sensory
nodes such that S = {S1, S2...Sn}, where |S| = n and n is the number of nodes in
the network. The limited energy resources of these n sensor nodes differentiate the
modeling and detection of DDoS attacks in them. The adversary class, which refers
to the set of malicious nodes M = {M1,M2...Mk−1}, where |M | = k ≤ n and k
is the number of malicious nodes, monitors the network traffic flow and identifies the
nodes that are actively taking part in the transmission and reception of data packets.
The identified sensor nodes are marked as critical nodes and are likely targets for a
DDoS attack. These critical nodes are referred to as victim nodes and denoted by
V = {V1...Vr} where V ⊂ n, i.e., each critical node r of set v is a target of a DDoS
attack, which implies that |V | = r � n. In a wireless body area network environment,
a DDoS attack occurs at two points.
41

Figure 3.6: Sequence of Operations from Patient to Healthcare Professional
Aggregating Nodes: The network traffic from individual sensor nodes toward an ag-
gregate node can be defined as: t = (t(s,AN(s)), showing a one-step data transmission
to the aggregate node. Compared to a WSN, a WBAN network consists of a small
number of sensor nodes. Therefore, defining a single intermediary aggregate node is
sufficient. The aggregate nodes are close to the base station, that is why they will ex-
pect more traffic inflows. This make these sensor nodes the critical nodes and more
vulnerable to DDOS attacks [48].
Base Station: The network traffic from an individual sensor node to the base sta-
tion through aggregate nodes is defined as t = (t(s,AN(s)), t(AN(s),AN(s)), t(AN(s),BS)) ,
where t(s,AN(s)) is a traffic from sensor node to its aggregate node, t(AN(s),AN(s)) is a
traffic from one aggregate node of cluster A to the aggregate node of cluster B and
42

t(AN(s),BS) is a traffic from aggregate node to base station. The base station is the
control center of all the activities of the sensor network [48].
2. Cloud Service Provider: The cloud service provider is responsible for providing data
storage facilities for the WBAN network. These consist of the health cloud storage
and e-Health service provider. The health cloud storage is responsible for storing
and retrieving data upon the request of authorized users (pharmacists, doctors, health
workers, etc.). The e-Health service provider classifies a patient’s health record on the
basis of patient attributes and transfers it to the e-Health cloud storage for permanent
storage.
3. Attack Detection Node: In the proposed architecture, we deploy an attack detection
node at the victim side with the aim of attack detection in the cloud environment.
The main purpose of deploying this attack detection node is to minimize the direct
attack traffic flow towards the victim. The link between the attack detection node and
sensor network, as well as other networks, is secured using the Secure Socket Layer/
Transport Layer Security SSL/TLS protocol in an attempt to prevent a man-in-the-
middle attack [50].
4. Data Requesters: These include healthcare professionals (doctors, nurses, health
workers) that use application specific services (SaaS) to access a patient’s stored data.
As a result, the cloud storage provider connects with the e-Health service provider to
verify the data requester.
5. Patients: Patients must be registered with an e-Health care service provider before
using cloud services. The patient is accountable to specify an attribute-based access
policy in an attempt to receive e-Health care services.
According to Figure 3.5, the proposed cloud- assisted WBAN architecture can be cate-
gorized into five steps. At each step, we discuss how the attacker launches a DDoS attack
against the victim nodes [17].
Step 1 (Patient health data collection): The WBAN network collects health information
from different body sensors attached to patient’s body and transmits the information to the
43

base station/patient’s gateway via aggregate nodes. At this point, the DDoS attack occurs
against two entities.
Aggregate nodes: The attacker compromises the legitimate sensor nodes and launches
a DDoS attack by bringing about adversary class nodes in the network in an attempt to
originate an attack from various points in the network toward the aggregate nodes.
Base station: Because the base station is the control center for all the activities of the
sensor network, an adversary class can generate a DDoS attack towards the base station to
exhaust the energy and, therefore, destroy the whole WBAN sensor network. At this stage,
a DDoS attack detection approach is needed to successfully detect an attack by classifying
the malicious packet. The detection approach should be lightweight and consume little of
the memory resources of the low-power WBAN sensors.
Step 2 (Secure Data transfer to e-Health service provider): In this step, the patient’s
collected health data is transferred to the e-Health care service provider. At this stage, an
attacker may compromise the base stations and launch a DDoS attack against the e-Health
care service provider. Simultaneously, the e-Health care service provider can be a victim
of other outside attackers. In order to protect the e-Health service provider from a direct
DDoS attack, an attack detection node is deployed at the victim (e-Health service provider)
for the purpose of attack detection. The communication channel between the base station
and attack detection node is secured using the SSL/TLS security protocol in order to provide
data confidentiality and integrity. The process and flow chart of the attack detection node are
presented in figure 3.7.
Step 3(Patient health data processing at e-Health Service provider): After receiving
the patient data securely, the e-Health service provider classifies the patient’s health records
based on the attributes chosen by the patient. It then sets different authentication levels based
on the role of the data requesters using a Role Based Access Control (RBAC) policy [51].
The data requesters include doctors, nurses, and health workers.
Step 4 (Transfers Patient data to cloud Storage): After classification, the data is securely
transferred to the e-Health cloud storage server to make them available to data requesters.
The communication channel between the e-Health service provider and cloud storage is
secured using the Secure Socket Layer/Secure Shell SSL/SSH protocol [50]. At this point,
the cloud storage server may also be a victim of a DDoS attack from adversary class users in
44

Figure 3.7: Workflow of Attack Detection Node at Cloud
order to overwhelm its resources. Moreover, we can deploy the same attack detection node
to detect an attack.
Step 5 (Data Requester Access): To access a patient’s data, a requester forwards the
request to the health cloud storage with their identity and requests the corresponding attribute
sets of the patient. In return, the cloud storage provider communicates with the e-Health
service provider to authenticate the requester. The standard security protocol (SSH/TLS) is
used to provide the requester’s authentication [17] [50].
Although the proposed architecture presents the complete cloud-WBAN environment, but
for this research, the key focus is on detecting and preventing a DDoS attack within WBAN
domain. In next section, a framework is proposed that for the detection and prevention of
DDoS attack in WBAN environment.
3.3 Proposed Framework for Detecting and Preventing DDoS Attack
In this section, a proposed framework is presented for the detection and prevention of DDoS
attack in cloud-assisted WBAN. It is based on the conceptual architecture presented in sec-
tion 3.1. The proposed framework is explained as follow:
1. Capture the incoming stream of packers originating from WBAN sensor network.
2. Obtain the packet features of the current traffic flow.
45

Figure 3.8: Proposed Framework for Detecting and Preventing DDoS Attacks
3. Statistical features are calculated from these extracted packet features and input to the
attack classification module.
4. The DDoS attack detection module detects if an attack has been occurred based on the
statistical features.
5. The attack detection module uses a proposed algorithm for detecting an attack. The
proposed attack detection module and proposed classification algorithm is discussed
in chapter 4.
6. If no attack is detected, the traffic is forwarded to the immediate upper node.
7. If an attack is detected, then
(a) The victim node call the traceback module.
(b) Under traceback module, the packet marking module is used to mark each packet
passing by each node. The proposed packet marking approach is discussed in
46

chapter 6.
(c) Victim node reconstructs the attack path based on the packet marking. The pro-
posed attack path reconstruction algorithms are presented in chapter 6.
(d) After successful path reconstruction, block an identified attacker to further stop
an attack
8. Go to Step 1
3.4 Conclusion
Nowadays, Wireless Body Area Networks (WBANs) is emerging as a promising technol-
ogy with a considerable potential in improving patients health care services. The inte-
gration of WBAN and cloud computing technology provides a platform to create a new
digital paradigm with leading features called cloud-assisted WBAN. The foremost concern
of cloud-assisted WBAN is the security and privacy of data either collected and stored by
WBAN sensors or transmitted to cloud over an insecure network. Among these, data avail-
ability is the most nagging security issue. The major threat to data availability is distributed
denial of service attack (DDoS) normally launched from various distributed locations. In
order to assure the all time availability of patients data, in this chapter, we propose a cloud-
assisted WBAN architecture. Based on the proposed architecture a victim based DDoS at-
tack detection and prevention framework is then proposed that receives the incoming stream
of sensor data and classifies into attack and non- attack data. After the successful attack de-
tection, a traceback module reconstructed the attack path and identify an attacker. The attack
detection module is discussed in Chapter 4 and traceback module is discussed in Chapter 6.
47

Chapter 4
EVFDT: An Enhanced Very Fast Decision Tree Algorithm for Detecting
DDoS Attack in Cloud- Assisted WBAN
Nowadays, cloud-assisted WBAN for patient health monitoring have attracted researchers
attention. Beside other open issues in WBAN environment such as energy efficiency, Qual-
ity of Service (QoS), and standardization; security and privacy are the key issues that need
special attention. Among these security issues, data availability is the most nagging security
issue. The DDoS attack is one of the most powerful attack on the availability of patients
health data and services of health care professional. DDoS attack severely affects the ca-
pacity and performance of a WBAN network if not handled in a timely and appropriate
manner [14] [1] .
For detecting a DDoS attack in cloud-assisted WBAN, there is a need for a defensive ap-
proach that understands the network semantics and flow of traffic in the networks. When
a victim node is flooded with huge amount of packets that exceeds its processing ability,
the excess must be dropped. The packet based dropping strategy helps in distinguishing the
legitimate traffic from the flood traffic and is used to avoid the impact of attack traffic on
legitimate users. Observing the network traffic flow shows that there is no regular structure
of patterns exists in the network and therefore, statistical pattern identification techniques
are needed. Integrating existing attack detection and defense mechanism in a resource con-
strained WBAN network increases the computation and communication cost [52] [?].
The network resources are not enough to mitigate the huge amount of traffic generated
by DDoS attack [57]. Therefore, there is a need for an approach that is light weight and
capable of handling real time streaming data. Considering this, a number of stream min-
ing techniques have been studied and explored in Section 2.4. Very Fast Decision Tree
(VFDT) [53], a stream mining technique VFDT has proved to be the most prevalent due to
the simplicity and interpretability of their rules and thus considered as more appropriate for
low-power sensor networks [54]. The underlying reasons for the selection of VFDT are:
48

1. Light weight i.e., it does not require a dataset to be stored in the memory thus making
it suitable for resource constraint WBAN.
2. Can progressively build decision tree from scratch which helps in detecting DDoS
attack at any stage.
3. Each time a new segment of sensor data arrives, a test and train process is performed
over it keeping the stored tree up to date.
4. Does not require reading full dataset yet adjusts decision tree according to the newly
incoming and gathered statistical attributes thus, consuming less memory space.
5. Appropriate for huge amount of non-stationary and streaming data obtained from
WBAN sensors.
6. Provides a transparent learning process.
These features make VFDT a suitable candidate for implementing an autonomous decision
maker for DDoS attack detection in cloud-assisted WBAN.
In this chapter, the proposed DDoS attack detection system is presented. Further, an
improvement of VFDT [53] namely Enhanced VFDT (EVFDT) is proposed which differs
from the existing algorithms in terms of classification accuracy, tree size, computational cost,
memory and time. Our aim is to build a decision tree based classification algorithm capable
of handling noisy data and detects a DDoS attack efficiently with high accuracy and low
false alarm rate while allowing a legitimate requesters to access the resources. The proposed
algorithm is deployed at the victim node.
This chapter is organized as follow: Section 4.1 presents the proposed DDoS attack de-
tection system. Each phase of attack detection system is elaborated. Further, the statistical
features are identified that helps in the detection of DDoS attack. In section 4.2, an im-
provement of VFDT [53] namely Enhanced VFDT (EVFDT) is proposed that is capable
of handling noisy data and detects a DDoS attack efficiently with high accuracy and low
false alarm rate. Different procedures of EVFDT are also discussed. Finally, the concluding
remarks are given in section 4.3.
49

4.1 Proposed Distributed Denial of Service attack detection system
The proposed Distributed Denial of Service (DDoS) attack detection system studies the net-
work traffic behavior and classifies it as a normal or malicious traffic based on the observed
traffic patterns. The proposed system architecture is shown in Figure 4.1. When the data
Figure 4.1: Proposed DDoS Attack Detection System
stream is generated by WBAN sensor network, the incoming data is first collected in online
database where the features extraction takes place. After feature extraction the data is stored
in offline database for training and testing purposes. The final attack classification output
will be generated on the basis of proposed algorithm for further decision making. The pro-
posed attack classification algorithm is given in section 4.2. Finally, the attack response is
either forwards the packet or call the traceback mechanism based on the classification re-
sults. The proposed DDoS attack system is broadly classified into four phases starting from
50

data collection phase up to response generation phase. The detail of each phase is discussed
in the following subsections:
4.1.1 Data Collection Phase
In this phase, the incoming data stream in captured online and stored in database for training
purposes. The captured data is supplied as an input to the pre-processing phase for feature
extraction. Each instance of an incoming traffic is defined by a collection of features and is
represented in feature vector space.
4.1.2 Pre-Processing Phase
Pre-processing phase is further divided into the packet feature extraction phase followed by
the labeling phase.
Packet Feature Extraction Phase
In feature extraction phase, the real- time packets are captured from the WBAN network
traffic in order to construct the new statistical features that are used for the detection and
analysis of DDoS attack. The identified features are important in defining the QoS [55] of
the real- time network and to classify the network traffic pattern under DDoS attack. These
includes:
1. Packet Loss Percentage: It is defined as a number of packets lost or dropped between
nodes due to the interaction of the legitimate traffic with attack traffic. It is the presence
of traffic congestion and overloading in the network due to occurrence of DDoS attack.
Wireless networks have high probability of packet loss due to the presence of noise
and interference. Packet loss percentage can be calculated using equation 4.1 [56]:
PacketLossPercentage =
∑ni=0 PL∑ni=0 PS
∗ 100 (4.1)
Where PL is the packet loss and PS is the total number of packets send towards the
destination.
2. Delay or Latency: The amount of time taken by the packet to reach the destination
after being transmitted from the source. Delay is dependent on the amount of traffic
being transmitted. It can be increased with the increase in network traffic and become
worst under network congestion periods. Delay or Latency can be calculated using
51

equation 4.2 [56]:
Delay =∑
(PATimei − PSTimei) (4.2)
Where PATimei is the time when the packet reach the destination and PSTimei is
the time when the packet originates from the source.
3. Jitter (Packet Delay Variation): The variation in the time between packets arriving
at the destination within a particular window. It is used as an indicator of consistency
and stability of the network. Jitter occurs when the transmission of delay of the packets
is variable in the network. Jitter can be calculated using equation 4.3 [56]:
Jitter =n∑i=0
(Delayi −Delay
N
)(4.3)
Where Delayi is the packet duration, Delay is the last packet delay and N is the
difference of packet sequence number.
4. Throughput: Throughput is the number of bytes transferred per unit time from source
end- point to destination end- point. It is measured in bits per second (bps). DDoS
defense mechanism ideally increases throughput for legitimate users. Throughput can
be calculated using equation 4.4 [56]:
Throughput =
∑ni=0(PacketReceived)∑n
i=0(StartT ime− StopT ime)(4.4)
Labeling Phase
In labeling phase, classes are assigned to these statistical features. The entire dataset is
divided into two classes labeled as 1 for attack and 0 for non-attack packet. After labeling
the resulted dataset consisting of both attack and non-attack data and is used for training
the classification tree. Mapping the pre-processing phase to feature vector space is given as
follow:
• Let ′x′ be the N-dimensional vector of extracted features i.e., x = x1, x2, x3...xn,
where 1, 2, 3...n are the individual packet features.
• Let Px be the packet of x features
• Let Cx be the vector space of labeled packets of dimension Cn.
52

4.1.3 Attack Classification
In this phase, the incoming traffic is classified as attack or non-attack by building a classi-
fication tree using the preprocessed data defined in feature vector space. For building the
classification tree, we have proposed an algorithm, which is discussed in Section 4.2.
Before an actual attack classification begins, the proposed classifier is trained and tested.
In training, the data from the preprocessed phase is used to train a EVFDT classifier. Based
on the nature of DDoS attack, EVFDT classifier is trained by considering two classes: attack
and non- attack. Similarly, testing is used to test the accuracy of a classifer. In the simulations
experiments, the data is divided into 80% training data and 20% testing data. This percentage
can be vary depending upon the severity of attack.
4.1.4 Attack Response
The goal of attack response module is to minimize the impact of DDoS attack on the victim
node while allowing the legitimate traffic to move forward. When a DDoS attack is detected,
an appropriate traceback mechanism is applied to trace an attacker by reconstructing the
attack path and block the traffic. The traceback technique is proposed and discussed in
Chapter 6.
4.2 Enhanced Very Fast Decision Tree (EVFDT): A Proposed Classification Algo-
rithm
A new classification algorithm namely Enhanced Very Fast Decision Tree (EVFDT) is pro-
posed. It is an optimization of original VFDT-τ [36] (discussed in Chapter 2) to make it
efficient in classifying the DDoS attack in real-time cloud-assisted WBAN environment.
The EVFDT classification algorithm simultaneously trains and tests the decision tree based
on learning traffic patterns and classifies malicious behavior of an attacker based on these
learned patterns as shown in Figure 4.1. One of the obvious aspect of real-time sensor net-
work environment is that the percentage of noise ratio is very high. The noise is produce due
to the presence of meaningless or extraneous data in the network traffic that makes the iden-
tification of traffic patterns more difficult and challenging. Due to this noise, the detection
accuracy of classifier decreases thus, causing a massive increase in false alarms rate.
To overcome the effect of this noise on detection accuracy and missing protection mech-
anism of WBAN, the EVFDT improves the existing VFDT [36] algorithms in terms of fol-
53

lowing parameters: (1) accuracy; (2) tree size; (3) Computational time and (4) memory. The
proposed EVFDT flowchart is given in Figure 4.2 that shows the overall flow of classifying
the stream into attack or non-attack based on the learned traffic patterns. The complete tree
building process and its procedures are discussed in subsequent section.
Figure 4.2: Proposed EVFDT Flowchart
According to the taxonomy of DDoS attack discussed in chapter 2, the proposed DDoS
attack detection algorithm is destination- based i.e. it is deployed at the victim node and
detects a DDoS attack efficiently once it has been launched from an attacker.
54

4.2.1 EVFDT Tree Building Process
Algorithm 1 given below is the algorithm for Enhanced VFDT.
Algorithm 1 EVFDT Procedure: Enhanced VFDTRequire: S: a stream of examples, X: a set of symbolic attributes
G(.): heuristic evaluation function for node splittingδ: one minus desired probability of choosing the correct attribute at any given nodenmin: number of samples between estimation of growth. Size of S0 = nminXS: sorted list of Hoeffding bound valuesm: total number of values in XSn: new Hoeffding Bound value seen at the nodeTr: adaptive thresholdS0: subset of S → S0 ∈ Sτ : 5% of examples in S0. Threshold for checking the node eligibility to be part of HT
1: BEGIN Procedure EnhancedVFDT(S,X,G,δ,nmin).2: A stream of examples S arrives3: if HT = φ then4: TreeInitialization(S,X)5: Get an Initialized HT with a single root node6: end if7: if HT 6= φ then8: NewStreamSample(S,X)9: end if
10: Label l with the majority class among the samples seen so far at l11: Let nl be the number of samples seen at l12: if samples seen so far at l arenot all of the same class and (nlmodenmin) = 0 then13: Compute Gl(Xi) for each attribute Xi ∈ Xl −Xφ using nijk(l)14: PrunedMean = AccuracyEVFDT(XS,m,n,Tr)15: Let Xa be the attribute with highest Gl,Xb be the attribute with second-highest Gl
16: Compute ε using equation 2.117: Let ∆Gl = Gl(Xa)−Gl(Xb)18: if ((∆Gl) > εor(∆Gl) ≤ PrunedMean) and Xa 6= Xφ then19: Split Xa as a branch20: for each branch of split do21: Add a new leaf lm and let Xm = X −Xa
22: Let Gm(Xφ) be the G obtained by predicting the most frequent class at lm23: for each class yk and each value xij of each attribute Xi ∈ Xl −Xφ do24: Let nijk(lm) = 025: end for26: end for27: end if28: else29: Pruning(S,S0,nmin,τ ,HT)30: end if31: Return HT32: END Procedure
55

EVFDT is based on original VFDT-τ [36] and is improved in two aspects: accuracy and
the tree size which in turns effect the computational time and memory resources. Algorithm
1 presents the pseudo code of EVFDT. It is divided into four sub procedures as described
below:
Procedure for Tree Initialization
In this procedure, the tree is initialized using a single leaf node; which is a root node. The tree
grows as a new data stream arrives at the root node. Algorithm 2 shows the Tree Initialization
Procedure. The procedure executes when the first data stream arrives.
Algorithm 2 EVFDT Procdure: Tree Initialization1: BEGIN Procedure TreeInitialization(S,X)2: Let HT be a tree with a single leaf l1 (the root)3: Let X1 = X ∪ (Xφ)4: G1(Xφ) be the G obtained by predicting the most frequent class in S5: for each class yk do6: for each value xij of each attribute Xi ∈ X do7: Let nijk(l) = 08: end for9: end for
10: Return HT11: END Procedure
Procedure for New Stream Sample
In this procedure, data from the stream is traversed starting from the root node. Each time a
new data stream arrives, this procedure traverses the stream from root node to the leaf node
and at the same time the tree statistics are updated. Algorithm 3 presents the procedure for
traversing a new sample.
Algorithm 3 EVFDT Procdure: New Stream Sample1: BEGIN Procedure NewStreamSample(S,X).2: for each new instance (x, y) in S do3: Sort(x, y) into a leaf l using HT4: for each xij in X such that Xi ∈ X do5: Increment nijk(l)6: end for7: end for8: END Procedure
56

Procedure for Accuracy Improvement
As stated in Section 2.3.1, Hoeffding Bound (HB) fluctuation intensifies with the increase
of noise thus, causing detrimental effects on the accuracy and tree size of VFDT-τ [36]. To
overcome this issue, the proposed EVFDT attempts to modify the attribute splitting proce-
dure by using an adaptive tie-breaking threshold τ that restricts the decision node to become
a splitting attribute. In existing VFDT-τ and its variants, the value of τ is pre-configured
by user and remains fixed throughout the tree building process. It is not possible to find the
best value of τ until all the possibilities are tried by brute force. Testing large number of
different values for τ is not favorable in real-time environment. Instead, EVFDT assigns an
adaptive tie- breaking threshold for splitting, equal to the mean of difference between HB
values, which provides the basis for node splitting throughout the tree building process.
By using this method, EVFDT has a dynamic tie- breaking threshold τ whose value is no
longer fixed and pre- defined but instead depends upon the arrival of new instances, their HB
values and the mean of difference between HB values. EVFDT incorporates the procedure
of accuracy enhancement with dynamic τ as presented in Algorithm 4 and explained as:
Let XS be the sorted list of HB values seen at leaf l, HBCount be the total number of
HB values in XS seen at leaf l and n be the new HB value seen at leaf l. Starting with
HBCount ≥ 3, the mean of difference between HB values in XS is calculated. This mean
is stored as threshold Tr as given in equation 4.5.
Tr =
∑HBCountj=1 (XSj+1 −XSj)
HBCount(4.5)
Where XS is a sorted list of HB values and HBCount is the total number of values in XS.
A threshold Tr is updated for each new value in sorted list.
Find the position of new HB value in XS, let XSn be the position of HB value in XS,
the PrunedMean is calculated with new value of HB as given in equation 4.6.
PrunedMean =(XSn −XSn−1) + (XSn+1 −XSn)
2(4.6)
If this PrunedMean is less than the updated threshold Tr, then HB is added to XS and
returns the PrunedMean otherwise HB value is discarded as an outlier [37] and return Tr
as PrunedMean. This whole process continues during the tree building process. Whenever
57

Algorithm 4 EVFDT Procedure: AccuracyEVFDT1: BEGIN Procedure AccuracyEVFDT(XS,m,n,Tr).2: if (m == 1) then3: Tr =
∑mi=1(
XSm
)4: else5: if (m == 2) then6: Tr =
∑mi=1(
XSm
)7: for j = 1 do8: XDj = XSj+1 −XSj9: Increment j=j+1
10: j < m11: end for12: else13: for j = 1 do14: XDj = XSj+1 −XSj15: Increment j=j+116: j < m17: end for18: Tr =
∑mi=1(
XDim
)19: Let XSn be the position of n in sorted list20: PrunedMean = (XSn−XSn−1)+(XSn+1−XSn)
2
21: if (PrunedMean ≤ Tr) then22: Add XSn in sorted list XS23: XS ← XS + n24: else25: Discard n as it is outlier26: XS ← XS27: end if28: end if29: end if30: Return PrunedMean31: END Procedure
a new HB value is added in XS, threshold Tr is updated.
Procedure for Tree Pruning
Pruning plays a very important role in decision tree learning process which helps to mini-
mize the tree size by cutting off the tree nodes that participate less to classify the instances.
Pruning is done to lessen the overall complexity of decision tree which arise due to the
presence of noisy or erroneous data. Analysis shows that the improvement in classification
accuracy causes enormous increase in tree size which in turn takes more memory space and
computational time. To overcome the problem of tree size explosion, Algorithm 5 presents
the proposed tree pruning mechanism and is explained as:
58

Algorithm 5 EVFDT Procedure: Pruning1: BEGIN Procedure Pruning(S,S0,nmin,τ ,HT).2: Let DataSeenAtLeaf be the number of samples seen at leaf node n0
3: for each example S ∈ S0 do4: if the sample S traverses to the node n0 which is a leaf node then5: Start counter on node n0
6: Increment: DataSeenAtLeaf n0
7: else8: Continue growing EVFDT9: end if
10: end for11: if DataSeenAtLeaf < τ then12: Prune the tree: Delete n0
13: UPDATE HT14: end if15: END Procedure
Let HT be the hoeffding tree to be pruned, S be the stream of examples belonging to S0
i.e., S0εS and DataSeenAtLeafn0 is the number of samples seen at leaf node. For every
example S in S0 is passed through the tree starting from the root node. If S0 is filtered to the
leaf node n0, then increment DataSeenAtLeafn0 otherwise continue growing the HT .
If DataSeenAtLeafn0 is less then τ , where τ is the threshold for checking the eligibility
of a node to be part of HT , then prune the tree by deleting the leaf node n0 and updating
the HT . Otherwise do not prune the HT . The eligibility of the node to be part of HT is
checked by comparing the number of samples seen at the leaf node with τ . The comparison
will tell us that this leaf node has less contribution towards classification as less number of
instances are filtered to this leaf node on the current HT .
4.3 Conclusion
Nowadays, zombies- based DDoS attack occurs with legitimate flow of traffic. Therefore,
it is very difficult to detect such attacks even with the presence of stored attack traffic sig-
natures. The challenge is to distinguish the legitimate traffic and DDoS attack traffic. Data
mining techniques for data classification fails for real-time streaming data and also they re-
quire a sufficient amount of memory for data storage. On the other hand, stream mining
techniques handle real- time high speed streaming data originating from WBAN sensors and
are efficient for resource scarce WBAN network. Therefore, stream mining techniques have
been studied and explored for DDoS attack detection. For successful detection of DDoS
59

attack, there is a need for an efficient detection system. Therefore, a DDoS attack detection
system is proposed consisting of four main phases from data collection phase to attack re-
sponse phase. The real- time streaming data from WBAN network is given as input to the
proposed system. After the successful classification of an attack by the proposed system,
the attack response is generated in which the traffic is either forward to the destination or
block for further analysis. For the classification and detection of an attack, there is a need
of a mechanism through which an attack can be detected efficiently and accurately while
consuming less resources. For this purpose, an algorithm based on VFDT is proposed and
presented in this chapter. The main contributions include a novel EVFDT classification al-
gorithm that differs from existing algorithms in terms of attack classification accuracy and
tree size. The performance of proposed EVFDT algorithms is evaluated on synthetic dataset
generated by implementing LEACH protocol in NS-2 [59]. The proposed system is also
deployed in real-time WBAN environment for examining and verifying the effectiveness of
proposed classification algorithm. The evaluation procedure is discussed in next chapter.
60

Chapter 5
ATTACK DETECTION SCHEME: PERFORMANCE ANALYSIS
AND BENCHMARKING
The basis of performance evaluation is to analyze the effectiveness of proposed attack de-
tection technique EVFDT discussed in Chapter 4 in detecting DDoS attack. Likewise, the
comparative analysis intend to show the dominance of EVFDT over existing techniques for
detecting DDoS attack.
This chapter evaluates the performance of proposed DDoS attack detection technique
through simulation-based experiments and hardware- based experiments. The performance
metrics that are used to evaluate and compare the simulation results includes: attack detec-
tion accuracy, false alarm rate, sensitivity vs specificity, computational cost, tree size and
resource usage.
The complete evaluation and comparison process is performed separately on both syn-
thetic datasets generated by simulation in NS-2 [58] and dataset generated by deploying
actual WBAN hardware testbed environment. Each of the selected performance metric is
evaluated on both synthetic datasets and real-time WBAN dataset. Finally, a comparative
analysis is done based on the simulation results obtained from EVFDT with the correspond-
ing simulation results acquired from existing techniques.
This chapter is organized as follow: The performance evaluation metrics selected for as-
sessing the effectiveness of proposed technique is discussed in section 5.1. These perfor-
mance metrics are evaluated with the varying number of instances In and different noise
percentage present in the datasets. In section 5.2, using the selected performance metrics,
the proposed technique is evaluated on synthetic dataset generated by simulating LEACH
protocol in Network Simulator, NS-2. In addition to evaluation, a quantitative comparison
of proposed EVFDT with existing techniques is also discussed in this section. In section 5.3,
a hardware- based testbed is deployed to demonstrate the real-time WBAN environment. A
real-time stream data generated by WBAN sensors are used to evaluate the effectiveness of
61

EVFDT against the selected performance metrics. Computational cost is the metric calcu-
lated only for hardware-based generated data in order to measure the cost of computation
on sensor nodes. At the end of this section, a comparative analysis is given by applying
the EVFDT and existing techniques on real-time datasets. The Qualitative comparison of
EVFDT and existing classification algorithms are given in Section 5.4. Finally, Section 5.5
concludes the chapter.
5.1 Performance Evaluation Metrics
EVFDT is evaluated using the following quantified performance evaluation metrics: attack
detection accuracy, false alarm rate, sensitivity vs specificity, computational cost, tree size,
computational time and memory usage. These performance metrics are very important for
the evaluation of any attack classification technique. All of these performance metrics are
used to evaluate the simulation- based and hardware- based experiments except computa-
tional cost and tree size. Table 5.1 shows the performance metrics used in simulation- based
and hardware- based experiments. The tick (X) shows that the metric is used for evaluation
whereas the cross (X) shows that the metric is not used for evaluation. These performance
metrics are discussed below.
Table 5.1: Performance evaluation metrics
ExperimentMethod
DetectionAccuracy
FalseAlarm
Cost Sensitivity vsSpecificity
TreeSize
Time MemoryUsage
Simulation X X X X X X XHardware X X X X X X X
5.1.1 Attack Detection Accuracy
Attack detection accuracy is a ratio of number of correct predictions to the total number
of tested examples. For measuring detection accuracy, confusion matrix is used. Table 5.2
presented the confusion matrix.
True Positive (TP) = Samples that are correctly classified as attack class.
True Negative (TN) = Samples that are correctly classified as non-attack class.
62

Table 5.2: Confusion Matrix
Normal AttackNormal True Negative False PositiveAttack False Negative True Positive
False Positive (FP) = Samples that are incorrectly classified as attack class.
False Negative (FN) = Samples that are incorrectly classified as non-attack class
In general, the accuracy of proposed EVFDT is directly proportional to the number of data
stream samples. With the increase in data stream samples (number of instances), EVFDT
becomes more and more accurate as long as the data is noise free. But as soon as the
noise is injected, the classification accuracy starts decreasing. For the conducted simulation
experiments, attack detection accuracy was calculated using equation 5.1
Attack DetectionAccuracy =TruePositives+ TrueNegatives
Total Number of TestedExamples(5.1)
EVFDT is compared with existing stream mining classification algorithms in terms of de-
tection accuracy on both simulation- based datasets in Section 5.2 and datasets generated by
deploying real-time WBAN testbed in Section 5.3.
5.1.2 False Alarm Rate (FAR)
The number of false alarms generated by the attack detection technique is computed as the
combination of both False Positive Rate (FPR) and False Negative Rate (FNR). These are
discussed below:
False Positive Rates (FPR)
The FPR of an attack classification technique is defined as a ratio of the total number of
legitimate packets classified as malicious packets to the total number of packets. It can be
calculated using equation 5.2
False PositiveRate =Legitimate Packets Incorrectly Classified asMalicious
Total Number of Packets(5.2)
False Negative Rates (FNR)
The FNR of an attack classification technique is defined as a ratio of the total number of
attack packets classified as legitimate to the total number of packets. It can be calculated
63

using equation 5.3
FalseNegativeRate =Attack Packets Incorrectly Classified asLegitimate
Total Number of Packets(5.3)
The FPR and FNR increases with the increase in the noise percentage which give rise to
false alarm generation. On the contrary, FPR and FNR decreases with the increase in the
number of instance In which means less false alarm rate.
EVFDT is compared with existing stream mining classification algorithms in terms of FPR
and FNR on both simulation- based datasets and datasets generated by deploying real-time
WBAN testbed.
5.1.3 Computational Cost
In addition to detection accuracy and FAR, it is also important to consider computational
cost when evaluating the performance of classification algorithm on real-time WBAN test
bed.
A cost matrix is a mean for influencing decision making of a classification model. It
provides the basis to the classification model to minimize the costly misclassifications and
maximize useful accurate classifications. To calculate the computational cost of EVFDT, a
cost matrix is used. Table 5.3 shows the cost matrix.
Table 5.3: Cost Matrix
Normal AttackNormal 0 λ
Attack 1 0
As the objective of EVFDT is to avert the rejection of legitimate users access, therefore, the
cost of false alarm was assumed high. In this research, the cost of false positives has been
assumed five times more than the cost of false negatives. The cost function is employed to
simplify the performance comparison of the EVFDT algorithm with existing stream mining
algorithms. The formula for calculating cost function is given in equation 5.4. It is based on
the number of samples that are classified incorrectly. Less cost means better performance of
the detection system.
Cost = (1−Attack DetectionAccuracy) + λ(False PositiveRate) (5.4)
64

where the parameter λ is the difference between false alarm and miss. For evaluation, λ is
set as 5. The computational cost of proposed algorithm and existing classification algorithms
are calculated and compared in Section 5.3.
5.1.4 Sensitivity vs Specificity
The confusion matrix given in Table 5.2 is also used to calculate other important statistical
measures that are useful to evaluate the performance of proposed classification algorithm.
These measures include:
Sensitivity
It determines the probability that the classification algorithm correctly identify an attack
traffic. The sensitivity of proposed and existing algorithms were calculated using equation
5.5.
Sensitivity =TruePositive
TruePositive+ FalseNegative(5.5)
Specificity
It indicates the probability that the classification algorithm correctly identify a non- attack
traffic. The specificity of proposed and existing algorithms were calculated using equation
5.6.
Specificity =TrueNegative
TrueNegative+ False Positive(5.6)
Analysis shows that the sensitivity and specificity decreases with the increase in noise per-
centage. Sensitivity and specificity of proposed and existing classification algorithms are
further evaluated and compared in Section 5.2 and Section 5.3.
5.1.5 Tree Size
Tree size is a key evaluation metric to assess the performance of any decision tree based clas-
sification algorithm. The amount of memory required to build a decision tree depends on the
tree size. A significant characteristic of any classification algorithm lies in its ability to build
a decision tree with reduced tree size and increased classification accuracy simultaneously.
To evaluate the proposed algorithm of pruning, tree size metric is used. Preliminary analysis
shows that the tree size gets bigger with increase in noise percentage. Detailed analysis of
tree size with respect to noise percentage and number of instance In is discussed in Section
65

5.2.
5.1.6 Computational Time
Early detection of an attack is a desirable property of any attack detection technique. In
addition to accuracy, a detection technique should also be fast enough in detecting an at-
tack. Computational time is the total time taken in seconds for processing a full set of data
stream. Computational complexity of proposed algorithm is expressed in big O notation
and is proportional to O(lpdvc) where lp is the length of a pruned tree, d is the total num-
ber of attributes, v is the number of values per attribute and c is the number of classes.
Computational time of proposed and exiting algorithms is calculated and compared for both
simulation- based and hardware- based experiments.
5.1.7 Memory Usage
Taking into account the resource scarcity of WBAN environment, EVFDT should consume
less memory resources. The advantage of stream mining algorithms over existing machine
learning algorithms is that they did not require a full dataset to be stored in memory, rather
perform mining at run time. Memory required for running proposed EVFDT is calculated
using big O notation and is proportional to O(ndvc), where n is the number of decision
nodes in a tree, d is the total number of attributes, v is the number of values per attribute and
c is the number of classes. The total amount of memory required to run the proposed and
existing classification algorithms is the sum of memory allocated for learning and memory
allocated for training. Memory usage of proposed and exiting algorithms is calculated and
compared for both simulation- based and hardware- based experiments.
5.2 Simulation- Based Experiments
In this section, we evaluate the performance of proposed EVFDT in detecting DDoS attack
from incoming data stream generated by simulating LEACH protocol in NS-2 [60]. EVFDT
is compared with existing VFDT and its variants in terms of the performance evaluation
metrics discussed in Section 5.1.
5.2.1 Synthetic Datasets
The Low Energy Adaptive Clustering Hierarchy (LEACH) protocol [60] was implemented
in NS-2 for generating the synthetic data stream containing one million data values, which
66

are divided into five datasets. Each dataset contains different number of instances and noise
percentage. LEACH protocol is selected because it is light weight and closely reflects the
WBAN scenario. Cluster heads acts as aggregate node or Body Control Unit (BCU) and all
other nodes as regular sensor nodes as depicted in Figure 5.1. LEACH protocol is respon-
sible for transferring the data from WBAN sensor node to BCUs. The DDoS attack code is
attached with regular sensor nodes to make them malicious. The number of malicious sensor
nodes varies with different attack dataset.
Figure 5.1: Illustration of LEACH Protocol
Table 5.4: Simulation Parameters
Parameters ValuesSensing Field 50 X 50Topology StarSimulation Time 900s,1200s,1500s,1800s,2000sPacket Size 1000 bytesRadio Communication Range 2m Standard,5m Special useNo. of Nodes 50BAN Coordinator Directional ModeSensor Nodes Omni directional ModeRouting Protocol LEACH
67

The simulation runs for 900s, 1200s, 1500s, 1800s and 2000s to generate the data streams.
Other simulation parameters and network configurations are shown in Table 5.4. After pass-
ing from data collection phase, and pre-processing phase discussed in chapter 4, the resulting
data set includes both attack and non- attack data. This resulting dataset is given as an input
to EVFDT for further attack classification.
5.2.2 DDoS Attack Strategy: Generation and Analysis
In this subsection, an attack dataset is generated and analyzed for DDoS attack. The analysis
is performed on the basis of DDoS attack characteristics discussed in Chapter 4. In ongo-
ing simulation experiment, first the legitimate traffic is considered for analysis. Secondly,
the attack is generated and its intensity under flooding attack traffic is analyzed. An attack
algorithm is written and generated online. The resulted dataset (attack dataset) is stored
in database at base station for pre-processing. The EVFDT classification algorithm is ap-
plied on the pre-processed dataset for attack classification. The DDoS attack pseudocode is
presented in Algorithm 6.
Algorithm 6 Distributed Denial of Service Attack AlgorithmRequire:
SN: Set of sensor nodes for aggregate node (AN) selectionR: Number of roundsSimulation Parameters of LEACH protocol (Table 5.4) Output: DDOS Attack Dataset
1: Procedure DDOSAttackAlgorithm(SN,R)2: BEGIN3: if r = 0 then4: Initial round AN selection5: end if6: for (maximum number of rounds r) do7: Choose r rounds AN randomly8: AN announces schedule time T to all SN9: end for
10: Attach attack code with random nodes Nr
11: Randomly initiates malicious nodes towards victim node v12: Malicious nodes start and stop randomly according to time T during formation13: Malicious nodes starts compromising v14: Malicious nodes forward flooding packets to v with high rate to overflow v and con-
sume resources available to victim v15: v receives packet with rate16: More malicious nodes starts compromising v at their schedule time T causing DDoS
flooding attack17: END Procedure
68

JAVA code is written to randomly add noise in the data set. For this purpose, N- dimen-
sional feature vector is multiplied with vector of random variables taken from the Normal
DistributionN(0, σ2), where σ2 is noise variance adjust according to the percentage of noise
added.
5.2.3 Performance Evaluation and Comparative Analysis
To evaluate the performance of EVFDT on simulation- based experiments, noise is attached
with datasets in order to compare the result of EVFDT with variants of VFDT under different
noise percentage. Each dataset contains different number of instances and divided into 20%
testing data and 80% training data to learn the classifier. The performance is evaluated using
the following parameters. The detail of these parameters is given in section 5.1.
• Attack Detection Accuracy
• False Alarm Rate
• Sensitivity and Specificity
• Tree Size
• Resource Usage
Attack detection Accuracy
For the conducted simulation-based experiments, attack detection accuracy was calculated
using equation 5.1 In Figure 5.2, we evaluate and compare the impact of variation of the
noise percentage on the attack detection accuracy for proposed and existing classification
algorithms. As observe from the graph in figure, the attack detection accuracy for all algo-
rithms is higher for noise free data. But as the noise percentage starts increasing the detection
accuracy begins to decrease. It is seen in figure that the EVFDT maintains good accuracy
even with the presence of noise.
Similarly, the number of instances In is a second important factor that contributes towards
the accuracy of attack detection algorithm. With the increase in number of instances In,
the EVFDT becomes more and more accurate as long as there is noise free data. Figure
5.3 shows the attack detection accuracy comparison of EVFDT with existing classification
algorithms on varying datasets with noise percentage of 10% and 20%. On all experimental
69

Figure 5.2: Accuracy in different Noise Percentage
(a) (b)
Figure 5.3: Accuracy vs In in different Noise Percentages
datasets, EVFDT maintains higher detection accuracy with less false alarm rate. A same
increase in the attack detection accuracy is noticeable for other noise percentages.
False Alarm Rate
FPR and FNR are the two key factors that contribute towards the generation of false alarms.
These can be calculated using equation 5.2 (FPR) and equation 5.3 (FNR). To analyze the
performance of proposed EVFDT in term of false alarm generation, we examine the impact
of noise percentage and number of instances In on FPR and FNR. Table 5.5 compares the
proposed and existing classification algorithms in terms of FPR and FNR for varying noise
percentage. It has been observed that the FPR and FNR increases with the increase in noise
percentage in all cases. As the goal is to maintain lower FPR and FNR even under extreme
noise and accordingly the proposed EVFDT achieves this objective by maintaining lower
FPR and FPR.
70

Table 5.5: FPR and FNR of Classification Algorithms in Percentage
NoiseVFDT-τ CVFDT OVFDT Proposed
FPR FNR FPR FNR FPR FNR FPR FNR
0% 4.6 5.4 5.3 5.1 1.4 2.4 1.0 0.95% 5.1 5.9 5.9 5.7 1.8 2.7 1.6 1.210% 5.7 6.8 6.5 6.2 2.2 3.2 1.9 1.715% 6.2 7.3 7.7 7.0 2.9 3.5 2.3 2.120% 6.8 7.9 8.1 7.8 3.8 4.1 2.9 2.8
Similarly, the effect of varying In on FPR and FNR is illustrated in Figure 5.4. As seen from
figure, the increase in In decreases the FPR and FNR. CVFDT has highest FPR and FNR for
highest In i.e. FPR=3.4 and FNR=3.1, whereas for same In, EVFDT has lowest FPR and
FNR i.e. FPR=0.9 and FNR=1.0 which means that EVFDT generates less false alarms as
compared to other techniques for varying In.
(a) (b)
Figure 5.4: FPR and FNR vs In (a) False Positive Rate (b) False Negative Rate
Sensitivity and Specificity
To evaluate the performance of EVFDT and existing classification algorithms, sensitivity
and specificity are the key statistical measures. They are calculated using Equation 5.5
(sensitivity) and Equation 5.6 (specificity). Table 5.6 compares the sensitivity and specificity
of EVFDT with existing classification algorithms with respect to different noise percentages.
As shown in table, the average sensitivity of VFDT-τ and CVFDT is very low as compared
to average specificity which is very high, this results in high false negatives.
71

OVFD and EVFDT have initially high sensitivity and high specificity for noise free data,
which is an ideal case. But as soon the noise is injected and its percentage starts increasing,
the specificity of OVFDT starts increasing whereas sensitivity starts decreasing which again
results in high false negatives.
On the other hand, EVFDT maintains the ideal case initially. But as the noise percentage
increases to 15%, the specificity starts increasing whereas sensitivity starts decreasing, but
the average sensitivity and specificity still meet the ideal condition.
Table 5.6: Sensitivity and Specificity of Classification Algorithms in Percentage
NoiseVFDT-τ CVFDT OVFDT Proposed
Sensitivity Specificity Sensitivity Specificity Sensitivity Specificity Sensitivity Specificity
0% 90.8 98.4 89.8 99.4 97.6 94.9 97.9 94.75% 79.2 91.7 78.9 91.7 89.2 91.7 82.3 90.010% 78.2 88.8 69.2 90.8 77.0 90.7 80.2 88.415% 76.3 88.3 67.7 88.9 76.9 86.8 79.2 86.820% 77.7 81.3 66.9 79.1 73.9 81.0 78.1 83.4
Avg 80.4 88.9 74.5 89.1 82.5 89.0 83.6 88.6
Tree Size
A significant characteristic of EVFDT lies in its ability to build a decision tree with reduced
tree size and increased classification accuracy simultaneously. The tree size is the depth of
the decision tree.
The tree size of proposed and existing classification algorithms is evaluated and compared
with respect to increase in noise percentage. Table 5.7 shows the impact of noise on tree
size for different number of instances In. The same table is plotted in Figure 5.5 in order to
compare tree sizes of EVFDT and existing classification algorithms.
It is observable from the Table 5.7 that the tree size gets bigger with increase in noise per-
centage. Similarly, the tree size is directly proportional to the number of instances In i.e.
the increase in In increases the tree size. The goal is to achieve maximum accuracy while
maintaining small tree size. Although VFDT-τ obtains a smallest tree size in our simulation,
72

Table 5.7: Tree Size Comparison with different Noise Percentage
Data Set Noise VFDT-τ CVFDT OVFDT EVFDT
Dataset-10
0% 4 5 6 35% 6 7 8 610% 9 9 11 815% 9 10 13 920% 9 9 15 8
Average 7 8 9 6
Dataset-20
0% 5 6 5 55% 7 7 8 710% 8 9 10 615% 10 11 11 820% 10 11 13 8
Average 8 9 10 6
(a) (b)
Figure 5.5: Tree Size vs Noise Percentage
but results in increased classification error which is not acceptable. As shown in Figure 5.5,
notably, EVFDT maintains a smaller tree size. In few cases, EVFDT and VFDT-τ produces
same tree size, but the average tree size of EVFDT is smaller than VFDT-τ . The simulation
experiment shows the tree size (TS): TSEV FDT < TSV FDT−τ < TSCV FDT < TSOV FDT .
Resource Usage
The resources used for simulation experiments include the overall usage of CPU time and
memory for processing the classification algorithm. Both computational time and memory
usage is calculated using Big O notation as discussed in section 5.1. Computational time is
a time taken in seconds by CPU for processing a full set of data stream. Figure 5.6 shows
the computational time of the proposed and existing classification algorithms. It includes
the overall CPU time for processing a full set of data stream samples. It is evident from the
73

graph that CVFDT takes maximum time as compared to other technique because of building
and processing two tree simultaneously. Among all classification algorithms, VFDT-τ has a
small CPU processing time due to small and definite value of τ . The proposed EVFDT takes
slightly more time than VFDT-τ because of tree pruning and adaptive threshold computation.
The Computation time is compared as (CT ) : CTV FDT−τ < CTEV FDT < CTOV FDT <
CTCV FDT .
Figure 5.6: Computational Time vs Number of Instances In
Similarly, the total amount of memory required to run a classification algorithm is the sum
of memory allocated for learning and memory allocated for training. The amount of memory
is directly proportional to the number of instances In, which is an obvious fact because the
increase in the number of instances In requires additional memory for learning and training.
Moreover, the presence of noise has no impact on the memory requirement of classification
algorithm. Figure 5.7 compares the total amount of memory required for running EVFDT
and existing algorithms. As shown in the figure, CVFDT consumes more memory space as
compared to other classification algorithms due to the simultaneous learning and training of
two classification trees in the memory. The memory resource usage of proposed EVFDT
is less due to pruning and run-time computation of tie- breaking threshold. As compared
to proposed EVFDT, VFDT-τ consumes little more memory due to the initial selection and
declaration of decisive parameter τ . The memory usage of classification algorithm is com-
pared as (M) : MEV FDT < MOV FDT < MCV FDT < MV FDT−τ .
74

Figure 5.7: Memory Usage vs Number of Instances In
5.3 Hardware- Based Experiments
5.3.1 Experimental TestBed
To evaluate the performance of EVFDT algorithm for DDoS attack detection, the real time
WBAN testbed is deployed using e-Health sensor platform. EVFDT algorithm has been
implemented using Very Fast Machine Learning VFML libraries [61]. The experiments
were run on Ubuntu 14.04 - 64bit workstation with 2.8GHz processor and 8GB RAM with
all unnecessary background processes switched off. Wireshark 1.10.3 is installed to capture
the real-time packets coming from WBAN network via Zigbee module.
Testbed Setup
The testbed uses e-Health sensor shield v2.0 by Libelium communications distribution to
demonstrate the real-time WBAN scenario [62]. It monitors in real time the patients’ health
by deploying different medical sensors on patients body to get sensitive data of patients for
subsequent analysis by physicians. The gathered information can be send wirelessly to base
station using Arduino XBee Shield shown in Figure 5.8.
Figure 5.9 shows the ’Arduino XBee shield’ over e-Health sensor shield complete kit. It
is a 802.15.4 arduino shield embedded with Digi XBee 802.15.4 Original Equipment Manu-
facturer Module- Radio Frequency (OEM-RF) module having upto 100m distance transmis-
sion. It is specifically developed for low-power wireless communication applications such
as WBAN and sensor networks. Arduino XBee shield fits in the XBee socket of e-Health
sensor shield in order to sense and control the data from physical world and transfers it to
base station. From base station, the data is shifted to cloud for permanent storage. Similarly,
75

Figure 5.8: Arduino XBee Shield
the patients’ data can also be visualized by physicians in real time by sending it directly to
laptop or smartphone.
Figure 5.9: ’Arduino XBee shield’ over e-Health sensor shield complete kit
Nine different medical sensors are deployed at different locations on patients’ body as
shown in Figure 5.10. These sensors include: air flow (breathing), oxygen in blood (SPO2),
body temperature, electrocardiogram (ECG), glucometer, galvanic skin response (GSR -
sweating), blood pressure (sphygmomanometer), patient position (accelerometer) and mus-
cle/electromyography sensor (EMG). The details of each sensor is given as follow [62]
1. Air Flow (Breathing): Air flow sensor is used to measure the rate of breathing in
patient when a respiratory help is required. It consists of a set of two tines that are
placed in the nostrils to measure the breathing rate and an elastic thread that fixes
76

behind the ears.
2. Pulse and Oxygen in Blood: The pulse oximeter sensor is used to measure the amount
of oxygen in blood and pulse of a patient.
3. Body Temperature: Body temperature sensor is used to measure the temperature of
different body parts. The temperature varies according to the part of body at which
the temperature is measured and the time of measurement. Different body parts have
different temperatures.
4. Electrocardiogram (ECG): The electrocardiogram (ECG) is a diagnostic tool used
to assess the electrical and muscular functions of the heart.
5. Glucometer: A glucometer is a medical device for measuring the approximate con-
centration of glucose in the patient’s blood.
6. Galvanic Skin Response (GSR): The Galvanic skin response (GSR) is used for mea-
suring the electrical conductance of the skin, which varies with its moisture level. GSR
sensor measures the electrical conductance between 2 points, and is essentially a type
of ohmmeter.
7. Sphygmomanometer: It is used to measure the blood pressure of a patient.
Each sensor is equipped with a code that allows to sense and read patients data and trans-
fers it to e-health sensor shield. Similarly, a code is written and attached with e-health sensor
shield in order to allow it to act as an aggregate node. The responsibility of aggregate node
is to manage separately the data of each individual sensor and transfers it to base station.
The code for sensor node and aggregate node is written in Arduino software using Arduino
libraries. The Arduino IDE serial monitor is used to visualize the data coming from sen-
sor nodes. Figure 5.11 displays the screen shot of serial monitor showing the data of pulse
oximeter sensor.
Topology Design
In the demonstration of WBAN test bed, star topology is deployed for simplicity in which
each sensor is connected directly with the aggregate node (e-Health sensor shield) which
in turn connected to base station (PC/ Laptop) wirelessly using 802.15.4/ zigbee shield as
77

Figure 5.10: Complete WBAN Demonstration
shown in Figure 5.10. Sensor data is further transfer to the cloud server for permanent
storage.
5.3.2 Traffic Generation
The Arduino application is installed at the base station to gather and visualize the data com-
ing from WBAN sensors via aggregate node. The purpose of sensor network test-bed deploy-
ment is to demonstrate the DDoS attack detection scenario in real- time environment which
depends upon the rate of low of packets in the network. Therefore, there is also a need for
an application that successfully capture the packets coming from the deployed sensor net-
work for further analysis and attack classification. For this purpose, Wireshark application
is installed at base station. Now, the two different applications i.e. Arduino application and
wireshark application runs simultaneously at base station in order to generate and compare
the real- time sensor network traffic.
The Arduino application is used to gather and visualize data from WBAN sensors whereas
wireshark is used to capture packets coming from these sensors. These packets are then used
to calculate the statistical features given in Table 5.8 and was discussed in Chapter 4.
78

Figure 5.11: Arduino IDE serial monitor
Table 5.8: List of Statistical Features
Features Description
Packet Loss Per-centage
The number of packets or bytes lost due to the interaction of the legiti-mate traffic with the attack traffic
Delay or latency The time taken by the packets to reach from source to destinationJitter The variation in delay or packet delay variation. It is the variation in the
time between packets arriving within a particular windowThroughput The number of bytes transferred per unit time from source to destination
Sensor nodes have been identified through Sensor node ID. Legitimate traffic is generated
with fixed delay having fixed packet size and packet rate. Whereas, the attack traffic is gen-
erated by attaching the DDoS attack code with four sensors nodes using arduino application.
The packet rate of attack traffic is 150 pkts per second while the packet size remains fixed.
The complete experiment is run for 1 hours in which 50,000 data instances have been col-
lected. These data instances are divided into five datasets containing different number of
instances for evaluation purposes.
The resulting dataset contains both attack and non-attack data which is fed into the pre-
processing phase. After pre-processing, the dataset is divided into 20% testing data and 80%
79

training data to learn the classifier in attack classification phase.
5.3.3 Performance Evaluation and Comparative Analysis
To evaluate the performance of proposed algorithm on real-time cloud-assisted WBAN
testbed, following performance evaluation metrics are selected and employed. These evalu-
ation metrics are discussed in section 5.1.
• Attack Detection Accuracy
• False Alarm Rate
• Sensitivity and Specificity
• Cost
• Resource Usage
Attack Detection Accuracy
As given in Section 5.1, attack detection accuracy is define as a ratio of number of correct
predictions to the total number of tested examples and is calculated using equation 5.1. In
Figure 5.12, we analyze the effect of noise on attack detection accuracy of EVFDT with
respect to different number of instances In . As shown in the figure, for 0% noise, the attack
detection accuracy starts increasing with the increase in In. But as the noise percentage
increases, the attack detection accuracy starts decreasing even with the maximum In. For
instance, for 0% noise, the attack detection accuracy is nearly 100% for N=50,000, whereas,
for 15% noise the detection accuracy is deceased to 90.1% given the same value of In. A
similar decrease in the attack detection accuracy is observable with the increase in the noise
percentage in this experiment.
In figure 5.13, the proposed classification algorithm EVFDT is compared with existing
stream mining classification algorithms [34] [35] [36] in terms of attack detection accuracy
with respect to different noise percentages given In = 40, 000. It is evident from the figure
that the EVFDT maintains high accuracy upto 98.7% with 0% noise as compared to other
VFDT variants. Though the increase in noise effects the detection accuracy but still it is
higher than other VFDT variants.
80

Figure 5.12: Attack Detection Accuracy for Different Noise(%)
Figure 5.13: Attack Detection Accuracy Comparison with Different Noise(%)
Table 5.9 presents the attack detection accuracy comparison of EVFDT and existing clas-
sification algorithms. From table, it can be seen that the percentage of detection accuracy
95.7% for N= 10,000 and it starts increases with the increase in In. For In = 50, 000, the
detection accuracy reaches to 98.3%. For the same dataset, it is evident that the EVFDT
achieves maximum gain of 6.6% and a minimum gain of 2.4% in accuracy of attack detec-
tion.
False Alarm Rate
As discussed in Section 5.1, the rate of false alarm generated by attack detection technique
depends on the combination of two important factors: false positive rate and false negative
rate. These can be calculated using Equation 5.2 (FPR) and Equation 5.3 (FNR).
81
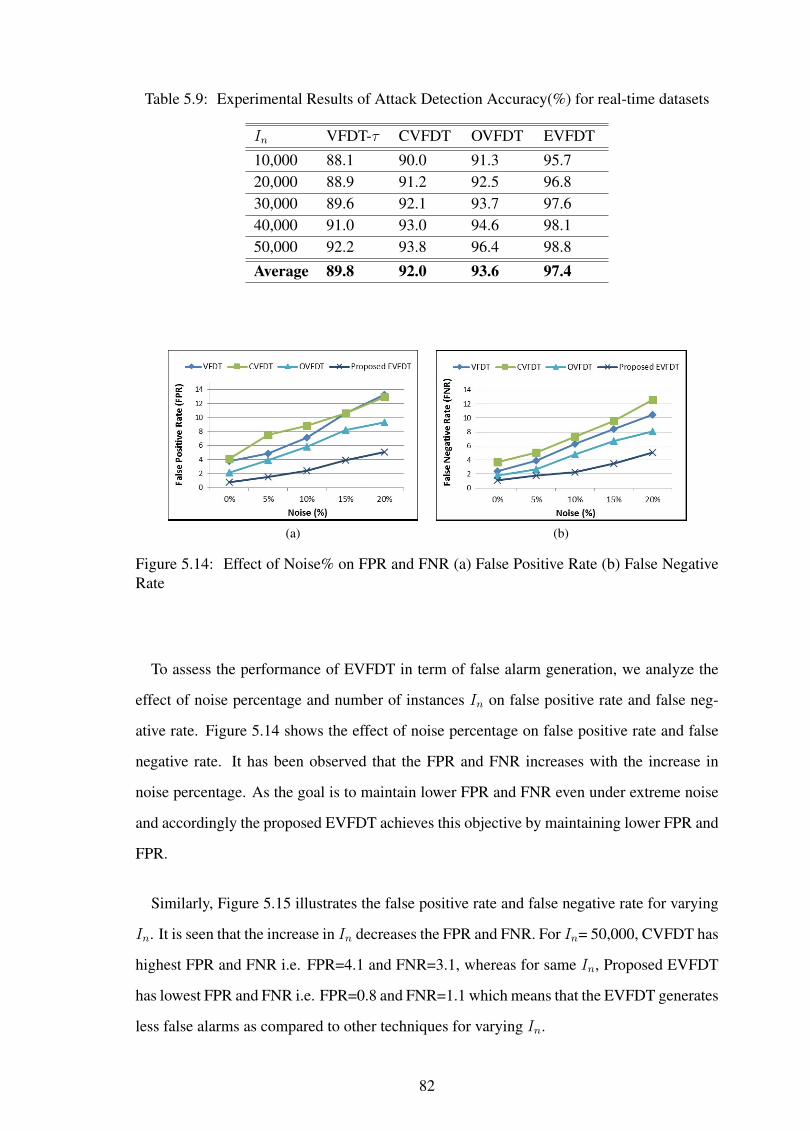
Table 5.9: Experimental Results of Attack Detection Accuracy(%) for real-time datasets
In VFDT-τ CVFDT OVFDT EVFDT
10,000 88.1 90.0 91.3 95.720,000 88.9 91.2 92.5 96.830,000 89.6 92.1 93.7 97.640,000 91.0 93.0 94.6 98.150,000 92.2 93.8 96.4 98.8
Average 89.8 92.0 93.6 97.4
(a) (b)
Figure 5.14: Effect of Noise% on FPR and FNR (a) False Positive Rate (b) False NegativeRate
To assess the performance of EVFDT in term of false alarm generation, we analyze the
effect of noise percentage and number of instances In on false positive rate and false neg-
ative rate. Figure 5.14 shows the effect of noise percentage on false positive rate and false
negative rate. It has been observed that the FPR and FNR increases with the increase in
noise percentage. As the goal is to maintain lower FPR and FNR even under extreme noise
and accordingly the proposed EVFDT achieves this objective by maintaining lower FPR and
FPR.
Similarly, Figure 5.15 illustrates the false positive rate and false negative rate for varying
In. It is seen that the increase in In decreases the FPR and FNR. For In= 50,000, CVFDT has
highest FPR and FNR i.e. FPR=4.1 and FNR=3.1, whereas for same In, Proposed EVFDT
has lowest FPR and FNR i.e. FPR=0.8 and FNR=1.1 which means that the EVFDT generates
less false alarms as compared to other techniques for varying In.
82

(a) (b)
Figure 5.15: Effect of In on FPR and FNR (a) False Positive Rate (b) False Negative Rate
Sensitivity and Specificity
Sensitivity and specificity are the two important statistical measures that are useful to evalu-
ate the performance of proposed classification algorithm. They are calculated using Equation
5.5 (sensitivity) and Equation 5.6 (specificity). Table 5.10 shows the sensitivity and speci-
ficity of proposed and existing attack classification algorithms with respect to different noise
percentages.
Table 5.10: Sensitivity and Specificity of Existing Proposed Classification Algorithms inPercentage
NoiseVFDT-τ CVFDT OVFDT EVFDT
Sensitivity Specificity Sensitivity Specificity Sensitivity Specificity Sensitivity Specificity
0% 87.8 97.4 88.8 99.3 92.2 90.9 98.9 96.75% 79.4 91.7 79.9 91.7 90.2 86.7 95.3 90.010% 79.2 88.8 69.8 93.8 88.5 84.7 86.2 88.415% 75.3 87.3 68.7 88.9 86.2 80.8 80.2 86.420% 78.7 85.3 66.9 81.1 83.9 76.2 78.1 84.5
Avg 80.0 89.0 74.8 90.9 88.2 83.8 87.7 89.2
In Figure 5.16, the average sensitivity vs specificity is plotted showing the true positives,
true negatives, false positives and false negatives of existing and proposed classification
algorithms. From Figure 5.16 ,three possible outcomes are concluded:
1. High Specificity vs Low Sensitivity: In this case, a positive test means the attack is
probable having less false positives. Similarly, a negative test means low sensitivity
83

(a) (b)
(c) (d)
Figure 5.16: Sensitivity vs Specificity (a) VFDT-τ (b) CVFDT (c) OVFDT (d) EVFDT
having high false negatives. A negative test is not very helpful in decision making.
As shown in Figure 5.16, VFDT-τ and CVFDT falls in this category which leads to
conclusion that they both have high false negatives.
2. Low Specificity vs High Sensitivity: In this case, a negative test means the attack is
not probable having less false negatives. Similarly, a positive test means low speci-
ficity having high false positives. In this outcome, a positive test is not very helpful in
decision making. As shown in Figure 5.16, OVFDT falls in this category which leads
to conclusion that OVFDT suffers from high false positives.
3. High Specificity vs High Sensitivity: This is an ideal case. A positive test result
means attack is probable and a negative test result means attack is not probable. From
figure 5.16(d) , EVFDT shows an ideal case in which the sensitivity is 87.7% and
specificity is 89.2%.
Based on the sensitivity and specificity, Receiver Operating Characteristics (ROC) curve
is plotted which is used to assess the effectiveness of a given detection technique. Figure
5.17 shows the ROC curve of the EVFDT and existing algorithms. From the figure, it is
evident that the proposed EVFDT has high sensitivity (True Positive Rate) with fever false
positive rate (100- Specificity) as compared to other existing algorithms.
84

Figure 5.17: ROC curves showing the tradeoff between Sensitivity and false-positive rate(100-Specificity) of DDoS attacks
Cost
In addition to accuracy and false alarm rate, it is also important to consider computa-
tional cost when evaluating the performance of classification algorithm on real-time WBAN
testbed. The computational cost of proposed and existing classification algorithms are cal-
culated using Equation 5.3. For evaluation and comparison of classification algorithms, the
parameter λ is set as 5. Figure 5.18 compares the computational cost of proposed and ex-
isting classification algorithms in the form of bar chart. From the figure, it is evident that
the computational cost per sample of EVFDT is less as compared to VFDT and its variants.
CVFDT maintains high computational cost among all because it builds two classifications
trees simultaneously. VFDT maintains less computational cost nearly equal to EVFDT, but
at the same time it results in very low attack detection accuracy and high false alarm rate.
Figure 5.18: Computational Cost Comparison
85

Resource Usage
Resource usage includes the overall usage of CPU time and memory for processing the
classification algorithm. Both computational time and memory usage is calculated using
Big O notation.
Computational time is a time taken in seconds by CPU for processing a full set of data
stream. Figure 5.19 shows the computational time of the proposed and existing classification
algorithms. It is evident from the figure that VFDT-τ has a small running time due to small
and fix value of τ . EVFDT takes slightly more time than VFDT-τ because of pruning and
tie- breaking threshold computation.
Figure 5.19: Computational Time Comparison
Similarly, the total amount of memory required to run EVFDT is the sum of memory allo-
cated for learning and memory allocated for training. The total memory required for running
EVFDT and existing algorithms is shown in Figure 5.20. As shown in the figure 5.20, the
amount of memory increases with the increase in In. CVFDT consumes more memory space
as compared to other techniques because of maintaining two classification trees simultane-
ously in the memory. The memory resource usage of EVFDT is less because it calculates
the tie- breaking threshold τ at run- time. As compared to EVFDT, VFDT-τ consumes little
more memory due to the initial selection and declaration of decisive parameter τ .
5.4 Qualitative Comparison of Classification Algorithms
Comparison of EVFDT classification algorithm with existing VFDT and its variants is shown
in Table 5.11. Only OVFDT and EVFDT can handle noisy data. At the same time, OVFDT
handles noisy data to some extent and becomes inaccurate with the increase in noise percent-
age due to the presence of outliers. VFDT-τ , CVFDT and Improved VFDT (IVFDT) [63]
does not provide tree pruning. They maintain small tree size from the beginning but with
86

Figure 5.20: Memory Usage Comparison
the increase in noise percentage, the tree size starts increasing which in turn requires more
computational time and consume more memory space. Only EVFDT classification algo-
rithm efficiently handles noisy data and at the same time maintains small tree size with less
resource usage.
5.5 Conclusion
In this chapter, we have evaluate and compare the performance of DDoS attack detection
technique proposed in Chapter 4, for variations in the results of performance evaluation pa-
rameters, including: attack detection accuracy, false alarm rate, cost, tree size, sensitivity
vs specificity and resource usage. For the evaluation of proposed technique, the attack de-
tection accuracy is analyzed for variations in the number of instances In and the percentage
of noise present in the data. The overall analysis shows that the attack detection accuracy
increases with the increase in In, whereas it significantly decreases with the increase in noise
percentage. Further, simulation experiments are performed to assess the false positive rate
and false negative rate. The results shows the significant increase in FPR and FNR for in-
crease in noise percentage whereas for number of instances, the increase in In decreases the
rate of false positives and false negatives. Subsequent results were obtained for sensitivity
and specificity, i.e. the increase in noise percentage decreases the sensitivity and speci-
ficity. The sensitivity and specificity of any system directly exhibit its accuracy. The high
sensitivity and specificity of proposed system depicts that it is more accurate in detecting
attacks as compared to existing techniques. The computational cost is calculated only for
real-time generated data in order to measure the cost of computation on sensor nodes. It is
evident from simulation results that the computational cost of proposed algorithm is less as
87

Table 5.11: Qualitative Comparison of Proposed and Existing Classification Algorithms
Features VFDT-τ CVFDT OVFDT EVFDTDetectionAccuracy
Very Low Very Low Good; Does nothandle outliers
Excellent
ComputationalCost
Very Low Very High High Very Low
ResourceUsage (Time/Memory)
Less time;More mem-ory
More timein buildingtwo trees andrequires addi-tional memory
Less time; Lessmemory
Same Time asVFDT but con-sumes very lessmemory space
Noisy DataHandling
Does not han-dle noisy data
Not appropriateunder noisydata
HB fluctua-tion intensifiesunder noisydata; Accuracydecreases
Handles noisydata efficiently
Tree Size/Pruning
Small TreeSize; Nopruning
Same tree sizeas VFDT; NoPruning
Small TreeSize; Incremen-tal pruning
Small tree size;Iterative Prun-ing
ComputationalResources
Consume lessresources
Consume moreresources bymaintainingtwo trees
Consume lessresources
Consumes veryless resourcesby cutting ofHB outliers
compared to existing algorithms. Likewise, the resource usage of proposed technique is su-
perior to other techniques. The computational time of proposed technique is slightly greater
than VFDT-τ because of pruning and threshold computation. VFDT-τ do not perform prun-
ing at all, therefore it takes less computation time. At the end, a qualitative comparison is
performed to show the superiority of proposed attack detection algorithm. The qualitative
analysis shows that only OVFDT and EVFDT can handle noisy data. VFDT-τ , CVFDT and
IVFDT does not provide tree pruning at all.
88

Chapter 6
PROPOSED TRACEBACK SCHEME FOR DISTRIBUTED DENIAL
OF SERVICE ATTACK
With the increasing popularity of cloud- assisted WBAN for critical health applications, the
demand for securing these networks is also increasing. One of the major threats to these
networks are DDoS attack that not only exhaust the network capacity but also prevent these
networks to perform their desired tasks [64]
In DDoS attack, the key issue lies in detecting an attack and invoking the appropriate
traceback mechanism. In chapter 4, a machine learning based attack detection algorithm
is proposed to detect distributed denial of service attack in WBAN environment. In this
chapter, a novel traceback technique is proposed and discussed.
Traceback requires reconstructing the attack path and identifying the source of distributed
denial of service attack. Traceback techniques proposed for conventional IP- based net-
works [38], [39], [40], [41] are not directly applicable on resource constrained WBAN envi-
ronment due to additional overhead requirements and high convergence time. Similarly, sev-
eral traceback techniques are also available for MANET [42] and WSN [43] that overcome
the limitation of overhead but at the cost of additional processing and storage requirements.
Results and analysis shows that none of the available solutions are appropriate for trace-
back of DDoS attack in cloud- assisted WBAN environment. Among the available tech-
niques, fishbone traceback (FBT) [44] is specifically proposed for hierarchical Wireless Sen-
sor Networks (WSN). It is based on edge sampling approach [40] and appears to be more
appropriate than other techniques because it is lightweight and easily implemented in WSN.
FBT uses marking probability distribution function that assigns fixed marking probability to
all the nodes in order to minimize the convergence time but, concurrently, it increases the
overhead on nodes.
In this chapter, a new traceback technique called Efficient Traceback Technique (ETT) is
proposed, to be deployed specifically in resource constrained WBAN environment. The pro-
89

posed technique assigns the dynamic marking probability to each node based on the number
of hops the packet travelled once it originates from the source. The number of hops can be
calculated as the distance travelled by the packets from the source. Finally, a path reconstruc-
tion algorithm is proposed to traceback the attacker. Results and comparison shows that the
proposed technique has less convergence time (definition) as compared to fixed PPM. Sim-
ilarly, the proposed technique results in less computational overhead on nodes as compared
to other available schemes.
Section 6.1 present the preliminaries and gives an introduction to PPM. Further, the prob-
lems and issues related to choosing marking probability is discussed. The three key issues
relevant to choosing marking probability are discussed in detail. Section 6.2 described the
proposed packet marking technique for both multi-hop and single- hop topology. For packet
marking, a novel labeling technique is proposed to find the traveling distance of node from
the origin. Subsequently, a working example is given to show the effectiveness of proposed
technique. In section 6.3, a proposed DDoS attacker traceback algorithms are proposed for
path reconstruction and identification of an attacker. This mechanism comprises of two pro-
cedures: Procedure for Aggregate Node Path Reconstruction (to reconstructs the path from
victim to the aggregate node of the cluster that contains the attacker and the source node),
and Procedure for Sensor Node Path Reconstruction (to performs the path reconstruction
from aggregate node to the source node from where the attack originates. Finally, in section
6.4, performance evaluation and benchmarking is given.
6.1 Preliminaries
In sensor network environment, one of the key feature is that the source node itself inserts
its source address in the MAC header before it sends any packet. This allows a number of
anonymous attacks on sensor networks [40].
A number of approaches are available to traceback the source of an attack and packet
marking is one of them. In packet marking approach, each node place some path information
in every passing packet until it reaches the victim. The victim node reconstructs the attack
path by collecting a certain number of packets along the network path.
Among packet marking approaches, probabilistic packet marking (PPM) is considered the
most well-known solution for traceback of DDoS attack because PPM has small implemen-
90
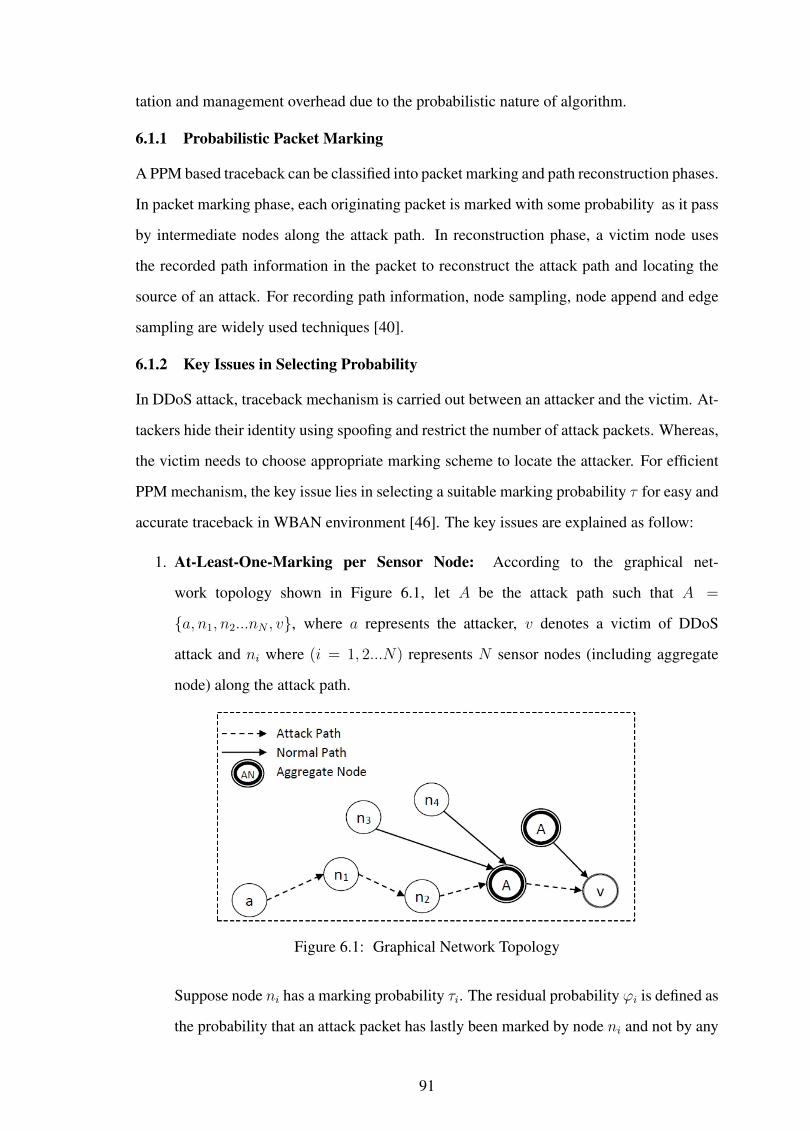
tation and management overhead due to the probabilistic nature of algorithm.
6.1.1 Probabilistic Packet Marking
A PPM based traceback can be classified into packet marking and path reconstruction phases.
In packet marking phase, each originating packet is marked with some probability as it pass
by intermediate nodes along the attack path. In reconstruction phase, a victim node uses
the recorded path information in the packet to reconstruct the attack path and locating the
source of an attack. For recording path information, node sampling, node append and edge
sampling are widely used techniques [40].
6.1.2 Key Issues in Selecting Probability
In DDoS attack, traceback mechanism is carried out between an attacker and the victim. At-
tackers hide their identity using spoofing and restrict the number of attack packets. Whereas,
the victim needs to choose appropriate marking scheme to locate the attacker. For efficient
PPM mechanism, the key issue lies in selecting a suitable marking probability τ for easy and
accurate traceback in WBAN environment [46]. The key issues are explained as follow:
1. At-Least-One-Marking per Sensor Node: According to the graphical net-
work topology shown in Figure 6.1, let A be the attack path such that A =
{a, n1, n2...nN , v}, where a represents the attacker, v denotes a victim of DDoS
attack and ni where (i = 1, 2...N) represents N sensor nodes (including aggregate
node) along the attack path.
Figure 6.1: Graphical Network Topology
Suppose node ni has a marking probability τi. The residual probability ϕi is defined as
the probability that an attack packet has lastly been marked by node ni and not by any
91

other node further down the attack path. From the perspective of victim v, ϕi helps the
victim v to know that the node ni is on the attack path after inspecting this incoming
packet. Residual probability ϕi is represented as:
ϕi =
n∏j=1
(1− τj) i = 0
n∏j=j+1
(1− τj) 1 6 i < N
τi i = N
(6.1)
Consider all nodes have the fixed marking probability then τ1 = τ2 = ... = τn ≡ τ .
From Equation 6.1, we have;
ϕi = τ(1− τ)N−1 for1 6 i 6 N (6.2)
From Equation 6.2, it is concluded that the residual probability ϕi for node ni is geo-
metrically smaller, i.e. the node is closer to the attacker. It is given as:
ϕ1 < ϕ2 < ... < ϕN (6.3)
From Equation 6.3, it is concluded that the node n1 has minimum possibility whereas
node nN has the maximum possibility to send its marking information to the victim
node v. It is not possible for victim v to figure out that node ni is on attack path until
v receives a packet that contains a marking left by node ni. Therefore, the victim must
receive at-least-one-marking from each node ni on the attack path for the successful
reconstruction of attack path. Let P be the attack measure from an attacker a to the
victim v. To fulfill the need of at-least-one-marking per node ni, an efficient PPM-
based traceback must meet the following criteria:
Pϕ1 = Pτ(1− τ)N−1 > 1 (6.4)
In Figure 6.2, a graph is plotted that shows the possible values of ϕ1 for node n1 with
respect to τ and N using Equation 6.2. It is evident from Figure 6.2 that for different
number of N , the peak value occurs at τ = 1/N e.g., for N = 25, the peak value
occurs at 1/25 for which ϕ1 = 0.0277. As the value of N (total number of nodes
between a and v) varies and is unknown to victim, therefore it is difficult to decide the
92
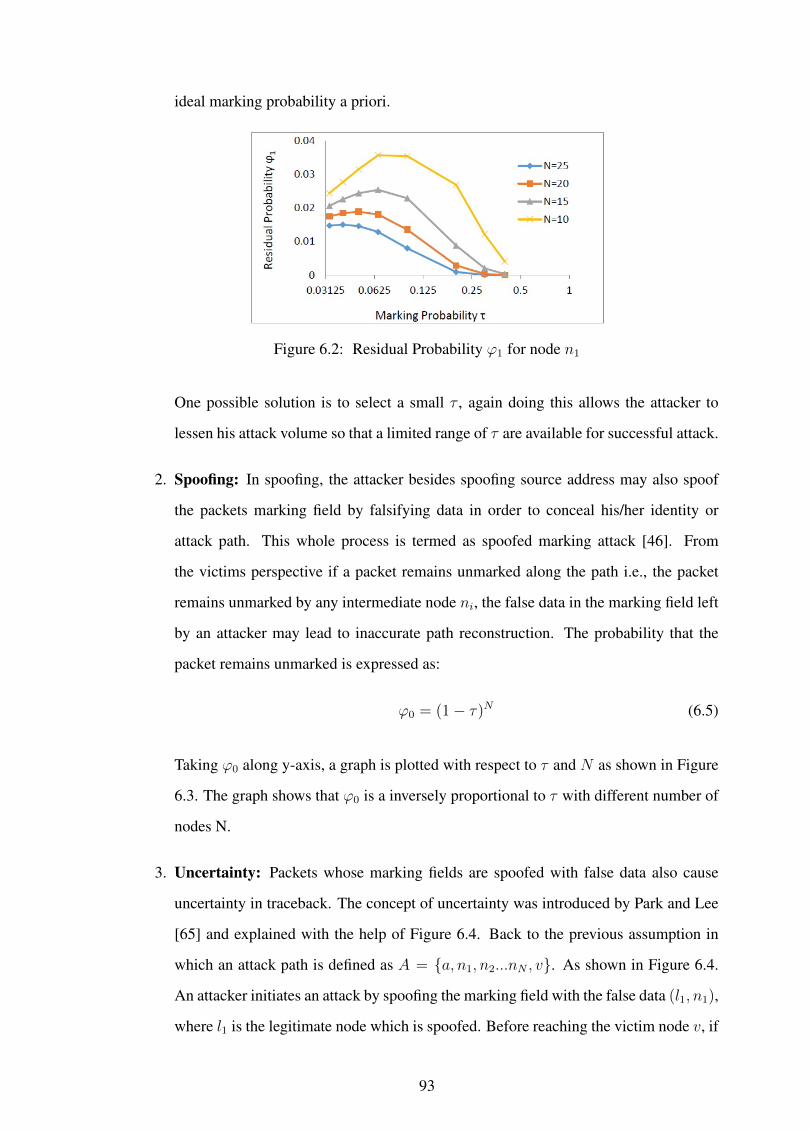
ideal marking probability a priori.
Figure 6.2: Residual Probability ϕ1 for node n1
One possible solution is to select a small τ , again doing this allows the attacker to
lessen his attack volume so that a limited range of τ are available for successful attack.
2. Spoofing: In spoofing, the attacker besides spoofing source address may also spoof
the packets marking field by falsifying data in order to conceal his/her identity or
attack path. This whole process is termed as spoofed marking attack [46]. From
the victims perspective if a packet remains unmarked along the path i.e., the packet
remains unmarked by any intermediate node ni, the false data in the marking field left
by an attacker may lead to inaccurate path reconstruction. The probability that the
packet remains unmarked is expressed as:
ϕ0 = (1− τ)N (6.5)
Taking ϕ0 along y-axis, a graph is plotted with respect to τ and N as shown in Figure
6.3. The graph shows that ϕ0 is a inversely proportional to τ with different number of
nodes N.
3. Uncertainty: Packets whose marking fields are spoofed with false data also cause
uncertainty in traceback. The concept of uncertainty was introduced by Park and Lee
[65] and explained with the help of Figure 6.4. Back to the previous assumption in
which an attack path is defined as A = {a, n1, n2...nN , v}. As shown in Figure 6.4.
An attacker initiates an attack by spoofing the marking field with the false data (l1, n1),
where l1 is the legitimate node which is spoofed. Before reaching the victim node v, if
93

Figure 6.3: Unmarked Probability ϕ0
the spoofed packet remains unmarked by other nodes along the path, it is considered
as legitimate packet originating from l1. A similar scenario is assumed for other nodes
l2, l3, ..., lK , where K is the uncertainty factor and defined as a total number of fake
sources of an attack besides the actual attacker a. Hence, the total number of false
sources of an attack identified by a traceback technique is (K + 1).
Figure 6.4: Falsify Paths
As discussed before, node closer to an attacker has least residual probability ϕi as
compared to other nodes. The attacker takes advantage of this scenario by keeping all
the spoofed packets unmarked and send them to victim v showing them as these were
marked by node n1. This scenario is represented as:
Kϕ1 = ϕ0 (6.6)
Solving Equation 6.6 by putting values of ϕ1 and ϕ0, we obtained
K =1
τ− 1 (6.7)
94

From Equation 6.7, it is observed that marking probability τ is inversely proportional
to uncertainty. As in original PPM approach, the marking probability τ is fixed. In-
crease in fixed marking probability τ results in the decrease of uncertainty factor K.
6.2 Proposed Traceback Technique
The existing PPM approaches proposed for sensor networks uses fixed marking probability
τi, for packet marking which results in high convergence time, additional overhead and un-
certainty as discussed in section 3.2. The root cause of this variance is the assignment of
uneven probability ϕi to sensor nodes ni along the attack path. Liu et al., [46] introduces the
concept of a dynamic probability packet marking (DPPM) approach, in which the marking
probability is assigned to each node based on the distance travelled by the packet. DPPM
uses Time-to-Live (TTL) field in IP- header to determine the travelling distance of each
packet passing by the router. As in sensor networks, we are dealing with MAC protocol,
determining the travelling distance is a key issue. Using a TCP protocol in WSN itself in-
creases the overhead due to three-way handshake. In the following section, we will present
a new traceback technique specifically for resource constrained WBAN. The proposed tech-
nique is based on DPPM and uses MAC header instead of IP header. The proposed technique
has following features:
1. It assigns a uniform probability i to all the nodes ni along the attack path with the aim
to reduce the overall convergence time.
2. It reduces the overhead on all the nodes by assigning the variable marking probability
in descending order as the packet travels along the attack path towards the victim node.
3. It ensures that each packet should mark at least once in order to remove the uncertainty
caused by spoofed marking.
The proposed technique works as follow:
Let d denotes the travelling distance of a packet such that (1 6 d 6 i), where i is the total
number of nodes along the attack path. Each node ni marks the packet r with the marking
probability which can be calculated as the distance travelled by packet r from its source until
reach that particular node. It can be expressed as:
95

τi =1
d(6.8)
Taking into account the working of proposed technique, the key issue lies in how to find
the travelling distance of each packet r from its source? In the following section, we will
answer this question. To the best of our knowledge, it is the first attempt to deploy DPPM in
WSN environment.
6.2.1 Finding the Traveling Distance
Before finding the traveling distance of each packet from its source, first we look into the
WBAN network topology shown in Figure 6.5. The network topology can be either multi-
hop or single- hop. Figure 6.5(a) shows the multi-hop WBAN topology in which sensor
nodes transmit their data to an aggregate node via intermediate nodes. Figure 6.5(b) shows
the single-hop topology in which each sensor node directly sends its data to an aggregate
node and further to base station (BS) via intermediate aggregate nodes. To find the traveling
(a) Multi-Hop WBAN (b) Single-Hop WBAN
Figure 6.5: WBAN Network Topology
distance of each packet from its source, a small number of bytes are reserved in the data
payload of MAC protocol data unit (MPDU) and labeled as DPPM label. Figure 6.6 shows
the MPDU with DPPM label. The labeling mechanism brings a very less change in IEEE
802.15.4 MAC header. In each packet, only 12 bytes are reserved to carry DPPM label for
multi-hop WBAN and 10 bytes for single-hop WBAN. As the label uses data payload of
MPDU which is variable in length, therefore, it is acceptable to carry this amount of data to
perform traceback operation in WBAN environment.
The length of DPPM label depends upon the topology employed for WBAN. Next, we
will discuss labeling in detail for both multi-hop and single-hop WBAN topology.
96

Figure 6.6: IEEE 802.15.4 with DPPM label
Multi-hop WBAN Topology:
For multi- hop WBAN topology, 12 bytes are reserved in MAC data payload and labeled as
P (s) = (Source, End, Initial,Head, Tail,Distance) as shown in Figure 6.7. Each P (s)
represent a packet fields marked at each sensor node s along the path. (Source, End) is as-
sociated with regular sensor node, where (Initial,Head, Tail) is associated with aggregate
nodes which helps in path reconstruction and Distance is used to find the distance travelled
by each packet from its origin.
Figure 6.7: DPPM label
The detail of each field is given as follow:
• Source: Source is the originating sensor node ID of an edge connecting two sensor
nodes e.g., in Figure 6.8 A is the source node sending packet to node B. When the
attack packet first originates, the source node write its node ID to this field of the
packet P (s).
Figure 6.8: Sensor Nodes Connecting with an Edge
• End: It is a node which receives a packet from a source i.e. node at the edge that
receives the packet e.g. in Figure 6.8, B is End. Upon receiving the packet, the end
node first checks the following conditions before writing its ID in the field: Source
97

field! = EMPTY Distance field = = 0 End node and Source node Same Cluster When
the above conditions met, the node writes its ID into the end filed of packet P (s). At
this point the distance field become 1.
• Distance: It is defined as the traveling distance from the source to the victim. This
field is incremented by each intermediate node as the packet travels along the attack
path.
• Initial: This field of a packet is written by an aggregate node of the cluster where
source node is present and remains same along the path until the packet reaches the
victim. The attack node also lies in the same cluster as the aggregate node.
• Head: This field is written by aggregate node of current cluster and contains the head
of an edge for aggregate nodes. This field is updated by every downstream aggregate
node upon the arrival of packet.
• Tail: Upon receiving the packet, the aggregate node updates this field with the tail of
an edge for aggregate node. This field is also written by aggregate nodes only.
Working Example: A detailed working example for finding the traveling distance of a
packet is given in this section. A multi- hop WBAN network topology is shown in figure
6.9(a). It consists of four clusters, where each cluster have regular sensor nodes and one
aggregate node that acts as a cluster head. Each sensor node either send its data directly to an
aggregate node or via other regular sensor nodes. Similarly, each aggregate node forwards
its data to base station (BS) either directly or via intermediate aggregate nodes. Suppose
attacker a1 launch DDoS attack towards BS by sending out spikes of packets. Figure 6.9(b)
shows the sequence of packets traveling along the path towards BS. Every node updates
each field of a packet P (s) in order to find the distance and reconstruct the path successfully.
It is explained as follow:
• Sensor node a2 writes its ID into the source field of packet P (s). After reaching node
a2, the DPPM label became (a2, 0, 0, 0, 0, 0)
• At node a3, the DPPM label is updated as P (a3) = (a2, a3, 0, 0, 0, 1). At this stage,
distance field is incremented by 1.
98

Figure 6.9: (a): Multi-Hop WBAN Topology
Figure 6.10: (b): Sequence of Packet Traveling Along the Path
• Upon reaching at aggregate node A, the DPPM label is updated and become P (A) =
(a2, a3, A,A, 0, 2).
• When aggregate node B receives the packet, it updates the packet by putting its ID
in the tail field as P (B) = (a2, a3, A,A,B, 3). The value of initial and head remains
same and distance is incremented by 1.
• Similarly, aggregate node C and D successively update the packet.
• Finally, the packet reaches the base station with DPPM label (a2, a3, A, C,D, 5).
Single- hop WBAN Topology
For Single- hop WBAN topology, only 10 bytes are reserved in MAC data payload and
labeled as P (s) = (Source, Initial,Head, Tail,Distance). The End field is redundant
99

and thus eliminated. The rest of the marking procedure for single- hop topology is same as
discussed for multi-hop WBAN topology.
6.2.2 Uniform Residual Probability
As discussed in Section 6.1.2, the key feature of proposed technique is to maintain a uniform
residual probability ϕi. To attain this, each node chooses its marking probability τi = (1/d)
where d = (1, 2, ..., N) and defined as a traveling distance of a packet from its source until
reaches the victim. For N sensor nodes, the residual probability is given as:
ϕN =1
N(6.9)
Similarly, for other nodes the residual probability ϕi is calculated by solving Equation 6.1
ϕi = τi
n∏j=1
(1− τj) 1 6 i < N (6.10)
ϕi =1
Nfor1 6 i < N (6.11)
From Equation 6.9 and Equation 6.11, it is concluded that each node ni along the attack path
has maintained a uniform residual probability ϕi to mark each packet before it reaches the
victim. This shows that each packet has been marked legitimately and no packet has been
left unmarked by any node which results in no uncertainty at all. It is further evaluated in
Chapter 7.
6.3 DDoS Attacker Traceback and Path Reconstruction
After successful packet marking, the next step is the path reconstruction and identification
of an attacker. Based on the collected marked packets, victim v execute the attack path re-
construction process. The proposed technique divides the reconstruction process into two
Procedures: (1) Aggregate nodes path reconstruction, and (2) Sensor node path reconstruc-
tion within the cluster.
6.3.1 Procedure for Aggregate Node Path Reconstruction
This procedure reconstructs the path from victim to the aggregate node of the cluster that
contains the attacker and the source node. Algorithm 7 gives the procedure for aggregate
node path reconstruction.
100

Algorithm 7 Aggregate Node Path Reconstruction at VictimRequire: S: Set of attack packets at victim v Packet x, y
Stack S1String path
1: BEGIN Procedure PathReconstructionAtAggregateNode().2: Group the packets in set S based on Initial field3: for each Group G1 in S do4: x = FindLeaf(G1) //Function Call5: S1.push(x.Head)6: y = FindParent(x,Head,G1) //Function Call7: while y 6= 0 do8: S1.push(x.Head)9: x = y.
10: y=FindParent.x,Head,G1) //Function Call11: end while12: end for13: path = AggregateNodePathReconstruction(S1) //Function Call14: END Procedure15: BEGIN Procedure Packet FindLeaf(Group G1) //Function Definition16: for each packet j in G1 do17: if j.Tail == 0 then18: RETURN path19: end if20: end for21: END Procedure22: BEGIN Procedure Packet FindParent(Packet k,G1) //Function Definition23: for each packet j in G1 do24: if j.Tail == k then25: RETURN j.26: end if27: end for28: END Procedure29: BEGIN Procedure String AggregateNodePathReconstruction(Stack S1) //Function
DefinitionRequire: String path30: while S1.IsEmpty() 6= 0 do31: path += S1.pop()32: end while33: RETURN path34: END Procedure
6.3.2 Procedure for Sensor Node Path Reconstruction
This procedure performs the path reconstruction from aggregate node to the source node
from where the attack originates. The procedure for sensor node path reconstruction is given
in Algorithm 8.
101

Algorithm 8 Sensor Node Path ReconstructionRequire:
Packet j, kStack S2String path
1: BEGIN Procedure PathReconstructionAtSensorNode().2: Find Aggregate Node Packet AggPacket at Aggregate Node A.3: for every packet i in A do4: if i.Initial == A then5: AggPacket = i.6: end if7: end for8: Find Parent of Aggregate Node A9: for every packet i in A do
10: if (i.Source == AggPacket.Source)&&(i.End ==AggPacket.End)&&(i.Initial = 0) then
11: j = i.12: end if13: end for14: S2.push(j.End)15: k = FindParent(j.Source) //It will return the packet which has End value same as the
input Parameter.16: while k 6= 0 do17: S2.push(k.End)18: j = k.19: k=FindParent(j.Source) //Function Call20: end while21: S2.push(k.Source) //k.Source is the Intruder Node22: path = CompromisedNodePathReconstruction(Stack S2) //Function Call23: END Procedure24:25: BEGIN Procedure String CompromisedNodePathReconstruction(Stack S2) //Func-
tion DefinitionRequire: String path26: while S2.IsEmpty() 6= 0 do27: path += S2.pop()28: end while29: RETURN path30: END Procedure
6.4 Conclusion
In cloud- assisted WBAN, identifying the source of distributed denial of service attack and
reconstructing an attack path are the key challenges due to the resource constrained nature of
these networks. Traceback techniques proposed for standard IP- based networks are not ap-
propriate for sensor networks due to additional overhead requirements and high convergence
102

time. Similarly existing techniques proposed for mobile ad-hoc networks requires additional
processing and storage requirements. In this chapter, an efficient traceback technique is pro-
posed that can be deployed in cloud- assisted WBAN environments. The proposed tech-
nique assigns the dynamic marking probability to each node based on the number of hops
the packet travelled once it originates from the source. The number of hops can be calcu-
lated as the distance travelled by the packets from the source. Finally, a path reconstruction
algorithms are proposed that efficiently traceback the attacker.
103

Chapter 7
TRACEBACK SCHEME: PERFORMANCE EVALUATION AND
BENCHMARKING
DDoS attack is one of the major attacks in WBAN environment that not only exhausts the
available resources but also influence the reliability of information being transmitted. After
the successful detection of DDoS attacks, the next key challenge lies in identifying the source
of these attacks and reconstructs the attack path. Among the existing traceback techniques,
PPM is the most widely and successfully implemented technique towards the preventing
DDoS attack. However, since marking probability assignment has significant affect on both
the convergence time and performance of a scheme, it is not directly applicable in WBAN
environment due to high convergence time and overhead on intermediate nodes. Therefore,
a new scheme called efficient traceback technique (ETT) is proposed in chapter 6 in order to
improve the effectiveness and compatibility of PPM in WBAN.
In this chapter, the performance of proposed traceback technique is evaluated through
simulation and experiments. The proposed scheme is discussed in chapter 6, which assigns
the dynamic marking probability to each node along the path, and further reconstructs the
attack path to efficiently traceback the attacker and making subsequent decision. The per-
formance of proposed scheme is affected by few network parameters. The variation in these
parameters are used to quantify the results, based on simulation experiments. The network
Simulator NS-2 was used to compared and analyze the performance metrics including: con-
vergence time, overhead and uncertainty. The acquired simulation results are compared with
corresponding results obtained from the simulation of fishbone traceback technique for both
multi- hop and single- hop sensor network. The results shows that the proposed technique is
better than FBT that used fixed marking probability.
7.1 Simulation Setup
To analyze the feasibility and evaluate the performance of proposed marking technique and
path reconstruction algorithms, extensive simulation experiments have been performed. The
104

key purpose of performing simulation experiments is to investigate the performance metrics
related to packet marking approach: convergence time, Overhead on nodes and uncertainty
in marking packets.
To conduct the simulation experiments, network simulator NS-2 is deployed. A multi-
hop WBAN topology is constructed consisting of a base station and fifty sensor nodes which
are divided into six clusters. Each cluster has an aggregate node that act as a cluster head
and few regular nodes. Other simulation parameters and network configurations are shown
in table 7.1.
Table 7.1: Simulation Parameters
Parameters Values
Sensing Field 50*50Simulation Time 1200 sPacket Size 1000 bytesRadio Communication Range 2m Standard,5m Special useNo. of Nodes 50BAN Coordinator Directional ModeSensor Nodes Omni directional ModeMAC Type IEEE 802.15.4
The attack paths are chosen randomly from different clusters and on each of the chosen path,
different number of are initiated and transmitted. As the packet travels along the path, each
intermediate node ni simulates and mark the packets according to the proposed marking
technique discussed in chapter 6. Finally, the victim node v simulates by applying proposed
attack path reconstruction algorithm in order to reconstructs all the attack paths and trace the
attacker. The number of attackers in simulation varies from 1 to 50.
The simulation run ten times for both FBT and proposed technique and an average of data
values obtained from experiments are taken as results. Further, the results of evaluation and
comparative analysis is discussed in section 7.1.2.
7.2 Evaluation and Comparative Analysis
Simulations are performed to evaluate the proposed traceback technique and generate results
for the chosen metrics including convergence time, Uncertainty and overhead on nodes.
105

7.2.1 Convergence time
Convergence time is measured a number of packets needed for a successful attack path
reconstruction [44]. It depends on the uniform residual probability ϕi. From Equation 6.2,
the most prominent aspect of the traceback convergence time for PPM (FBT) is given as:
ConvergenceT imeFBT τ(1− τ)N−1 > 1. Thus keeping τ and N fixed for FBT, we get:
ConvergenceT imeFBT >1
τ(1− τ)N−1(7.1)
As we learned from Equation 6.9 and Equation 6.11 that ϕi = 1/N , therefore for proposed
technique the traceback convergence time is given as:
ConvergenceT imeETT > N (7.2)
Figure 7.1 shows the number of packets required by proposed traceback technique and
FBT to reconstruct the attack path. For FBT, we assume the fixed marking probability of
0.08. The graph clearly indicate that the proposed packet marking technique has less con-
vergence time. For FBT, the convergence time is exponential to the length of attack path
which mean the convergence time increases with the increase in path length. Table 7.2
Figure 7.1: Number of packets required by proposed technique and FBT (τi = 0.08)
compares the numerical values of ConvergenceT imeFBT and ConvergenceT imeETT for
different number of node’s distance from the source. It is evident from the table that the pro-
posed ConvergenceT imeETT requires less amount of packets for attack path reconstruction
which means that it has less convergence time as compared to ConvergenceT imeFBT with
106

different marking probabilities.
Table 7.2: Convergence Time Comparison of FBT and proposed Technique
Nodes FBT(τi = .02)
FBT(τi = .04)
FBT(τi = .06)
FBT(τi = .08)
FBT(τi = .10)
FBT(τi = .20)
FBT(τi = .30)
FBT(τi = .35)
Proposed
10 59 38 29 27 24 36 79 129 1015 64 42 37 41 43 125 489 1209 1520 73 55 56 61 74 337 2835 10432 2025 83 66 75 93 125 1102 17386 87983 2530 89 85 99 141 302 3182 101625 765292 30
7.2.2 Uncertainty
For PPM, the maximum uncertainty is given as: (m = (1/τ) − 1) in [65] which shows
that PPM locate few possible attackers under spoofed marking attack. Figure 7.2 shows the
uncertainty values of PPM for different marking probabilities τi. As the value of τ increases,
the uncertainty factor decreases. Again, choosing a large value of τ is not a good solution.
As discussed in section 4.2, each node ni along the attack path has maintained a uniform
residual probability ϕi to mark each packet before it reaches a victim. Concluding this
shows that each packet has been marked legitimately and no packet has been left unmarked
(ϕi = 0) by any node which results in no uncertainty at all which means (m = 0) for
proposed technique. This indicated that proposed ETT allows to locate actual attacker
under DDoS attack.
Figure 7.2: Uncertainty values for PPM with Different Marking Probabilities
107

7.2.3 Overhead on Nodes
A key issue of WBAN is its resource scarcity. Therefore, any traceback technique should
ensure less overhead cost on individual WBAN nodes as well as on collective nodes. In
this section, we estimate and compare the individual overhead and total overheads on nodes
under FBT and proposed technique.
The proposed technique has to determine the traveling distance of each node from its
origin and therefore, it is expected that its overhead cost is more for marking packets as
compared to FBT that uses fixed marking probability. Despite that, this assumption is not
correct, because each node only inspects the packet and increment the distance field by one
for each incoming packet. Hence, the cost of proposed technique turns out to be very less
than FBT. For simplicity, first we calculate the overhead on individual nodes and then the
total overhead on all the nodes along the path has been computed. For FBT, a fixed marking
probability τi is assigned to every node for packet marking. If there are n number of packets
in a DDoS attack, the overhead on every individual node is calculated as:
OverheadFBT = nτi (7.3)
For proposed technique, every node chooses a marking probability of 1/d(ford =
1, 2, ..., N) to mark packets. In this case, the overhead on every node turns out to be:
OverheadETT =n
d(7.4)
Figure 7.3 gives the comparison of individual nodes overhead for both FBT and proposed
technique, where number of packets n = 10, 000, total number of nodes N = 15 and
marking probability for FBT is assume as τi = 0.3.
It is evident from the graph that under FBT, all nodes have same overhead. On the con-
trary, under ETT, only first two nodes undergo high overhead after that the overhead drops
rapidly as the path length increases. Similarly, the total overhead for FBT and proposed
ETT depends upon N which defines as the total number of nodes on the reconstruction path.
Recalling Equation 7.3 and Equation 7.4, the total overhead under FBT is calculated as:
TotalOverheadFBT = nτiN (7.5)
108

Figure 7.3: A Comparison of Overhead on Individual Nodes
Table 7.3: Total Overhead on Nodes
Nodes FBT(τi = .20)
FBT(τi = .30)
FBT(τi = .35)
Proposed
10 2 3 3.5 2.9315 3 4.5 5.25 3.3220 4 6 7 3.625 5 7.5 8.75 3.8230 6 9 10.5 4
For proposed ETT, total overhead is calculated by summing all N terms and is represented
as:
TotalOverheadETT = n
(1
1+
1
2+
1
3+ ...+
1
N
)= nHN (7.6)
Where HN is the N th harmonic number. Table 7.3 shows that the proposed scheme provides
better quantitative results as compared to FBT scheme. Under FBT three marking proba-
bilities i.e. 0.20, 0.30 and 0.35 are chosen for comparison. For small number of nodes, the
total overhead of FBT and proposed technique is almost equal but as the number of nodes
increases, the total overhead of FBT increases rapidly whereas the overhead of proposed
technique increases gradually.
7.3 Conclusion
In this chapter, the performance of proposed DDoS attack traceback technique is evaluated
and compared for the variation in results. The results acquired from simulation experiments
109

were analyzed and compared in terms of following performance metrics: convergence time,
overhead on individual nodes, total overheads on all nodes and uncertainty in marking pack-
ets.
Convergence time is analyzed for the variation in the number of packets needed for a
successful path reconstruction with respect to varying number of nodes in the network. Sub-
sequently, the simulation experiments are carried out to evaluate and compare the uncertainty
and overhead of proposed technique with existing FBT technique which uses fixed marking
probability in marking packets. The convergence time shows that the proposed technique
requires less number of packets for path reconstruction as compared to FBT. However, for
proposed technique the increase in the number of nodes give slightly rise to convergence
time which is acceptable. Whereas, under FBT, the convergence time is exponential to the
length of attack path.
The overhead on nodes is compared for varying number of packets with respect to number
of nodes in the network. In the case of individual node overhead, FBT has same overhead on
all the nodes whereas the overhead of proposed technique drops rapidly as the path length
increase. Similarly the total overhead of proposed technique is very less as compared to FBT.
Finally, the uncertainty of proposed technique is zero, which means proposed ETT allows to
locate actual attacker under DDoS attack.
110

Chapter 8
CONCLUSION AND FUTURE DIRECTIONS
8.1 Summary
Distributed denial of service (DDoS) attack does intends to disturbs or meddle with the
genuine sensor information, rather they exploit the difference present between the network
bandwidth and limited resource availability of the victim. Detecting and preventing against
such attacks in cloud- assisted WBAN is an imperative concern. Attacks can be evaded by
first detecting an attack took after by attack prevention and mitigation. Attack detection
is a beginning stride of any protection approach that should be taken prior to any defense
approach. Likewise, attack prevention action additionally plays a vital part in shielding a
network from noxious attacks.
This thesis is mainly focused on the DDoS attack detection and prevention algorithms and
propose a novel solution that not only consumes less resources but also produces accurate
results. The limited resources of WBAN are not enough to mitigate the huge amount of
traffic generated by DDoS attack. Therefore, there is a need for an approach that is light
weight and capable of handling real-time high speed sensor data for the detection of such
attacks in cloud- assisted WBAN environment. The concern of detecting and preventing the
DDoS attack in cloud- assisted WBAN remains unresolved, all the solutions proposed for
such attacks in conventional networks are not directly applicable in cloud-assisted WBAN
environment due to the resource scarceness of these networks. The multiple entry points into
these wireless sensor networks leave them more vulnerable to such attacks which makes the
attack detection and prevention process more complicated.
The aim of this research thesis is to design a light- weight distributed and scalable ap-
proach for detecting DDoS attack that is capable of handling high speed streaming data
generated by WBAN sensors in cloud- assisted WBAN environment. The goal is to propose
the attack detection technique with improved performance when compared with exiting tech-
niques in terms of: i) improved attack detection accuracy; ii) minimizing overall resource
111

usage and iii) reducing overall computational cost. Analyzing and comparing the existing
techniques for detecting attacks in both conventional and wireless sensor networks concludes
that the data mining techniques have proved to be the most promising solution for identify-
ing the malicious behavior of nodes in these networks through pattern discovery. Therefore,
this research selects and explore the data mining technique that is light-weight and further
optimizes it for handling high-speed streaming data originating from WBAN sensors.
Another objective of this thesis is to propose an efficient traceback technique specifically
for cloud- assisted WBAN environment that incur minimal overhead on the network. The
goal is to propose a technique that is efficient in packet marking and path reconstruction pro-
cedures in order to traceback and identify the source of DDoS attack with less convergence
time. Different traceback techniques have been analyzed and their comparison drawn to the
conclusion that Probability Packet Marking (PPM) is the most appropriate and widely used
approach in both conventional and wireless sensor networks. The key issue of PPM lies in
assigning the marking probability for path reconstruction. Therefore, we model the trace-
back of DDoS attack as a marking probability assignment problem and further optimized
it for efficient traceback of DDoS in cloud- assisted WBAN environment. The purpose of
selecting PPM technique is to reduce the overhead on sensor nodes.
In chapter 3, first we propose a cloud- assisted WBAN architecture and discusses its mod-
ules in detail. Secondly, based on the proposed architecture, a framework is presented for
the detection and prevention of DDoS attack in cloud- assisted WBAN environment. Based
on the framework, (1) a distributed attack detection technique is proposed in Chapter 4 that
efficiently detects DDoS attack in wireless sensor networks and (2) a traceback technique is
proposed in Chapter 6 that efficiently identify the source of an attack and block an attacker.
In Chapter 4, a victim- based DDoS attack detection algorithm is presented. This algo-
rithm is an improvement of Very Fast Decision Tree namely Enhanced Very Fast Decision
Tree, which differs from the existing algorithms in terms of classification accuracy, false
alarm rate, sensitivity and specificity, computational cost, tree size, memory and time. Our
proposed classification algorithm is capable of handling noisy data and detects a DDoS at-
tack efficiently with high accuracy and low false alarm rate while allowing a legitimate
requesters to access the resources. The proposed algorithm is deployed at the victim node.
In Chapter 5, the performance of proposed DDoS attack detection scheme is analyzed
112

and compared with respect to varying noise percentage and number of instances. Both
simulation-based experiments and hardware- based experiments are performed for analy-
sis. The simulation results obtained for evaluation and comparisons are quantified using
the metrics including: attack detection accuracy, tree size, computational cost, resource us-
age, false alarm rate and sensitivity vs specificity. Each of the selected performance metric
is evaluated separately on both synthetic datasets and real-time WBAN dataset. Finally, a
comparative analysis is done based on the simulation results obtained from the proposed
technique with the corresponding simulation results acquired from existing techniques.
The overall analysis shows that the attack detection accuracy increases with the increase
in number of instances, whereas it significantly decreases with the increase in noise per-
centage. Further, simulation experiments are performed to assess the false positive rate and
false negative rate. The results shows the significant increase in FPR and FNR for increase
in noise percentage whereas for number of instances, the rate of false positives and false
negatives decreases. Subsequent results are obtained for sensitivity and specificity, i.e. the
increase in noise percentage decreases the sensitivity and specificity. The sensitivity and
specificity of any system directly exhibit its accuracy. The high sensitivity and specificity of
proposed system depicts that it is more accurate in detecting attacks as compared to existing
techniques. The computational cost is calculated only for real-time generated data in order to
measure the cost of computation on sensor nodes. It is evident from simulation results that
the computational cost of proposed algorithm is less as compared to existing algorithms.
Likewise, the resource usage of proposed technique is superior to other techniques. The
computational time of proposed technique is slightly greater than VFDT-t because of prun-
ing and tie- breaking threshold computation. VFDT-t do not perform pruning at all, therefore
it takes less computation time.
At the end, a qualitative comparison is performed to show the superiority of proposed
attack detection algorithm. The qualitative analysis shows that only OVFDT and EVFDT
can handle noisy data. VFDT-t, CVFDT and IVFDT does not provide tree pruning at all.
In Chapter 6, a novel traceback technique is proposed that efficiently traceback the source
of DDoS attack in cloud- assisted WBAN. The proposed technique assigns the dynamic
marking probability to each node based on the number of hops the packet travelled once it
originates from the source. The number of hops can be calculated as the distance travelled
113

by the packets from the source. Finally, a path reconstruction algorithm is proposed to
traceback the attacker. Results and comparison shows that the proposed technique has less
convergence time as compared to fixed PPM. Similarly, the proposed technique results in
less computational overhead on nodes as compared to other available schemes.
The performance of proposed traceback technique is evaluated through simulation and ex-
periments and discussed in Chapter 7. The performance of proposed scheme is affected by
few network parameters. The variation in these parameters are used to quantify the results,
based on simulation experiments. The network Simulator NS-2 was used to compared and
analyze the performance metrics including: convergence time, overhead and uncertainty.
The acquired simulation results are compared with corresponding results obtained from the
simulation of fishbone traceback technique for both multi- hop and single- hop sensor net-
works. The results shows that the proposed technique is superior than Fish Bone Traceback
that used fixed marking probability.
Convergence time is analyzed for the variation in the number of packets needed for a suc-
cessful path reconstruction with respect to varying number of nodes in the network. Results
shows that the proposed technique requires less number of packets for path reconstruction
as compared to FBT. However, for proposed technique the increase in the number of nodes
give slightly rise to convergence time which is acceptable. Whereas, under FBT, the con-
vergence time is exponential to the length of attack path. Further, the overhead on nodes is
compared for varying number of packets with respect to number of nodes in the network.
In the case of individual node overhead, FBT has same overhead on all the nodes whereas,
the overhead of proposed technique drops rapidly as the path length increase. Similarly, the
total overhead of proposed technique is very less as compared to FBT. The uncertainty of
proposed technique is zero, which means proposed Efficient Traceback Technique allows to
locate actual attacker under DDoS attack.
8.2 Future Work
The propose architecture given in figure 3.4 shows the complete cloud- assisted WBAN ar-
chitecture that efficiently sense data from WBAN sensors and transfers it to cloud service
provider for permanent storage via an insecure internet. The communication channel be-
tween the base station and the cloud service provider is secured using the SSL/TLS security
114

protocol in order to provide data confidentiality and integrity.
But the main focus of this thesis is the DDoS attack detection and traceback within the
WBAN domain i.e. the transfer of data from sensor nodes to aggregate node and from mul-
tiple aggregate nodes to the base station. In DDoS attack detection, aggregate node and the
base station are the victims of DDOS attack that can be overwhelmed or flooded with at-
tack traffic in order to consume the network bandwidth or deplete their resources. Similarly,
the victim under DDoS attack either the base station or the aggregate node reconstructs the
attack path and identify an attacker for further blocking. The major aim is to propose a
lightweight, in- network and distributed approach for DDoS attack detection and traceback
that fulfills the requirements of resource constrained WBAN domain and efficiently transfers
the data to cloud for further processing. In future, this work can be extended to cloud do-
main by following the proposed architecture (Figure 3.4) to detect a DDoS attack and further
traceback the source of attack. A private cloud is deployed and the proposed DDoS attack
detection and traceback techniques will be applied on attack detection node to prevent the
cloud service provider and cloud storage server from such attacks. In addition, the proposed
techniques can be further enhanced to achieve better results and for deployment in public
cloud.
Another future work involves the deployment of proposed attack detection technique for
intrusion detection including: slow and fast scans, SYN floods, smurf attack, traffic regula-
tion conditions and other attacks.
115

REFERENCES
[1] R. Latif, H. Abbas, and S. Assar, ”Distributed denial of service(DDoS) attack incloud- assisted wireless body area networks: a systematic literature review,” Journalof Medical Systems, vol. 38, no. 128, 2014.
[2] E. AbuKhousa, H. A. Najati, ”UAE-IHC: Steps towards Integrated EHealth Environ-ment” Proceedings of the 4th e-Health and Environment Conference, February 2012.
[3] A. Waqar, A. Raza, H. Abbas, and M. K. Khurram, ”A framework for preservationof cloud users data privacy using dynamic reconstruction of metadata,” Journal ofNetwork and Computer Applications, vol. 36, no. 1, pp. 235- 248, January 2013.
[4] R. Latif, H. Abbas, S. Assar, and Q. Ali, ”Cloud Computing Risk Assessment: A Sys-tematic Literature Review,” Book Chapter: Future Information Technology, SpringerLecture Notes in Electrical Engineering vol:276, pp:285-295, 2013.
[5] A. A. Moshaddique, L. Jingwei, and K. Kyungsup, ”Security and Privacy Issues inWireless Sensor Networks for Healthcare Applications,” Journal of Medical Systems,vol. 36, no, 1, pp. 93 101, 2012.
[6] D. Ashraf, and H. Aboul Ella, ”Wearable and Implantable Wireless Sensor NetworkSolutions for Healthcare Monitoring”, Journal of Sensors (Basel), vol. 12, no. 9,September 2012.
[7] S. Shahnaz, Sana Ullah, and K. S. Kwak, ”A Study of IEEE 802.15.4 Security Frame-work for Wireless Body Area Networks”, Journal of Sensor (Basel), vol. 11, no. 2,Jan 2011.
[8] N. D. Han, L. Han, D. M. Tuan, H. Peter, and M. Jo, ”A scheme for data confi-dentiality in Cloud-assisted Wireless Body Area Networks,” Journal of InformationSciences, vol. 284, pp. 157-166, 2014.
[9] K. Zhang, X. Liang, M. Baura, R. Lu, and X. S. Shen, ”PHDA: A priority based healthdata aggregation with privacy preservation for cloud assisted WBANs,” Journal ofInformation Sciences, vol. 284, pp. 130-141, 2014.
[10] T. Hayajneh, A. V. Vasilakos, G. Almashaqbeh, B. J. Mohd, M. A. Imran, M. Z.Shakir, and K. A. Qaraqe, ”Public-key authentication for cloud-based WBANs,” Bo-dyNets ’14 Proceedings of the 9th International Conference on Body Area Networks,pp. 286- 292, 2014.
[11] S. T. Zargar, J. Joshi, and D. Tipper, ”A survey of defense mechanisms against dis-tributed denial of service (DDOS) flooding attacks,” IEEE Communications Surveysand Tutorials, vol. 15, no. 4, pp. 20462069, 2013.
[12] Z. A. Baig, M. Baqer, and A. I. Khan, ”A Pattern Recognition Scheme for DistributedDenial of Service (DDoS) Attacks in Wireless Sensor Networks,” Proceedings of theIEEE International Conference on Pattern Recognition (ICPR’06), 2006.
116

[13] A. Mittal, A. K. Shrivastava, and M. Manoria, ”A Review of DDOS Attack and itsCountermeasures in TCP Based Networks,” International Journal of Computer Sci-ence and Engineering Survey (IJCSES), vol.2, no.4, November 2011.
[14] R. Latif, H. Abbas, S. Assar, and S. Latif, ”Analyzing feasibility for deploying veryfast decision tree For DDoS attack detection in cloud-assisted WBAN,” IntelligentComputing Theory: Proceedings of the 10th International Conference, ICIC 2014,pp. 507519, August 3-6, 2014.
[15] J. Xu, X. Zhou, and F. Yang, ”Traceback in wireless sensor networks with packetmarking and logging,” Journal Frontiers of Computer Science in China archive, vol.5, no. 3, pp. 308- 315, 2011
[16] M. T. Goodrich, ”Probabilistic packet marking for large-scale IP traceback,” Journalof IEEE ACM Transactions on Networking (TON), vol. 16, no. 1, pp. 15- 24, 2008
[17] R. Latif, H. Abbas, and S. Latif, ”Distributed Denial of Service (DDoS) attack detec-tion using data mining approach in cloud- Assisted Wireless Body Area Networks,”International Journal of Ad Hoc and Ubiquitous Computing (IJAHUC), 2015 (InPress).
[18] S. Irum, A. Ali, F. K. Aslam, and H. Abbas, ”A Hybrid Security Mechanism forintra-WBAN and inter-WBAN Communication,” International Journal of DistributedSensor Networks, vol. 2013, Article ID 842608, 11 pages, 2013.
[19] A. Ali, and F. K. Aslam, ”A Broadcast-Based Key Agreement Scheme using SetReconciliation for Wireless Body Area Networks,” Journal of Medical Systems(Springer), vol. 38, no. 5, May 2014.
[20] R. Latif, H. Abbas, and S. Assar, ”Cloud Computing Risk Assessment: A SystematicLiterature Review,” Future Information Technology, Future Tech vol. 276, pp, 285295, 2013.
[21] W. Jiafu, Z. Caifeng, S. Ullah, L. Chin-Feng, Z. Ming, and W. Xiaofei, ”IoT SensingFramework with Inter-cloud Computing Capability in Vehicular Networking,” Jour-nal of IEEE Network, vol. 27, pp. 5661, 2013.
[22] I. Foster, Y. Zhao, L. Raicu, S. Lu, ”Cloud Computing and Grid Computing 360-Degree Compared,” Proceedings of the Grid Computing Environments Workshop(GCE), pp. 1-10, November 2008.
[23] T. B. Manohar, E. V. N. Jyothi, and B. Rajani, ”Traceback of DDoS Attacks Basedon Decision Trees Model Using Intrusion Detection System,” International Journalof Computer Science and Management Research, vol. 1, no. 4, 2012.
[24] A. Patcha, and J. Park, ”An overview of anomaly detection techniques: Existing so-lutions and latest technological trends,” The International Journal of Computer andTelecommunications Networking, vol. 51, no. 12, 2007.
[25] N. Jain, Sharma, and Shikha, ”The Role of Decision Tree Techniques for Automat-ing Intrusion Detection System,” International Journal of Computational EngineeringResearch, vol. 2, no. 4, 2012.
117

[26] A. Mahmood, Ke Shi, and K. Shaheen, ”Data Mining Techniques for Wireless SensorNetworks: A Survey,” International Journal of Distributed Sensor Networks, vol.2013.
[27] M. K. Sarat, and G. H. Christopher, ”Summarization Techniques for Visualization ofLarge Multidimensional Datasets,” Technical Report.
[28] E. Y. Moawia, and M. El-mukashfi, ”A New Approach for Evaluation of Data MiningTechniques,” IJCSI International Journal of Computer Science Issues, vol. 7, no. 5,2010.
[29] T. Subbulakshmi, S. M. Shalinie, V. Ganapathisubramanian, K. Balakrishnan, D.Anandkumar, and K. Kannathal, ”Detection of DDoS attacks using enhanced supportvector machines with real time generated dataset,” Proceedings of the 3rd Interna-tional Conference on Advanced Computing (ICoAC 11), pp. 1722, IEEE, Chennai,India, December 2011.
[30] Y. C. Wu, H. R. Tseng, W. Yang, and R. H. Jan, ”DDoS detection and tracebackwith decision tree and grey relational analysis,” International Journal of Ad Hoc andUbiquitous Computing, vol. 7, no. 2, pp. 121136, 2011.
[31] S. M. Lee, D. S. Kim, J. H. Lee, and J. S. Park, ”Detection of DDoS attacks usingoptimized traffic matrix,” Computers and Mathematics with Applications, vol. 63, no.2, pp. 501510, 2012.
[32] R. K. Arun and S. Selvakumar, ”Detection of distributed denial of service attacksusing an ensemble of adaptive and hybrid neuro-fuzzy systems,” Computer Commu-nications, vol. 36, no.3, pp. 303319, 2013.
[33] T.Thwe and P. Thandar, ”Statistical anomaly detection of DDoS attacks using K-nearest neighbor,” International Journal of Computer and Communication Engineer-ing Research, vol. 2, no.1, pp. 315319, 2014.
[34] G. Hulten, P. Domingos, and L. Spencer, ”Mining Massive Data Streams”, Journal ofMachine Learning, vol. 6, no.4, pp. 1431- 1452, 2005.
[35] H. Yang and S. Fong, ”Moderated VFDT in stream mining using adaptive tie thresholdand incremental pruning,” Proceedings of the 13th International Conference on DataWarehousing and Knowledge Discovery (DaWaK 11), pp. 471483, August 2011.
[36] G. Hulten, L. Spencer, and P. Domingos, ”Mining time changing data streams,” Pro-ceedings of the 7th ACMSIGKDD International Conference on Knowledge Discoveryand Data Mining (KDD 01), pp. 97106, August 2001.
[37] A. Fawzy, H. M.O.Mokhtar, andO.Hegazy, ”Outliers detection and classification inwireless sensor networks,” Egyptian Informatics Journal, vol. 14, no. 2, pp. 157164,2013.
[38] S. M. Bellovin, ”ICMP Traceback Messages- Internet Engineering Task Force,” In-ternet Draft: draft-ietf-itrace-04.txt, August 2003.
[39] A. C. Snoeren, C. Partridge, L. A. Sanchez, and C. E. Jones, ”Hash-Based IP Trace-back,” Proceeding of the ACM, SIGCOMM, pp. 314, August 2001.
118

[40] S. Savage, D. Wetherall, A. Karlin, and T. Anderson, ”Practical network support forIP traceback,” Proceeding of the ACM SIGCOMM, pp. 295306, October 2000.
[41] B. Andrey, and A. Nirwan, ”IP Traceback With Deterministic Packet Marking,” IEEECOMMUNICATIONS LETTERS, vol. 7, no. 4, APRIL 2003.
[42] X. Jin, Y. Zhang, Y. Pan, and Y. Zhou, ”ZSBT: A Novel Algorithm for tracing DoSAttacker in MANETs,” EURASIP Journal of Wireless Communications and Network-ing, 2006:9, 2006.
[43] D. Sy, and L. Bao, ”CAPTRA: coordinated packet traceback,” Proceedings of the 5thInternational Conference on Information Processing in Sensor Networks (IPSN), pp.152-159, April 2006.
[44] C. Bo-Chao, C. Huan, and L. Guo-Tan, ”FBT: an efficient traceback scheme in hier-archical wireless sensor network,” Journal of Security and Communication Networks,vol. 2, no. 2, pp. 133-144, 2009.
[45] V. L. L. Thing, H. C. J. Lee, M. Sloman, and J. Zhou, ”Enhanced ICMP tracebackwith cumulative path,” Proceedings of 61st IEEE Vehicular Technology Conference,VTC 2005, vol. 4, pp. 2415 - 2419, June 2005.
[46] J. Liu, Z. Lee, and Y. Chung, ”Dynamic probabilistic packet marking for efficientIP traceback,” Computer Networks: The International Journal of Computer andTelecommunications Networking, vol. 51, no. 3, pp. 866- 882, Feb 2007.
[47] A. Mahmood, K. Shi, S. Khatoon, and M. Xiao, ”Data Mining Techniques for Wire-less Sensor Networks: A Survey,” International Journal of Distributed Sensor Net-works, vol. 2013, Article ID 406316, 24 pages, 2013. doi:10.1155/2013/406316.
[48] A. Z. Baig, and A. I. Khan, ”DDoS Attack Modelling and Detection in Wireless Sen-sor Networks,” In book: Mobile Intelligence: Mobile Computing and ComputationalIntelligence, John Wiley and Sons, pp.595-626, 2010.
[49] E. Petana, and S. Kumar, ”EKG monitoring over Wireless Sensor Networks and DDoSvulnerabilities: Remote EKG monitoring over wireless sensor networks and Impactof Internet Distributed Denial of Service (DDoS) Attacks,” Paperback, 2011.
[50] R. Roman, and J. Lopez, ”Integrating Wireless Sensor Networks and the Internet: aSecurity Analysis,” Internet Research, vol. 19, no. 2, pp.246-259, 2009.
[51] S. Misra, and A. Vaish, ”Reputation- based Role Assignment for Role- based AccessControl in Wireless Sensor Networks,” Journal of Computer Communications, vol.34, no. 3, pp.281-294, 2011.
[52] R. K. Arun and S. Selvakumar, ”Distributed denial of service attack detection using anensemble of neural classifier,” Computer Communications, vol. 34, no. 11, pp. 13281341, 2011.
[53] P. Domingos and G. Hulten, ”Mining high-speed data streams,” Proceedings of the 6thACM SIGKDD International Conference on Knowledge Discovery and Data Mining,pp. 7180, August 2000.
119

[54] H. Yang, S. Fong, G. Sun, and R. Wong, ”A Very Fast Decision Tree Algorithm forReal-Time Data Mining of Imperfect Data Streams in a Distributed Wireless SensorNetwork,” International Journal of Distributed Sensor Networks, vol. 2012, ArticleID 863545, 16 pages, 2012. doi:10.1155/2012/863545.
[55] J. Mirkovic, P. Reiher, S. Fahmy, R. Thomas, A. Hussain, S. Schwab, and C. Ko,”Measuring denial Of service,” Conference on Computer and Communications Se-curity. Proceedings of the 2nd ACM workshop on Quality of protection, pp. 53-58,2006.
[56] A. Bhandari1, A. L. Sangal, and K. Kumar, ”Performance Metrics for Defense Frame-work against Distributed Denial of Service Attacks,” International Journal of NetworkSecurity, vol.6, pp. 38- 47, April 2014.
[57] D. Arora, P. Singh, and V. Singh, ”Impact analysis of denial of service (DoS) dueto packet flooding,” International Journal of Engineering Research and Applications,vol. 4, no. 6, pp. 144149, 2014.
[58] N. Gu, Y. Jiang, J. Zhang, H. Zheng, ”An Implementation of WBAN Module Basedon NS-2,” Proceedings of the 2013 International Conference on Computer Sciencesand Applications (CSA), pp. 114- 118, December 2013.
[59] J. A. Pamplin, ”NS2 Leach Implementation”,http://read.pudn.com/downloads87/ebook/334495/ns2leach.pdf.
[60] L. Hughes, X. Wang, and T. Chen, ”A review of protocol implementations and energyefficient cross-layer design for wireless body area networks,” Sensors Journal, vol.12, no. 11, pp. 14730 14773, 2012.
[61] VFML (Very Fast Machine Learning) toolkit, 2014,http://www.cs.washington.edu/dm/vfml/.
[62] E-Health Sensor Platform V2.0 for Arduino and Raspberry Pi (Biometric / Med-ical Applications). https://www.cooking-hacks.com/documentation/tutorials/ehealth-biometric-sensor-platform-arduino-raspberry-pi-medical
[63] H. Geoffrey, K. Richard, P. Bernhard, ”Tie Breaking in Hoeffding trees,” In: Gama, J.,Aguilar-Ruiz, J.S. (eds) Proceedings Workshop W6: Second International Workshopon Knowledge Discovery in Data Streams, pp. 107-116 (2005)
[64] R. Latif, H. Abbas, and S. Assar, ”Distributed denial of service (DDoS) attack incloud-assisted wireless body area networks: a systematic literature review,” Journalof Medical Systems (Springer), vol. 38, no.128, pp. 1-10, 2014.
[65] K. Park, and H. Lee, ”On the Effectiveness of Probabilistic Packet Marking for IPTraceback Under Denial of Service Attack.” Proceedings of 2001 IEEE INFOCOMConference, June 2001.
120