Embed Size (px)
Citation preview
Distributed Generation (Solar PV)
Date: 1st March, 2015 Vishal PANDYA
The Energy Solutions Company
2
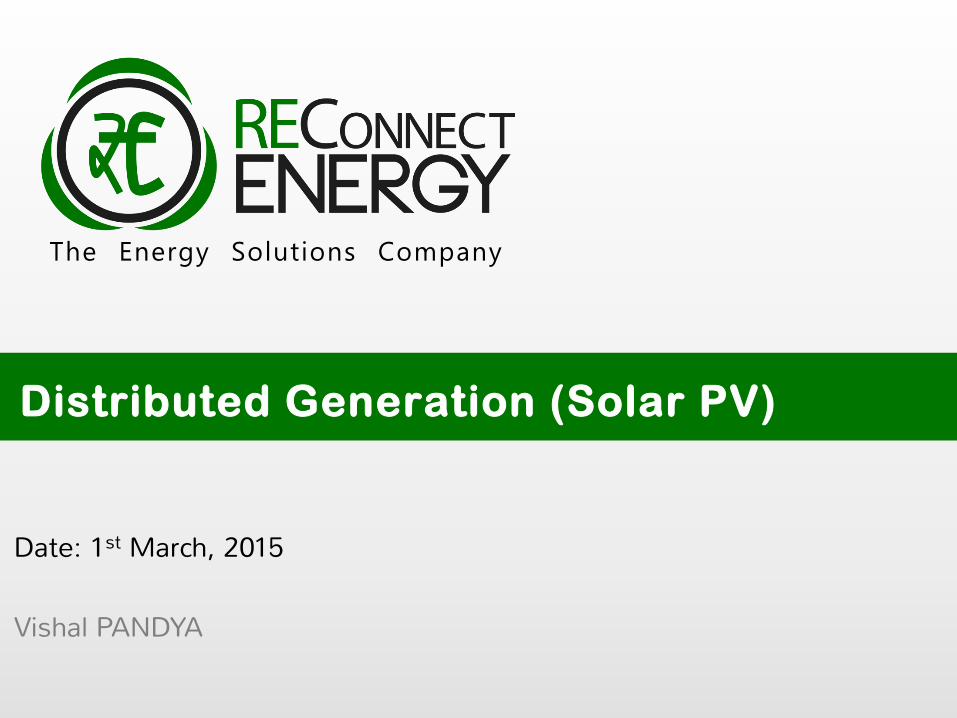
The Journey so far (each FY)
2011
2012
2013
2014
2015
• Got Incorporated • First Co. to trade REC in India
• India’s Largest REC Trading Co • 27.9% Market share in Non Solar-REC
• 42% Market share in Non Solar -REC • 90% Market share in Solar-REC
• 39% Market share in REC (collective) • Started Wind Power Forecasting & Scheduling (WFS) • Created portfolio of about 600MW under WFS
• 37.8% Market share in REC (collective) • First Indian Co to offer in-house forecasting models • Portfolio of about 1100MW under Wind Forecasting • Launched India’s First Green Energy Marketplace – clickpower.in
2016 • 42% Market share in REC – 2,200 MW Portfolio • Largest Wind/Solar Power Forecasting Co in India (7,000 MW portfolio) • Institutional status to CLICKPOWER.IN – progressing well
FY
3
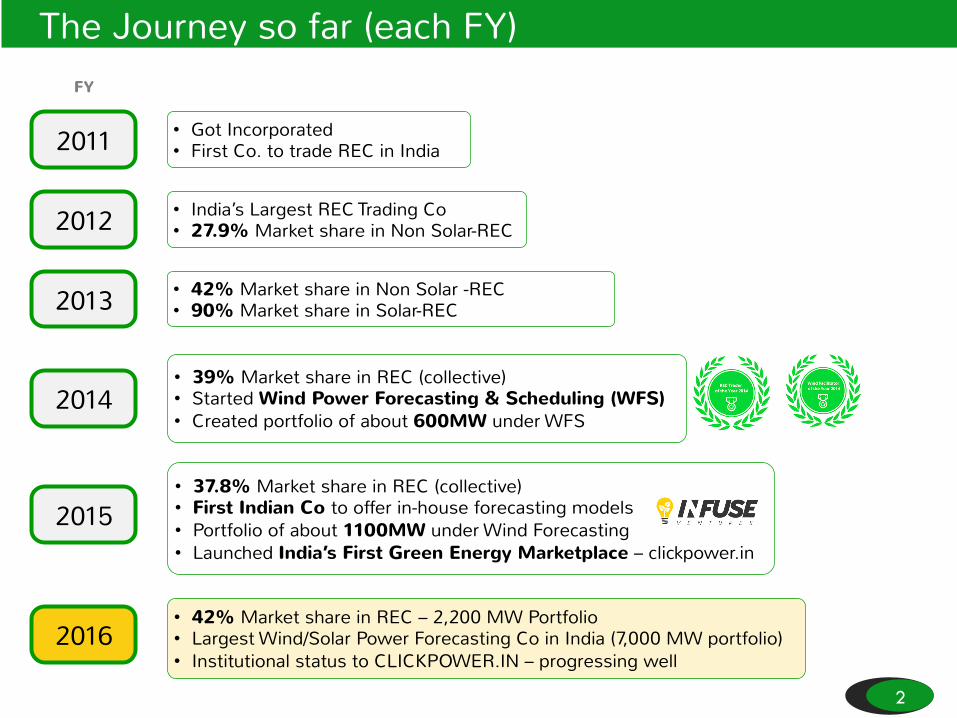
Why Distributed Generation? • Social
§ Opportunity for consumer participation and investment
§ Higher employment generation and entrepreneurship options
• Technical § Low distribution losses § Last-mile support to grid stability, w.r.t.
voltage & reactive power support § Creates case for smart grids
• Administrative § Widely accepted, Saves space § Lowest time to commission à technical
and administrative § Lower investment in distribution
infrastructure (for lower penetrations) § Can improve distribution grid capacity
4
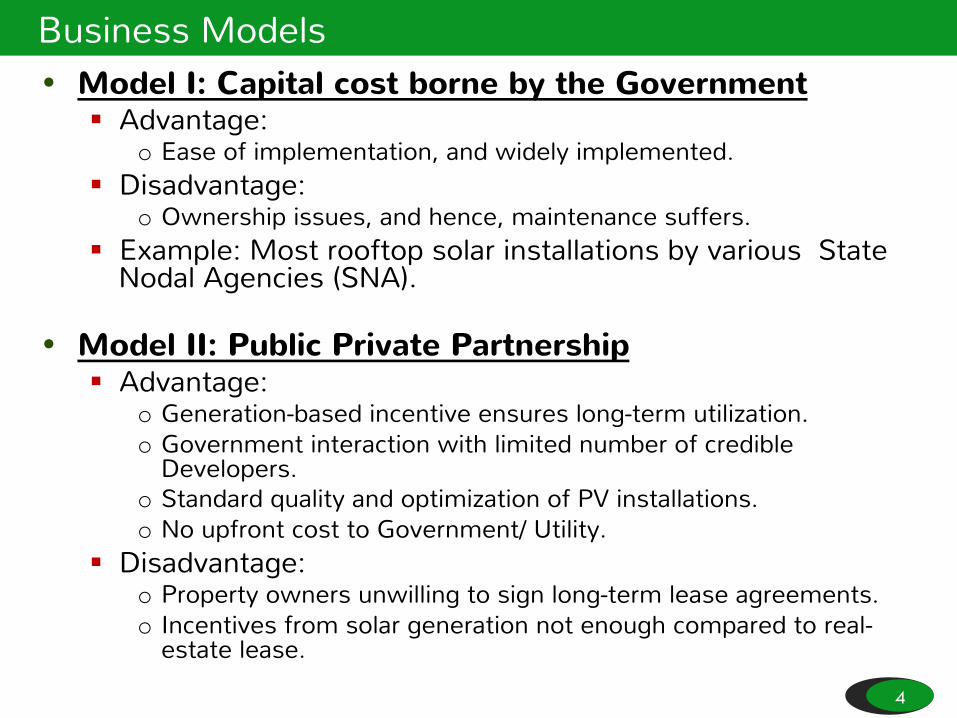
Business Models • Model I: Capital cost borne by the Government
§ Advantage: o Ease of implementation, and widely implemented.
§ Disadvantage: o Ownership issues, and hence, maintenance suffers.
§ Example: Most rooftop solar installations by various State Nodal Agencies (SNA).
• Model II: Public Private Partnership § Advantage:
o Generation-based incentive ensures long-term utilization. o Government interaction with limited number of credible
Developers. o Standard quality and optimization of PV installations. o No upfront cost to Government/ Utility.
§ Disadvantage: o Property owners unwilling to sign long-term lease agreements. o Incentives from solar generation not enough compared to real-
estate lease.
5
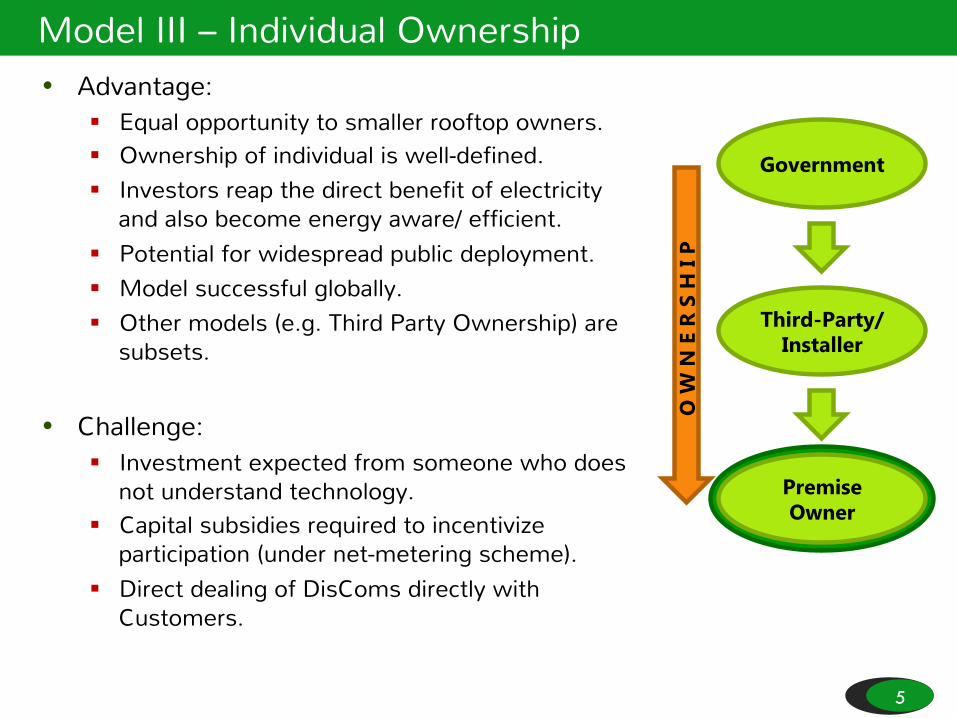
Model III – Individual Ownership • Advantage:
§ Equal opportunity to smaller rooftop owners. § Ownership of individual is well-defined. § Investors reap the direct benefit of electricity
and also become energy aware/ efficient. § Potential for widespread public deployment. § Model successful globally. § Other models (e.g. Third Party Ownership) are
subsets.
• Challenge: § Investment expected from someone who does
not understand technology. § Capital subsidies required to incentivize
participation (under net-metering scheme). § Direct dealing of DisComs directly with
Customers.
Government
Third-Party/ Installer
Premise Owner
O W
N E
R S
H I
P

6
The Present Status (as on Nov 2014) ROOFTOP INSTALLATIONS IN INDIA (NOV. 2014)
6 Courtesy: Bridge to India, “India Solar Rooftop Map 2015”
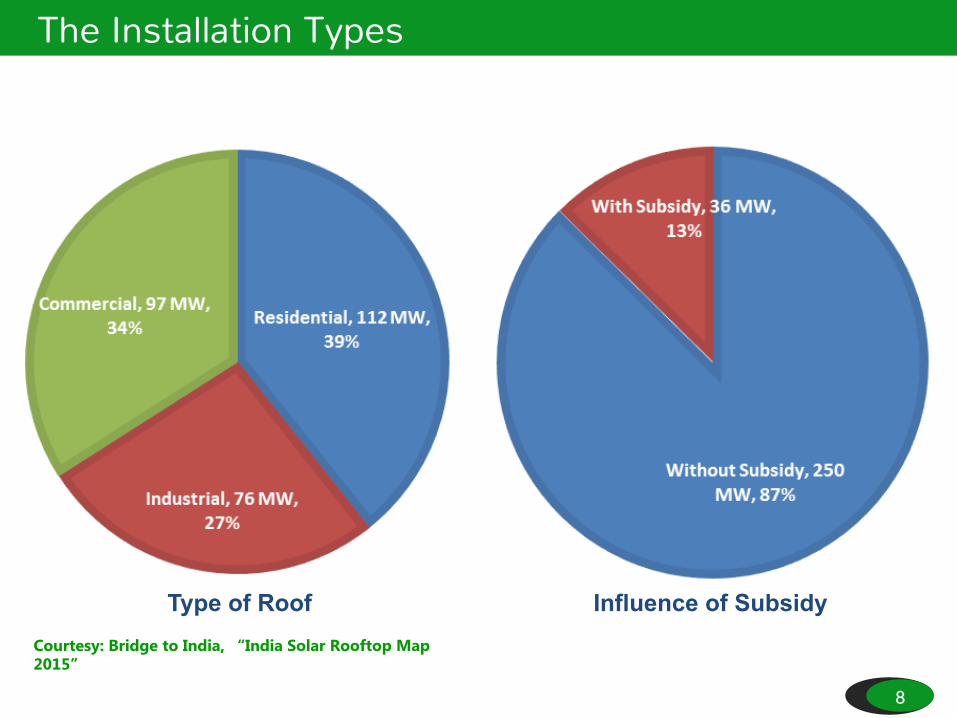
Net Installed Capacity: 285 MW
Residential
Industrial
Commercial
7
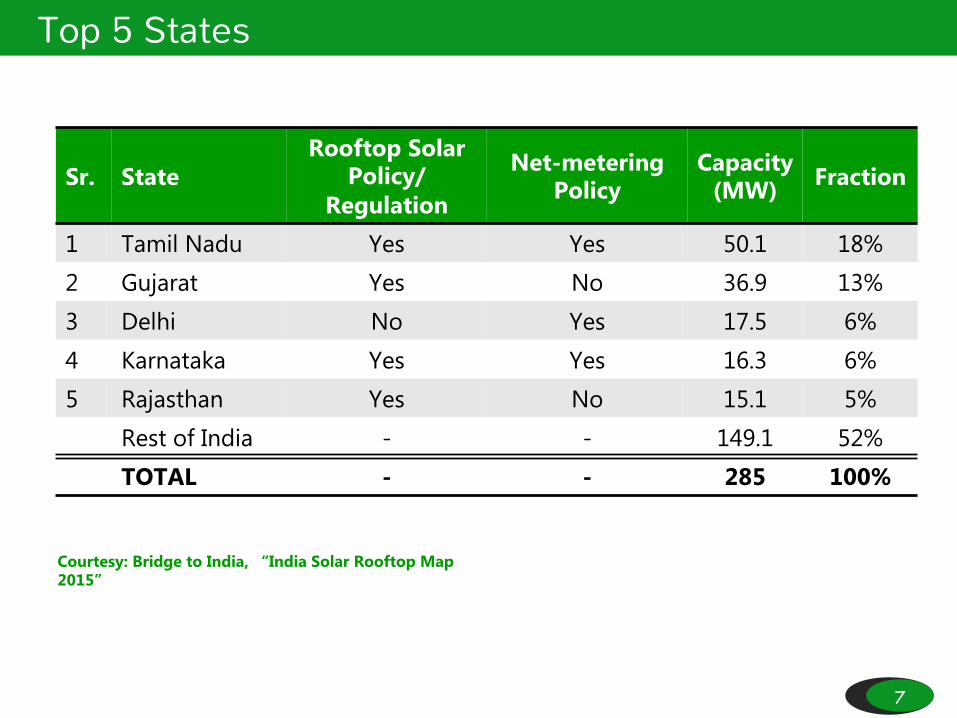
Top 5 States
Sr. State Rooftop Solar
Policy/ Regulation
Net-metering Policy
Capacity (MW) Fraction
1 Tamil Nadu Yes Yes 50.1 18%
2 Gujarat Yes No 36.9 13%
3 Delhi No Yes 17.5 6%
4 Karnataka Yes Yes 16.3 6%
5 Rajasthan Yes No 15.1 5%
Rest of India - - 149.1 52%
TOTAL - - 285 100%
Courtesy: Bridge to India, “India Solar Rooftop Map 2015”
8
The Installation Types
Type of Roof Influence of Subsidy Courtesy: Bridge to India, “India Solar Rooftop Map 2015”
9
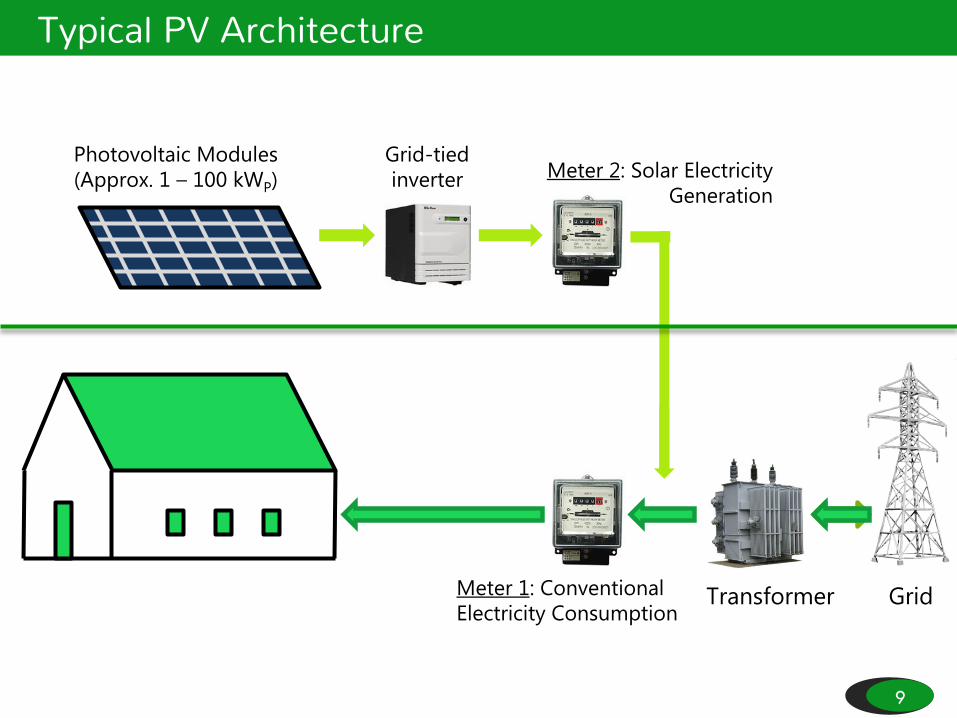
Typical PV Architecture
Photovoltaic Modules (Approx. 1 – 100 kWP)
Grid-tied inverter Meter 2: Solar Electricity
Generation
Meter 1: Conventional Electricity Consumption
Transformer Grid
10
Key Challanges • How appealing is the Green Incentive?
§ What is the value of my roof?
• How appealing is the Third-Party Model? § Am I willing to sign a 25-year lease agreement? § Why can’t I invest and get all returns for myself?
• Interdependency of Contracts and Financial Closure: § Lease Agreement à PIA à PPA.
• Implementation: § Coordination between Statutory Bodies, Regulator, Chief
Electrical Inspector, DisCom, Building Owners/ Govt. Departments, Developer, Financer, Project Management, Social.
11
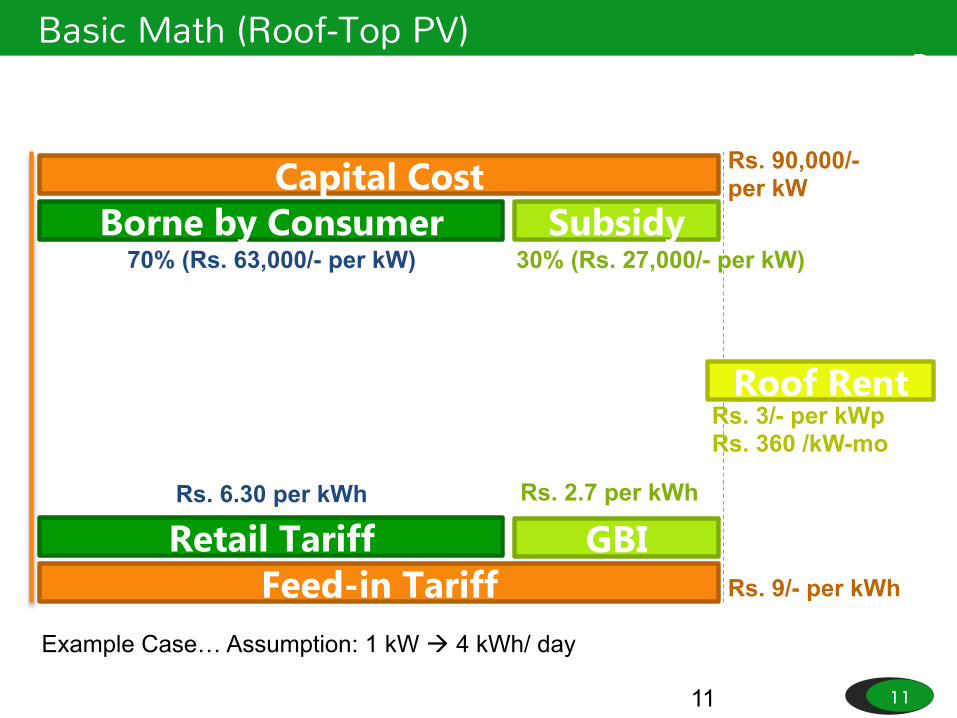
Basic Math (Roof-Top PV) BUILDING BLOCKS OF A BUSINESS MODEL
11
Capital Cost
Feed-in Tariff
Rs. 90,000/- per kW
Subsidy
Rs. 9/- per kWh
Borne by Consumer
Example Case… Assumption: 1 kW à 4 kWh/ day
70% (Rs. 63,000/- per kW) 30% (Rs. 27,000/- per kW)
Retail Tariff Rs. 6.30 per kWh
Roof Rent Rs. 3/- per kWp Rs. 360 /kW-mo
GBI Rs. 2.7 per kWh
12
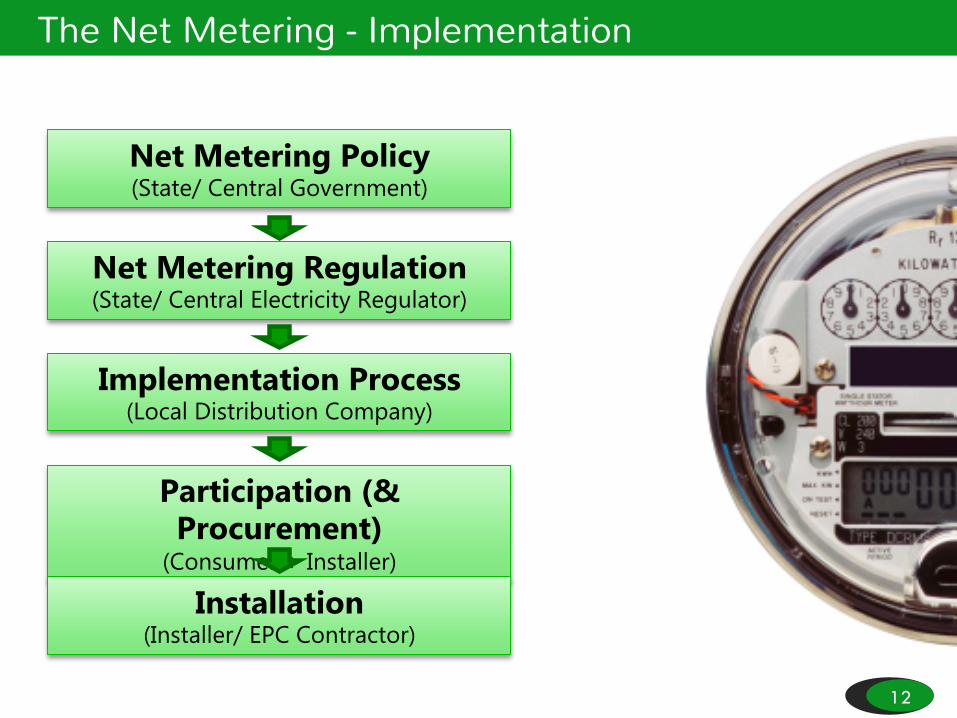
The Net Metering - Implementation
Net Metering Policy (State/ Central Government)
Net Metering Regulation (State/ Central Electricity Regulator)
Implementation Process (Local Distribution Company)
Participation (& Procurement)
(Consumer + Installer)
Installation (Installer/ EPC Contractor)
13
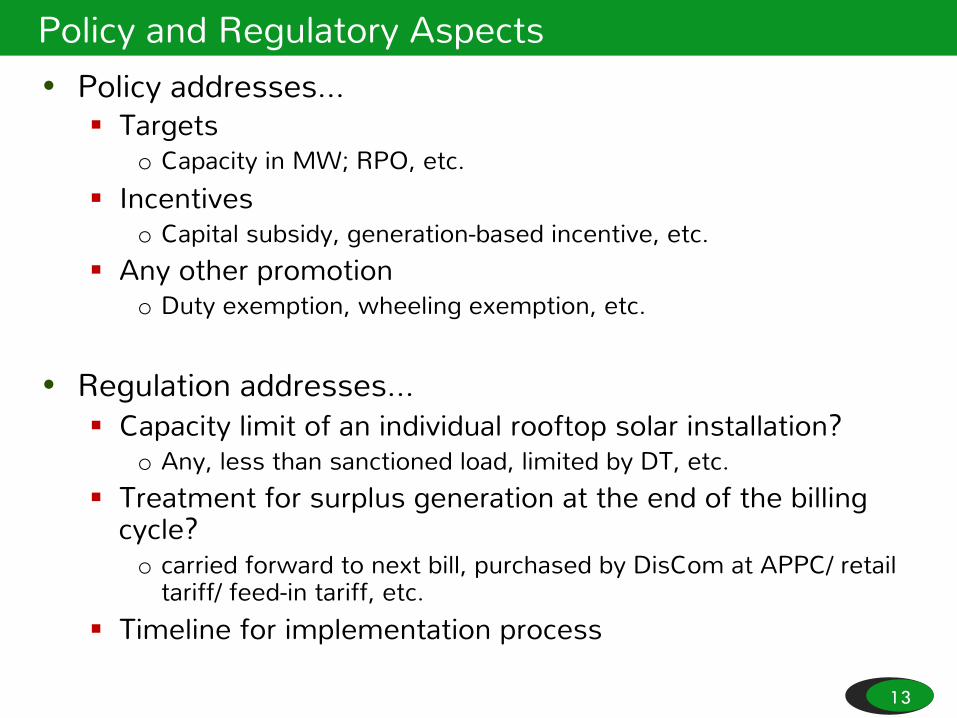
Policy and Regulatory Aspects • Policy addresses…
§ Targets o Capacity in MW; RPO, etc.
§ Incentives o Capital subsidy, generation-based incentive, etc.
§ Any other promotion o Duty exemption, wheeling exemption, etc.
• Regulation addresses… § Capacity limit of an individual rooftop solar installation?
o Any, less than sanctioned load, limited by DT, etc. § Treatment for surplus generation at the end of the billing
cycle? o carried forward to next bill, purchased by DisCom at APPC/ retail
tariff/ feed-in tariff, etc. § Timeline for implementation process
14
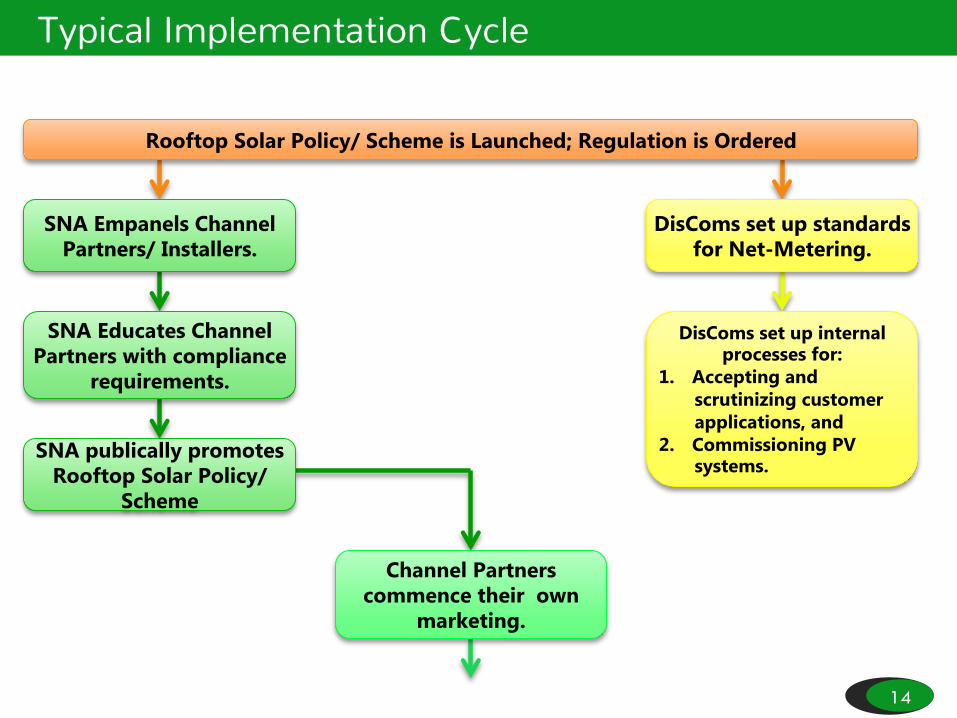
Typical Implementation Cycle
SNA Empanels Channel Partners/ Installers.
DisComs set up standards for Net-Metering.
SNA Educates Channel Partners with compliance
requirements.
SNA publically promotes Rooftop Solar Policy/
Scheme
DisComs set up internal processes for:
1. Accepting and scrutinizing customer applications, and
2. Commissioning PV systems.
Channel Partners commence their own
marketing.
Rooftop Solar Policy/ Scheme is Launched; Regulation is Ordered
15
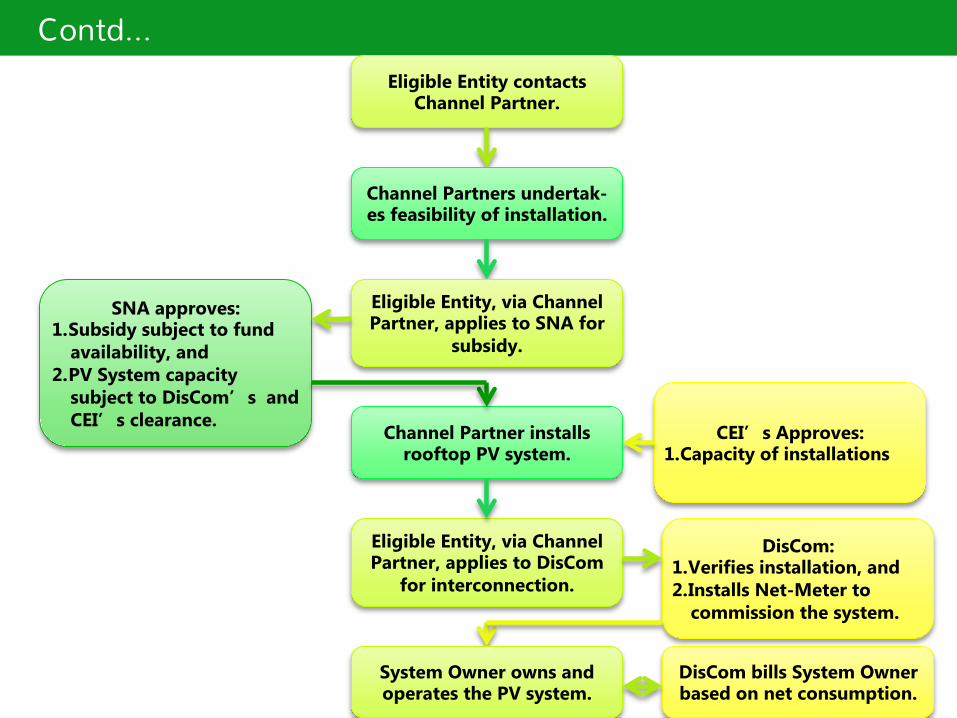
Contd… Eligible Entity contacts
Channel Partner.
Channel Partners undertak-es feasibility of installation.
Eligible Entity, via Channel Partner, applies to SNA for
subsidy.
SNA approves: 1. Subsidy subject to fund
availability, and 2. PV System capacity
subject to DisCom’s and CEI’s clearance.
DisCom: 1. Verifies installation, and 2. Installs Net-Meter to
commission the system.
Channel Partner installs rooftop PV system.
Eligible Entity, via Channel Partner, applies to DisCom
for interconnection.
DisCom bills System Owner based on net consumption.
System Owner owns and operates the PV system.
CEI’s Approves: 1. Capacity of installations
16
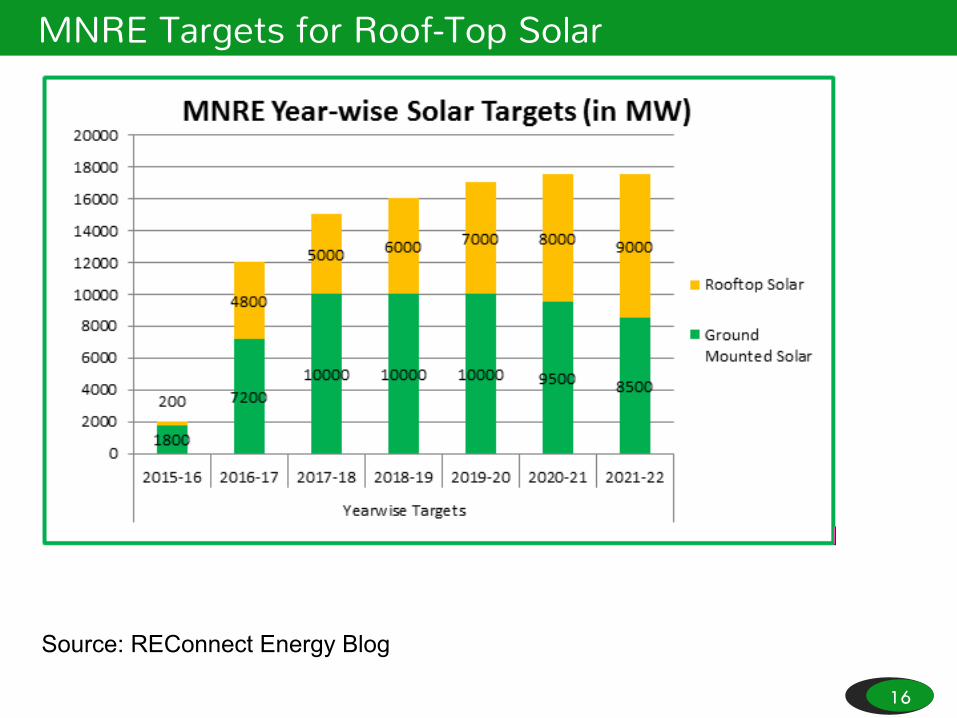
MNRE Targets for Roof-Top Solar
Source: REConnect Energy Blog
17
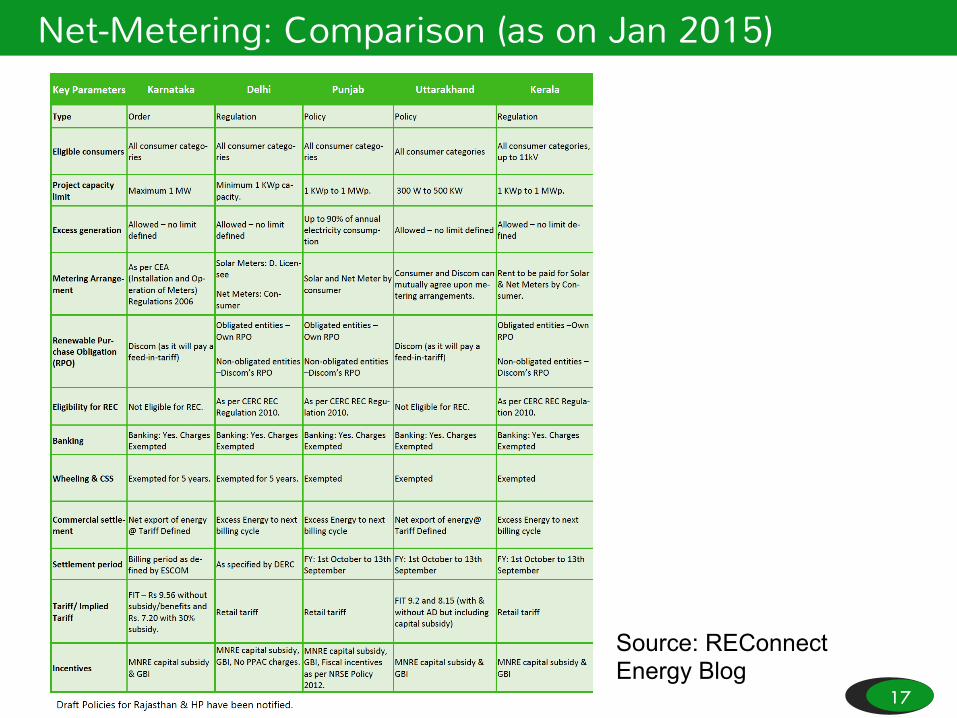
Net-Metering: Comparison (as on Jan 2015)
Source: REConnect Energy Blog
18
Conclusion • Rooftop PV is simple and well-established globally.
• The objective and scale of any net-metering programme have to be very clear upfront.
• The Electricity Act provides ample provision to undertake a net-metering programme.
• Well-defined implementation is key to success of a net-metering programme.
• 40 GW is GoI & MNRE’s target for Roof-Top Solar by 2022.
• Need – Innovative market models and marketplaces.