Embed Size (px)
Citation preview
Menghong Hu1, Qiongzhen Li2, SG Cheung1 & Paul Shin1
1City University of Hong Kong, Hong Kong, China 2Guangxi Institute of Fisheries, Guangxi, China
Distribution, abundance and population structure of
horseshoe crabs along three intertidal zones of Beibu
Gulf, Southern China
Outline
1 Background
2 Materials and Methods
3 Results and Discussion
4 Conclusions
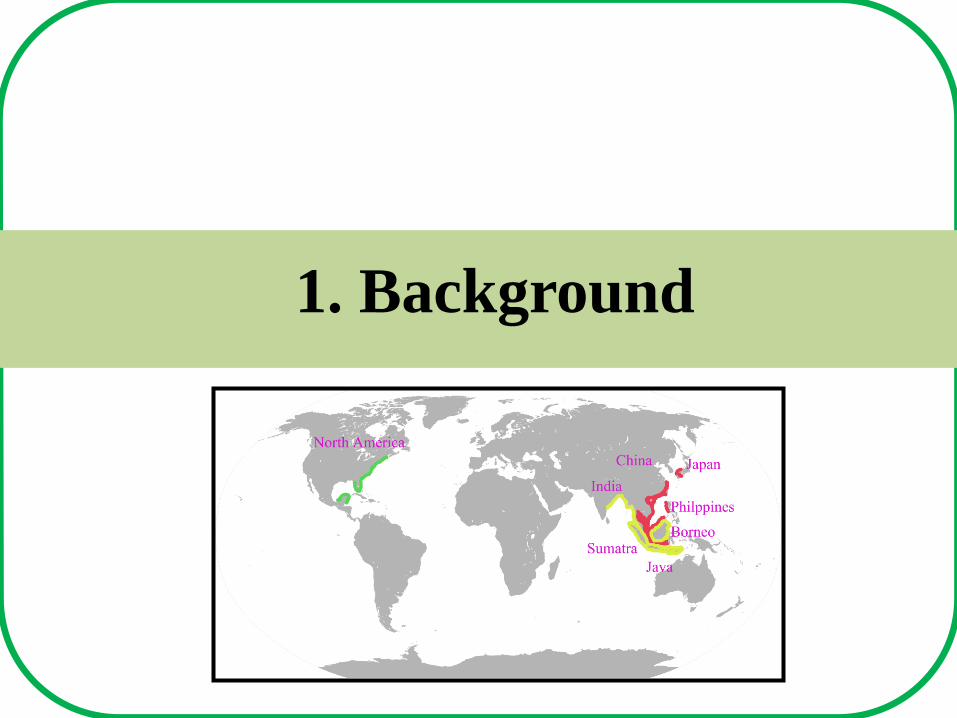
1. Background
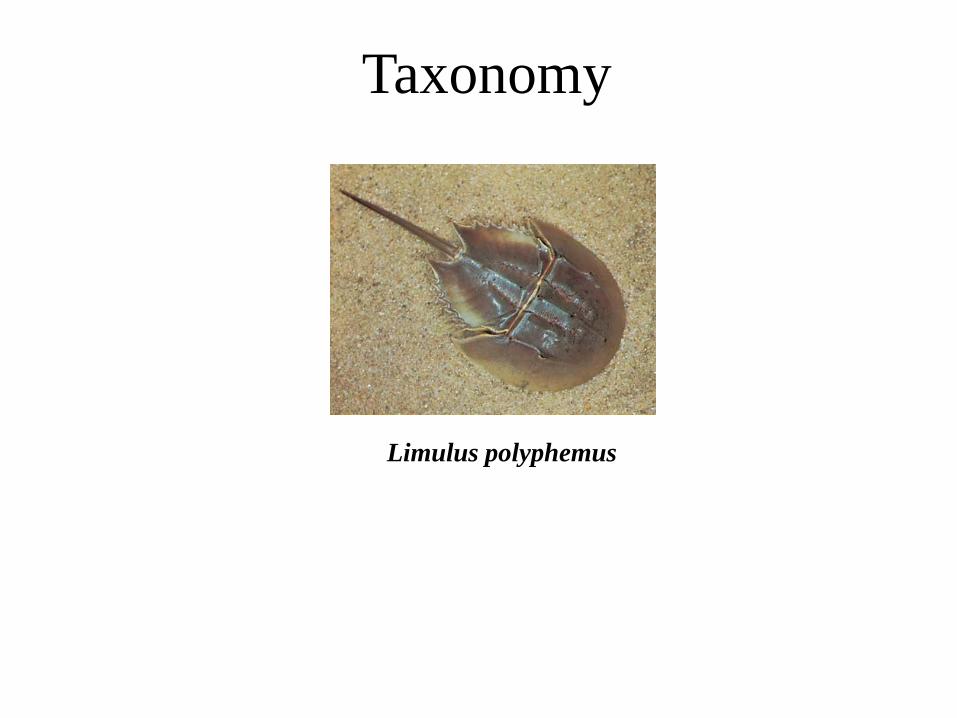
Taxonomy
Limulus polyphemus
Taxonomy
Tachypleus tridentatus
Tachypleus gigas
Carcinoscorpius rotundicauda
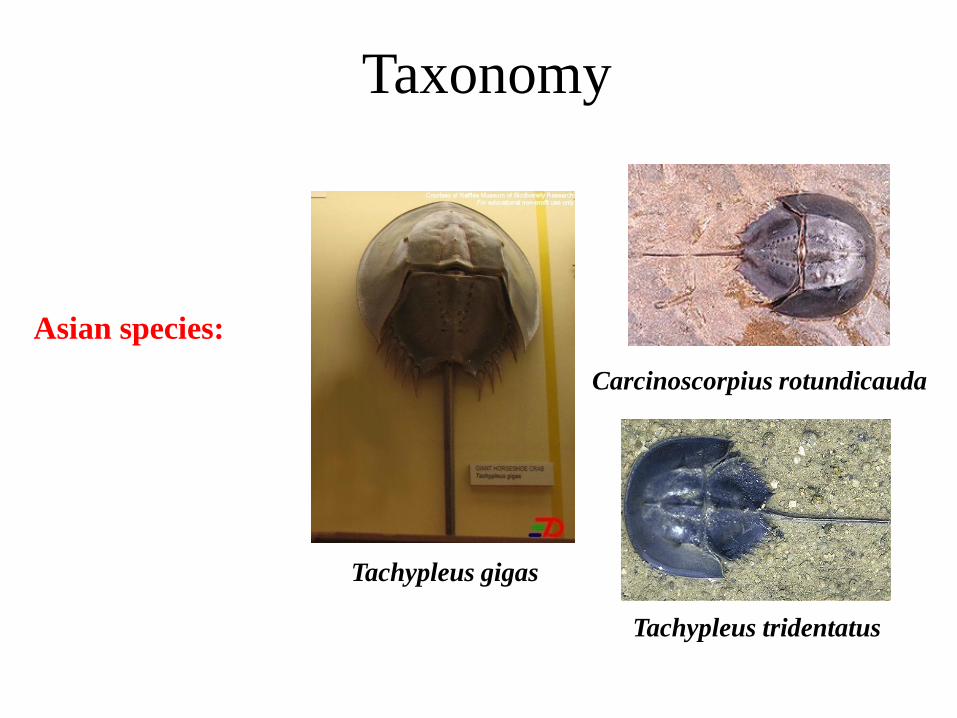
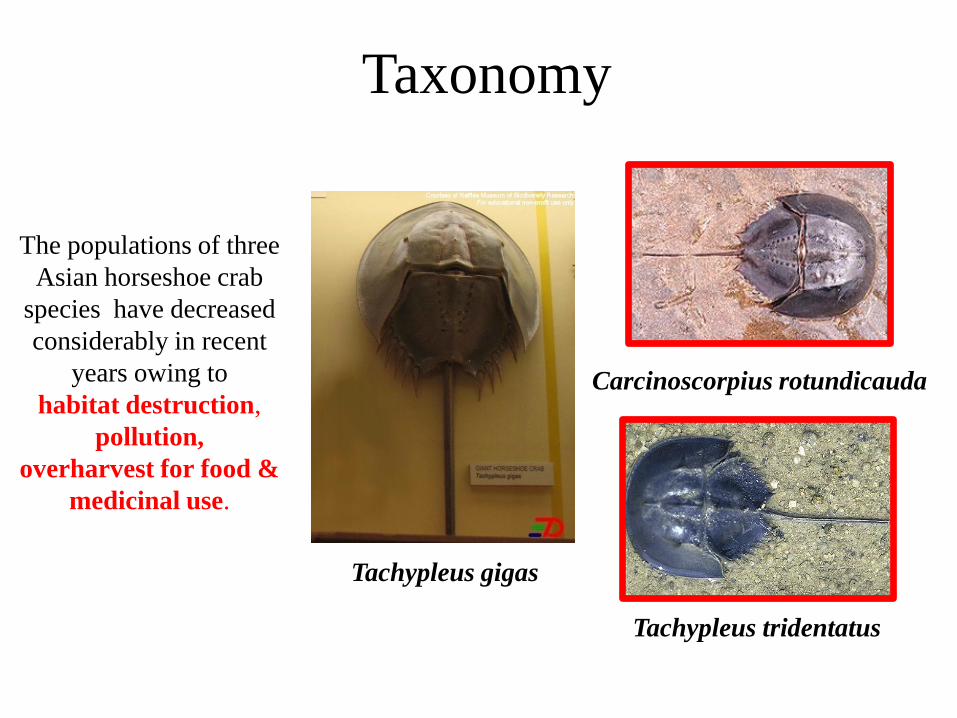
Asian species:
Taxonomy
Tachypleus tridentatus
Tachypleus gigas
Carcinoscorpius rotundicauda
The populations of three
Asian horseshoe crab
species have decreased
considerably in recent
years owing to
habitat destruction,
pollution,
overharvest for food &
medicinal use.
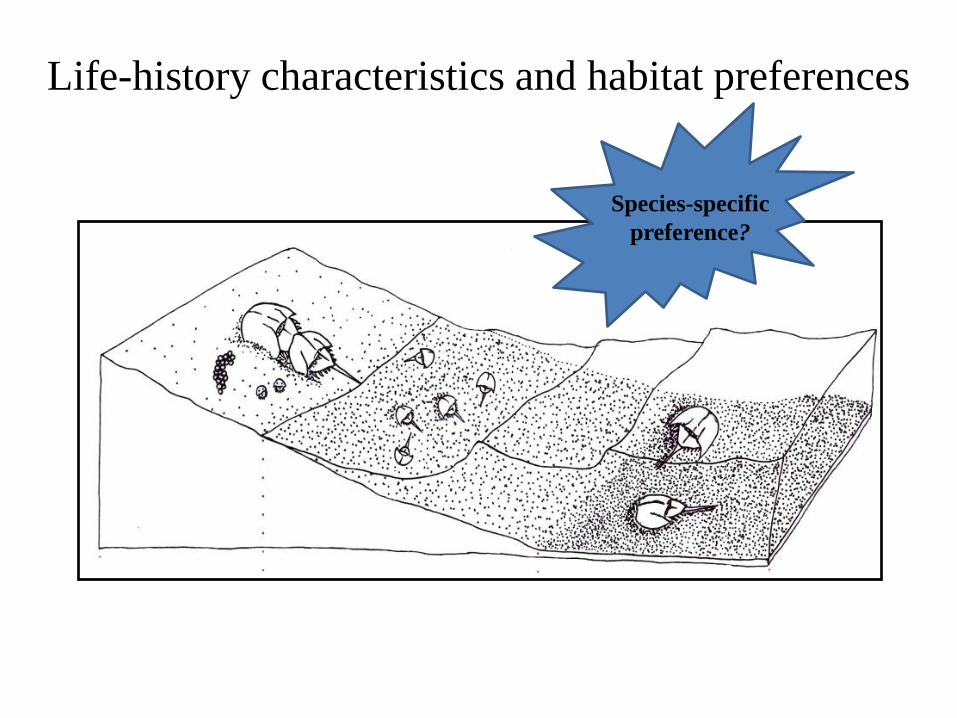
Life-history characteristics and habitat preferences
Species-specific
preference?
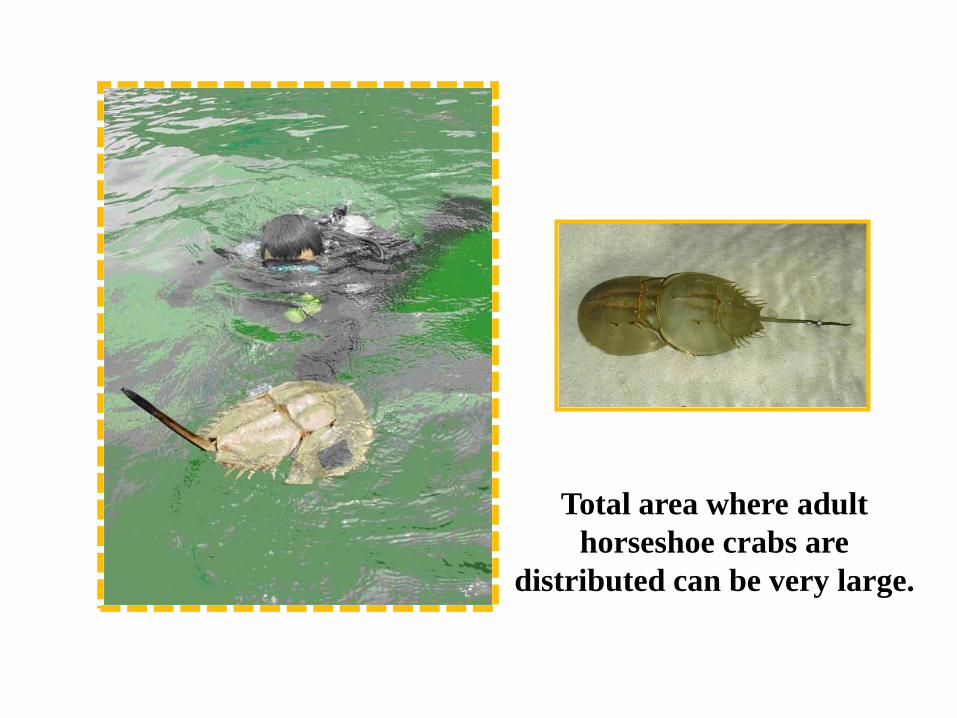
Total area where adult
horseshoe crabs are
distributed can be very large.
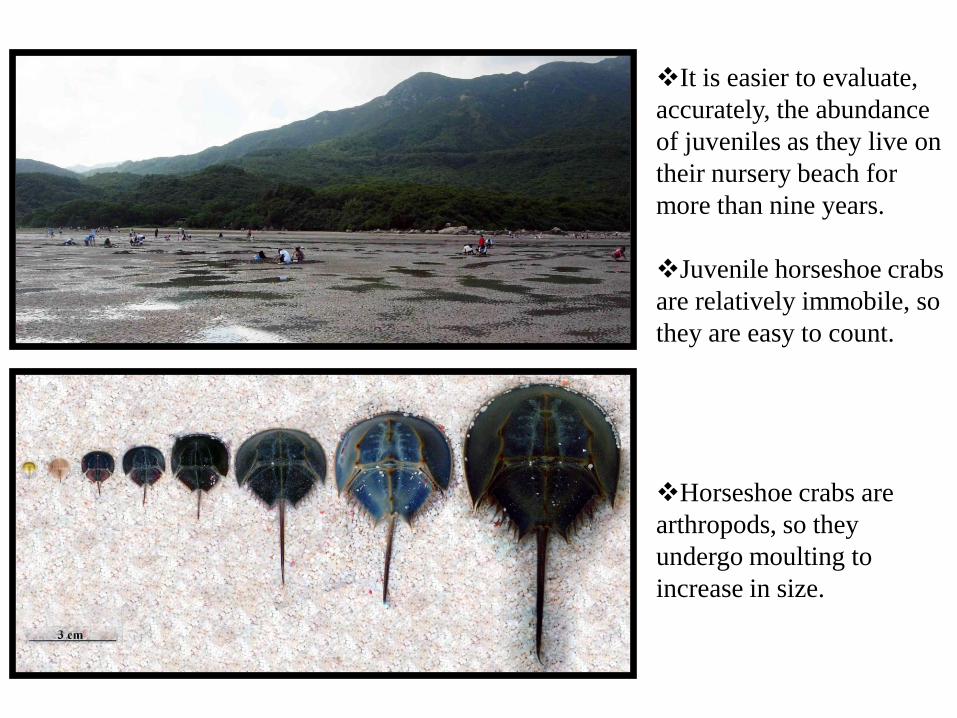
It is easier to evaluate,
accurately, the abundance
of juveniles as they live on
their nursery beach for
more than nine years.
Juvenile horseshoe crabs
are relatively immobile, so
they are easy to count.
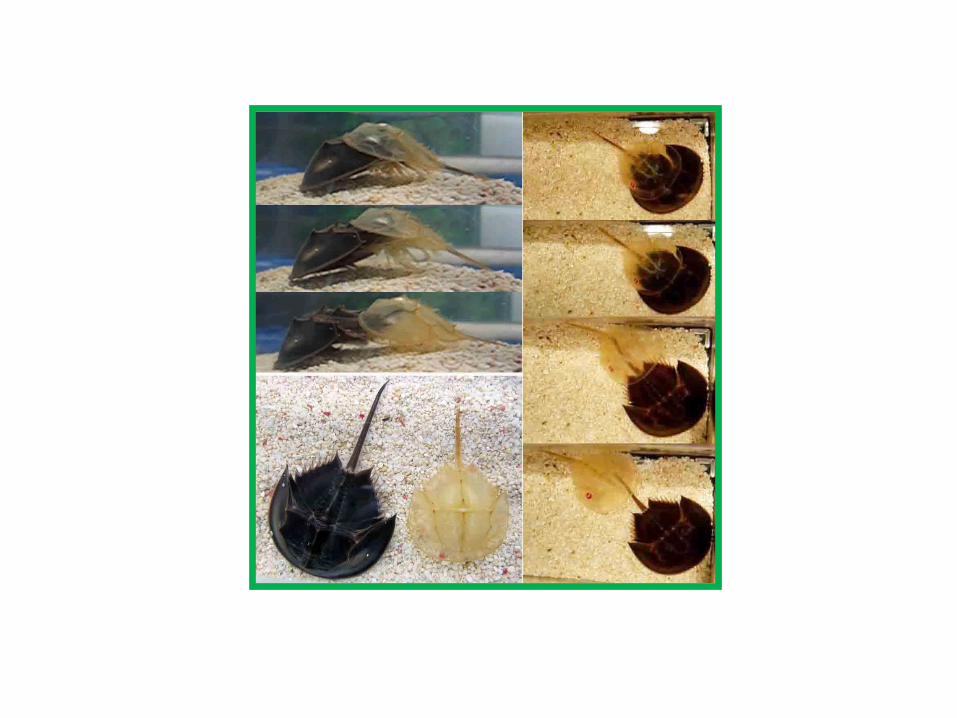
Horseshoe crabs are
arthropods, so they
undergo moulting to
increase in size.
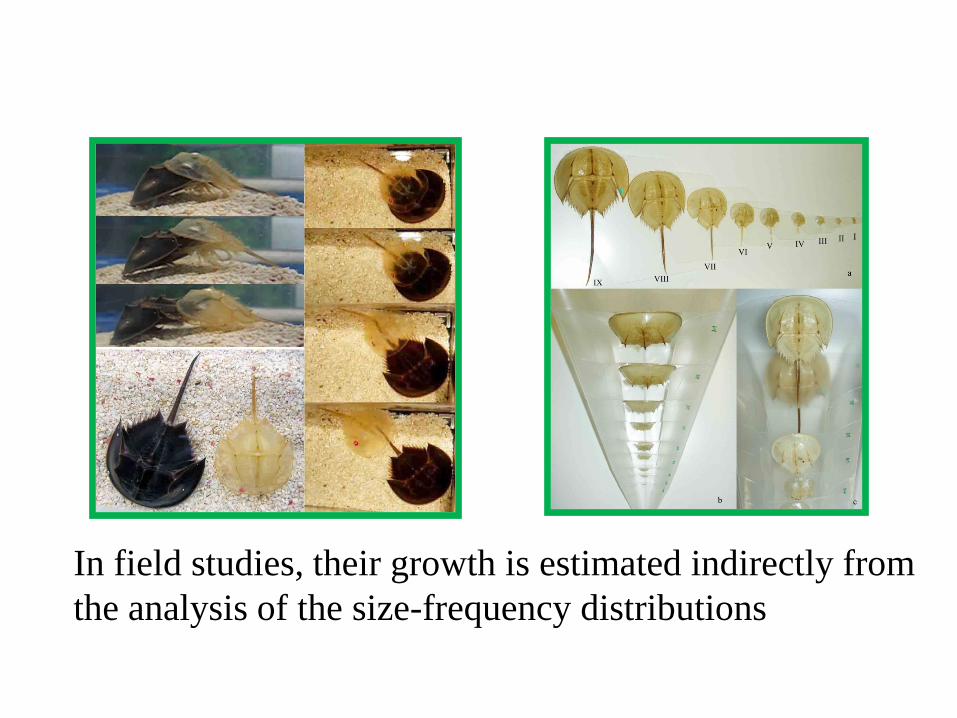
In field studies, their growth is estimated indirectly from
the analysis of the size-frequency distributions
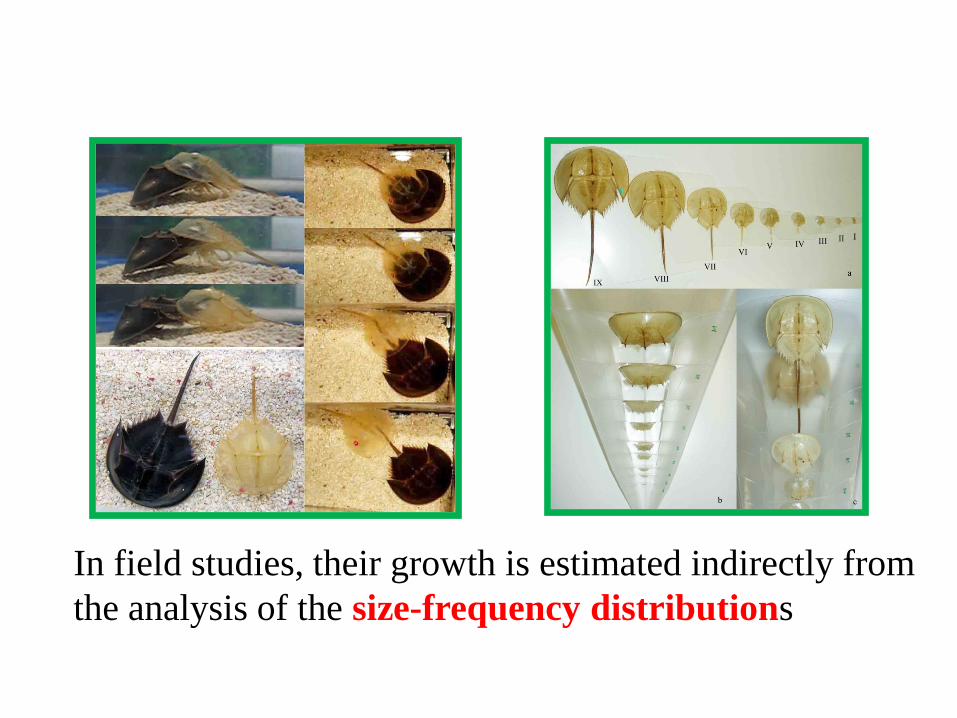
In field studies, their growth is estimated indirectly from
the analysis of the size-frequency distributions
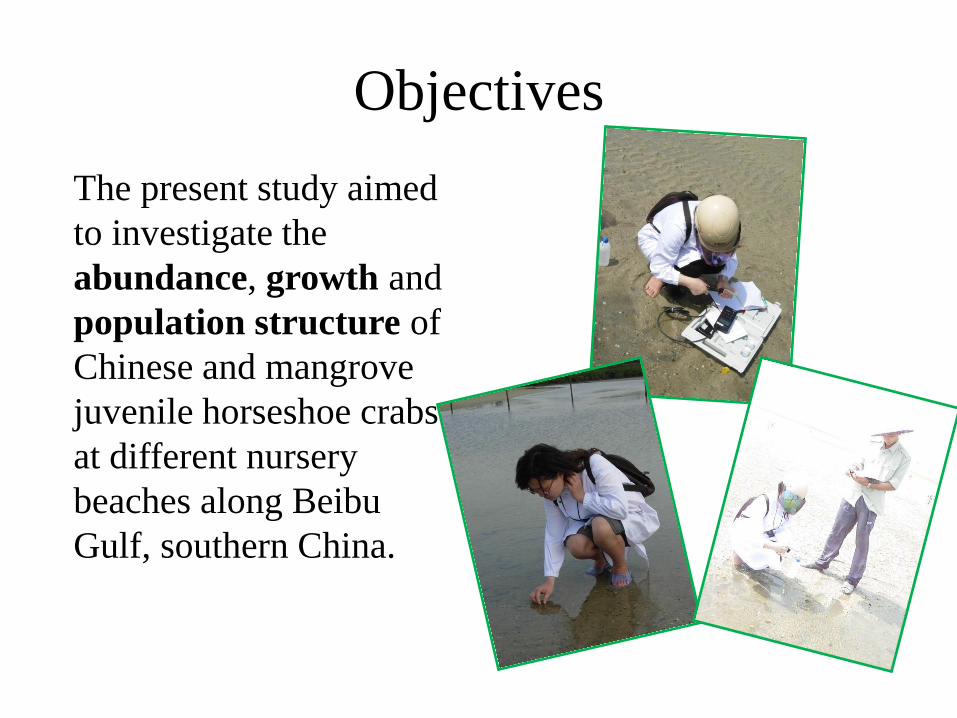
Objectives
The present study aimed
to investigate the
abundance, growth and
population structure of
Chinese and mangrove
juvenile horseshoe crabs
at different nursery
beaches along Beibu
Gulf, southern China.
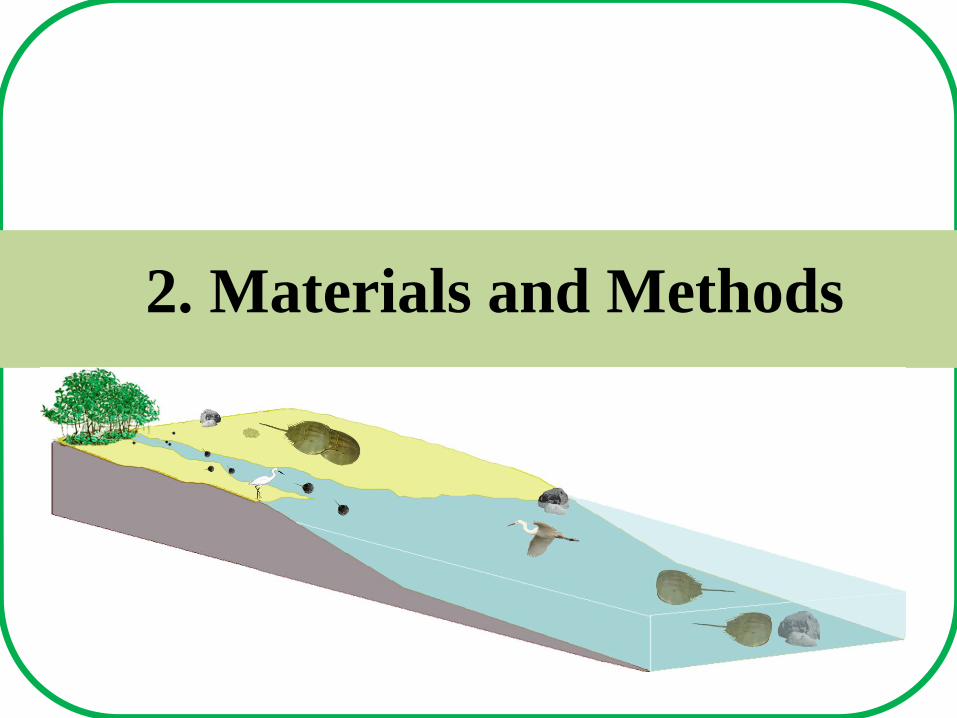
2. Materials and Methods
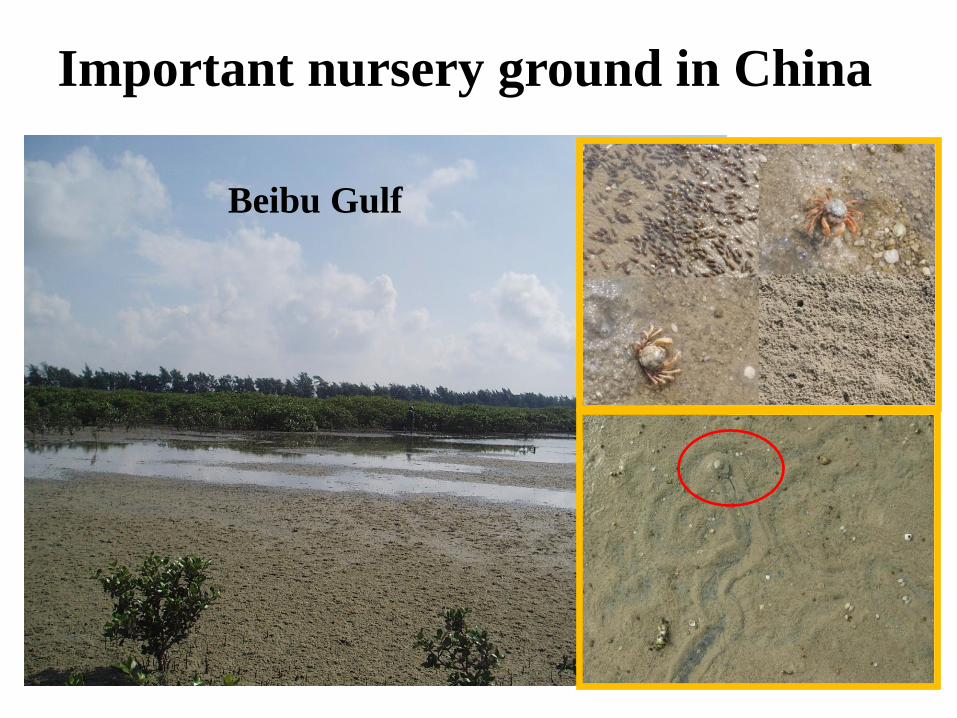
Beibu Gulf
Important nursery ground in China
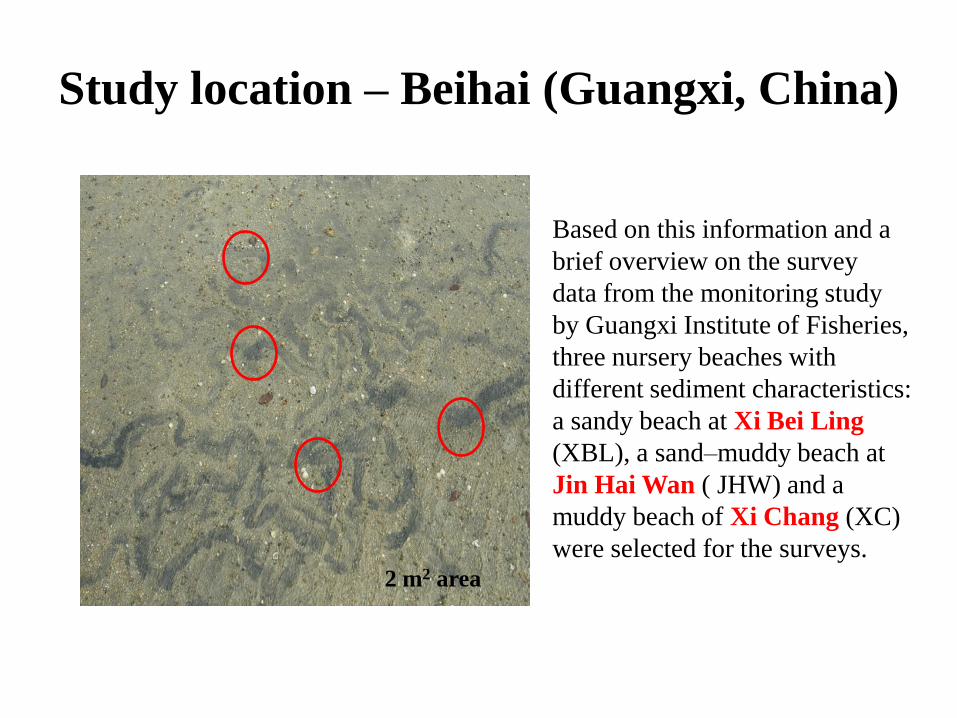
2 m2 area
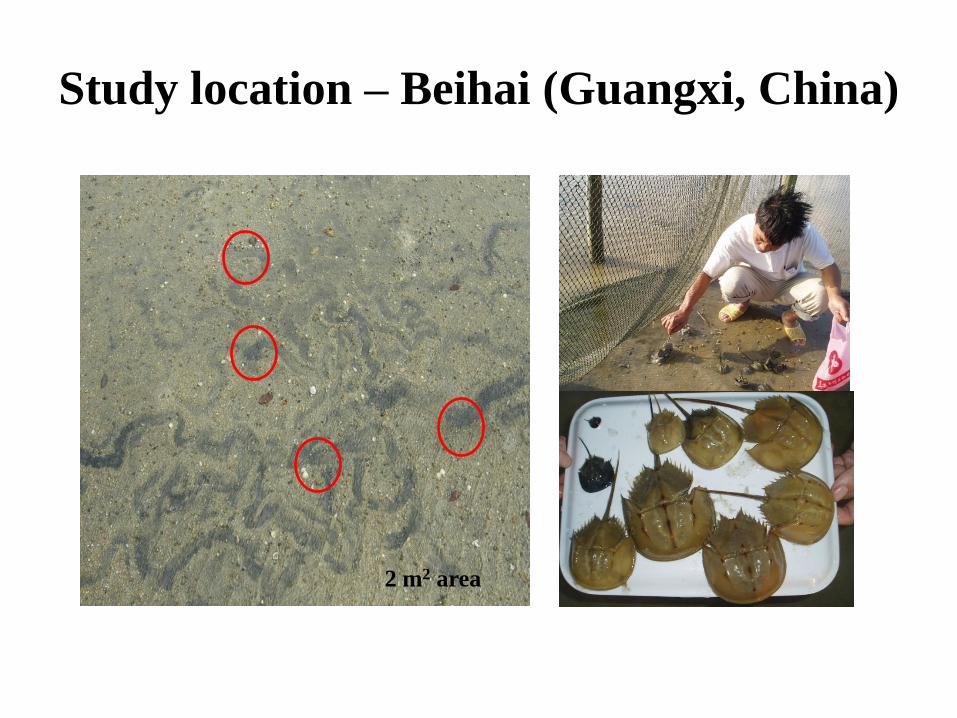
Study location – Beihai (Guangxi, China)
2 m2 area
Based on this information and a
brief overview on the survey
data from the monitoring study
by Guangxi Institute of Fisheries,
three nursery beaches with
different sediment characteristics:
a sandy beach at Xi Bei Ling
(XBL), a sand–muddy beach at
Jin Hai Wan ( JHW) and a
muddy beach of Xi Chang (XC)
were selected for the surveys.
Study location – Beihai (Guangxi, China)
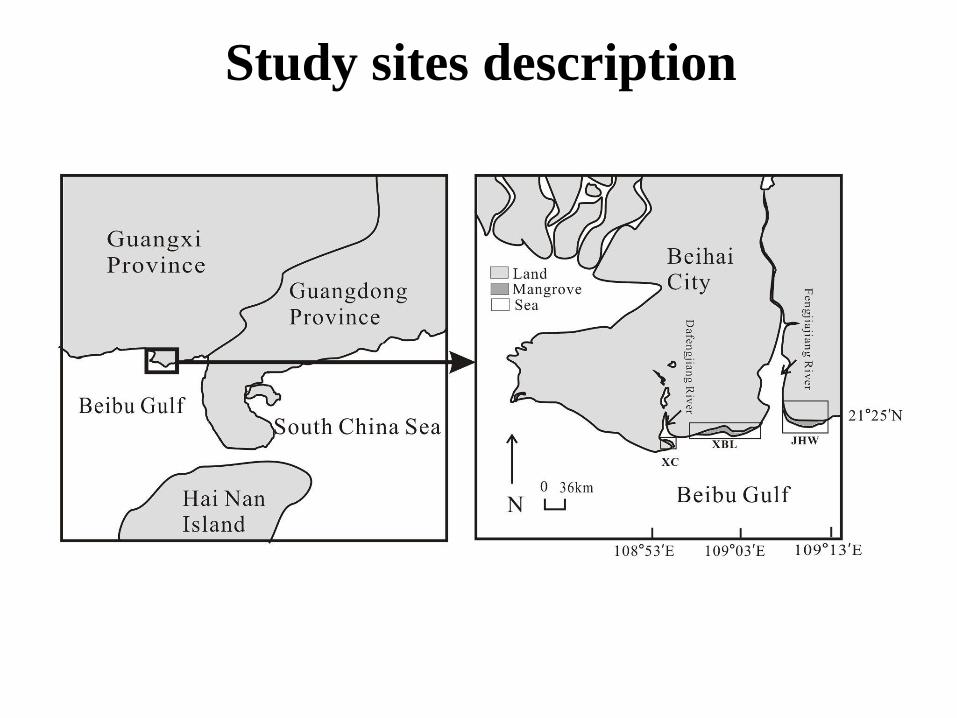
Study sites description
Survey strategies
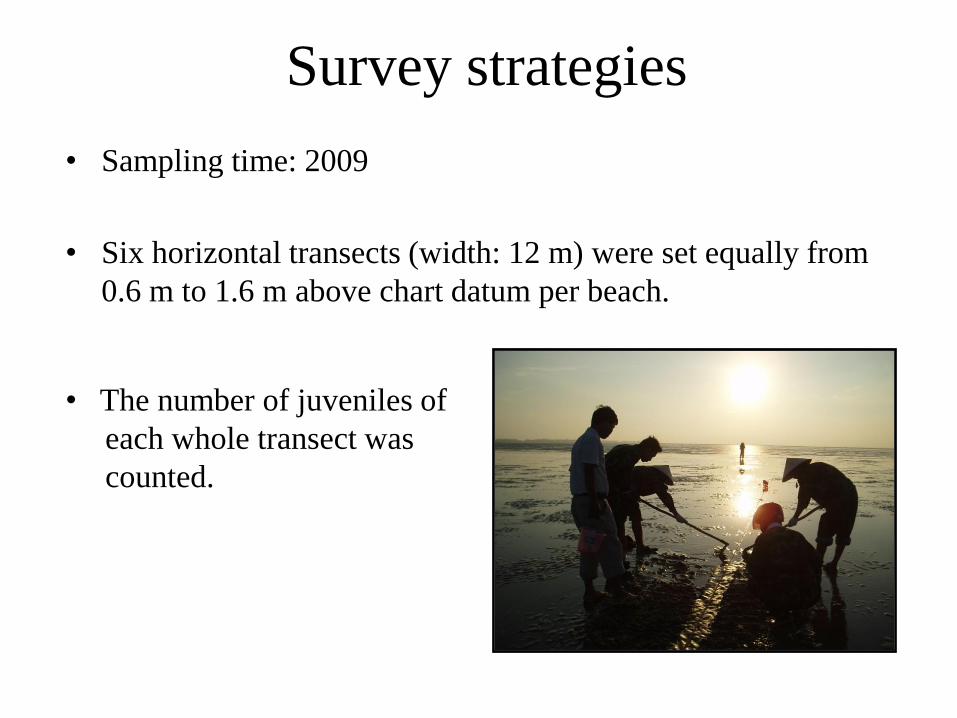
• Sampling time: 2009
• Six horizontal transects (width: 12 m) were set equally from
0.6 m to 1.6 m above chart datum per beach.
• The number of juveniles of
each whole transect was
counted.
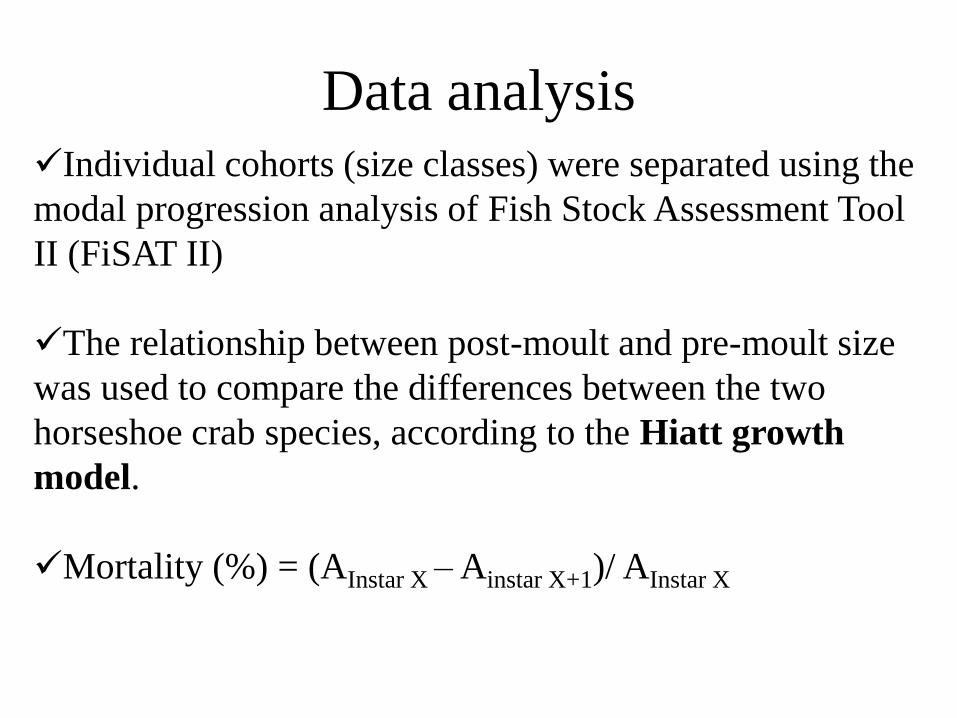
Data analysisIndividual cohorts (size classes) were separated using the
modal progression analysis of Fish Stock Assessment Tool
II (FiSAT II)
The relationship between post-moult and pre-moult size
was used to compare the differences between the two
horseshoe crab species, according to the Hiatt growth
model.
Mortality (%) = (AInstar X – Ainstar X+1)/ AInstar X

3. Results and Discussion

3.1 Abundance
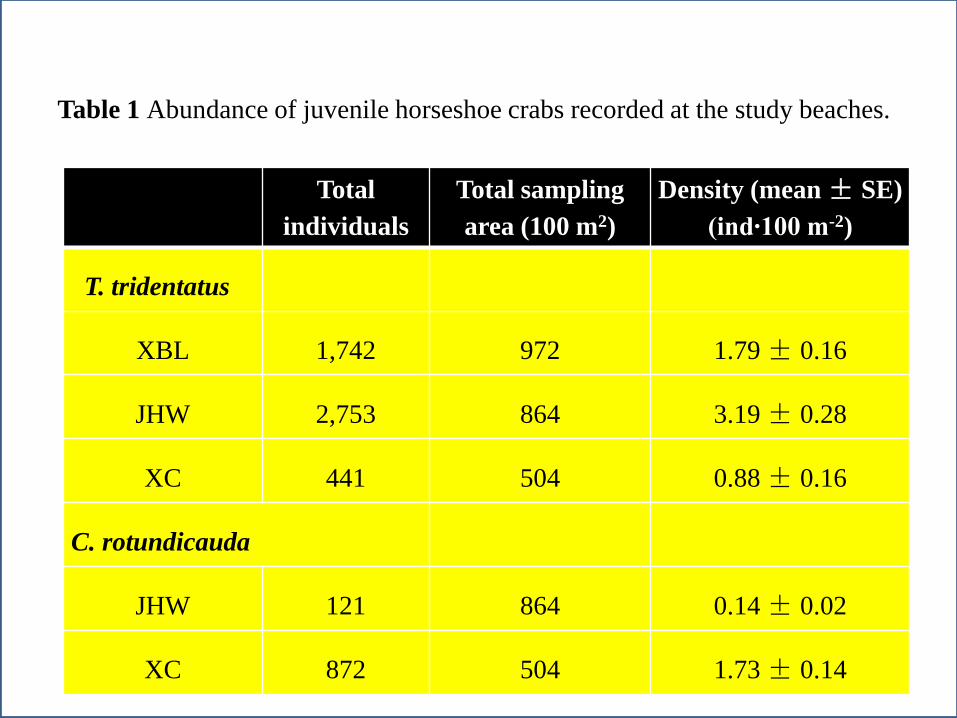
Table 1 Abundance of juvenile horseshoe crabs recorded at the study beaches.
Total
individuals
Total sampling
area (100 m2)
Density (mean ± SE)
(ind∙100 m-2)
T. tridentatus
XBL 1,742 972 1.79 ± 0.16
JHW 2,753 864 3.19 ± 0.28
XC 441 504 0.88 ± 0.16
C. rotundicauda
JHW 121 864 0.14 ± 0.02
XC 872 504 1.73 ± 0.14
3.2 Population structure
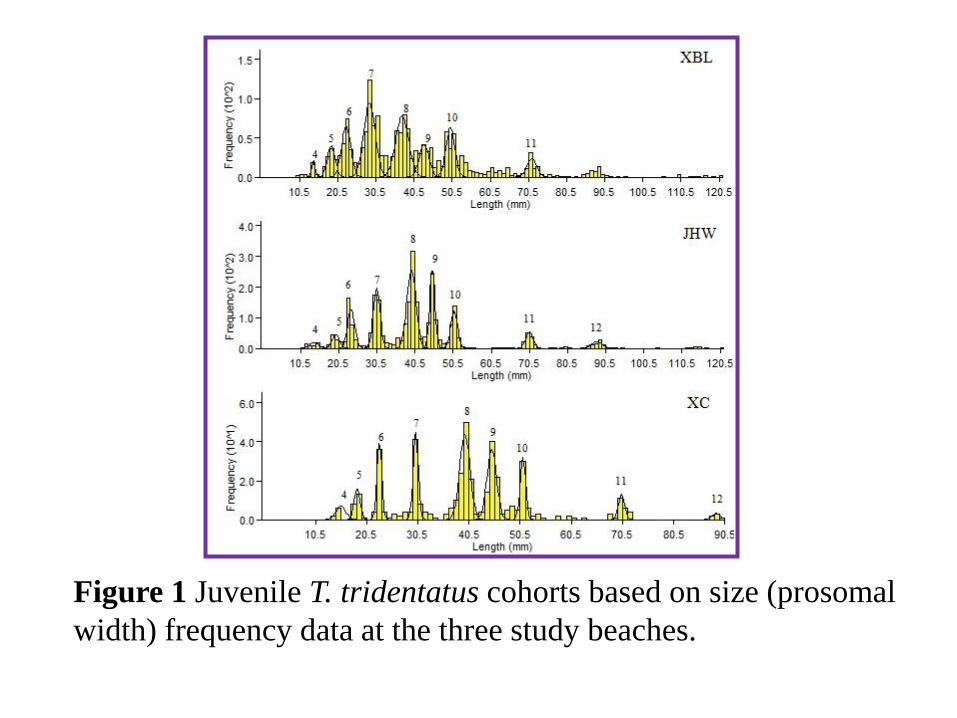
Figure 1 Juvenile T. tridentatus cohorts based on size (prosomal
width) frequency data at the three study beaches.
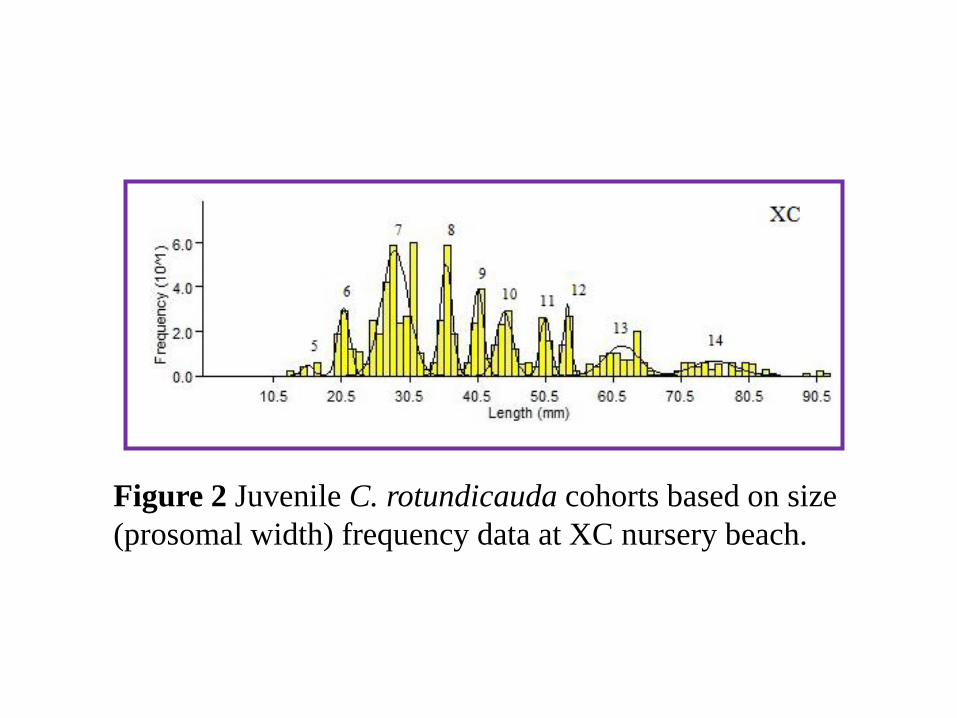
Figure 2 Juvenile C. rotundicauda cohorts based on size
(prosomal width) frequency data at XC nursery beach.

3.3 Growth
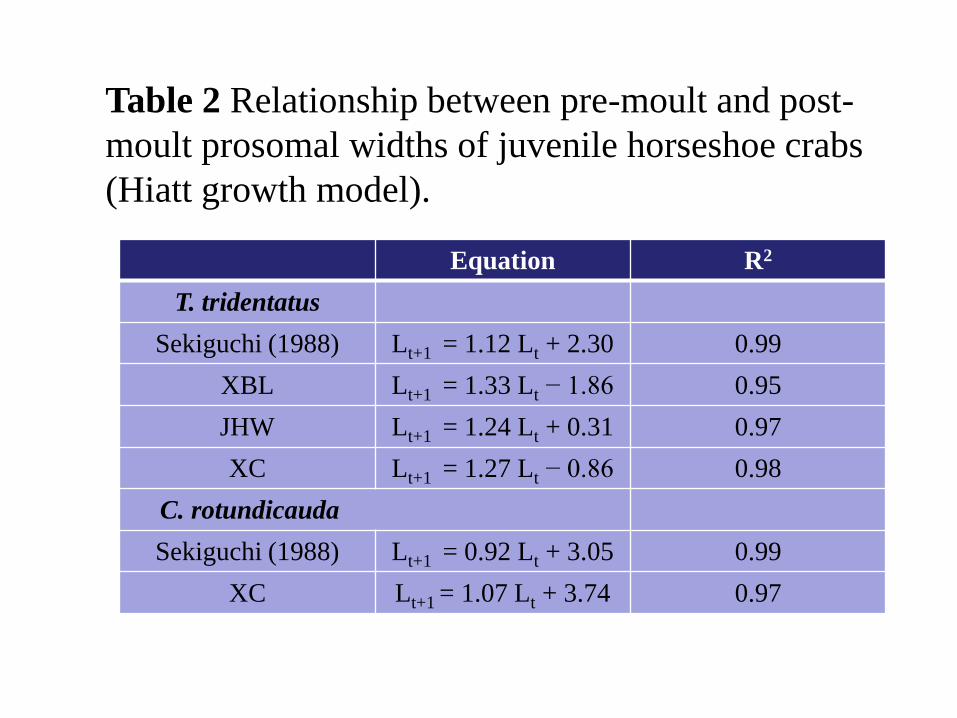
Table 2 Relationship between pre-moult and post-
moult prosomal widths of juvenile horseshoe crabs
(Hiatt growth model).
Equation R2
T. tridentatus
Sekiguchi (1988) Lt+1 = 1.12 Lt + 2.30 0.99
XBL Lt+1 = 1.33 Lt − 1.86 0.95
JHW Lt+1 = 1.24 Lt + 0.31 0.97
XC Lt+1 = 1.27 Lt − 0.86 0.98
C. rotundicauda
Sekiguchi (1988) Lt+1 = 0.92 Lt + 3.05 0.99
XC Lt+1 = 1.07 Lt + 3.74 0.97
0
10
20
30
40
50
60
70
80
90
100
0 1 2 3 4 5 6 7 8 9 10
Mea
n p
roso
mal
wid
th (m
m)
Years
Sekiguchi et al. (1988)
XBL
JHW
XC
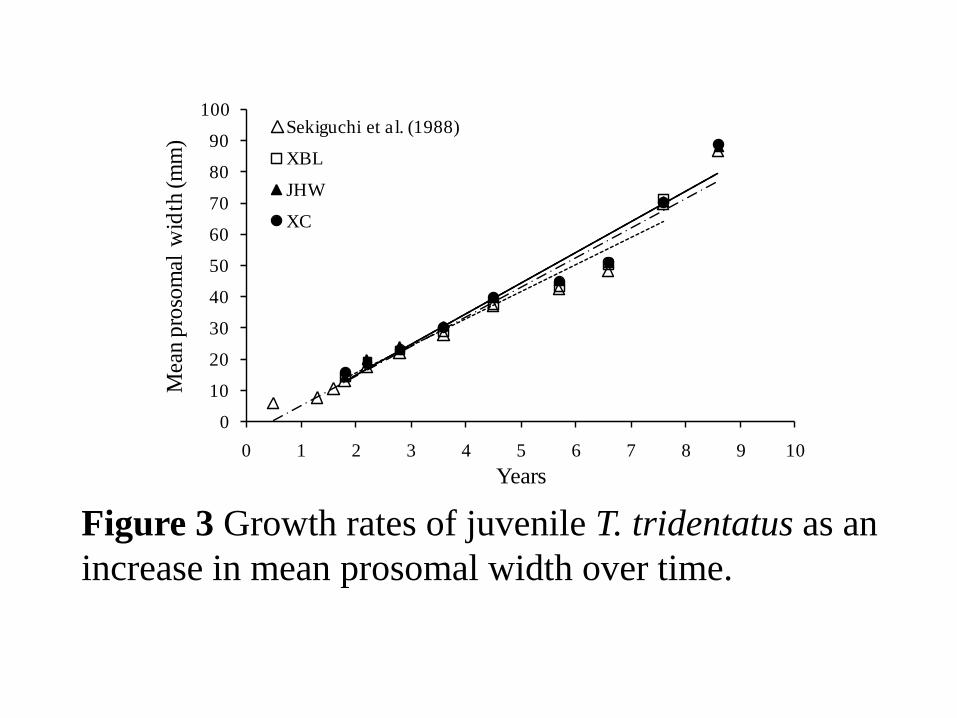
Figure 3 Growth rates of juvenile T. tridentatus as an
increase in mean prosomal width over time.
3.4 Mortality
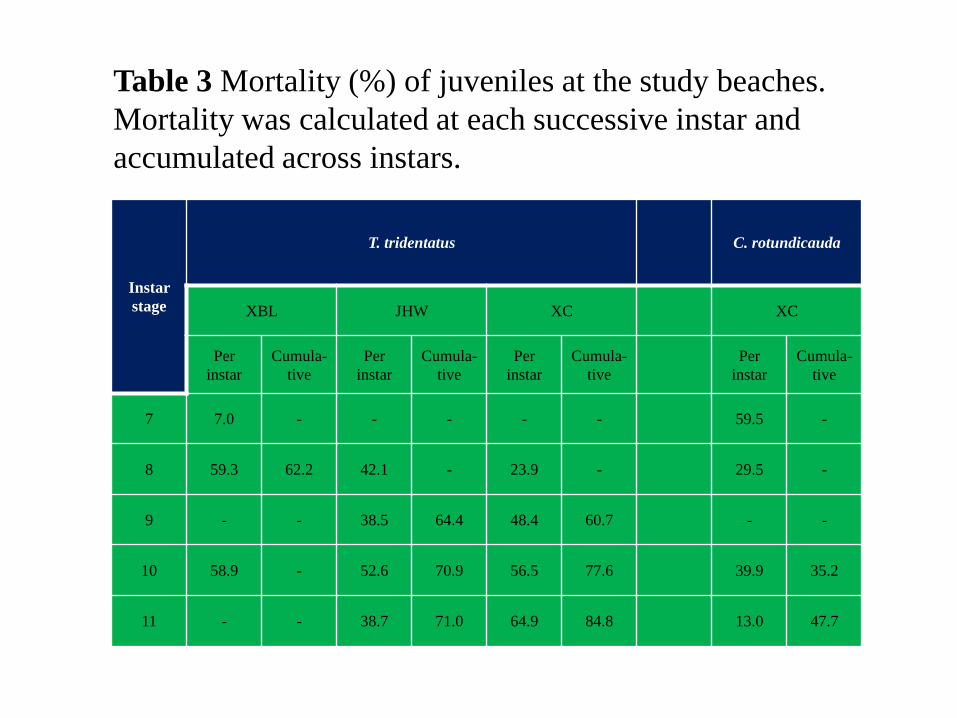
Instar
stage
T. tridentatus C. rotundicauda
XBL JHW XC XC
Per
instar
Cumula-
tive
Per
instar
Cumula-
tive
Per
instar
Cumula-
tive
Per
instar
Cumula-
tive
7 7.0 - - - - - 59.5 -
8 59.3 62.2 42.1 - 23.9 - 29.5 -
9 - - 38.5 64.4 48.4 60.7 - -
10 58.9 - 52.6 70.9 56.5 77.6 39.9 35.2
11 - - 38.7 71.0 64.9 84.8 13.0 47.7
Table 3 Mortality (%) of juveniles at the study beaches.
Mortality was calculated at each successive instar and
accumulated across instars.
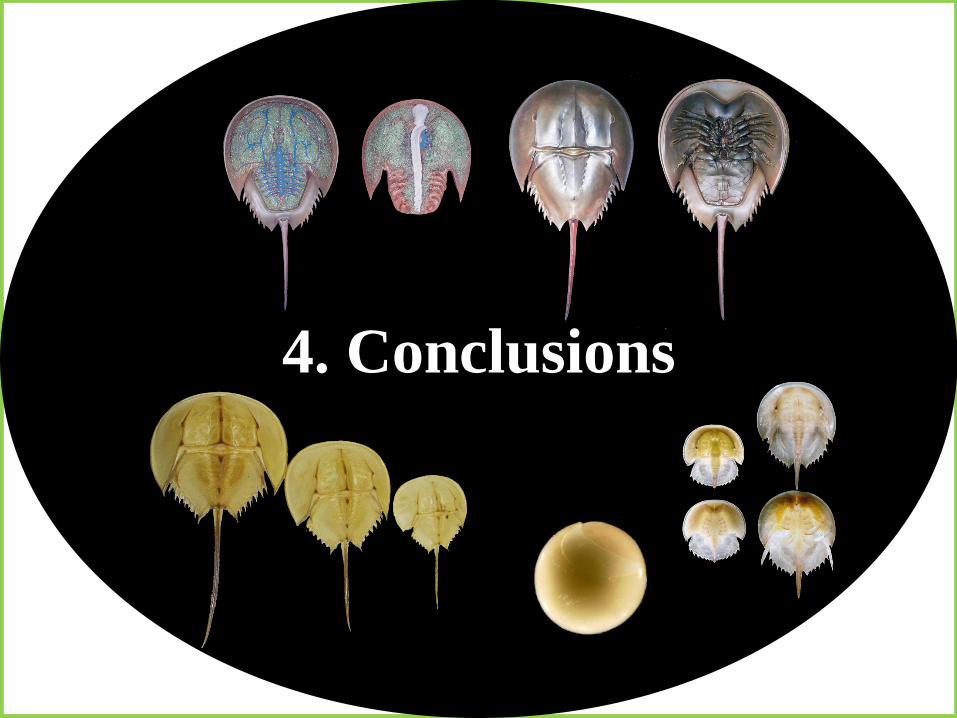
4. Conclusions
Juvenile T. tridentatus at 7th instar stage was in the majority in
the study area of XBL, while juvenile T. tridentatus at 8th instar
stage was dominant in the study area of both JHW and XC.
Juvenile C.rotundicauda at 7th instar stage was abundant in the
study area of XC.
Juvenile T. tridentatus at 7th instar stage was in the majority in
the study area of XBL, while juvenile T. tridentatus at 8th instar
stage was dominant in the study area of both JHW and XC.
Juvenile C.rotundicauda at 7th instar stage was abundant in the
study area of XC.
The relationship between pre-moult and post-moult sizes of
juvenile horseshoe crabs was generally fitted with the Hiatt linear
model, which showed juvenile T. tridentatus grows faster than C.
rotundicauda.
Slow growth and high cumulative mortality rate (circa 50%) of
the two species were also found in this study.
Juvenile T. tridentatus at 7th instar stage was in the majority in the
study area of XBL, while juvenile T. tridentatus at 8th instar stage
was dominant in the study area of both JHW and XC. Juvenile
C.rotundicauda at 7th instar stage was abundant in the study area
of XC.
The relationship between pre-moult and post-moult sizes of
juvenile horseshoe crabs was generally fitted with the Hiatt linear
model, which showed juvenile T. tridentatus grows faster than C.
rotundicauda.
Slow growth and high cumulative mortality rate (circa 50%) of the
two species were also found in this study.
The present findings implied that once a horseshoe
crab population is locally extirpated, it takes a long
period of time for them to re-establish even after
restoration of their degraded habitats.
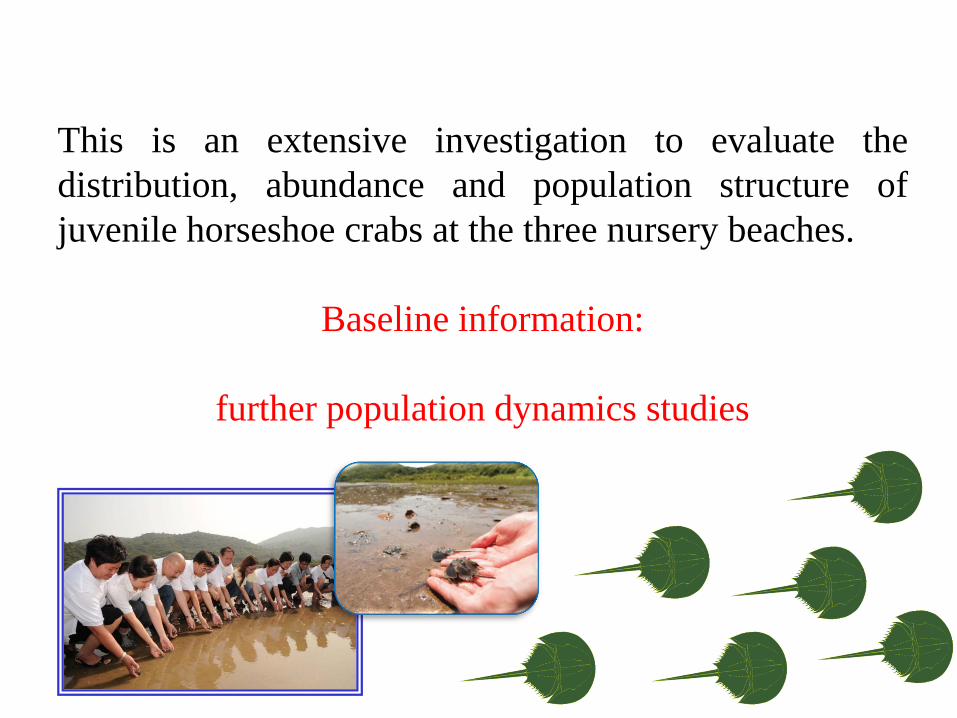
This is an extensive investigation to evaluate the
distribution, abundance and population structure of
juvenile horseshoe crabs at the three nursery beaches.
Baseline information:
further population dynamics studies

Acknowledgements
• My supervisor: Dr. Paul K.S. Shin
• Co-supervisor: Dr. S.G. Cheung
• Ms Qiongzhen Li
• All my labmates of CityU

Questions or Comments?
Thank you !