Embed Size (px)
Citation preview
Portland State University Portland State University
PDXScholar PDXScholar
Civil and Environmental Engineering Faculty Publications and Presentations Civil and Environmental Engineering
2-2021
Distribution and Antibiotic Resistance Profiles of Distribution and Antibiotic Resistance Profiles of
Salmonella enterica in Rural Areas of North Carolina Salmonella enterica in Rural Areas of North Carolina
After Hurricane Florence in 2018 After Hurricane Florence in 2018
Yuqing Mao University of Illinois at Urbana-Champaign
Mohamed Zeineldin University of Illinois at Urbana-Champaign
Moiz Usmani University of Florida
Sital Uprety University of Illinois at Urbana-Champaign
Joanna Shisler University of Illinois at Urbana-Champaign
See next page for additional authors
Follow this and additional works at: https://pdxscholar.library.pdx.edu/cengin_fac
Part of the Bacterial Infections and Mycoses Commons, Public Health Commons, and the Water
Resource Management Commons
Let us know how access to this document benefits you.
Citation Details Citation Details Mao, Y., Zeineldin, M., Usmani, M., Uprety, S., Shisler, J. L., Jutla, A., et al. (2021). Distribution and antibiotic resistance profiles of Salmonella enterica in rural areas of North Carolina after Hurricane Florence in 2018. GeoHealth, 5, e2020GH000294. https://doi.org/10.1029/2020GH000294
This Article is brought to you for free and open access. It has been accepted for inclusion in Civil and Environmental Engineering Faculty Publications and Presentations by an authorized administrator of PDXScholar. Please contact us if we can make this document more accessible: [email protected].
Authors Authors Yuqing Mao, Mohamed Zeineldin, Moiz Usmani, Sital Uprety, Joanna Shisler, Antarpreet Jutla, Avinash Unnikrishnan, and Thanh H. Nguyen
This article is available at PDXScholar: https://pdxscholar.library.pdx.edu/cengin_fac/612
1. IntroductionThe frequency and magnitude of extreme events are increasing globally (Arnell & Gosling, 2016). Inun-dation, as a result of massive flooding, has the potential to change environmental conditions abruptly, and as a result, add pressure to the metabolism and proliferation of microorganisms (Furtak et al., 2020). The resulting overland flows and additional burden from domestic sewer and septic tank systems during an extreme flood event can introduce pathogens into ecologically unstable water bodies. For example, Yu et al. (2018) reported elevated levels of Escherichia coli and antibiotic resistance genes (ARGs) in river water samples 6 months after flooding in Houston, TX. Rural counties in the United States also experience devastating effects of floods, including effects on agriculture and livestock production. These include loss of livestock, supply chain disruption, and the risk of contamination of the facilities housing agricultural animals (Bissett et al., 2018). Microbial contamination after a flood event needs to be investigated because floods may spread infectious diseases not only to livestock but also to humans as they interact with flooded waters.
Abstract In this study, water samples were analyzed from a rural area of North Carolina after Hurricane Florence in 2018 and the distribution of the ttrC virulence gene of Salmonella enterica were investigated. We also examined the distribution of culturable S. enterica and determined their antibiotic resistance profiles. Antibiotic resistance genes (ARGs) in the classes of aminoglycoside, beta-lactam, and macrolide-lincosamide-streptogramin B (MLSB) were targeted in this study. The ttrC gene was detected in 23 out of 25 locations. There was a wider and higher range of the ttrC gene in flooded water versus unflooded water samples (0–2.12 × 10⁵ copies/L vs. 0–4.86 × 10⁴ copies/L). Culturable S. enterica was isolated from 10 of 25 sampling locations, which was less prevalent than the distribution of the ttrC gene. The antibiotic resistance profiles were not distinct among the S. enterica isolates. The aminoglycoside resistance gene aac(6')-Iy had the highest relative abundance (around 0.05 copies/16S rRNA gene copy in all isolates) among all ARGs. These findings suggested that the 2018 flooding event led to higher copy numbers of the ttrC genes of S. enterica in some flooded water bodies compared to those in unflooded water bodies. The high ARG level and similar ARG profiles were observed in all S. enterica isolates from both flooded and unflooded samples, suggesting that the antibiotic resistance was prevalent in S. enterica within this region, regardless of flooding.
Plain Language Summary In this study, water samples collected from a rural area of North Carolina after Hurricane Florence in 2018 were analyzed. We found that this flooding event increased the copy numbers of the virulence gene ttrC of Salmonella enterica in some flooded water bodies. The antibiotic resistance was prevalent in the S. enterica isolates from different water samples, from both flooded and unflooded areas. Understanding the distribution and antibiotic resistance profiles of S. enterica after a flood event is the first step in understanding how to make farms safe against future flooding and how to treat exposed herds with appropriate antibiotics, securing the food supply chain.
MAO ET AL.
© 2020. The Authors.This is an open access article under the terms of the Creative Commons Attribution-NonCommercial-NoDerivs License, which permits use and distribution in any medium, provided the original work is properly cited, the use is non-commercial and no modifications or adaptations are made.
Distribution and Antibiotic Resistance Profiles of Salmonella enterica in Rural Areas of North Carolina After Hurricane Florence in 2018Yuqing Mao1, Mohamed Zeineldin2,3, Moiz Usmani4 , Sital Uprety1, Joanna L. Shisler2,5 , Antarpreet Jutla4 , Avinash Unnikrishnan6, and Thanh H. Nguyen1,2
1Department of Civil and Environmental Engineering, University of Illinois at Urbana-Champaign, Urbana, IL, USA, 2Institute for Genomic Biology, University of Illinois at Urbana-Champaign, Urbana, IL, USA, 3Animal Medicine Department, College of Veterinary Medicine, Benha University, Benha, Egypt, 4Environmental Engineering Sciences, University of Florida, Gainesville, FL, USA, 5Department of Microbiology, University of Illinois at Urbana-Champaign, Urbana, IL, USA, 6Civil and Environmental Engineering, Portland State University, Portland, OR, USA
Key Points:• The ttrC gene of Salmonella enterica
was prevalent in several water bodies in a rural area of North Carolina after Hurricane Florence
• The loads of ttrC gene were high in some, but not all, flooded areas
• Antibiotic resistance genes were prevalent in the S. enterica isolates in this region
Supporting Information:• Supporting Information S1• Table S2• Table S3• Table S4• Table S5
Correspondence to:T. H. Nguyen,[email protected]
Citation:Mao, Y., Zeineldin, M., Usmani, M., Uprety, S., Shisler, J. L., Jutla, A., et al. (2021). Distribution and antibiotic resistance profiles of Salmonella enterica in rural areas of North Carolina after Hurricane Florence in 2018. GeoHealth, 5, e2020GH000294. https://doi.org/10.1029/2020GH000294
Received 1 JUL 2020Accepted 15 DEC 2020
Author Contributions:Conceptualization: Yuqing Mao, Moiz Usmani, Sital Uprety, Joanna L. Shisler, Antarpreet Jutla, Avinash Unnikrishnan, Thanh H. NguyenFormal analysis: Yuqing Mao, Mohamed Zeineldin, Moiz Usmani, Joanna L. Shisler, Antarpreet Jutla, Avinash Unnikrishnan, Thanh H. NguyenFunding acquisition: Sital Uprety, Joanna L. Shisler, Antarpreet Jutla,
10.1029/2020GH000294RESEARCH ARTICLE
1 of 14
GeoHealth
Salmonella is a waterborne, foodborne, and zoonotic pathogen. These properties make Salmonella a threat to animal farms. In 2017, Salmonella caused the most bacterial foodborne outbreaks in the US (122 out of 271) (Center for Disease Control and Prevention (CDC), 2019). Salmonella and multidrug-resistant Salmo-nella can spread via water contaminated with feces of infected humans and animals. Antibiotics usually can resolve severe Salmonella infections. However, there are increasing cases of antibiotic-resistant Salmonella: multidrug-resistant Salmonella has been isolated from poultry, cattle, and swine in several regions of the US (Nair et al., 2018). Antibiotic-resistant Salmonella strains isolated in the past decades are resistant to a wide range of antibiotics, including ampicillin, chloramphenicol, streptomycin, sulfonamide, tetracycline, and even fluoroquinolone and extended-spectrum cephalosporin (L. H. Su et al., 2004). Thus, the increase in multidrug resistance limits the effectiveness of antibiotics available for both medical and livestock treat-ments. In natural disasters such as flood events, livestock may experience a higher level of stress, and their immune system will be weakened as a result (Filipe et al., 2020), increasing the susceptibility of agricultural animals to Salmonella infections (Stevens et al., 2009).
Previous studies show that Salmonella were prevalent and also resistant to antibiotics after flood events in ru-ral settings (Bergholz et al., 2016; Divakaran et al., 2019; Song et al., 2018). For these earlier studies, Salmonel-la was detected and quantified by culturing samples on solid, selective microbiological culture media. Howev-er, conventional culturing methods cannot provide an accurate estimate of the concentrations of Salmonella in flooded areas. In contrast, quantitative polymerase chain reaction (qPCR) provides a means to accurately quantify DNA in water from natural water bodies (Jikumaru et al., 2020; Kapoor et al., 2015). Microfluidic qPCR (mfqPCR) has an increased sensitivity throughput and sensitivity, as well as a reduced cost associated with performing qPCR (Ishii et al., 2013). Limitations of qPCR analysis of environmental samples are that it cannot accurately quantify bacterial viability, and PCR inhibitors in environmental samples sometimes will hinder the detection of genes in low concentration and cause false-negative results (Schrader et al., 2012).
The goals of this study were to understand how Salmonella may spread during a flooding event, and the ARGs associated with these bacterial populations. This study is important because a better understanding is needed as to whether the spread of Salmonella and ARGs will increase after a flood event. Understand-ing the distribution of Salmonella and their antibiotic resistance profiles after a flood event can help reduce the Salmonella exposure in herds, and determine the proper drugs for the treatment, securing the food supply chain. To this end, water samples collected in North Carolina after Hurricane Florence were ana-lyzed for Salmonella by combining the methods of qPCR and culturing. To accurately assess Salmonella, we used qPCR to quantify the distribution of a Salmonella enterica virulence gene (ttrC) in unflooded and flooded areas. When possible, Salmonella were cultured and purified from these water samples, and were examined ARG profiles of Salmonella isolates. We hypothesize that such an analysis could better identify not only the viability of Salmonella in different locations but also the presence of virulence or ARGs, in-formation that could help inform decision-making about managing water safety after an extreme event.
2. Materials and Methods2.1. Sampling Location Determination
We used a map inundation methodology based on geomorphometric principles (Bolch et al., 2011; Clubb et al., 2017; Sofia et al., 2014). The basic premise is to let topography dictate how water will fill a particular landscape during a flood event. It allows high-speed computation and accurate identification of locations that are likely to be inundated after heavy precipitation. The objective is to estimate the inundation depths and spatially capture the locations likely to be flooded due to any known amount of rainfall. For this pur-pose, a variable of x inches of rain is placed in each of the digital elevation model cells to obtain the first estimate of water surface elevation. Next, the water surface elevations are distributed/balanced over the en-tire terrain using geomorphological principles such that the point with lower elevation would have greater flood depth and vice versa. Once the steady state is reached, the water surface elevations are determined by the corresponding digital elevations to obtain the inundation depths. The model was initially validated for Hurricane Harvey when it hit the Houston, TX shores in 2018.
In addition to the selection of flooded and unflooded water bodies, we also obtained the swine farm loca-tions from the North Carolina Department of Environmental Quality (NCDEQ) Animal Feeding Operations
MAO ET AL.
10.1029/2020GH000294
2 of 14
Avinash Unnikrishnan, Thanh H. NguyenInvestigation: Yuqing Mao, Sital Uprety, Joanna L. ShislerMethodology: Yuqing Mao, Mohamed Zeineldin, Moiz Usmani, Sital Uprety, Joanna L. Shisler, Antarpreet Jutla, Avinash Unnikrishnan, Thanh H. NguyenSoftware: Moiz Usmani, Thanh H. NguyenSupervision: Joanna L. Shisler, Antarpreet Jutla, Avinash Unnikrishnan, Thanh H. NguyenWriting – original draft: Yuqing Mao, Mohamed Zeineldin, Moiz Usmani, Sital Uprety, Joanna L. Shisler, Antarpreet Jutla, Avinash Unnikrishnan, Thanh H. NguyenWriting – review & editing: Yuqing Mao, Mohamed Zeineldin, Moiz Usmani, Sital Uprety, Joanna L. Shisler, Antarpreet Jutla, Avinash Unnikrishnan, Thanh H. Nguyen
GeoHealth
Program (NC DEQ, 2019). The 2,283 permitted farm locations were overlaid onto the flood map described above, then queried by flood depth. All swine farms with flood depths of 5 ft or greater were selected as potential sampling sites because there was high certainty about flooding at the location, resulting in the se-lection of 40 swine farms. Based on our analysis of actual flood report by NCDEQ, all 40 swine farms (100%) were indeed flooded. Twenty-four swine facilities reported lagoon discharging, an additional eight reported inundation (surface water surrounding and flowing into lagoon), and eight more reported lagoons at full capacity and likely to overtop (NC DEQ, 2018). Similarly, unflooded farms were identified. Twenty-three farm locations were selected from the list of unflooded farms by visually inspecting the flood map. Those unflooded farms met two criteria. First, the unflooded location must be relatively close to flooded farms of interest, making travel and collection less burdensome. Second, the flood maps must show the location as free of flooding to a high certainty (i.e., not located on or near the boundary of the flood extent). None of the selected unflooded farms were reported flooded in the post flood report. From these modeling and post flood analysis, 25 sites were selected and sampled in North Carolina on October 7, 2018 (3 weeks posthur-ricane), ranging geographically from the coast to about 100 miles inland. This included 16 flooded and nine unflooded locations (Table S1). While in the field, water samples were taken at publicly accessible locations downstream and as near to the selected farms as possible.
2.2. Sampling and Filtration
The water samples were collected from the 16 flooded and nine unflooded sites within these rural areas of North Carolina on October 7, 2018, after Hurricane Florence (Table S1). Some of the sampling locations were located on the same branch of a river, and some were not connected to any other locations by river flow (Figure S1). In this study, the sampling locations on the same branch were combined into sampling groups, and the other sites were regarded as individual sampling locations. In total, there were five paired sampling groups (flooded and unflooded adjoining locations): U3-F8-F7-F6, U5-F11, U6-F12, U7-F13, and U9-F16. And, there were 13 individual sampling locations (U1, U2, U4, U8, F1, F2, F3, F5, F9, F10, F14, F15, and F17). All unflooded locations were upstream of the flooded locations within the same group. The unflooded location U4 was at the highest geographical elevation and was not located near swine farms. Therefore, U4 data were set to represent the concentration of Salmonella in a natural water body that had not been dis-turbed by swine farm discharge or flooding.
At each site, ∼2 L of water was collected using 38 × 19 cm Whirl-Pak™ Stand-Up Sample Bag (Nasco). The actual volume of each water sample was measured afterward during the filtration step, which var-ied from 0.6 to 2.0 L. The volumes of the majority of the water samples were between 1.6 and 2.0 L. At each location, 2–4 samples (labeled as A, B, C, and D) were collected, depending on the accessibility to the sampling sites. The GPS information (Latitude, Longitude) of each sampling location was recorded together with water sampling at each site (Table S1). The water samples were stored in coolers filled with ice packs during transportation. The water samples were stored at 4°C before filtration. Before filtration, the MgCl2 solution was added to the sample bags to reach a concentration of 25 mmol MgCl2/L water sample (Ahmed et al., 2020; Uprety et al., 2017). Then the sample bags were shaken for 30 min for floc-culation and were then filtered through 1.6 μm glass fiber prefilter (Millipore; Sadik et al., 2017; Uprety et al., 2017). The number of filters used to filter each sample varied depending on the suspended solids load within each sample. Water filters were continuously changed when clogging occurred until the total volume of each sample was filtered. On average, 1.94 filters were used to filter per liter of each water sample. Each filter was then cut into quarters. One quarter was stored at 4°C for Salmonella isolation, one quarter was stored at −80°C for direct DNA extraction, and the remaining two quarters were stored at −80°C for future analysis.
2.3. Quantification of the ttrC Virulence Gene
The S. enterica ttrC gene was quantified by qPCR for each sample. DNA was extracted directly from the filters. For each replicate of different sampling locations, all filters obtained during the filtration step were used for DNA extraction and analysis. The FastDNA SPIN Kit for Soil (MP Biomedicals) was used in this step. The steps were slightly modified, to extract DNA from filters: the homogenization step was
MAO ET AL.
10.1029/2020GH000294
3 of 14
GeoHealth
shortened to 15 s, and the following centrifugation step was elongated to 15 min. In the last step, 100 μL of the DES solution provided by the kit was added to each tube to dissolve the DNA extracts. The DNA extracts were stored at −20°C after extraction. Due to the volume restriction of the extraction kit, up to two quarters of filters were extracted at one time. To be more specific, if a water sample was filtered by more than two filters, those filters would be extracted separately. The concentra-tion of ttrC in the corresponding water sample was then calculated from the weighted average of the concentrations detected in all those separat-ed DNA extracts. The weight was dependent on the number of filters (1 or 2) used in the DNA extract.
Assay designs for the genes targeted in the microfluidic quantitative PCR (mfqPCR) were adapted from previous studies to detect S. enterica ttrC (Ishii et al., 2013, 2014). Standard curves were generated by performing qPCR using serial dilutions (2 × 100 to 2 × 10⁶ copies/μL) of a pool con-taining 23 DNA standards for assay validation before their use in mfqPCR. The lower detection limit of this method is 2 copies/μL DNA extract (Ishii et al., 2013). Calculating back to the water samples, for each DNA extract, the sensitivity of mfqPCR was 800–1,600 copies/L water sample. The se-quence of the DNA standard of ttrC was listed in Table S2. We performed primer BLAST on NCBI website to validate that the DNA sequences cor-responding to the ttrC primers we used in this study were hosted by S. enterica. All DNA samples and standard pool dilutions underwent 14 cycles of standard target amplification (STA) PCR to increase template DNA yields before quantification by mfqPCR. The reaction (5 μL) con-tained 2.5 μL 2X TaqMan PreAmp Master Mix (Thermo Fisher), 0.5 μL 0.2X TaqMan primer-probe mix, and 1.25 μL of template DNA. For the negative control, the 1.25 μL of template DNA was replaced by nucle-ase-free water. Four negative controls were included in every qPCR plate to ensure the lack of cross contamination during sample preparation. The PCR plate was processed with the following thermal cycle on a thermocy-
cler: 95°C for 10 min, 14 cycles of 95°C for 15 s, and 60°C for 4 min. The gene of Pseudogulbenkiania NH8B was used as an internal amplification control in the environmental samples as a means to verify the absence of PCR inhibitors. Amplification of an internal control gene (NH8B) was used to ensure uniform amplifi-cation throughout the plate. This internal amplification control was used in multiple previous studies (Ishii et al., 2013; Sadik et al., 2017; Zhang & Ishii, 2018).
2.4. Salmonella Isolation and DNA Extraction
To further identify antibiotic resistance profiles of Salmonella, we attempted to isolated S. enterica from one of the filter quarters obtained from the step above. For each replicate, the 1/4 filter used for Salmonella isolation was soaked into 10 mL of liquid lysogeny broth (LB) medium in a 15 mL sterilized centrifuge tube. The tube was incubated overnight at 37°C in a shaker. A tube with a clean filter was incubated together with the samples as the field blank control, to indicate the potential contamination from the filters. Another tube without any filter inside was set as the lab-based negative control to indicate the potential contamination from the LB medium and the incubating process. After incubation, 100 μL of media from each sample was spread on a xylose lysine tergitol 4 (XLT4) agar plate (Remel) and incubated overnight. This is a differential medium in which Salmonella colonies will turn black in color (Luo et al., 2014). An uninoculated XLT4 agar plate was incubated together with the plates as the lab-based negative control to indicate the potential contamination during incubation. No Salmonella growth was observed in plate containing media from the field blank control or the lab-based negative control.
To capture the diversity of culturable Salmonella within each sampling location, we harvested four pre-sumed Salmonella colonies, from each replicate sample of a sampling location. The picked colonies were
MAO ET AL.
10.1029/2020GH000294
4 of 14
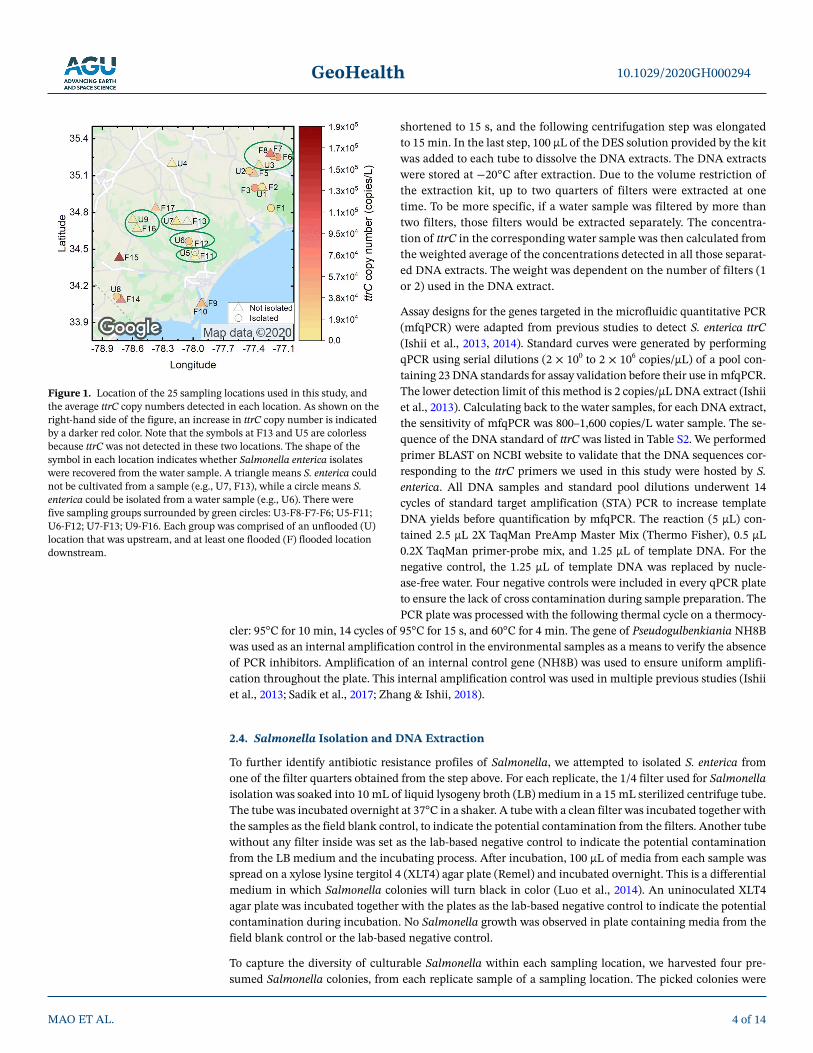
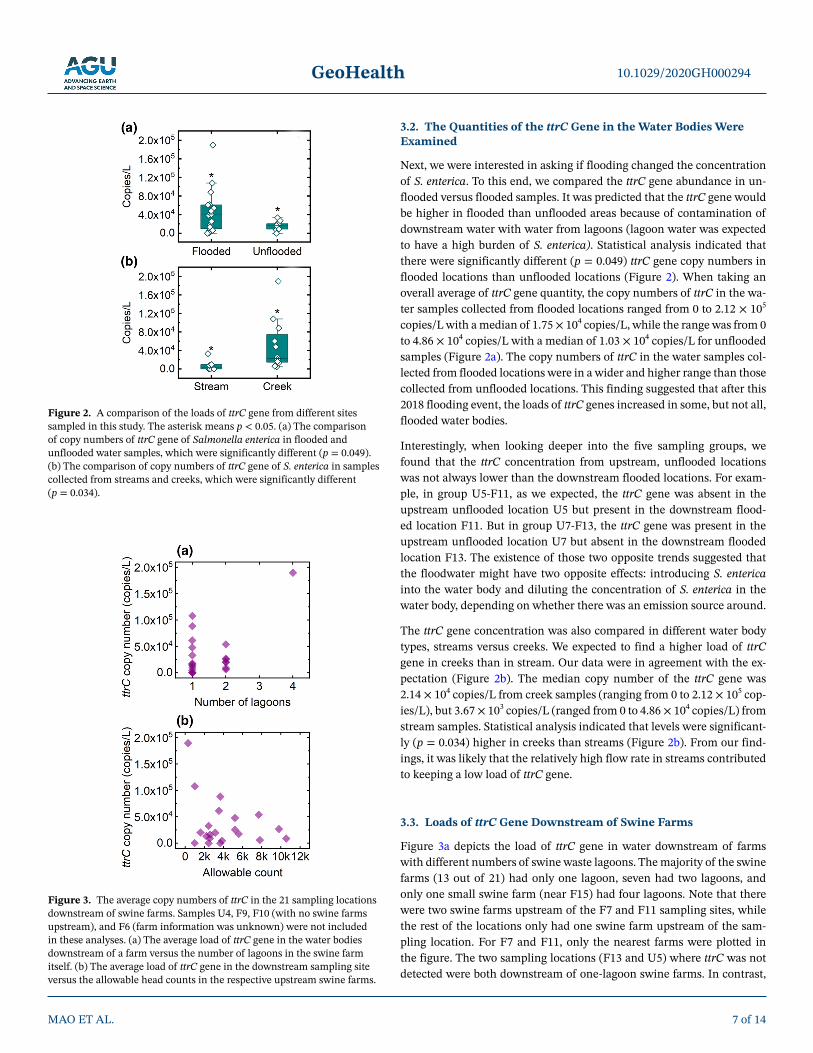
Figure 1. Location of the 25 sampling locations used in this study, and the average ttrC copy numbers detected in each location. As shown on the right-hand side of the figure, an increase in ttrC copy number is indicated by a darker red color. Note that the symbols at F13 and U5 are colorless because ttrC was not detected in these two locations. The shape of the symbol in each location indicates whether Salmonella enterica isolates were recovered from the water sample. A triangle means S. enterica could not be cultivated from a sample (e.g., U7, F13), while a circle means S. enterica could be isolated from a water sample (e.g., U6). There were five sampling groups surrounded by green circles: U3-F8-F7-F6; U5-F11; U6-F12; U7-F13; U9-F16. Each group was comprised of an unflooded (U) location that was upstream, and at least one flooded (F) flooded location downstream.
GeoHealth
then enriched in 100 μL LB medium under 37°C in a shaker for overnight. After that, the enriched Salmo-nella colony was mixed with 100 μL sterile glycerol and kept at −80°C pending DNA extraction. For DNA extraction, all selected isolates (n = 40) were enriched overnight at 37°C in LB medium. DNA was isolated from 1.0 mL overnight cultures using the GenFind V2 extraction kit (Beckman Coulter Life Sciences) ac-cording to the manufacturer's protocol. The concentration of isolated DNA was measured using the Nan-oDrop spectrophotometer (NanoDrop Technologies) and then stored at −20°C, pending further analysis. All selected colonies were further confirmed as S. enterica using 16S rRNA gene sequencing. The extract-ed DNA from each isolate was used for PCR amplification using universal 16S rRNA primers (Universal 1492r; GGY TAC CTT GTT ACG ACT T and Bacterial 27F; AGR GTT TGA TYM TGG CTC AG) (Farris & Olson, 2007; Lee et al., 2003). The isolated PCR products were purified and sequenced at the Roy J. Carver Biotechnology Center at University of Illinois at Urbana-Champaign, Illinois, USA. Then the sequences were aligned using the Clustal W program and compared with known 16S rRNA gene sequences in the GenBank database.
2.5. Quantification of ARGs in Salmonella Isolates
mfqPCR was used to investigate the ARG profiles of the Salmonella isolates. We chose to analyze 32 of the 40 Salmonella colonies for ARG profile analysis. Sixteen of these were from samples from flooded locations, and the remaining 16 were from unflooded locations. Two colonies from F6 and two colonies from F7 were not analyzed because these two locations were spatially close to each other and were interconnected by wa-ter flow. To keep the number of the colonies from unflooded samples the same as the number of those from flooded samples, four colonies from U1, U2, U6, and U8 were not processed for ARG analysis. The DNA concentrations of the eight colonies removed from this analysis were the lowest compared to the rest of the colonies from the same site to ensure the ARGs would be detected to the greatest extent. The DNA samples for mfqPCR were diluted 10-fold to reduce the concentration of PCR inhibitors. Each sample was run in an experimental duplicate. The detailed information of the primers used in mfqPCR was listed in Table S2 (Zhu et al., 2013). STA, exonuclease treatment, and mfqPCR were performed successively to enrich the DNA, remove the excess reagent, and quantify the genes, respectively. mfqPCR for ARGs detection was per-formed using Fluidigm 96.96. Gene Expression IFC (Fluidigm) with the Fluidigm Biomark HD Real-Time PCR device (Fluidigm). The volumes of the reagents added in each reaction and the thermal conditions are listed in Table S3. After mfqPCR, the data were analyzed using Fluidigm Real-Time PCR Analysis Software (Version 4.5.2).
In total, 95 different sequences of 75 ARGs and one 16S rRNA gene were targeted in the mfqPCR (Ta-ble S2), including 36 aminoglycoside resistance genes, 25 macrolide-lincosamide-streptogramin B (MLSB) resistance genes, and 34 beta-lactam resistance genes. The three classes of ARGs were selected based on the results of the minimum inhibitory concentration experiment in another study in the same project, in which the Salmonella isolates showed resistance to antibiotics including gentamicin (aminoglycoside), penicillin (beta-lactam), and erythromycin (MLSB) (data are not shown). The ARG primer sets were ob-tained from a previous study (Zhu et al., 2013). Calibration curves were created to validate the amplifica-tion efficiencies of the primers and used as a positive control. Before conducting mfqPCR, we conducted regular qPCR experiments to determine what samples to use for making those calibration curves. Based on these qPCR results, we used a 1:1:1 mixture of DNA from immature swine mortality compost, pooled swine manure, and pooled DNA extracts of S. enterica isolates obtained in this study to ensure that as many ARGs could be quantified as possible. Specifically, the DNA extracted from the immature swine mortality compost contained 77 of the 95 targeted genes. A 1:1 mixture of the immature swine mortality compost DNA sample and the pooled pig manure DNA sample contained 81 of the 95 ARGs. The pooled DNA extracts of the S. enterica isolates were also included in this mixture because there was a possibility that several ARGs were present in the S. enterica isolates but absent in the compost or manure samples. This calibration curve was used to determine the amplification efficiencies of different primers during the qPCR run, as reported in Table S2. The calibration sample was serially diluted by 3-fold each time to obtain 7 data points for each curve. The CT value of the 16S rRNA gene in each sample was also checked before data analysis, in order to ensure that the DNA sample was successfully amplified. We used three criteria for primer validation: 1) The amplification efficiency was between 90% and 110% (J. Q. Su et al., 2015); 2) The R2 value for the calibration curve was no less than 0.99; and 3) There were at least 3 data points to fit
MAO ET AL.
10.1029/2020GH000294
5 of 14
GeoHealth
the calibration curve. If a primer set met all the three criteria listed above, the corresponding ARG would be considered as “quantifiable.” The abundance of the ARG relatively quantified by the equation below (Schmittgen & Livak, 2008):
16 ARGRelative abundance 2 .
C CT TS
Compared to the quantifiable ARGs, the rest of the ARGs did not show a good amplification efficiency in the calibration curve. However, the CT values of a part of those ARGs were smaller than the detection limit CT value of 29 in both replicates of the sample, but the same ARGs were not detected in the blank control. Though those ARGs were not quantifiable, we would consider them as “positive” in the sample. Two ARG sequences (aac(6')-Ib and aadA1) were not analyzed because of the strong fluorescence signals in the corre-sponding blank controls. In total, there were 30 ARG primer sets validated to be quantifiable in this study, and 63 different ARG sequences were detected in at least one sample.
2.6. Statistical Analysis
The copy numbers of the ttrC gene in all replicates collected from different sampling locations were organized into groups by different criteria of classification, including 1) flooded (n = 47) and unflooded (n = 22); 2) river, stream (n = 12), creek (n = 35), ditch, pond, inlet, and bay. Shapiro-Wilk normality test was performed for all groups of data to determine the proper test to use. Because the distributions of the copy numbers of ttrC under these classifications did not follow a normal distribution, Kolmogo-rov-Smirnov test was used for both tests. Because the numbers of the samples collected from the river, ditch, pond, inlet, and bay were small, we did not include them in the comparison of different water bodies. Kruskal-Wallis ANOVA was performed to determine the difference in the relative abundances of different ARGs in the S. enterica isolates. Cluster analysis among the ARG profiles in the 32 S. enterica isolates was performed using the OriginPro application “Heat Map with Dendrogram.” All statistical analyses were conducted in OriginPro 2020 SR1.
3. Results3.1. The Virulence Gene ttrC of S. enterica Was Prevalent in the Sampling Region
The first step in this study was to identify the distribution of the ttrC gene from environmental samples as an indicator of a possible fate of a pathogen during the inundation of floodwaters. The methodology used to identify sites for samples is discussed in Section 2. Water samples from each location were processed, and each sample was examined for the presence of S. enterica by qPCR of the ttrC gene and by attempting to culture S. enterica from the sample. Results are shown in Figure 1.
mfqPCR detected the S. enterica ttrC gene in at least one replicate from 23 of the 25 sampling locations (Figure 1). The two locations in which ttrC was not detectable were one flooded (F13) and one unflood-ed (U5) location. Thus, S. enterica appeared to be prevalent in this region. Location U4 was not flooded and was at the highest geographical elevation of all samples (Figure S1), and was not located near swine farms. Therefore, the average load of ttrC gene at U4 represented the concentration of Salmonella (an average of 7.27 × 10³ copies/L, with one negative replicate and two positive replicates of 7.49 × 10³ and 7.05 × 10³ copies/L) in a natural water body that had not been disturbed by swine farms or flooding. Interestingly, the value we obtained at U4 was similar to that reported by Li et al. (2015) for Salmonella colony forming units (CFUs) (8.59 × 101–1.68 × 10⁴ CFU/L) in rivers and canals in Singapore. However, loads of ttrC gene in 19 of the other 24 locations were greater than that obtained from U4 (Figure 1). The five locations with lower ttrC copy numbers than U4 were: F1, F11, F12, F13, and U5. For our purposes, samples with ttrC copy load lower than those from U4 were considered not contaminated by S. enterica during this flooding event and were at or below what would be considered a background level for a nat-ural aquatic ecosystem.
MAO ET AL.
10.1029/2020GH000294
6 of 14
GeoHealth
3.2. The Quantities of the ttrC Gene in the Water Bodies Were Examined
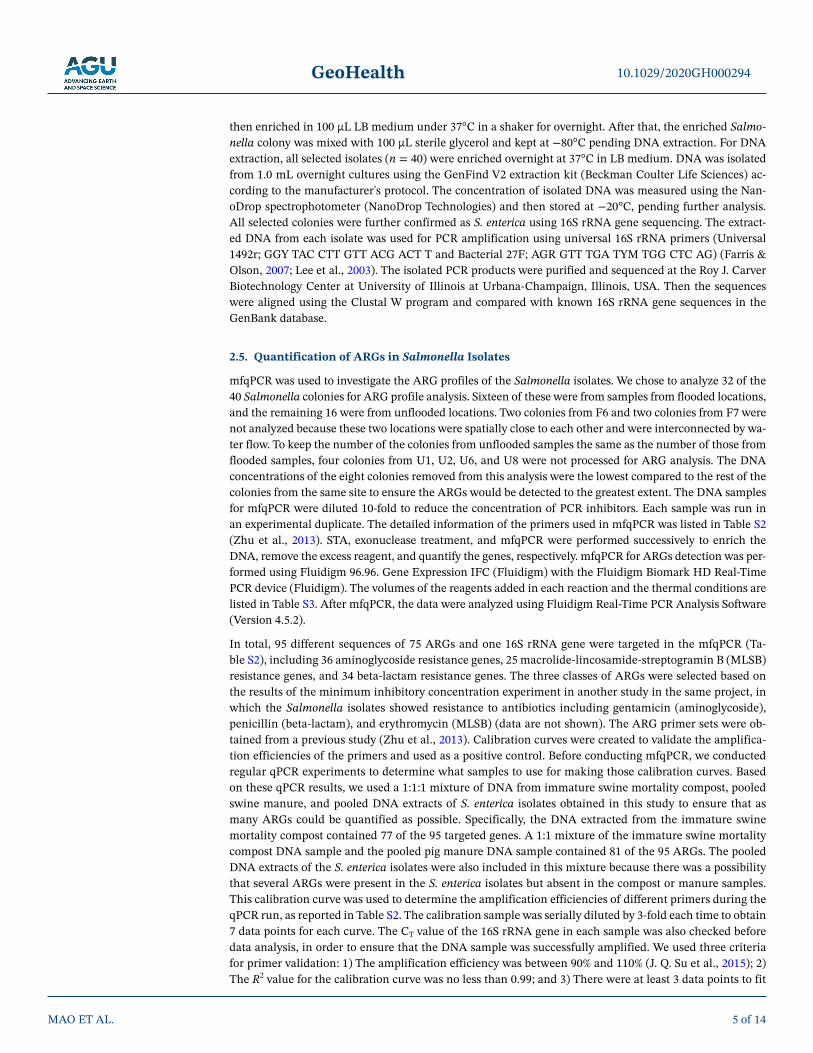
Next, we were interested in asking if flooding changed the concentration of S. enterica. To this end, we compared the ttrC gene abundance in un-flooded versus flooded samples. It was predicted that the ttrC gene would be higher in flooded than unflooded areas because of contamination of downstream water with water from lagoons (lagoon water was expected to have a high burden of S. enterica). Statistical analysis indicated that there were significantly different (p = 0.049) ttrC gene copy numbers in flooded locations than unflooded locations (Figure 2). When taking an overall average of ttrC gene quantity, the copy numbers of ttrC in the wa-ter samples collected from flooded locations ranged from 0 to 2.12 × 10⁵ copies/L with a median of 1.75 × 10⁴ copies/L, while the range was from 0 to 4.86 × 10⁴ copies/L with a median of 1.03 × 10⁴ copies/L for unflooded samples (Figure 2a). The copy numbers of ttrC in the water samples col-lected from flooded locations were in a wider and higher range than those collected from unflooded locations. This finding suggested that after this 2018 flooding event, the loads of ttrC genes increased in some, but not all, flooded water bodies.
Interestingly, when looking deeper into the five sampling groups, we found that the ttrC concentration from upstream, unflooded locations was not always lower than the downstream flooded locations. For exam-ple, in group U5-F11, as we expected, the ttrC gene was absent in the upstream unflooded location U5 but present in the downstream flood-ed location F11. But in group U7-F13, the ttrC gene was present in the upstream unflooded location U7 but absent in the downstream flooded location F13. The existence of those two opposite trends suggested that the floodwater might have two opposite effects: introducing S. enterica into the water body and diluting the concentration of S. enterica in the water body, depending on whether there was an emission source around.
The ttrC gene concentration was also compared in different water body types, streams versus creeks. We expected to find a higher load of ttrC gene in creeks than in stream. Our data were in agreement with the ex-pectation (Figure 2b). The median copy number of the ttrC gene was 2.14 × 10⁴ copies/L from creek samples (ranging from 0 to 2.12 × 10⁵ cop-ies/L), but 3.67 × 10³ copies/L (ranged from 0 to 4.86 × 10⁴ copies/L) from stream samples. Statistical analysis indicated that levels were significant-ly (p = 0.034) higher in creeks than streams (Figure 2b). From our find-ings, it was likely that the relatively high flow rate in streams contributed to keeping a low load of ttrC gene.
3.3. Loads of ttrC Gene Downstream of Swine Farms
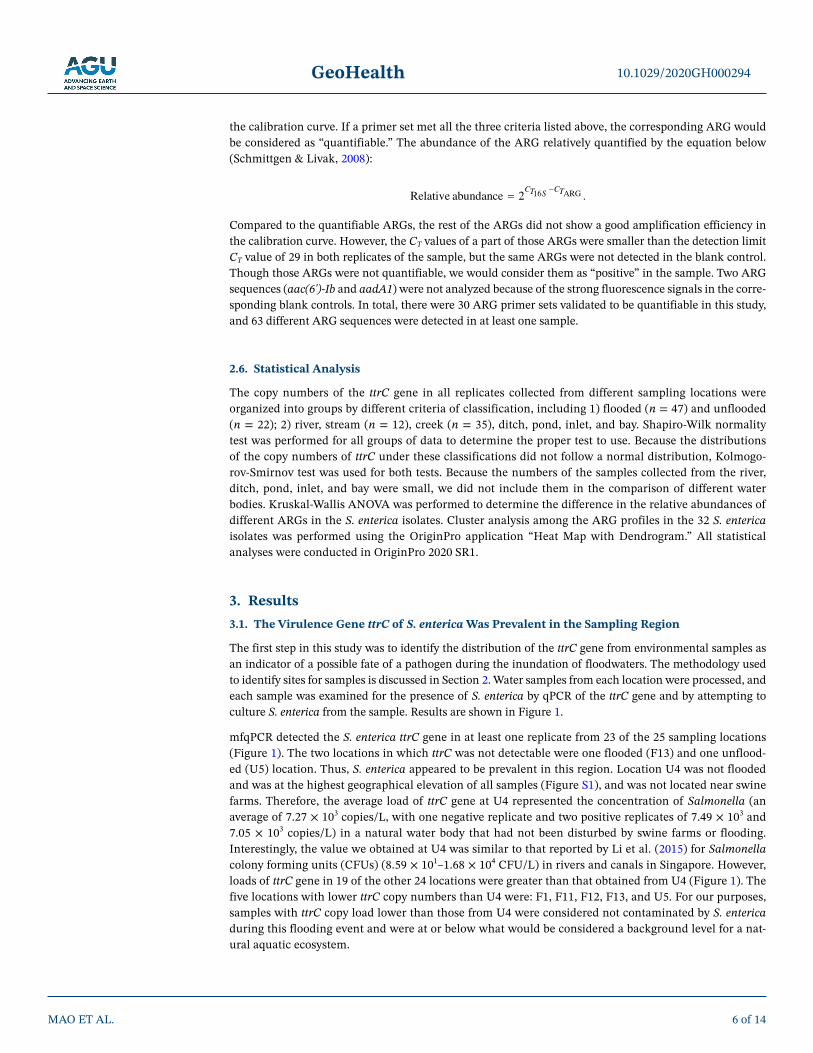
Figure 3a depicts the load of ttrC gene in water downstream of farms with different numbers of swine waste lagoons. The majority of the swine farms (13 out of 21) had only one lagoon, seven had two lagoons, and only one small swine farm (near F15) had four lagoons. Note that there were two swine farms upstream of the F7 and F11 sampling sites, while the rest of the locations only had one swine farm upstream of the sam-pling location. For F7 and F11, only the nearest farms were plotted in the figure. The two sampling locations (F13 and U5) where ttrC was not detected were both downstream of one-lagoon swine farms. In contrast,
MAO ET AL.
10.1029/2020GH000294
7 of 14
Figure 2. A comparison of the loads of ttrC gene from different sites sampled in this study. The asterisk means p < 0.05. (a) The comparison of copy numbers of ttrC gene of Salmonella enterica in flooded and unflooded water samples, which were significantly different (p = 0.049). (b) The comparison of copy numbers of ttrC gene of S. enterica in samples collected from streams and creeks, which were significantly different (p = 0.034).
Figure 3. The average copy numbers of ttrC in the 21 sampling locations downstream of swine farms. Samples U4, F9, F10 (with no swine farms upstream), and F6 (farm information was unknown) were not included in these analyses. (a) The average load of ttrC gene in the water bodies downstream of a farm versus the number of lagoons in the swine farm itself. (b) The average load of ttrC gene in the downstream sampling site versus the allowable head counts in the respective upstream swine farms.
GeoHealth
the F15 site, which had the highest load of ttrC gene, was downstream of the swine farm possessing four lagoons. However, several one-lagoon swine farms also had higher levels of ttrC (greater than 3 × 10⁴ cop-ies/L) at their downstream water bodies (F3, F8, F14, F17, and U6) than the rest of the one-lagoon swine farms (Figure 3a). Those findings suggested that the inundation of some swine farm lagoons might have contributed to the increased ttrC copy numbers at some downstream water bodies during this 2018 flood event. One possible interpretation is that fewer lagoons in the farm may reduce the probability of the likeli-hood of Salmonella spread during flooding.
Figure 3b examined the effect of the size of the swine farm (in terms of livestock head count) on the load of ttrC in downstream water samples. Downstream samples from a majority of the small swine farms in this area (as defined as allowable head counts < 4,000) had low ttrC copy load (lower than 5 × 10⁴ copies/L). However, a few small farms with allowable head counts lower than 4,000 had high ttrC copy numbers (> 6 × 10⁴ copies/L) at the downstream water bodies (Figure 3b). The two sampling locations with ttrC copy numbers greater than 105 copies/L were both downstream of small swine farms (allowable head counts were no larger than 1,000). Only one large farm with allowable head count equal to 7,680 had ttrC copy number greater than 5 × 10⁴ copies/L at its downstream water body. Such findings suggested that if not managed properly, the ttrC copy numbers at the downstream water bodies of small swine farms might be-come greater than those at the downstream water bodies of large swine farms after a flood event.
3.4. Culturable S. enterica Was Less Prevalent Than ttrC
While mfqPCR quantifies the S. enterica ttrC gene load, it cannot identify if these genes are from viable, metabolically active bacteria. To identify viable bacteria, a portion of the filter from each water sample was used as a source for attempted growth of S. enterica by using traditional culture methods, streaking a por-tion of the sample for isolation on XLT4 agar. All S. enterica isolates from flooded and unflooded locations were found to be phylogenetically and genetically identical, based on a phylogeny tree generated by the identification of whole-genome single nucleotide polymorphism-based analysis of all 40 isolates. In all 25 sampling locations, S. enterica was only isolated from 10 locations (Figure 1).
The locations in which S. enterica were isolated included five flooded locations (F1, F3, F6, F7, and F12) and five unflooded locations (U1, U2, U5, U6, and U8). Overall, our results suggested that the culturable S. enterica was less prevalent than the S. enterica ttrC in water bodies after a flooding event in this region. The 10 locations with S. enterica isolated included three streams, four creeks, two ditches, and one pond. How-ever, due to the limited sampling, we cannot conclude whether there was a preferred type of water body for S. enterica growth. These findings suggest that the isolation of culturable S. enterica was not directly related to the copy number of the ttrC gene as other researchers (Gedalanga & Olson, 2009) have reported similar finding that high gene copy numbers do not relate to culturability. Even though some locations obtained a high copy number of ttrC (for example, F8, F14, and F15), the host cells of this gene might be nonculturable or the genes may exist outside the cells.
3.5. ARGs Were Prevalent in the S. enterica Isolates Obtained From This Region
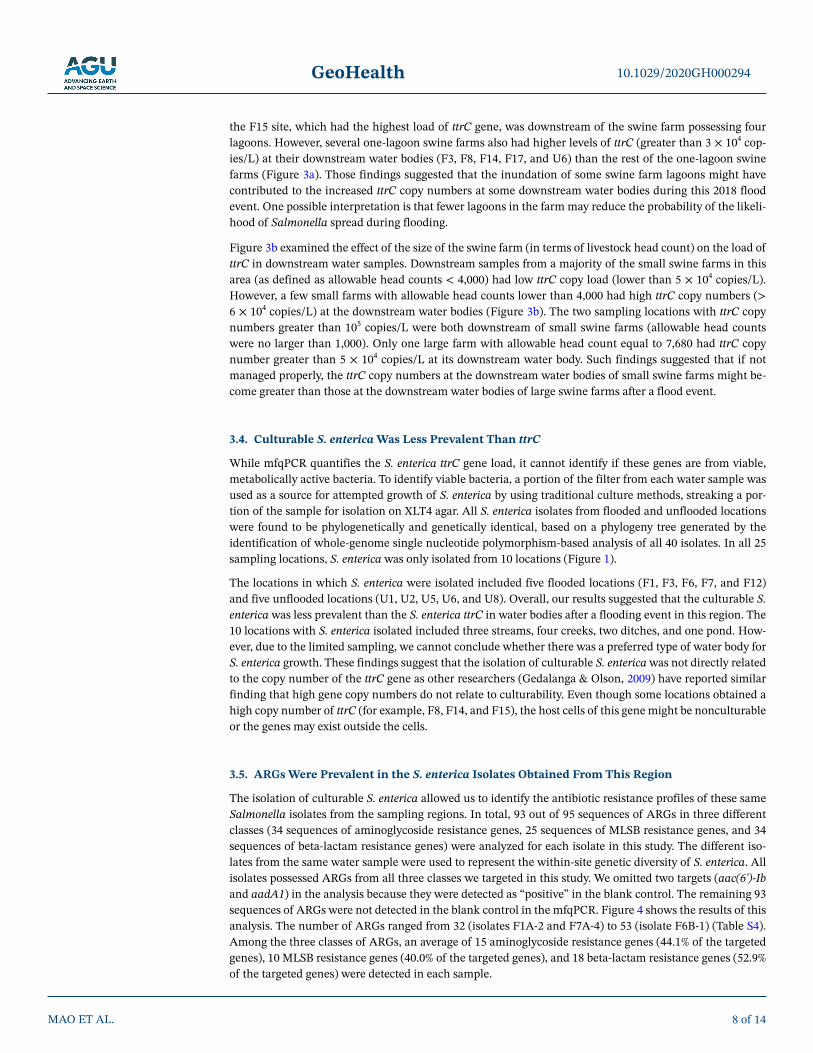
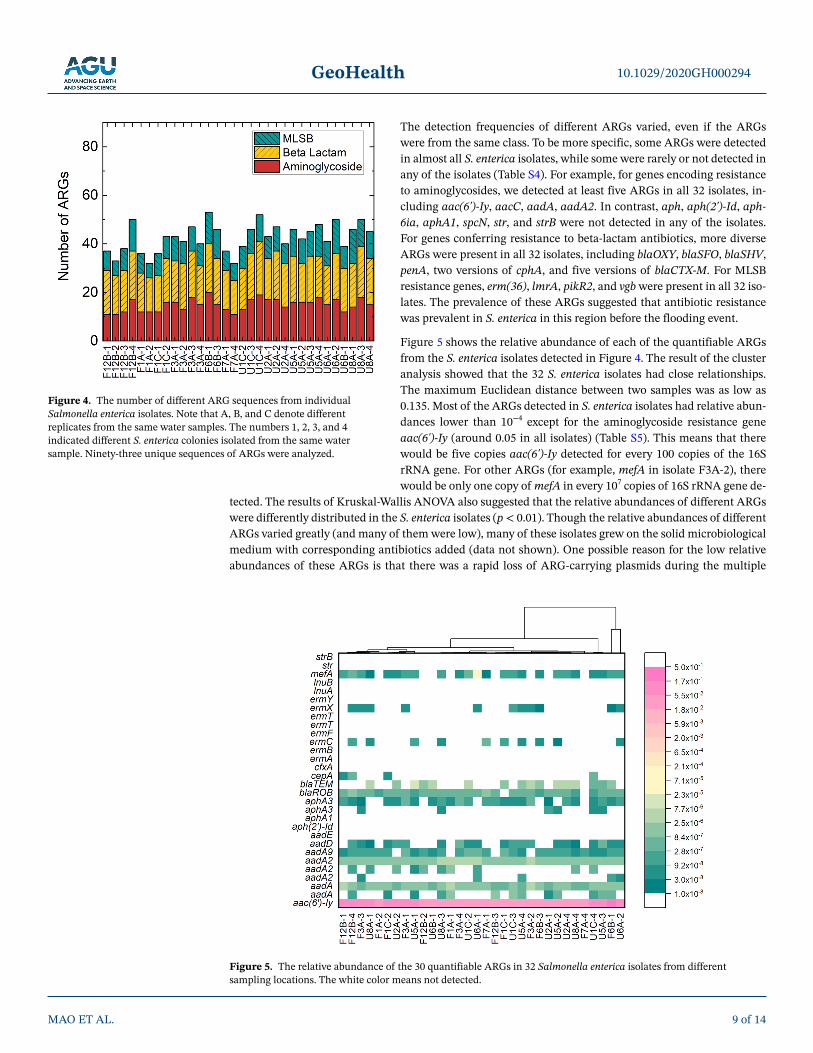
The isolation of culturable S. enterica allowed us to identify the antibiotic resistance profiles of these same Salmonella isolates from the sampling regions. In total, 93 out of 95 sequences of ARGs in three different classes (34 sequences of aminoglycoside resistance genes, 25 sequences of MLSB resistance genes, and 34 sequences of beta-lactam resistance genes) were analyzed for each isolate in this study. The different iso-lates from the same water sample were used to represent the within-site genetic diversity of S. enterica. All isolates possessed ARGs from all three classes we targeted in this study. We omitted two targets (aac(6')-Ib and aadA1) in the analysis because they were detected as “positive” in the blank control. The remaining 93 sequences of ARGs were not detected in the blank control in the mfqPCR. Figure 4 shows the results of this analysis. The number of ARGs ranged from 32 (isolates F1A-2 and F7A-4) to 53 (isolate F6B-1) (Table S4). Among the three classes of ARGs, an average of 15 aminoglycoside resistance genes (44.1% of the targeted genes), 10 MLSB resistance genes (40.0% of the targeted genes), and 18 beta-lactam resistance genes (52.9% of the targeted genes) were detected in each sample.
MAO ET AL.
10.1029/2020GH000294
8 of 14
GeoHealth
The detection frequencies of different ARGs varied, even if the ARGs were from the same class. To be more specific, some ARGs were detected in almost all S. enterica isolates, while some were rarely or not detected in any of the isolates (Table S4). For example, for genes encoding resistance to aminoglycosides, we detected at least five ARGs in all 32 isolates, in-cluding aac(6')-Iy, aacC, aadA, aadA2. In contrast, aph, aph(2')-Id, aph-6ia, aphA1, spcN, str, and strB were not detected in any of the isolates. For genes conferring resistance to beta-lactam antibiotics, more diverse ARGs were present in all 32 isolates, including blaOXY, blaSFO, blaSHV, penA, two versions of cphA, and five versions of blaCTX-M. For MLSB resistance genes, erm(36), lmrA, pikR2, and vgb were present in all 32 iso-lates. The prevalence of these ARGs suggested that antibiotic resistance was prevalent in S. enterica in this region before the flooding event.
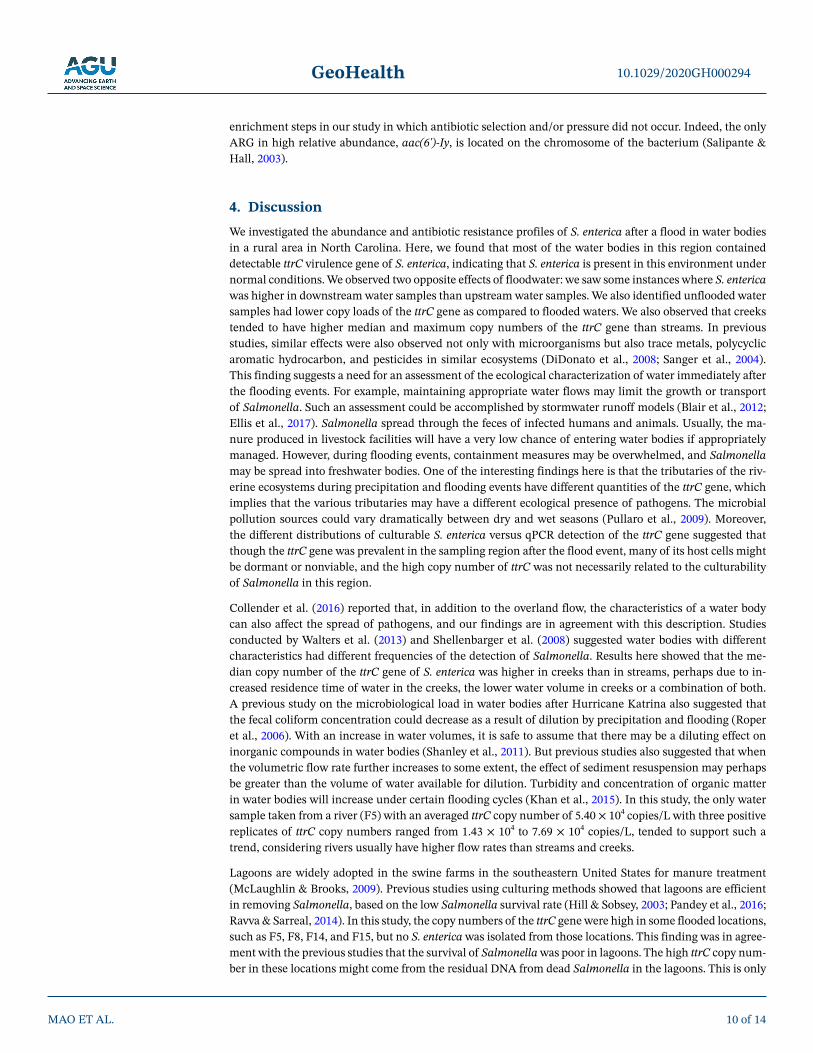
Figure 5 shows the relative abundance of each of the quantifiable ARGs from the S. enterica isolates detected in Figure 4. The result of the cluster analysis showed that the 32 S. enterica isolates had close relationships. The maximum Euclidean distance between two samples was as low as 0.135. Most of the ARGs detected in S. enterica isolates had relative abun-dances lower than 10−4 except for the aminoglycoside resistance gene aac(6')-Iy (around 0.05 in all isolates) (Table S5). This means that there would be five copies aac(6')-Iy detected for every 100 copies of the 16S rRNA gene. For other ARGs (for example, mefA in isolate F3A-2), there would be only one copy of mefA in every 107 copies of 16S rRNA gene de-
tected. The results of Kruskal-Wallis ANOVA also suggested that the relative abundances of different ARGs were differently distributed in the S. enterica isolates (p < 0.01). Though the relative abundances of different ARGs varied greatly (and many of them were low), many of these isolates grew on the solid microbiological medium with corresponding antibiotics added (data not shown). One possible reason for the low relative abundances of these ARGs is that there was a rapid loss of ARG-carrying plasmids during the multiple
MAO ET AL.
10.1029/2020GH000294
9 of 14
Figure 4. The number of different ARG sequences from individual Salmonella enterica isolates. Note that A, B, and C denote different replicates from the same water samples. The numbers 1, 2, 3, and 4 indicated different S. enterica colonies isolated from the same water sample. Ninety-three unique sequences of ARGs were analyzed.
Figure 5. The relative abundance of the 30 quantifiable ARGs in 32 Salmonella enterica isolates from different sampling locations. The white color means not detected.
GeoHealth
enrichment steps in our study in which antibiotic selection and/or pressure did not occur. Indeed, the only ARG in high relative abundance, aac(6')-Iy, is located on the chromosome of the bacterium (Salipante & Hall, 2003).
4. DiscussionWe investigated the abundance and antibiotic resistance profiles of S. enterica after a flood in water bodies in a rural area in North Carolina. Here, we found that most of the water bodies in this region contained detectable ttrC virulence gene of S. enterica, indicating that S. enterica is present in this environment under normal conditions. We observed two opposite effects of floodwater: we saw some instances where S. enterica was higher in downstream water samples than upstream water samples. We also identified unflooded water samples had lower copy loads of the ttrC gene as compared to flooded waters. We also observed that creeks tended to have higher median and maximum copy numbers of the ttrC gene than streams. In previous studies, similar effects were also observed not only with microorganisms but also trace metals, polycyclic aromatic hydrocarbon, and pesticides in similar ecosystems (DiDonato et al., 2008; Sanger et al., 2004). This finding suggests a need for an assessment of the ecological characterization of water immediately after the flooding events. For example, maintaining appropriate water flows may limit the growth or transport of Salmonella. Such an assessment could be accomplished by stormwater runoff models (Blair et al., 2012; Ellis et al., 2017). Salmonella spread through the feces of infected humans and animals. Usually, the ma-nure produced in livestock facilities will have a very low chance of entering water bodies if appropriately managed. However, during flooding events, containment measures may be overwhelmed, and Salmonella may be spread into freshwater bodies. One of the interesting findings here is that the tributaries of the riv-erine ecosystems during precipitation and flooding events have different quantities of the ttrC gene, which implies that the various tributaries may have a different ecological presence of pathogens. The microbial pollution sources could vary dramatically between dry and wet seasons (Pullaro et al., 2009). Moreover, the different distributions of culturable S. enterica versus qPCR detection of the ttrC gene suggested that though the ttrC gene was prevalent in the sampling region after the flood event, many of its host cells might be dormant or nonviable, and the high copy number of ttrC was not necessarily related to the culturability of Salmonella in this region.
Collender et al. (2016) reported that, in addition to the overland flow, the characteristics of a water body can also affect the spread of pathogens, and our findings are in agreement with this description. Studies conducted by Walters et al. (2013) and Shellenbarger et al. (2008) suggested water bodies with different characteristics had different frequencies of the detection of Salmonella. Results here showed that the me-dian copy number of the ttrC gene of S. enterica was higher in creeks than in streams, perhaps due to in-creased residence time of water in the creeks, the lower water volume in creeks or a combination of both. A previous study on the microbiological load in water bodies after Hurricane Katrina also suggested that the fecal coliform concentration could decrease as a result of dilution by precipitation and flooding (Roper et al., 2006). With an increase in water volumes, it is safe to assume that there may be a diluting effect on inorganic compounds in water bodies (Shanley et al., 2011). But previous studies also suggested that when the volumetric flow rate further increases to some extent, the effect of sediment resuspension may perhaps be greater than the volume of water available for dilution. Turbidity and concentration of organic matter in water bodies will increase under certain flooding cycles (Khan et al., 2015). In this study, the only water sample taken from a river (F5) with an averaged ttrC copy number of 5.40 × 10⁴ copies/L with three positive replicates of ttrC copy numbers ranged from 1.43 × 10⁴ to 7.69 × 10⁴ copies/L, tended to support such a trend, considering rivers usually have higher flow rates than streams and creeks.
Lagoons are widely adopted in the swine farms in the southeastern United States for manure treatment (McLaughlin & Brooks, 2009). Previous studies using culturing methods showed that lagoons are efficient in removing Salmonella, based on the low Salmonella survival rate (Hill & Sobsey, 2003; Pandey et al., 2016; Ravva & Sarreal, 2014). In this study, the copy numbers of the ttrC gene were high in some flooded locations, such as F5, F8, F14, and F15, but no S. enterica was isolated from those locations. This finding was in agree-ment with the previous studies that the survival of Salmonella was poor in lagoons. The high ttrC copy num-ber in these locations might come from the residual DNA from dead Salmonella in the lagoons. This is only
MAO ET AL.
10.1029/2020GH000294
10 of 14
GeoHealth
a hypothesis since we did not take samples from lagoons in the swine farms in this study. Future studies should examine hog lagoons, in addition to downstream locations, to further assess these reported effects of increased gene prevalence due to lower survival rates in hog lagoons. The results of this study may also be applicable to residential stormwater ponds, as suggested in a previous study (Cotti-Rausch et al., 2019).
Lambirth et al. (2018) used shotgun metagenomics sequencing to show a lower concentration of ARGs in samples collected from streams in the remote parts of North Carolina as compared with those from locations in the urban areas. Casanova and Sobsey (2016) also found an antibiotic resistance phenotype in only 28% of the Salmonella isolates collected from surface water remote from hog production sites in North Carolina. These previous studies showed a low prevalence of antibiotic resistance Salmonella phenotypes and genes in water samples from locations not impacted by human activities. In contrast, S. enterica Serotype Derby isolated from human clinical, pigs and farm samples in North Carolina was prevalent and shared similar antibiotic resistance phenotypes (Keelara et al., 2014). Previous studies revealed that the aquatic bodies, including lakes, rivers, and streams can serve as a natural reservoir of antibiotic resistance, stimulate their transfer into pathogens and to the surrounding environment (Berkner et al., 2014; Michael et al., 2013). In our study, we targeted 93 ARGs in Salmonella isolates in samples collected from a region with high con-centrations of swine farms. In agreement with the previous studies, we also found high levels of antibiotic resistance in these S. enterica isolates. We also found that ARG profiles of S. enterica isolates cultured from both flooded and unflooded samples were similar, suggesting that the 2018 flooding did not spread ARG detected in S. enterica isolates. This finding is consistent with the study conducted by Song et al. (2018), which found that antibiotic resistance was prevalent in Salmonella spp. in flooded human-made rivers. In addition, when there is an abrupt change that makes the environmental condition to be a “bottleneck” for a certain population, the genetic diversity within this population may decrease (Lanfear et al., 2014). Though there were several previous studies that observed an increased diversity in Salmonella serotypes after ex-treme rain events (Bergholz et al., 2016; Song et al., 2018), the low Salmonella diversity observed in this study was in agreement with the study conducted by Walters et al. (2013), which shows that the sequence types of S. enterica collected during wet seasons are more similar as compared to dry seasons. The flood event caused by Hurricane Florence played a role of an abrupt change in environmental conditions, and the Salmonella diversity within this sampling region might decrease along with this change.
Among all ARGs detected in this study, the aminoglycoside resistance gene aac(6')-Iy had a much higher relative abundance than the other ARGs. The aac(6')-Iy gene is located on the chromosome of S. enterica and S. enteritidis. But the existence of the aac(6')-Iy gene is not equivalent to the aminoglycoside resistance phenotype. The aac(6')-Iy gene in some strains needs to be activated to express the resistance (Magnet et al., 1999). Compared to the aac(6')-Iy gene, the other ARGs detected in this study were all in low relative abundances. But the S. enterica cells isolated in this study proliferated in a medium containing antibiot-ics (data not shown). As mentioned before, aac(6')-Iy is an ARG located on chromosomes (Salipante & Hall, 2003). As such, it is less likely to be lost during cell amplification as compared to ARGs located on plasmids. Plasmid loss happens in low probability during cultivation, but plasmid-free cells usually have advantages in growth rate (Wein et al., 2019) because, in most of the cases, the existence of plasmids in-creases the metabolic burden to the cell (San Millan & MacLean, 2017). As a result, though there were very few plasmid-free cells at the beginning of the cultivation, these cells might become dominant at the end of cultivation. In this study here, multiple enrichment steps using liquid LB medium lacking antibiot-ics were used to get abundant cells for DNA extraction. The enrichment steps included the initial enrich-ment of all bacteria from the filter, the enrichment of the single colony before storing in glycerol, and the final enrichment from the glycerol stock before DNA extraction. These multiple enrichment steps may increase the chance of plasmid loss. Therefore, it was possible that the relative abundance than the ARGs located on plasmids quickly decreased during these steps. The ARGs shown in Figure 5, including aadA, aadA2, aadA9, aphA3, blaTEM, blaROB, ermX, and ermC, are known to be located on plasmids (Kadlec et al., 2019; Magrini et al., 1998; Nirdnoy et al., 2005; Rosato et al., 2001; Shivakumar & Dubnau, 1981; Singh et al., 2018). Though less common than the ARGs mentioned above, mefA was also reported possible to be located on plasmids (Yang et al., 2014). Therefore, the relative abundance obtained in this study suggested the location and the mobility of the targeted ARGs within the isolated S. enterica cells. Information loss due to enrichment of certain genetic features during bacteria isolation can be avoided in future studies by ap-plying techniques such as single-cell sequencing can be adopted in future studies (Blainey & Quake, 2014).
MAO ET AL.
10.1029/2020GH000294
11 of 14
GeoHealth
5. ConclusionsIn summary, the virulence gene ttrC of S. enterica was detectable throughout the sampling region in North Carolina after Hurricane Florence. Flooded water bodies and water bodies with relatively low flow rates like creeks tend to have a higher maximum value of the copy number of the ttrC gene. However, the high copy number of ttrC was not correlated to the culturability of S. enterica. Culturable S. enterica was not as prevalent in samples as the ttrC gene, and S. enterica was culturable from the same samples that possessed with low ttrC concentrations. The above findings suggested that though S. enterica was prevalent in this North Carolina rural region, the majority of DNA came from either dormant or nonviable bacteria. Though unflooded streams would have a lower risk of total Salmonella exposure after flood events, the water bodies with culturable S. enterica but low-level ttrC also require attention. Antibiotic resistance was prevalent in the Salmonella isolates throughout the sampling region after the flood event. It is expected that the results of this study will contribute to the future outlook of predicting and modeling the transmission of pathogens in rural areas after flood events. Because the results presented here showed that the unflooded water bodies had lower S. enterica load than flooded water bodies, and streams had lower S. enterica load than creeks, we suggest that the risk will be lower for farms located near streams as compared to those near the creeks.
Conflict of InterestThe authors declare no conflicts of interest relevant to this study.
Data Availability StatementAll data are available in the supporting information and http://dx.doi.org/10.17632/nw7yr4zycr.1.
ReferencesAhmed, W., Bertsch, P. M., Bivins, A., Bibby, K., Farkas, K., Gathercole, A., et al. (2020). Comparison of virus concentration methods for
the RT-qPCR-based recovery of murine hepatitis virus, a surrogate for SARS-CoV-2 from untreated wastewater. Science of the Total Environment, 739, 139960. https://doi.org/10.1016/j.scitotenv.2020.139960
Arnell, N. W., & Gosling, S. N. (2016). The impacts of climate change on river flood risk at the global scale. Climatic Change, 134(3), 387–401. https://doi.org/10.1007/s10584-014-1084-5
Bergholz, P., Strawn, L. K., Ryan, G., Warchocki, S., & Wiedmann, M. (2016). Spatiotemporal analysis of microbiological contamination in New York state produce fields following extensive flooding from Hurricane Irene, August 2011. Journal of Food Protection, 79(3), 384–391. https://doi.org/10.4315/0362-028X.JFP-15-334
Berkner, S., Konradi, S., & Schönfeld, J. (2014). Antibiotic resistance and the environment – There and back again. EMBO Reports, 15(7), 740–744. https://doi.org/10.15252/embr.201438978
Bissett, W., Huston, C., & Navarre, C. B. (2018). Preparation and response for flooding events in beef cattle. Veterinary Clinics of North America Food Animal Practice, 34(2), 309–324. https://doi.org/10.1016/j.cvfa.2018.03.005
Blainey, P. C., & Quake, S. R. (2014). Dissecting genomic diversity, one cell at a time. Nature Methods, 11(1), 19–21. https://doi.org/10.1038/nmeth.2783
Blair, A., Sanger, D., White, D., Holland, A. F., Vandiver, L., Bowker, C., & White, S. (2014). Quantifying and simulating stormwater runoff in watersheds. Hydrological Processes, 28(3), 559–569. https://doi.org/10.1002/hyp.9616
Bolch, T., Peters, J., Yegorov, A., Pradhan, B., Buchroithner, M., & Blagoveshchensky, V. (2011). Identification of potentially dangerous glacial lakes in the northern Tien Shan. Natural Hazards, 59(3), 1691–1714. https://doi.org/10.1007/s11069-011-9860-2
Casanova, L. M., & Sobsey, M. D. (2016). Antibiotic-resistant enteric bacteria in environmental waters. Water, 8(12), 561. https://doi.org/10.3390/w8120561
Center for Disease Control and Prevention (CDC). (2019). Surveillance for foodborne disease outbreaks, United States, 2017, Annual Report. Retrieved from http://www.cdc.gov/foodsafety/fdoss/
Clubb, F. J., Mudd, S. M., Milodowski, D. T., Valters, D. A., Slater, L. J., Hurst, M. D., & Limaye, A. B. (2017). Geomorphometric delinea-tion of floodplains and terraces from objectively defined topographic thresholds. Earth Surface Dynamics, 5(3), 369–385. https://doi.org/10.5194/esurf-5-369-2017
Collender, P. A., Cooke, O. C., Bryant, L. D., Kjeldsen, T. R., & Remais, J. V. (2016). Estimating the microbiological risks associated with inland flood events: Bridging theory and models of pathogen transport. Critical Reviews in Environmental Science and Technology, 46(23–24), 1787–1833. https://doi.org/10.1080/10643389.2016.1269578
Cotti-Rausch, B. E., Majidzadeh, H., & DeVoe, M. R. (Eds.). (2019). Stormwater ponds in coastal South Carolina: 2019 State of Knowledge Full Report. Charleston, SC: Sea Grant Consortium.
DiDonato, G. T., Stewart, J. R., Sanger, D. M., Robinson, B. J., Thompson, B. C., Holland, A. F., & Van Dolah, R. F. (2009). Effects of changing land use on the microbial water quality of tidal creeks. Marine Pollution Bulletin, 58(1), 97–106. https://doi.org/10.1016/j.marpolbul.2008.08.019
Divakaran, S. J., Philip, J. S., Chereddy, P., Nori, S. R. C., Ganesh, A. J., John, J., & Nelson-Sathi, S. (2019). Insights into the bac-terial profiles and resistome structures following the severe 2018 flood in Kerala, South India. Microorganisms, 7(10), 474. https://doi.org/10.3390/microorganisms7100474
MAO ET AL.
10.1029/2020GH000294
12 of 14
AcknowledgmentsWe acknowledge the support by NSF CMMI grant 1901754 “RAPID: Charac-terization of Pathogens in Water, Soil and Animal Facilities for Resilience Assessment of Civil Infrastructure After Extreme Weather Events,” USDA 2019-67030-29683, Roy J. Carver Biotech-nology Center (CBC), and grants from CEE and IGB at University of Illinois at Urbana-Champaign. We acknowledge the contribution of Nathan Bonham in the flood model development, Claire McDonald, Tyler Kisling, Jinglin Duan, Dr Jason Anderson, and Dr Elbashir Araud for sampling, Marika Maggos, Lindsay Muth, Brett Myskowski, and Aiesya Shahar for sample filtration.
GeoHealth
Ellis, K. K., Callahan, T., Greenfield, D. I., Sanger, D., Robinson, J., & Jones, M. (2017). Measuring and modeling flow rates in tidal creeks: A case study from the central coast of South Carolina. The Journal of South Carolina Water Resources, 4(4), 21–39. https://doi.org/10.34068/jscwr.04.03
Farris, M. H., & Olson, J. B. (2007). Detection of Actinobacteria cultivated from environmental samples reveals bias in universal primers. Letters in Applied Microbiology, 45(4), 376–381. https://doi.org/10.1111/j.1472-765X.2007.02198.x
Filipe, J. F., Herrera, V., Curone, G., Vigo, D., & Riva, F. (2020). Floods, hurricanes, and other catastrophes: A challenge for the immune system of livestock and other animals. Frontiers in Veterinary Science, 7, 16. https://doi.org/10.3389/fvets.2020.00016
Furtak, K., Grządziel, J., Gałązka, A., & Niedźwiecki, J. (2020). Prevalence of unclassified bacteria in the soil bacterial community from floodplain meadows (fluvisols) under simulated flood conditions revealed by a metataxonomic approaches. Catena, 188, 104448. https://doi.org/10.1016/j.catena.2019.104448
Gedalanga, P. B., & Olson, B. H. (2009). Development of a quantitative PCR method to differentiate between viable and nonviable bacteria in environmental water samples. Applied Microbiology and Biotechnology, 82(3), 587–596. https://doi.org/10.1007/s00253-008-1846-y
Hill, V. R., & Sobsey, M. D. (2003). Performance of swine waste lagoons for removing Salmonella and enteric microbial indicators. Trans-actions of the American Society of Agricultural Engineers, 46(3), 781–788. https://doi.org/10.13031/2013.13593
Ishii, S., Kitamura, G., Segawa, T., Kobayashi, A., Miura, T., Sano, D., & Okabe, S. (2014). Microfluidic quantitative PCR for simultane-ous quantification of multiple viruses in environmental water samples. Applied and Environmental Microbiology, 80(24), 7505–7511. https://doi.org/10.1128/AEM.02578-14
Ishii, S., Segawa, T., & Okabe, S. (2013). Simultaneous quantification of multiple food- and waterborne pathogens by use of microfluidic quantitative PCR. Applied and Environmental Microbiology, 79(9), 2891–2898. https://doi.org/10.1128/AEM.00205-13
Jikumaru, A., Ishii, S., Fukudome, T., Kawahara, Y., Iguchi, A., Masago, Y., et al. (2020). Fast, sensitive, and reliable detection of water-borne pathogens by digital PCR after coagulation and foam concentration. Journal of Bioscience and Bioengineering, 130(1), 76–81. https://doi.org/10.1016/j.jbiosc.2020.02.004
Kadlec, K., Watts, J. L., Schwarz, S., & Sweeney, M. T. (2019). Plasmid-located extended-spectrum β-lactamase gene blaROB-2 in Mann-heimia haemolytica. Journal of Antimicrobial Chemotherapy, 74(4), 851–853. https://doi.org/10.1093/jac/dky515
Kapoor, V., Pitkänen, T., Ryu, H., Elk, M., Wendell, D., & Santo Domingo, J. W. (2015). Distribution of human-specific bacteroidales and fecal indicator bacteria in an urban watershed impacted by sewage pollution, determined using RNA- and DNA-based quantitative PCR assays. Applied and Environmental Microbiology, 81(1), 91–99. https://doi.org/10.1128/AEM.02446-14
Keelara, S., Scott, H. M., Morrow, W. M., Hartley, C. S., Griffin, D. L., Gebreyes, W. A., & Thakur, S. (2014). Comparative phenotypic and genotypic characterization of temporally related nontyphoidal Salmonella isolated from human clinical cases, pigs, and the environ-ment in North Carolina. Foodborne Pathogens and Disease, 11(2), 156–164. https://doi.org/10.1089/fpd.2013.1630
Khan, S. J., Deere, D., Leusch, F. D. L., Humpage, A., Jenkins, M., & Cunliffe, D. (2015). Extreme weather events: Should drinking water quality management systems adapt to changing risk profiles? Water Research, 85, 124–136. https://doi.org/10.1016/j.watres.2015.08.018
Lambirth, K., Tsilimigras, M., Lulla, A., Johnson, J., Al-Shaer, A., Wynblatt, O., et al. (2018). Microbial community composition and antibi-otic resistance genes within a North Carolina Urban water system. Water, 10(11), 1539. https://doi.org/10.3390/w10111539
Lanfear, R., Kokko, H., & Eyre-Walker, A. (2014). Population size and the rate of evolution. Trends in Ecology and Evolution, 29(1), 33–41. https://doi.org/10.1016/j.tree.2013.09.009
Lee, J., Phung, N. T., Chang, I. S., Kim, B. H., & Sung, H. C. (2003). Use of acetate for enrichment of electrochemically active microorgan-isms and their 16S rDNA analyses. FEMS Microbiology Letters, 223(2), 185–191. https://doi.org/10.1016/S0378-1097(03)00356-2
Li, H., Xin, H., & Li, S. F. Y. (2015). Multiplex PMA-qPCR assay with internal amplification control for simultaneous detection of viable Legionella pneumophila, Salmonella typhimurium, and Staphylococcus aureus in environmental waters. Environmental Science and Technology, 49(24), 14249–14256. https://doi.org/10.1021/acs.est.5b03583
Luo, Z., Gu, G., Giurcanu, M. C., Adams, P., Vellidis, G., van Bruggen, A. H. C., & Wright, A. C. (2014). Development of a novel cross-streak-ing method for isolation, confirmation, and enumeration of Salmonella from irrigation ponds. Journal of Microbiological Methods, 101(1), 86–92. https://doi.org/10.1016/j.mimet.2014.03.012
Magnet, S., Courvalin, P., & Lambert, T. (1999). Activation of the cryptic aac(6')-Iy aminoglycoside resistance gene of Salmonella by a chromosomal deletion generating a transcriptional fusion. Journal of Bacteriology, 181(21), 6650–6655. https://doi.org/10.1128/jb.181.21.6650-6655.1999
Magrini, V., Creighton, C., White, D., Hartzell, P. L., & Youderian, P. (1998). The aadA gene of plasmid R100 confers resistance to spectinomycin and streptomycin in Myxococcus xanthus. Journal of Bacteriology, 180(24), 6757–6760. https://doi.org/10.1128/jb.180.24.6757-6760.1998
McLaughlin, M. R., & Brooks, J. P. (2009). Recovery of Salmonella from bermudagrass exposed to simulated wastewater. Journal of Envi-ronmental Quality, 38(1), 337–342. https://doi.org/10.2134/jeq2008.0017
Michael, I., Rizzo, L., McArdell, C. S., Manaia, C. M., Merlin, C., Schwartz, T., et al. (2013). Urban wastewater treatment plants as hotspots for the release of antibiotics in the environment: A review. Water Research, 47(3), 957–995. https://doi.org/10.1016/j.watres.2012.11.027
Nair, D. V. T., Venkitanarayanan, K., & Johny, A. K. (2018). Antibiotic-resistant Salmonella in the food supply and the potential role of antibiotic alternatives for control. Foods, 7(10), 167. https://doi.org/10.3390/foods7100167
NC DEQ. (2018). DEQ Dashboard. North Carolina Environmental Quality. Retrieved from https://deq.nc.gov/news/deq-dashboard#animal-operations---swine-lagoon-facilities
NC DEQ. (2019). Animal facility map. North Carolina Environmental Quality. Retrieved from https://deq.nc.gov/cafo-mapNirdnoy, W., Mason, C. J., & Guerry, P. (2005). Mosaic structure of a multiple-drug-resistant, conjugative plasmid from Campylobacter
jejuni. Antimicrobial Agents and Chemotherapy, 49(6), 2454–2459. https://doi.org/10.1128/AAC.49.6.2454-2459.2005Pandey, P. K., Cao, W., Wang, Y., Vaddella, V., Castillo, A. R., Souza, A., & Rio, N. S. del. (2016). Simulating the effects of mesophilic anaer-
obic and aerobic digestions, lagoon system, and composting on pathogen inactivation. Ecological Engineering, 97, 633–641. https://doi.org/10.1016/j.ecoleng.2016.10.047
Pullaro, T. C., Pan, W., Chiovarou, E. D., Daugomah, J. W., Shea, N. R., & Siewicki, T. C. (2009). Using wildlife activity and antibiotic resist-ance analysis to model bacterial water quality in coastal ponds. NOAA Technical Memorandum NOS NCCOS 102, p. 32.
Ravva, S. V., & Sarreal, C. Z. (2014). Survival of Salmonella enterica in aerated and nonaerated wastewaters from dairy lagoons. Internation-al Journal of Environmental Research and Public Health, 11(11), 11249–11260. https://doi.org/10.3390/ijerph111111249
Roper, W. E., Weiss, K. J., & Wheeler, J. F. (2005). Water quality assessment and monitoring in New Orleans following hurricane Katrina. Retrieved from http://citeseerx.ist.psu.edu/viewdoc/summary?doi=10.1.1.484.3740
Rosato, A. E., Lee, B. S., & Nash, K. A. (2001). Inducible macrolide resistance in Corynebacterium jeikeium. Antimicrobial Agents and Chemotherapy, 45(7), 1982–1989. https://doi.org/10.1128/AAC.45.7.1982-1989.2001
MAO ET AL.
10.1029/2020GH000294
13 of 14
GeoHealth
Sadik, N. J., Uprety, S., Nalweyiso, A., Kiggundu, N., Banadda, N. E., Shisler, J. L., & Nguyen, T. H. (2017). Quantification of multiple wa-terborne pathogens in drinking water, drainage channels, and surface water in Kampala, Uganda, during seasonal variation. GeoHealth, 1(6), 258–269. https://doi.org/10.1002/2017gh000081
Salipante, S. J., & Hall, B. G. (2003). Determining the limits of the evolutionary potential of an antibiotic resistance gene. Molecular Biology and Evolution, 20(4), 653–659. https://doi.org/10.1093/molbev/msg074
San Millan, A., MacLean, R. (2019). Fitness costs of plasmids: A limit to plasmid transmission. In F. Baquero, E. Bouza, J. Gutiér-rez-Fuentes & T. Coque (Eds.), Microbial transmission (pp. 65–79). Washington, DC: ASM Press. https://doi.org/10.1128/microbiolspec.mtbp-0016-2017
Sanger, D. M., Holland, A. F., & Hernandez, D. L. (2004). Environmental assessment: Evaluation of the impacts of dock structures and land use on tidal creek ecosystems in South Carolina estuarine environments. Environmental Management, 33(3), 385–400. https://doi.org/10.1007/s00267-003-0019-0
Schmittgen, T. D., & Livak, K. J. (2008). Analyzing real-time PCR data by the comparative CT method. Nature Protocols, 3(6), 1101–1108. https://doi.org/10.1038/nprot.2008.73
Schrader, C., Schielke, A., Ellerbroek, L., & Johne, R. (2012). PCR inhibitors – Occurrence, properties and removal. Journal of Applied Microbiology, 113(5), 1014–1026. https://doi.org/10.1111/j.1365-2672.2012.05384.x
Shanley, J. B., McDowell, W. H., & Stallard, R. F. (2011). Long-term patterns and short-term dynamics of stream solutes and suspended sediment in a rapidly weathering tropical watershed. Water Resources Research, 47, W07515. https://doi.org/10.1029/2010WR009788
Shellenbarger, G. G., Athearn, N. D., Takekawa, J. Y., & Boehm, A. B. (2008). Fecal indicator bacteria and Salmonella in ponds managed as bird habitat, San Francisco Bay, California, USA. Water Research, 42(12), 2921–2930. https://doi.org/10.1016/j.watres.2008.03.006
Shivakumar, A. G., & Dubnau, D. (1981). Characterization of a plasmid-specified ribosome methylase associated with macrolide resist-ance. Nucleic Acids Research, 9(11), 2549–2562. https://doi.org/10.1093/nar/9.11.2549
Singh, N. S., Singhal, N., & Virdi, J. S. (2018). Genetic environment of blaTEM-1, blaCTX-M-15, blaCMY-42 and characterization of inte-grons of Escherichia coli isolated from an Indian urban aquatic environment. Frontiers in Microbiology, 9, 382. https://doi.org/10.3389/fmicb.2018.00382
Sofia, G., Fontana, G. D., & Tarolli, P. (2014). High-resolution topography and anthropogenic feature extraction: Testing geomorphometric parameters in floodplains. Hydrological Processes, 28(4), 2046–2061. https://doi.org/10.1002/hyp.9727
Song, Q., Zhang, D., Gao, H., & Wu, J. (2018). Salmonella species' persistence and their high level of antimicrobial resistance in flooded man-made rivers in China. Microbial Drug Resistance, 24(9), 1404–1411. https://doi.org/10.1089/mdr.2017.0316
Stevens, M. P., Humphrey, T. J., & Maskell, D. J. (2009). Molecular insights into farm animal and zoonotic salmonella infections. Philosoph-ical Transactions of the Royal Society B: Biological Sciences, 364, 2708–2723. https://doi.org/10.1098/rstb.2009.0094
Su, L. H., Chiu, C. H., Chu, C., & Ou, J. T. (2004). Antimicrobial resistance in nontyphoid Salmonella serotypes: A global challenge. Clinical Infectious Diseases, 39, 546–551. https://doi.org/10.1086/422726
Su, J. Q., Wei, B., Ou-Yang, W. Y., Huang, F. Y., Zhao, Y., Xu, H. J., & Zhu, Y. G. (2015). Antibiotic resistome and its association with bacterial communities during sewage sludge composting. Environmental Science and Technology, 49(12), 7356–7363. https://doi.org/10.1021/acs.est.5b01012
Uprety, S., Hong, P.-Y., Sadik, N., Dangol, B., Adhikari, R., Jutla, A., et al. (2017). The effect of the 2015 Earthquake on the bacterial commu-nity compositions in water in Nepal. Frontiers in Microbiology, 8, 2380. https://www.frontiersin.org/article/10.3389/fmicb.2017.02380
Walters, S. P., González-Escalona, N., Son, I., Melka, D. C., Sassoubre, L. M., & Boehm, A. B. (2013). Salmonella enterica diversity in cen-tral Californian coastal waterways. Applied and Environmental Microbiology, 79(14), 4199–4209. https://doi.org/10.1128/AEM.00930-13
Wein, T., Hülter, N. F., Mizrahi, I., & Dagan, T. (2019). Emergence of plasmid stability under non-selective conditions maintains antibiotic resistance. Nature Communications, 10, 2595. https://doi.org/10.1038/s41467-019-10600-7
Yang, J., Wang, C., Wu, J., Liu, L., Zhang, G., & Feng, J. (2014). Characterization of a multiresistant mosaic plasmid from a fish farm sed-iment Exiguobacterium sp. isolate reveals aggregation of functional clinic-associated antibiotic resistance genes. Applied and Environ-mental Microbiology, 80(4), 1482–1488. https://doi.org/10.1128/AEM.03257-13
Yu, P., Zaleski, A., Li, Q., He, Y., Mapili, K., Pruden, A., et al. (2018). Elevated levels of pathogenic indicator bacteria and antibiotic re-sistance genes after hurricane Harvey's flooding in Houston. Environmental Science and Technology Letters, 5(8), 481–486. https://doi.org/10.1021/acs.estlett.8b00329
Zhang, Q., & Ishii, S. (2018). Improved simultaneous quantification of multiple waterborne pathogens and fecal indicator bacteria with the use of a sample process control. Water Research, 137, 193–200. https://doi.org/10.1016/j.watres.2018.03.023
Zhu, Y. G., Johnson, T. A., Su, J. Q., Qiao, M., Guo, G. X., Stedtfeld, R. D., et al. (2013). Diverse and abundant antibiotic resistance genes in Chinese swine farms. Proceedings of the National Academy of Sciences of the United States of America, 110(9), 3435–3440. https://doi.org/10.1073/pnas.1222743110
MAO ET AL.
10.1029/2020GH000294
14 of 14