Embed Size (px)
Citation preview

Relationship between antibiotic- and disinfectant-resistance profiles in bacteria
harvested from tap water
Sadia Khan1, 2, Tara K. Beattie1, and Charles W. Knapp1,*
1 Department of Civil and Environmental Engineering, James Weir Building, 75 Montrose
Street, Glasgow G1 1XJ, Scotland, UK
2 Department of Environmental Engineering, NED University of Engineering and
Technology, University Road, Karachi -75270, Pakistan
*Corresponding Author Phone & Fax:
Tel.: +44(0) 141 548 3351
Fax: +44 (0) 141 553 2066
E-mail: [email protected]

ABSTRACT:
Chlorination is commonly used to control levels of bacteria in drinking water; however,
viable bacteria may remain due to chlorine resistance. What may be concerning is that
surviving bacteria, due to co-selection factors, may also have increased resistance to common
antibiotics. This would pose a public health risk as it could link resistant bacteria in the
natural environment to human population. Here, we investigated the relationship between
chlorine- and antibiotic-resistances by harvesting 148 surviving bacteria from chlorinated
drinking-water systems and compared their susceptibilities against chlorine disinfectants and
antibiotics. Twenty-two genera were isolated, including members of Paenibacillus,
Burkholderia, Escherichia, Sphingomonas and Dermacoccus species. Weak (but significant)
correlations were found between chlorine-tolerance and minimum inhibitory concentrations
against the antibiotics tetracycline, sulfamethoxazole and amoxicillin, but not against
ciprofloxacin; this suggest that chlorine-tolerant bacteria are more likely to also be antibiotic
resistant. Further, antibiotic-resistant bacteria survived longer than antibiotic-sensitive
organisms when exposed to free chlorine in a contact-time assay; however, there were little
differences in susceptibility when exposed to monochloramine. Irrespective of antibiotic-
resistance, spore-forming bacteria had higher tolerance against disinfection compounds. The
presence of chlorine-resistant bacteria surviving in drinking-water systems may also carry
additional risk of antibiotic resistance.
Key words: susceptibility, antimicrobial-resistant bacteria, disinfectant-resistance, drinking-
water

INTRODUCTION 1
Antibiotic-resistant bacteria (ARB) and their genes (ARG) are considered emerging 2
environmental contaminants with a widespread distribution (Pruden et al., 2006, Diehl and 3
Lapara, 2010, Dodd, 2012, Chen et al., 2015) with natural and anthropogenic activities 4
contributing to its development and dispersion in the environment (Allen et al., 2010, Gaze et 5
al., 2011, Wellington et al., 2013) and water bodies (Pruden et al., 2012, Su et al., 2012). As 6
the demand for safe drinking-water increases around the world (Brettar and Hofle, 2008), 7
these compromised natural-water resources could more increasingly become considered as 8
sources of either drinking-water or contamination to the system. 9
Drinking-water treatment plants use a number of treatment methods to improve water 10
quality: e.g., flocculation, sedimentation, filtration, and disinfection. Among the processes, 11
chemical disinfection contributes greatly to the control of microorganisms from treatment 12
plant to point of use (Berry et al., 2006). However, it has been known that chemical 13
disinfection has limitations in its immediate and prolonged effectiveness, and multiple factors 14
reduce the effectiveness of disinfectants against bacterial populations (Scully et al., 1999, 15
Cherchi and Gu, 2011, Jaglic et al., 2012, Bessa et al., 2014), including the presence of 16
organic matter having amino nitrogen compounds (Scully and Hartman, 1996), bacterial 17
growth phase (Cherchi and Gu, 2011) and the presence of extracellular polymeric matrix 18
(Bridier et al., 2011, Wong et al., 2010). 19
It has increasingly been discovered that resistance traits horizontally transfer in 20
microbial communities due to either cross-resistance (e.g., efflux mechanisms capable of 21
detoxifying multiple stressors) or co-resistance (e.g., closely linked genetic traits on a mobile 22
genetic element) factors. For example, Templeton et al. (2009) found greater frequency of 23
chlorine tolerance among antibiotic-resistant E. coli as compared to antibiotic-sensitive E. 24
coli grown in the presence of chlorine (Templeton et al., 2009). Genetic factors, such as class 25
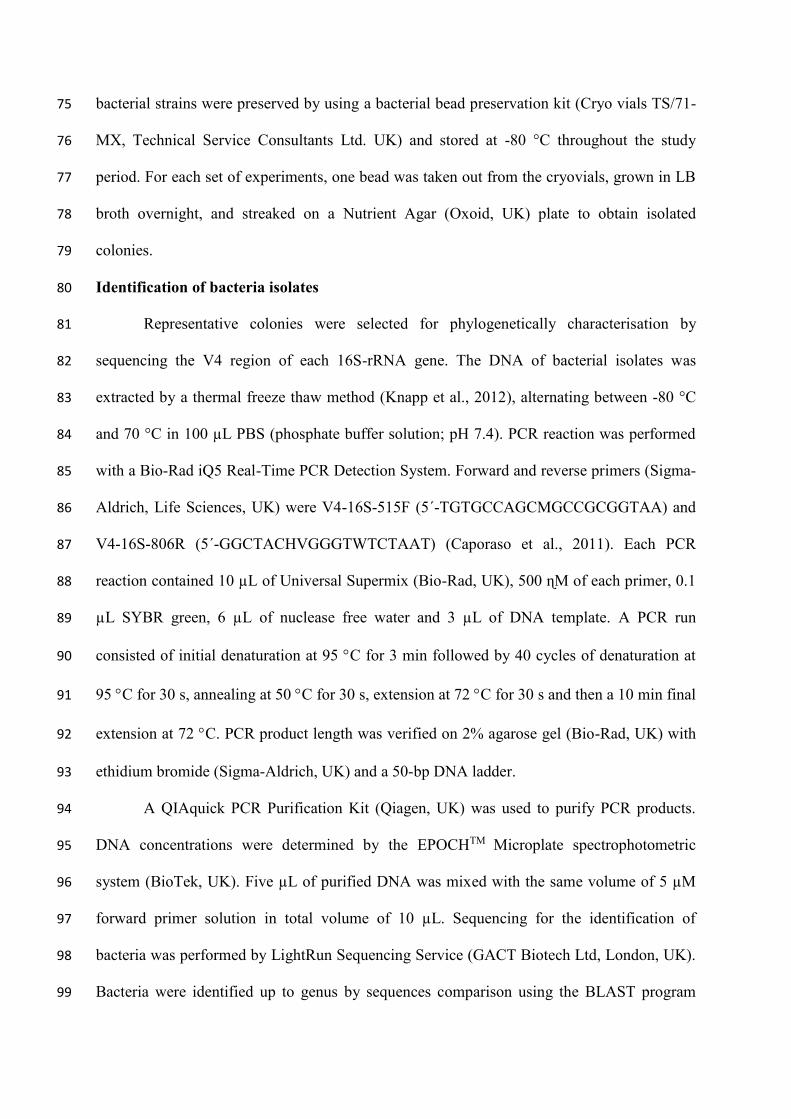
1 and class 2 integrons that transfer multiple resistance genes could be responsible for such 26
traits (Gillings et al., 2009, Ozgumus et al., 2009, Koczura et al., 2012, Mokracka et al., 2012, 27
Su et al., 2012, Hsu et al., 2014, Chen et al., 2015). 28
Wastewater treatment studies (Diehl and Lapara, 2010, Burch et al., 2013) have 29
reported decrease in total bacteria, but increased ratio of resistant bacteria (Galvin et al., 30
2010; Guo et al., 2014; Al-Jassim et al., 2015) following treatment; a similar trend may occur 31
in drinking-water systems (Bergeron et al., 2015). There have been reports of drinking-water 32
treatment plants (DWTP) (Armstrong et al., 1981, Armstrong et al., 1982, Xi et al., 2009, 33
Farkas et al., 2013, Pruden et al., 2006) and water distribution systems (DWDS) (Laroche et 34
al., 2010, Talukdar et al., 2013, Xi et al., 2009) influencing the emergence and spread of 35
antibiotic-resistance. For example, relative abundance of sulfonamide resistance genes 36
increased from 3.5% to 33% in DWTP (Chao et al., 2013) and a broader range of ARGs 37
(Fahrenfeld et al., 2013). Stressful environments such as extreme pH, high salinity, nutrient 38
deprivation (Bessa et al., 2014), oxidation (Scully et al., 1999), or chlorine exposure 39
(Ridgway and Olson, 1982) promote populations with greater resistance. Sub-inhibitory 40
concentrations, not only select resistant populations, but could invoke a stress response which 41
may include genetic exchange. 42
Bacteria opportunistically colonise water distribution systems (Wang et al., 2013), 43
and water meters (Hong et al., 2010). Additionally, localised disruptions in the distribution 44
mains (e.g., in building cisterns and plumbing) also introduce bacterial populations, which 45
may include agents of waterborne disease and increased health risks and maintenance costs to 46
the system (Falkinham et al., 2015). 47
This study compares the susceptibilities of bacteria harvested from drinking-water 48
taps to chlorine disinfectants and four antibiotics: tetracycline (TET), sulfamethoxazole 49
(SMX), ciprofloxacin (CIP) and amoxicillin (AMX). We hypothesized that bacteria isolated 50

from water taps would have similar disinfectant- and antibiotic-resistance profiles. Further, 51
we determine whether disruptions to service lines provide a source of contamination and 52
increase the risk of ARB and ARG. 53
METHODS 54
Sampling and bacteria isolation 55
In UK, most drinking-water is sourced from surface water (Scottish-Water, 2012a, 56
Scottish-Water, 2012b) and does not deviate from many conventional water-treatment works: 57
screening, coagulation, flocculation, sedimentation or clarification, filtration (rapid gravity, 58
slow sand, or membrane), and pH adjustment. Both chlorination and chloramination used for 59
disinfection in Scotland, UK to provide good quality water for human use. Monochloramine 60
is used in the distribution system as it has a longer residence time than chlorine and produces 61
fewer by-products. 62
To compare tolerances between disinfection and antibiotics, bacteria were harvested 63
from 52 water samples, collected from flushed (5 min) taps in Glasgow, Scotland, UK. 64
Samples were collected in pre-sterile screw capped bottles and brought to the laboratory for 65
processing within two hours to minimise changes in the samples. Thirty-eight samples were 66
collected from buildings that had tank cisterns for drinking-water storage, with tank 67
capacities ranged from 16,000 to 27,000 L; the remaining 14 samples were from closed 68
systems. 69
A vacuum-filtration method, with 0.22 µm pore-size cellulose-nitrate gridded 70
membrane filters (Millipore, UK) was used to harvest cells from 100 mL of each water 71
sample; the filter was placed on a Standard Plate Count Agar plate APHA (Oxoid, UK) and 72
incubated for 48 h at 35 ± 2 C for the development of colonies. The plastic lid was retained 73
to minimise aerosol contamination; sterilised distilled water was used as controls. Isolated 74
bacterial strains were preserved by using a bacterial bead preservation kit (Cryo vials TS/71-75
MX, Technical Service Consultants Ltd. UK) and stored at -80 °C throughout the study 76
period. For each set of experiments, one bead was taken out from the cryovials, grown in LB 77
broth overnight, and streaked on a Nutrient Agar (Oxoid, UK) plate to obtain isolated 78
colonies. 79
Identification of bacteria isolates 80
Representative colonies were selected for phylogenetically characterisation by 81
sequencing the V4 region of each 16S-rRNA gene. The DNA of bacterial isolates was 82
extracted by a thermal freeze thaw method (Knapp et al., 2012), alternating between -80 °C 83
and 70 °C in 100 µL PBS (phosphate buffer solution; pH 7.4). PCR reaction was performed 84
with a Bio-Rad iQ5 Real-Time PCR Detection System. Forward and reverse primers (Sigma-85
Aldrich, Life Sciences, UK) were V4-16S-515F (5´-TGTGCCAGCMGCCGCGGTAA) and 86
V4-16S-806R (5´-GGCTACHVGGGTWTCTAAT) (Caporaso et al., 2011). Each PCR 87
reaction contained 10 µL of Universal Supermix (Bio-Rad, UK), 500 ɳM of each primer, 0.1 88
µL SYBR green, 6 µL of nuclease free water and 3 µL of DNA template. A PCR run 89
consisted of initial denaturation at 95 C for 3 min followed by 40 cycles of denaturation at 90
95 C for 30 s, annealing at 50 C for 30 s, extension at 72 C for 30 s and then a 10 min final 91
extension at 72 C. PCR product length was verified on 2% agarose gel (Bio-Rad, UK) with 92
ethidium bromide (Sigma-Aldrich, UK) and a 50-bp DNA ladder. 93
A QIAquick PCR Purification Kit (Qiagen, UK) was used to purify PCR products. 94
DNA concentrations were determined by the EPOCHTM Microplate spectrophotometric 95
system (BioTek, UK). Five µL of purified DNA was mixed with the same volume of 5 µM 96
forward primer solution in total volume of 10 µL. Sequencing for the identification of 97
bacteria was performed by LightRun Sequencing Service (GACT Biotech Ltd, London, UK). 98
Bacteria were identified up to genus by sequences comparison using the BLAST program 99

through the National Center for Biotechnology Information (NCBI) 100
(http://blast.ncbi.nlm.nih.gov). 101
Disinfectant susceptibility testing 102
Testing was performed using the Kirby-Bauer disc diffusion method, as 103
recommended by the Clinical and Laboratory Standards Institute (Clinical And Laboratory 104
Standards Institute, 2012a), against 127 bacterial isolates with disinfectant solutions of 105
commercial bleach (4.5% sodium hypochlorite, Domestos™, UniLever, UK), 14.5% standard 106
sodium hypochlorite (Alfa Aesar, UK), and a control (tap water) (Sassone et al., 2008, 107
Poggio et al., 2010, Luddin and Ahmed, 2013). Experiments were performed in duplicate and 108
mean zone of inhibition was determined for each isolate. We arbitrarily considered bacteria 109
having zone < 20 mm to be chlorine tolerant (or resistant), as high concentration of standard 110
sodium chlorite (14.5%) was also used. 111
Antibiotic susceptibility testing for MIC 112
Bacterial isolates were also tested for antibiotic susceptibility against tetracycline 113
hydrochloride (‘TET’; Sigma-Aldrich, UK), sulfamethoxazole (‘SMX’; Molekula, UK), 114
amoxicillin trihydrate (‘AMX’; Alfa Aesar, UK) and ciprofloxacin (‘CIP’; Fluka, UK) by 115
Agar Dilution Method recommended previously by the Clinical and Laboratory Standards 116
Institute (Clinical And Laboratory Standards Institute, 2012b). A master replica plate, 117
containing 20-24 bacterial isolates, was freshly prepared for each experiment. The isolates 118
were tested against a series of concentrations, 0.002–512 µg mL-1, of each antibiotic in 119
Mueller-Hinton Agar (Oxoid, UK) (Armstrong et al., 1981). All plates were incubated at 35 ± 120
2 C for 24 h. Minimum inhibitory concentrations (MIC) were calculated for each antibiotic 121
(µg mL-1) against all isolates. E. coli ATCC 25922 (NCTC 12241) was used as a control, and 122
the maximum MIC values of antibiotics against the organisms reported by CLSI were used as 123
reference for the interpretation (Clinical And Laboratory Standards Insitute, 2011, Guo et al., 124
2013, Yuan et al., 2015). Any bacterium forming colonies above maximum MIC values 125
mentioned by CLSI (TET > 16 µg mL-1, SMX > 512 µg mL-1, CIP > 4 µg mL-1, and AMX > 126
32 µg mL-1) were considered “resistant” to that antibiotic; those inhibited at lower 127
concentrations were considered ‘susceptible’. 128
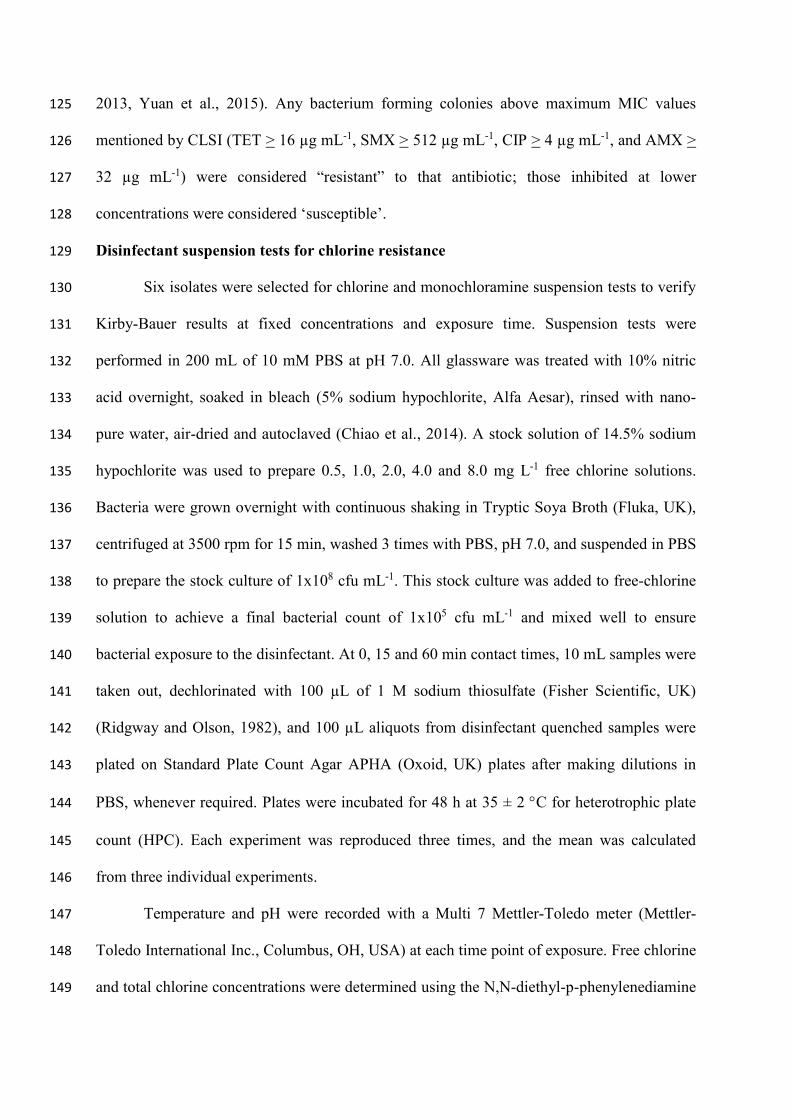
Disinfectant suspension tests for chlorine resistance 129
Six isolates were selected for chlorine and monochloramine suspension tests to verify 130
Kirby-Bauer results at fixed concentrations and exposure time. Suspension tests were 131
performed in 200 mL of 10 mM PBS at pH 7.0. All glassware was treated with 10% nitric 132
acid overnight, soaked in bleach (5% sodium hypochlorite, Alfa Aesar), rinsed with nano-133
pure water, air-dried and autoclaved (Chiao et al., 2014). A stock solution of 14.5% sodium 134
hypochlorite was used to prepare 0.5, 1.0, 2.0, 4.0 and 8.0 mg L-1 free chlorine solutions. 135
Bacteria were grown overnight with continuous shaking in Tryptic Soya Broth (Fluka, UK), 136
centrifuged at 3500 rpm for 15 min, washed 3 times with PBS, pH 7.0, and suspended in PBS 137
to prepare the stock culture of 1x10⁸ cfu mL-1. This stock culture was added to free-chlorine 138
solution to achieve a final bacterial count of 1x10⁵ cfu mL-1 and mixed well to ensure 139
bacterial exposure to the disinfectant. At 0, 15 and 60 min contact times, 10 mL samples were 140
taken out, dechlorinated with 100 µL of 1 M sodium thiosulfate (Fisher Scientific, UK) 141
(Ridgway and Olson, 1982), and 100 µL aliquots from disinfectant quenched samples were 142
plated on Standard Plate Count Agar APHA (Oxoid, UK) plates after making dilutions in 143
PBS, whenever required. Plates were incubated for 48 h at 35 ± 2 C for heterotrophic plate 144
count (HPC). Each experiment was reproduced three times, and the mean was calculated 145
from three individual experiments. 146
Temperature and pH were recorded with a Multi 7 Mettler-Toledo meter (Mettler-147
Toledo International Inc., Columbus, OH, USA) at each time point of exposure. Free chlorine 148
and total chlorine concentrations were determined using the N,N-diethyl-p-phenylenediamine 149

(DPD) colorimetric method (APHA, 1999) with HACH DPD reagent and pocket colorimetric 150
analysis system (HACH, USA) at 0, 15, and 60 min contact times. Two controls of PBS with 151
bacteria without disinfectant and PBS with disinfectant and without bacteria were used for 152
each set of experiments. 153
Disinfectant suspension test for monochloramine 154
Monochloramine suspension tests were performed similarly as described for the 155
chlorine suspension test except PBS pH 8.0 was used for the experiments (Howard and Inglis, 156
2005, Chiao et al., 2014). The monochloramine solution (10 mg L-1) was prepared by mixing 157
68.9 µL of 14.5% NaOCl (Alfa Aesar, UK) and 2 mL of 1.91% NH4Cl solutions (Sigma-158
Aldrich, UK) in a volumetric flask and making up the volume to 1 L with PBS, pH 8.0 159
(Driedger et al., 2001, Chiao et al., 2014). Five solutions of monochloramine were prepared 160
similarly having concentrations of 0.5, 1.0, 2.0, 4.0 and 8.0 mg L-1. Monochloramine 161
concentration was determined using the Indophenol method with MonochlorF reagent 162
(HACH, USA, Method 10172) and HACH Pocket colorimeter analysis system (Lee et al., 163
2007). The remaining protocol was the same as used for the chlorine suspension test. 164
Data collection and statistical analysis 165
Chlorine and monochloramine disinfectant suspension tests were performed against 166
six identified bacterial isolates and mean cfu mL-1 ± SD were calculated for each contact time 167
and concentration. Cell counts were log10 transformed before plotting. Statistical analysis was 168
performed using Minitab version 17. MIC data was compared against zones of inhibition of 169
hypochlorite assays using the non-parametric Spearman correlation test. 170
RESULTS 171
Water Conditions 172

Minimum free chlorine and total chlorine concentrations were found to be 0.01 mg L-1 173
and 0.1 mg L-1, respectively at the time of collection of samples. Thirty-eight samples were 174
collected from buildings having a cold-water storage tank, or cistern, within the building, 175
while 14 samples were collected from the buildings with completely closed supply lines 176
(Table 1). Water storage tanks are inspected once in six months and disinfected generally on 177
annual basis in these buildings. All reported drinking-water quality values were within 178
permissible concentrations at time of sampling; however, disinfection conditions declined at 179
point of use. 180
Bacterial communities in drinking water 181
Approximately 80% of water samples tested positively for at least one bacterium (per 182
100 mL water). The frequency of positive detections was similar between building types; 183
however, cistern-related samples had greater abundances of bacteria: averaging 3.4 colony 184
forming units (CFU) from cistern-systems, versus 1.4 CFU in buildings without cisterns. 185
Bacteria identified in this study included members from the phyla of 186
Alphaproteobacteria (Blastomonas and Sphingomonas), Betaproteobacteria (Acidovorax, 187
Burkholderia, Comamonas, Cupriavidus, Ralstonia, and Variovorax), Gammaproteobacteria 188
(Enhydrobacter, Escherichia, and Pantoea), Actinobacteria (Arthrobacter, Dermacoccus, 189
Dietzia, Janibacter, Kocuria, and Micrococcus), and Firmicutes (Bacillus, Paenibacillus, 190
Brevibacillus, and Staphylococcus) (Table S1). 191
Twenty different genera were found in water samples collected from buildings having 192
cisterns, and eight genera were found in samples from buildings with closed systems (Table 193
1). There are differences in bacterial communities found in drinking-water system when the 194
water has been stored before use. Bacillus, Burkholderia, Kocuria, Micrococcus, 195
Paenibacillus, and Staphylococcus were present in both types of buildings at relatively 196
similar proportions. Fourteen groups were found only in the drinking-water samples taken 197

from the buildings with storage tank or cistern: Cupriavidus, Blastomonas, Acidovorax, 198
Variovorax, Arthrobacter, Escherichia, Enhydrobacter, Pantoea, Comamonas, 199
Sphingomonas, Dietzia, and an unrecognised Epsilonproteobacteria (Table 1), while 200
Janibacter and Brevibacillus were present only in those samples taken from buildings 201
without a drinking-water storage tank. 202
Disinfection susceptibility test by disk diffusion method 203
This test assayed bacteria to determine their susceptibilities to sodium hypochlorite, 204
either as 14.5% standard sodium hypochlorite solution or 4.5% commercial bleach on the 205
same agar plate. Bacteria showed a broad range of susceptibility patterns producing zones of 206
inhibition between 7 mm and 65 mm in diameter against the two disinfectants. We arbitrarily 207
classified results to facilitate analysis (there are no known standard metrics to define 208
‘resistance’), and 13 (8.8%) bacteria showed zones of inhibition < 20 mm in diameter; 96 209
(64.9%) isolates showed zones of inhibition between 21-40 mm, while 18 (12.2%) isolates 210
produced zones of inhibition of > 41 mm (Table 2). In case of 4.5% commercial bleach, 98 211
(66.2%) isolates showed zone of inhibition < 20 mm, 29 (19.6%) isolates showed between 212
21-40 mm, while no isolate showed any zone of inhibition > 41 mm (Table 2). 213
Comparing the means of size of zone of inhibition by two disinfectants indicated that 214
(as expected) the standard sodium hypochlorite was more effective against isolated bacteria 215
(Table S2), but interestingly 10 (6.8%) cultures (4 Bacillus spp., 2 Acidovorax spp., 1 216
Burkholderia sp., 1 Paenibacillus sp. and 2 unidentified bacteria) were more sensitive to 217
commercial bleach (Table S1); this may be due to the presence of other antimicrobial agents, 218
e.g., non-ionic and cationic surfactants, or pH, of the commercial bleach solution. Twenty-219
one isolates were not tested as they did not form a proper lawn on the agar plate as required 220
for agar diffusion method; at least three attempts to create a lawn were made for each 221
bacteria. 222

There were no differences in zones of inhibition to chlorine among bacteria collected 223
from each building type (Mann Whitney, W = 7086, p = 0.747). There is no treatment-related 224
bias to chlorine resistance based on the presence or absence of a cistern. 225
Antibiotic susceptibility test for MICs 226
To confirm the presence of ARB in tap water, antibiotic susceptibility testing was 227
performed against four antibiotics to determine their MIC profiles: tetracycline (TET), 228
sulfamethoxazole (SMX), ciprofloxacin (CIP) and amoxicillin (AMX). These antibiotics 229
belong to different antimicrobial classes and involve different mechanisms for resistance as 230
they inhibit protein synthesis, folic-acid cycle, DNA gyrase (involved in DNA replication), 231
and synthesis of cell walls, respectively (Kohanski et al., 2010). 232
Among the 148 isolates, 115 (77.7%) showed resistance against at least one antibiotic 233
(Table 3), based on maximum values of MICs for organisms described by CLSI (Clinical 234
And Laboratory Standards Insitute, 2011, Guo et al., 2013, Yuan et al., 2015). Amoxicillin 235
resistance was most prevalent, found in 96 (64.9%) isolates which were grown in AMX 236
concentrations > 32 µg mL-1 (Table 3), while sulfamethoxazole resistance was also widely 237
distributed (45.9%, n = 68). Twenty bacteria (13.5%) were resistant to tetracycline, and 238
thirteen (8.8%) possessed resistance against ciprofloxacin. 239
The presence of resistance traits against two or more antibiotics indicates that these 240
organisms could have multidrug resistances. Multi-drug resistant bacteria were found in the 241
drinking-water samples; six (4.1%) bacteria were resistant to all four antibiotics tested (TET, 242
SMX, CIP, and AMX). Ten (6.8%) bacteria showed resistance against three antibiotics: 7 to 243
TET, SMX, and AMX and 3 to SMX, CIP, and AMX. Out of 148 bacteria, 44 (29.7%) 244
showed double resistance; further details can be found in Table 3. 245
Among building types, there were no differences between MIC for TET and SUL 246
(Mann Whitney test: p = 0.424 and p = 0.296, respectively). Bacteria from cistern-systems 247

had higher MIC for AMX (Mann Whitney test, p < 0.001) with median value of 64 µg mL-1 248
in cisterns, versus 0.125 in closed systems. Conversely, bacteria in closed systems had higher 249
MIC for CIP than those from cisterns (Mann Whitney, p < 0.001): 0.063 µg mL-1 versus 250
0.016 µg mL-1, respectively. 251
Bacteria show similar resistance patterns against antibiotics and disinfectants (Table 252
S1). Spearman correlation tests (p = 0.05) indicate an inverse relationship between zones of 253
inhibition against 14.5% standard sodium hypochlorite and antibiotic MICs. This suggests 254
that bacteria with chlorine tolerance also tended to have greater tolerance to antibiotics. 255
Correlations were weak but significant; AMX (r = -0.303; p = 0.001), SMX (r = -0.278; p = 256
0.002), and TET (r = -0.219; p = 0.014) (Table 5). There were no patterns between 257
ciprofloxacin-resistance and chlorine tolerance (r = -0.002; p = 0.981). 258
Disinfection suspension test for chlorine 259
Six bacteria were selected for the disinfectant suspension test on the basis of the 260
number of antibiotics to which they were resistant: Arthrobacter (TET, SMX, CIP, and 261
AMX), Bacillus (SMX and AMX), Cupriavidus (TET, SMX, CIP, and AMX), Burkholderia 262
(type M: TET, SMX, and AMX), Burkholderia (type S: AMX) and Paenibacillus (No 263
resistance) (Table 4). Burkholderia were represented with ‘M’ (multiple resistant) and ‘S’ 264
(single resistant) to differentiate the two strains. 265
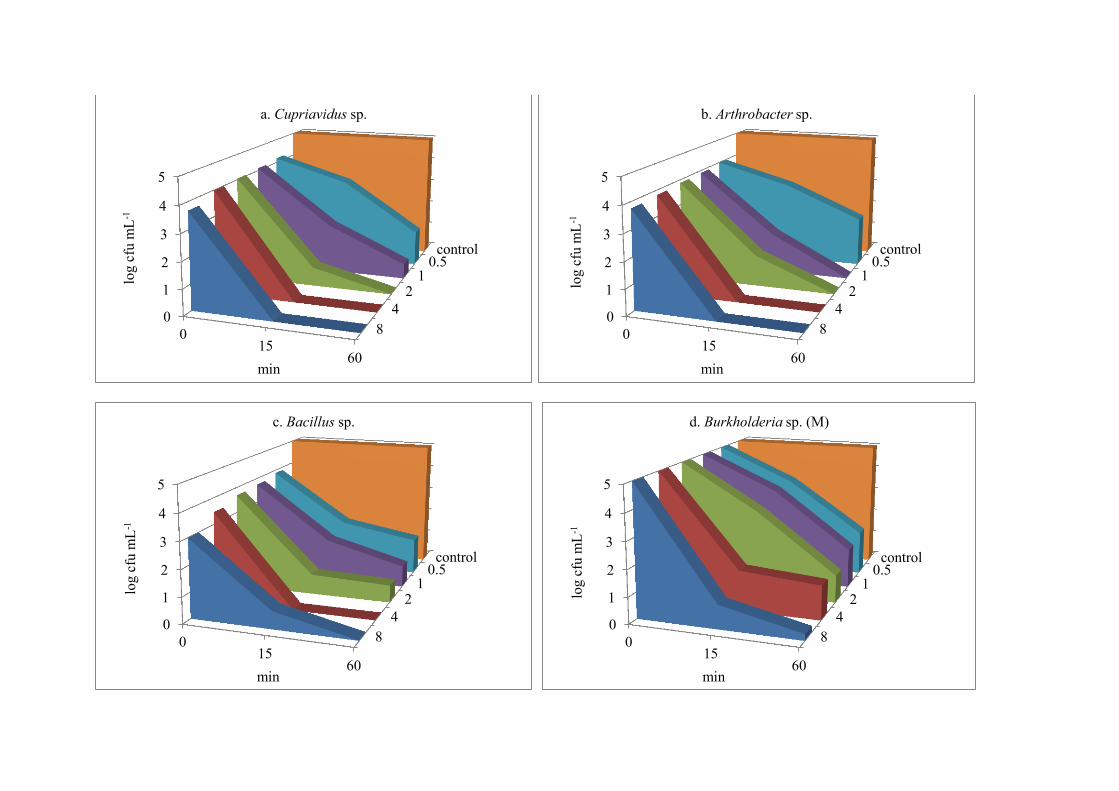
The chlorine suspension test was performed to evaluate contact time (0, 15 and 60 266
min) and disinfectant concentrations (0-8 mg L-1) on inactivation of the bacteria at pH 7.0 and 267
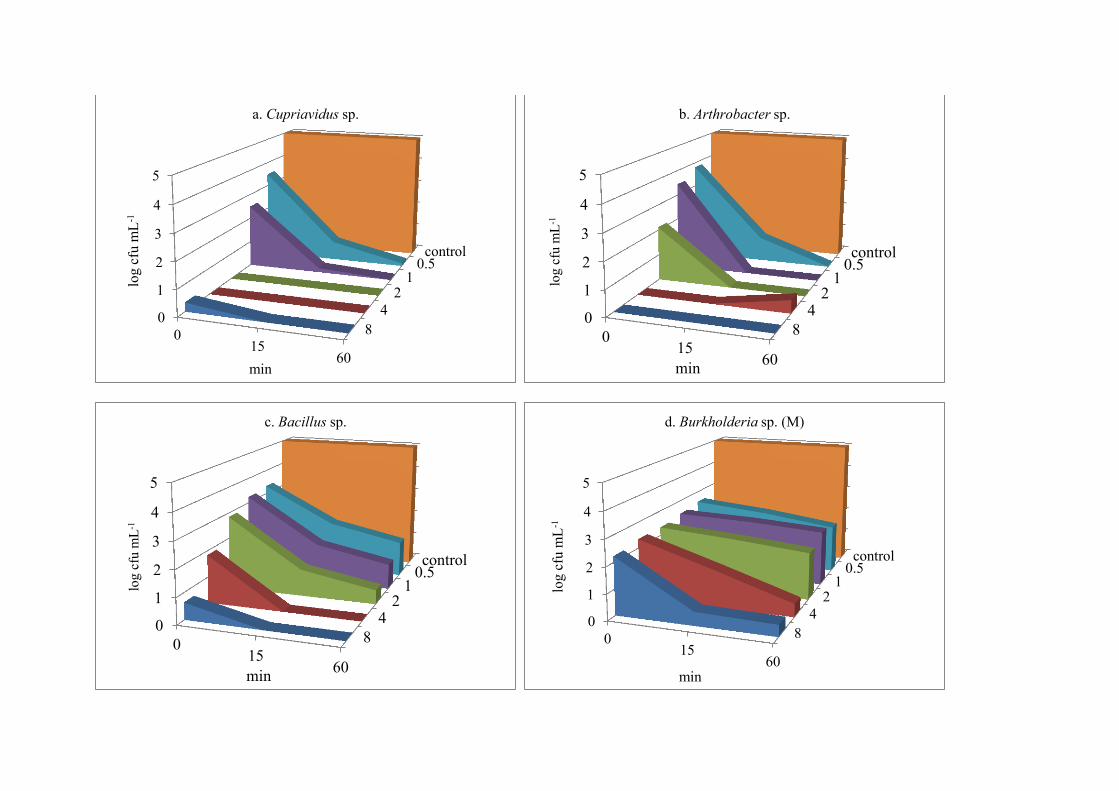
20 °C (Table S3, S4). Burkholderia sp. (M) showed greatest resistance to chlorine than other 268
bacteria at 15 and 60 min contact times (Figure 1, a-f). A decrease of 2-3 log-units of cfu mL-269
1 was observed at concentrations 0.5-2 mg L-1 of free chlorine as compared to the control for 270
all time durations (versus log cfu = 5). However, to reduce viable counts further, it required 271
longer exposures and higher concentrations (4-8 mg L-1 free chlorine), while complete 272

inhibition did not occur at any concentration or contact time against Burkholderia (M) 273
(Figure 1, d). Bacillus sp. had the second highest survival rates at concentrations of 4.0 and 274
8.0 mg L-1; however, viabilities were greater for Bacillus sp. than Burkholderia sp. (M) at 275
quick exposures (0 min) at lower concentrations of 0.5-2 mg L-1 (Figure 1, c-d). These 276
bacteria were resistant to three (TET, SMX and AMX) and two (SMX and AMX) antibiotics, 277
respectively, and had small zones of inhibition, 15 and 7 mm respectively, against standard 278
sodium hypochlorite (Table 4). 279
Cupriavidus sp. and Arthrobacter sp. had resistances against all antibiotics (TET, 280
SMX, CIP, and AMX); both had initial resistance to immediate exposure (0 min) to chlorine 281
at 0.5 and 1.0 mg L-1, but were inhibited with increased concentrations and contact times 282
(Figure 1 a-b). They produced zone of inhibition of 35 and 40 mm in disk diffusion method 283
(Table 4). 284
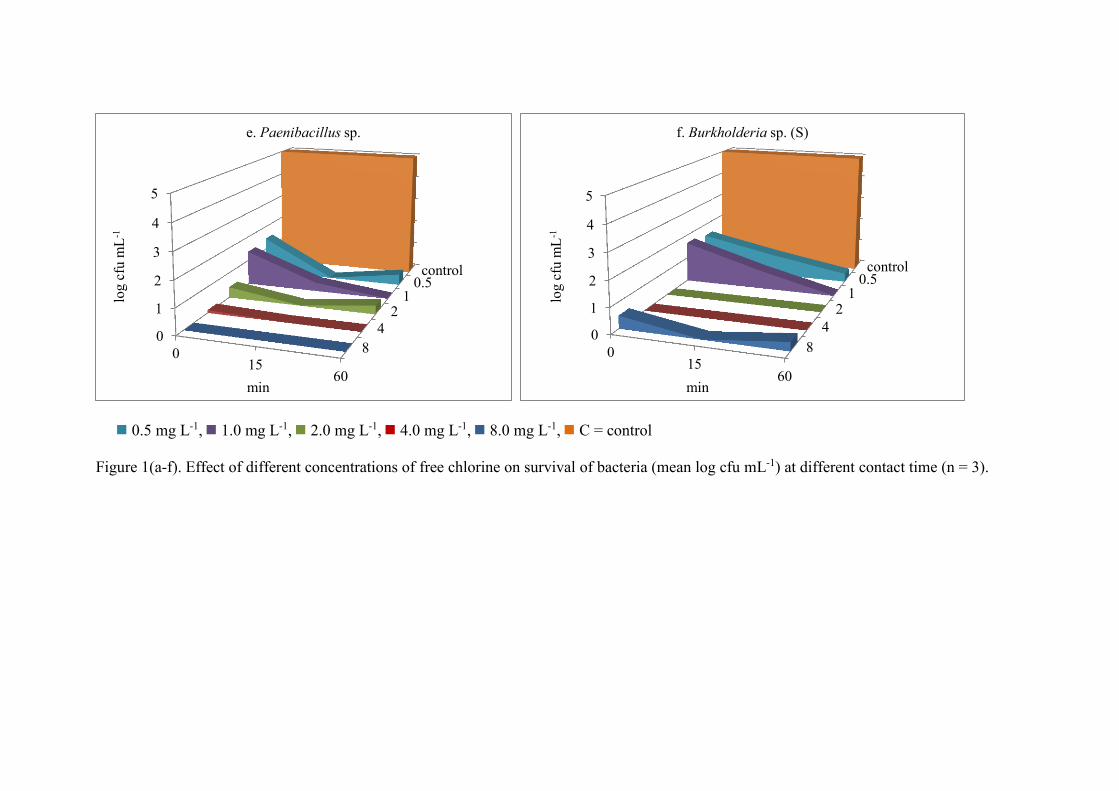
Paenibacillus sp. and Burkholderia (S) sp. showed a decrease of 3-4 log-units at small 285
doses of 0.5 and 1.0 mg L-1 at immediate contact (0 min) (Figure 1, e-f). Paenibacillus sp. 286
was susceptible to all antibiotics tested in this study, while the Burkholderia sp. (S) had 287
resistance against AMX only (Table 4), and they produced large zones of inhibition, 54 and 288
65 mm respectively, in the disinfectant susceptibility testing. 289
The results show that the six bacteria demonstrated similar patterns of resistances and 290
susceptibilities in the agar diffusion test and the suspension test for disinfectants. Those that 291
produced small zones of inhibition had greater survival in the suspension tests. Additionally, 292
all four bacteria having double, triple and quadruple antibiotic-resistances survived better 293
than the single antibiotic-resistant and susceptible bacteria when exposed to free chlorine. 294
Disinfection suspension test for monochloramine 295
The monochloramine suspension test was performed at pH 8.0 and 20 °C (Table S5, 296
S6). The inhibitory effect of monochloramine was not as immediate as for free-chlorine 297

exposure; rates of decrease in survival count were less than one-order of magnitude (Figure 2, 298
a-f), as compared to free-chlorine where declines of 2-3 orders of magnitudes were observed. 299
Among the six bacteria, Burkholderia sp. (M) showed the highest survival rates and was the 300
only test microorganism that showed resistance to all concentrations even after 60 min 301
contact time with both chlorine and monochloramine (Figure 1 d and 2 d). Bacillus sp. was 302
inactivated at 4.0 mg L-1 at 15 min contact time, while showed growth at 8.0 mg L-1 at the 303
same contact time (Figure 2c). Bacillus sp. showed greater survival than the quadruple 304
antibiotic-resistant species Cupriavidus and Arthrobacter at higher doses of 2-8 mg L-1 at 15 305
and 60 min contact time, but it showed less survival at immediate contact (0 min) (Figure 2, 306
a-c). Paenibacillus sp., which was antibiotic sensitive showed greater survival rates than 307
antibiotic-resistant Cupriavidus sp. Arthrobacter sp. and Bacillus sp. at brief (0 min) and 15-308
min exposures (Figure 2e). The resistance of Paenibacillus sp. against monochloramine 309
might also be due to the presence of spores, which allowed them to tolerate the high 310
concentration of disinfectant. For all bacteria, declines in the viability count (cfu mL-1) by 311
monochloramine were less than the chlorine exposure, irrespective of their antibiotic-312
resistances (Figure 2, a-f). Inhibition did not occur at low doses, as compared to chlorine 313
where inhibition occurred even at 0.5 mg L-1 of free chlorine after 60 minutes, indicating that 314
free chlorine has more inhibitory activity for bacteria of DWDS than monochloramine. 315
DISCUSSION 316
Drinking-water samples had diverse genera; some could be potentially pathogenic. 317
For example, species of Burkholderia (Falkinham, 2015), Kocuria (Purty et al., 2013), 318
Paenibacillus (Ouyang et al., 2008), and Dermacoccus (Takahashi et al., 2015) can impact 319
immune-compromised patients and have been transmitted via drinking water (Hunter, 1997, 320
Godoy et al., 2003). Many of these bacteria demonstrate antimicrobial-resistance, e.g., 321

members of Burkholderia cepacia complex (Desai et al., 1998, Coenye et al., 2001) and 322
Cupriavidus’ resistance to metal (Vandamme and Coenye, 2004). Moreover, the presence of 323
Pantoea sp. (Pindi et al., 2013) and Sphingomonas sp. (Koskinen et al., 2000) are 324
undesirable. 325
Different factors contribute to the introduction of bacteria into water distribution 326
systems. In this study, most bacteria were from buildings with storage tanks, or cisterns, for 327
drinking water. The building’s plumbing represents an ideal place for opportunistic bacteria 328
(Wang et al., 2012) by providing them low organic carbon level, high surface to volume ratio, 329
and periods of stagnation (Falkinham, 2015, Falkinham et al., 2015). During periods 330
stagnation or increased water-age residual chlorine levels decline, and the efficacy of 331
bacterial growth inhibition becomes reduced (EPA, 2002). The bacterial community structure 332
in a distribution system becomes influenced (Wang et al., 2014), including those with 333
antimicrobial resistance (Falkinham, 2015, Falkinham et al., 2015) . 334
The response of ARBs to chlorine widely varies (Shi et al., 2013), and it becomes 335
very difficult to ascertain specific mechanisms from these observations. Disinfection 336
efficiency does not remain the same throughout the supply system, and gradients of exposure 337
concentrations develop. Responses range from lethality/complete inhibition at high 338
concentrations, selective survivability of resistant populations at sub-inhibiting 339
concentrations, to triggering biochemical stress responses at much lower (sub-inhibitory) 340
concentrations. 341
Surviving bacteria may innately have increased resistance. Spore-forming bacteria 342
tend to be more resistant, and Gram-negative bacteria are less susceptible than Gram-positive 343
bacteria (Russell, 1998). This might be a reason that in our study, the Bacillus species having 344
spores and antibiotic-resistance against two antibiotics showed more tolerance to chlorine, as 345
compared to multiple-antibiotic resistant Cupriavidus and Arthrobacter which do not form 346

spores. Increases in the abundance of antibiotic-resistant Pseudomonas, Acidovorax and 347
Pleamonas and ARGs have been observed after chlorine treatment (Jia et al., 2015). 348
One mechanisms by which sub-inhibitory levels increase the risk of selection of ARB 349
is by chemical stress (Huang et al., 2013). Chlorine has been shown to increase the 350
abundance of antibiotic-resistance bacteria and genes in opportunistic bacteria (Shrivastava et 351
al., 2004, Shi et al., 2013). This is often attributed to the enrichment of bacteria with plasmids 352
and integrons, which are involved in the transfer and enrichment of resistant markers among 353
bacteria (Shi et al., 2013), as part of their stress-response mechanism. While not tested here, it 354
remains a possibility in our systems; further examines are required. 355
Inactivation of antibiotic-resistant and -sensitive bacteria diminishes when previously 356
exposed to chlorine disinfectant. Bacterial strains with antibiotic resistance have shown to be 357
more tolerant to chlorination (Templeton et al., 2009; Huang et al., 2013). Bacteria show a 358
biphasic mode of inactivation during chlorine disinfection for drinking-water production. A 359
sharp decline of 2-4 log10 in viable cells is not unusual and occurs within 15 min of exposure 360
of 0.1-3 mg L-1 of free chlorine, indicating that chlorine does not require a long exposure time 361
for effectiveness (Lee and Nam, 2002). A 100-fold decrease in viability of bacteria after 60-362
minute exposure to 1 mg L-1 free chlorine, with bacteria viability decreasing quickly between 363
10-20 min of exposure to 1 mg L-1 of chlorine concentration (Howard and Inglis, 2003). 364
These authors also found that E. coli and Ps. aeruginosa growth decreased more than other 365
bacteria, e.g. Burkholderia sp., during an initial five minutes contact with 1 mg L-1 chlorine. 366
In our study, we observed the same phenomenon, and most bacteria inactivation occurring in 367
the initial 15 minutes. 368
In many water distribution systems, residual disinfectant is present which could select 369
for disinfectant-resistant cells by allowing these bacteria to grow, and decreasing the growth 370
of other disinfectant-sensitive competitors (Falkinham et al., 2015). Populations might have 371
had previous exposure to chlorine, which increased their resistance to chlorine. This might be 372
a reason that in our study, some isolated bacteria showed resistance against concentrated 373
standard sodium hypochlorite and produce smaller zones of inhibition (< 20 mm). 374
In this study, we found greater numbers of bacteria in post-cistern systems; in areas 375
where chlorine efficacy could be reduced. These bacteria likely have, or develop, disinfectant 376
resistance, which could also carry higher risks of possessing resistance to antibiotics. More 377
detailed investigation is required to properly conclude chlorination efficacy as part of 378
drinking-water treatment protocols, including other possible disinfection methods which 379
could remove bacteria from these systems. Also, the mechanisms for co-selection must be 380
determined. Overall, the results provide additional evidence as to why care should be taken to 381
minimise the introduction of bacteria into drinking-water distribution systems as these 382
bacteria may cause public health risk with increased exposure and greater chances of 383
antibiotic resistance. 384
■ ASSOCIATED CONTENT 385
Supporting Information 386
■ AUTHOR INFORMATION 387
Corresponding Author 388
*Phone: +44(0) 141 548 3351 389
Present Addresses 390
Department of Civil and Environmental Engineering, Level 5, James Weir Building, 75 391
Montrose Street, Glasgow G1 1XJ, UK 392
Author Contributions 393

All authors contributed to the research. CK conceptualised the research topic; SK performed 394
the experiments and wrote the paper. All reviewed and edited the paper. 395
Notes 396
The authors declare no competing financial interest. 397
■ ACKNOWLEDGEMENTS: 398
We are thankful to Dr. Ameet Pinto, University of Glasgow, Scotland, UK for his guidance in 399
monochloramine experiments. The research is supported by Schlumberger Foundation, 400
Faculty for the Future grant in the form of tuition fee and stipend for the SK’s PhD. 401
■ ABBREVIATIONS 402
ARB Antibiotic-resistant bacteria 403
ARG Antibiotic resistance genes 404
PBS Phosphate buffer saline 405
DPD N,N-diethyl-p-phenylenediamine 406
PCR Polymerase chain reaction 407
DNA Deoxyribonucleic acid 408
■ REFERENCES 409
Al-Jassim, N., Ansari, M.I., Harb, M., Hong, P.Y., 2015. Removal of bacterial contaminants 410 and antibiotic resistance genes by conventional wastewater treatment processes in Saudi 411 Arabia: is the treated wastewater safe to reuse for agriculture irrigation. Water Research 73, 412 277-290. doi:10.1016/j.watres.2015.01.036 413
Allen, H.K., Donato, J., Wang, H.H., Cloud-Hansen, K.A., Davies, J., Handelsman, J., 2010. 414
Call of the wild: antibiotic-resistance genes in natural environments. Nature Reviews 415 Microbiology 8, 251-259. doi.10.1038/nrmicro2312 416
APHA, 1999. Standard methods for the examination of water and wastewater (chlorine 417
residual) 4500-Cl A. 418

Armstrong, J.L., Shigeno, D.S., Calomiris, J.J., Seidler, R.J., 1981. Antibiotic-resistant 419 bacteria in drinking-water. Applied and Environmental Microbiology 42, 277-283. 420
Armstrong, J.L., Calomiris, J.J., Seidler, R.J., 1982. Selection of antibiotic-resistant standard 421 plate count bacteria during water treatment. Applied and Environmental Microbiology 44, 422 308-316. 423
Bergeron, S., Boopathy, R., Nathaniel, R., Corbin, A., LaFleur, G., 2015. Presence of 424 antibiotic-resistant bacteria and antibiotic-resistance genes in raw source water and treated 425 drinking-water. International Biodeterioration and Biodegradation 102, 370-374. 426 doi.10.1016/j.ibiod.2015.04.017 427
Berry, D., Xi, C., Raskin, L., 2006. Microbial ecology of drinking-water distribution systems. 428
Current Opinion in Biotechnology 17, 297-302. doi.10.1016/j.copbio.2006.05.007 429
Bessa, L.J., Dias, V.F., Mendes, Â., Martins-Costa, P., Ramos, H., Paulo Martins da Costa, 430
2014. How growth ability of multidrug-resistant Escherichia coli is affected by abiotic stress 431 Factors. Open Journal of Preventive Medicine 4, 250-256. doi.10.4236/ojpm.2014.45031 432
Brettar, I., Hofle, M.G., 2008. Molecular assessment of bacterial pathogens - a contribution to 433 drinking-water safety. Current Opinion in Biotechnology 19, 274-280. 434
doi.10.1016/j.copbio.2008.04.004 435
Bridier, A., Briandet, R., Thomas, V., Dubios-Brissonnet, F., 2011. Resistance of bacterial 436 biofilms to disinfectants: a review. Biofouling: The Journal of Bioadhesion and Biofilm 437
Research 27, 1017-1032. doi:10.1080/08927014.2011.626899 438
Burch, T.R., Sadowsky, M.J., LaPara, T.M., 2013. Air-drying beds reduce the quantities of 439
antibiotic-resistance genes and class 1 integrons in residual municipal wastewater solids. 440 Environmental Science and Technology 47, 9965-9971. doi.10.1021/es4024749 441
Caporaso, J.G., Lauber, C.L., Walters, W.A., Berg-Lyons, D., Lozupone, C.A., Turnbaugh, 442 P.J., Fierer, N., Knight, R., 2011. Global patterns of 16S rRNA diversity at a depth of 443
millions of sequences per sample. The Proceedings of the National Academy of Sciences of 444 the United States of America 108 Suppl 1, 4516-4522. doi.10.1073/pnas.1000080107 445
Chao, Y., Ma, L., Yang, Y., Ju, F., Zhang, X.X., Wu, W.M., Zhang, T., 2013. Metagenomic 446
analysis reveals significant changes of microbial compositions and protective functions 447 during drinking-water treatment. Science Reports 3, 1-9. doi.10.1038/srep03550 448
Chen, B., Liang, X., Nie, X., Huang, X., Zou, S., Li, X., 2015. The role of class I integrons in 449 the dissemination of sulfonamide-resistance genes in the Pearl River and Pearl River Estuary, 450
South China. Journal of Hazardous Materials 282, 61-67. doi.10.1016/j.jhazmat.2014.06.010 451
Cherchi, C., Gu, A.Z., 2011. Effect of bacterial growth stage on resistance to chlorine 452 disinfection. Water, Science and Technology 64, 7-13. doi.102166/wst.2011.546 453
Chiao, T.-H., Clancy, T.M., Pinto, A., Xi, C., Raskin, L., 2014. Differential resistance of 454 drinking-water bacteial populations to monochloriamine disinfection. Environmental Science 455
and Technology 48, 4038-4047. dx.doi.org/10.1021/es4055725 456
Clinical And Laboratory Standards Insitute, C., 2011. Performance standards for 457 antimicrobila susceptibility testing; Twenty-first informational supplement. CLSI document 458 M100-S21, Vol. 31, No. 1. Clinical Laboratory Standards Institute, Wayne, PA., pp. 1-172. 459
Clinical And Laboratory Standards Institute, C., 2012a. Performance standards for 460
antimicrobial disk susceptibility tests; Approved standard-Eleventh edition. CLSI document 461
M02-A11. Vol. 32, No. 1 Clinical Laboratory Standards Institute, Wayne, PA., pp. 1-76. 462

Clinical And Laboratory Standards Institute, C., 2012b. Methods for dilution antimicrobial 463 susceptibility tests for bacteria that grow aerobically; Approved Standard-Ninth Edition CLSI 464 document M07-A9, Vol. 32, No. 2. Clinical Laboratory Standards Institute, Wayne, PA., pp. 465 1-88. 466
Coenye, T., Vandamme, P., Govan, J.R., LiPuma, J.J., 2001. Taxonomy and identification of 467
the Burkholderia cepacia complex. Journal of Clinical Microbiology 39, 3427-3436. 468 doi.10.1128/JCM.39.10.3427-3436.2001 469
Desai, M., Buhler, T., Weller, P.H., Brown, M.R., 1998. Increasing resistance of planktonic 470 and biofilm cultures of Burkholderia cepacia to ciprofloxacin and cettazidime durign 471 exponential growth. Journal of Antimicrobial Chemotherapy 42, 153-160. 472
doi.10.1093/jac/42.2.153 473
Diehl, D.L., Lapara, T.M., 2010. Effect of temperature on the fate of genes encoding 474
tetracycline-resistance and the integrase of class 1 integrons within anaerobic and aerobic 475 digesters treating municipal waster water solids. Environmental Science and Technology 44, 476 9128-9133.doi.10.1021/es102765a 477
Dodd, M.C., 2012. Potential impacts of disinfection processes on elimination and 478 deactivation of antibiotic-resistance genes during water and wastewater treatment. Journal of 479
Environmental Monitoring 14, 1754-1771. doi:10.1039/c2em00006g 480
Driedger, A.M., Rennecker, J.L., Martinas, B.J., 2001. Inactivation of Cryptosporidium 481
parvum oocysts with ozone and monochloramine at low temperature. Water Research 35, 41-482 48. doi:10.1016/S0043-1354(00)00260-8 483
Environmental Protection Agency (EPA), 2002. Effects of water age on distribution system 484 quality. in: Agency, U.S.E.P. (Ed.). AWWA, Washington DC, USA, pp. 1-17. 485
Fahrenfeld, N., Ma, Y., O'Brien, M., Pruden, A., 2013. Reclaimed water as a reservior of 486 antibiotic-resistance genes: distribution system and irrigation implications. Frontiers in 487
Microbiology 4, 1-10. doi: 10.3389/fmicb.2013.00130 488
Falkinham, J.O., 3rd, 2015. Common features of opportunistic premise plumbing pathogens. 489 International journal of environmental research and public health 12, 4533-4545. 490
doi.10.3390/ijerph120504533 491
Falkinham, J.O., Pruden, A., Edwards, M., 2015. Opportunistic premise plumbing pathogens: 492
Increasingly important pathogens in drinking-water. Pathogens 4, 373-386. 493 doi.10.3390/pathogens4020373 494
Farkas, A., Butiuc-Keul, A., Ciataras, D., Neamtu, C., Craciunas, C., Podar, D., Dragan-495 bularda, M., 2013. Microbiological contamination and resistance genes in biofilms occuring 496 during the drinking-water treatment process. Science of the Total Environment 443, 932-938. 497 http://dx.doi.org/10.1016/j.scitotenv.2012.11.068 498
Galvin, S., Boyle, F., Hickey, P., Vellinga, A., Morris, D., Cormican, M., 2010. Enumeration 499
and characterization of antimicrobial-resistant Escherichia coli bacteria in effluent from 500 municipal, hospital, and secondary treatment facility sources. Applied and Environmental 501 Microbiology 76, 4772-4779. doi: 10.1128/AEM.02898-09 502
Gaze, W.H., Zhang, L., Abdouslam, N.A., Hawkey, P.M., Calvo-Bado, L., Royle, J., Brown, 503 H., Davis, S., Kay, P., Boxall, A.B., Wellington, E.M., 2011. Impacts of anthropogenic 504
activity on the ecology of class 1 integrons and integron-associated genes in the environment. 505
The ISME Journal 5, 1253-1261. doi.10.1038/ismej.2011.15 506

Gillings, M.R., Holley, M.P., Stokes, H.W., 2009. Evidence for dynamic exchange of qac 507 gene cassettes between class 1 integrons and other integrons in freshwater biofilms. FEMS 508 Microbiology Letter 296, 282-288. doi.10.1111/j.1574-6968.2009.01646.x 509
Godoy, D., Randle, G., Simpson, A.J., Aanensen, D.M., Pitt, T.L., Kinoshita, R., Spratt, 510 B.G., 2003. Multilocus sequence typing and evolutionary relationships among the causative 511
agents of melioidosis and glanders, Burkholderia pseudomallei and Burkholderia mallei. 512 Journal of Clinical Microbiology 41, 2068-2079. doi.10.1128/jcm.41.5.2068-2079.2003. 513
Guo, M.-T., Yuan, Q.-B., Yang, J., 2013. Ultraviolet reduction of erythromycin and 514 tetracycline-resistant heterotrophic bacteria and their resistance genes in municipal 515 wastewater. Chemosphere 93, 2864-2868. doi.10.1016/j.chemosphere.2013.08.068 516
Guo, X., Li, J., Yang, F., Yang, J., Yin, D., 2014. Prevalence of sulfonamide and tetracycline-517
resistance genes in drinking-water treatment plants in the Yangtze River Delta, China. The 518
Science of the Total Environment 493, 626-631. doi.10.1016/j.scitotenv.2014.06.035 519
Hong, P.Y., Hwang, C., Ling, F., Andersen, G.L., LeChevallier, M.W., Liu, W.T., 2010. 520 Pyrosequencing analysis of bacterial biofilm communities in water meters of a drinking-521 water distribution system. Applied Environmental Microbiology 76, 5631-5635. 522 doi.10.1128/AEM.00281-10 523
Howard, K., Inglis, T.J.J., 2003. The effect of free chlorine on Burkholderia pseudomallei in 524 potable water. Water Research 37, 4425-4432. doi:10.1016/S0043-1354(03)00440-8 525
Howard, K., Inglis, T.J.J., 2005. Disinfection of Burkholderia pseudomallei in potable water. 526 Water Research 39, 1085-1092. doi.10.1016/j.watres.2004.12.028 527
Hsu, J.T., Chen, C.Y., Young, C.W., Chao, W.L., Li, M.H., Liu, Y.H., Lin, C.M., Ying, C., 528 2014. Prevalence of sulfonamide-resistant bacteria, resistance genes and integron-associated 529
horizontal gene transfer in natural water bodies and soils adjacent to a swine feedlot in 530 northern Taiwan. Journal of Hazardous Material 277, 34-43. 531
doi.10.1016/j.jhazmat.2014.02.016 532
Huang, J.-J., Hu, H.-Y., Wu, Y.-H., Wei, B., Lu, Y., 2013. Effect of chlorination and 533 ultraviolet disinfection on tetA-mediated tetracycline-resistance of Escherichia coli. 534
Chemoshpere 90, 2247-2253. doi: 10.1016/j.chemosphere.2012.10.008. 535
Hunter, P.R., 1997. Waterborne disease, epidemiology and ecology, Chapter 21: Melioidosis. 536
Chichester John Wiley and Sons Ltd., England. 537
Jaglic, Z., Cervinkova, D., Vlkova, H., Michu, E., Kunova, G., Babak, V., 2012. Bacterial 538
biofilms resist oxidising agents due to the presence of organic matter. Czech Journal of Food 539 Science 30, 178-187. 540
Jia, S., Shi, P., Hu, Q., Li, B., Zhang, T., Zhang, X.X., 2015. Bacterial community shift drives 541 antibiotic-resistance promotion during drinking-water chlorination. Environmental Science 542 and Technology 49, 12271-12279. 543
Knapp, C.W., Lima, L., Rieumont, S.O., Bowen, E., Werner, D., Graham, D.W., 2012. 544 Seasonal variations in antibiotic-resistance gene transport in the Almendared River, Havana, 545 Cuba. Frontiers in Microbiology 3, 396-406. doi: 10.3399/fmocb.2012.00396 546
Koczura, R., Mokracka, J., Jablonska, L., Gozdecka, E., Kubek, M., Kaznowski, A., 2012. 547 Antimicrobial resistance of integron-harboring Escherichia coli isolates from clinical 548
samples, wastewater treatment plant and river water. Science of the Total Environment 414, 549
680-685. doi.10.1016/j.scitotenv.2011.10.036 550

Kohanski, M.A., Dwyer, D.J., Collins, J.J., 2010. How antibiotics kill bacteria: from targets 551 to networks. Nature Review Microbiology, 8, 423-435. doi. 10.1038/nrmicro2333 552
Koskinen, R., Ali-Vehmas, T., Kampfer, P., Laurikkala, M., Tsitko, I., Kostyal, E., Atroshi, 553 R., Salkinoja-Salonen, M., 2000. Characterization of Sphingomonas isolates from Finnish and 554 Swedish drinking-water distribution sytems. Journal of Applied Microbiology 89, 687-696. 555
doi:10.1046/j.1365-2672.2000.01167.x 556
Laroche, E., Petit, F., Fournier, M., Pawlak, B., 2010. Transport of antibiotic-resistant 557 Escherichia coli in a public rural karst water supply. Journal of Hydrology 392, 12-21. 558 doi.10.1016/j.jhydrol.2010.07.022 559
Lee, Y.-J., Nam, S.-H., 2002. Reflection on kinetic models to the chlorine disinfection for 560
drinking-water production. The Journal of Microbiology 40, 119-124. 561
Lee, W., Westerhoff, P., Yang, X., Shang, C., 2007. Comparison of colorimetric and 562
membrane introduction mass spectrometry techniques for chloramine analysis. Water 563 Research 41, 3097-3102. doi.10.1016/j.watres.2007.04.032 564
Luddin, N., Ahmed, H.M.A., 2013. The antibacterial activity of sodium hypochlorite and 565 chlorhexidine against Enterococcus faecalis: A review on agar diffusion and direct contact 566
methods. Journal of Conservative Dentistary 16, 9-16. doi:10.4103/0972-0707.105291 567
Mokracka, J., Koczura, R., Kaznowski, A., 2012. Multiresistant Enterobacteriaceae with class 568 1 and class 2 integrons in a municipal wastewater treatment plant. Water Research 46, 3353-569
3363. doi.10.1016/j.watres.2012.03.037 570
Ouyang, J., Pei, Z., Lutwick, L., Dalal, S., Yang, L., Cassai, N., Sandhu, K., Hanna, B., 571
Wieczorek, R.L., Bluth, M., Pincus, M.R., 2008. Case report, Paenibacillus thiaminolyticus, 572 A new cause of human infection, including bacteremia in a patient on hemodialysis. Annual 573
Clinical Laboratory Science 4, 393-400. 574
Ozgumus, O.B., Sandalli, C., Sevim, A., Celik-Sevim, E., Sivri, N., 2009. Class 1 and class 2 575
integrons and plasmid-mediated antibiotic-resistance in coliforms isolated from ten rivers in 576 northern Turkey. Journal of Microbiology 47, 19-27. doi.10.1007/s12275-008-0206-z 577
Pindi, P.K., Yadav, P.R., Shanker, A.S., 2013. Identification of opportunistic pathogenic 578
bacteria in drinking-water samples of different rural health centers and their clinical impacts 579 on humans. Biomed Research International 2013, 348250. doi.10.1155/2013/348250 580
Poggio, C., Arciola, C.R., Dagna, A., Chiesa, M., Sforza, D., Visai, L., 2010. Antimicrobial 581 activity of sodium hypochlorite-based irrigating solutions. International Journal of Artificial 582
Organs 33, 654-659. 583
Pruden, A., Pei, R., Storteboom, H., Carlson, K.H., 2006. Antibiotic-resistance genes as 584 emerging contaminants: Studies in Northern Colorado. Environmental Science and 585 Technology 40, 7445-7450. doi.10.102/es0604131 586
Pruden, A., Arabi, M., Storteboom, H.N., 2012. Correlation between upstream human 587
activities and riverine antibiotic-resistance genes. Environmental Science and Technology 46, 588 11541-11549. dx.doi.org/10.1021/es302657r 589
Purty, S., Saranathan, R., Prashanth, K., Narayanan, K., Asir, J., Sheela Devi, C., Kumar 590 Amarnath, S., 2013. The expanding spectrum of human infections caused by Kocuria species: 591 a case report and literature review. Emerging Microbes and Infections 2, e71. 592
doi.10.1038/emi.2013.71 593

Ridgway, H.F., Olson, B.H., 1982. Chlorine-resistance patterns of bacteria from two 594 drinking-water distribution systems. Applied and Environmental Microbiology 44, 972-987. 595
Russell, A.D., 1998. Bacterial resistance to disinfectants: present knowledge and future 596 problems. Journal of Hospital Infection 43(Suppl), S57-S68. 597
Sassone, L.M., Fidel, R.A.S., Murad, C.F., Fidel, S.R., Hirata, R., 2008. Antimicrobial 598
activity of sodium hypochlorite and chlorhexidine by two different tests. Australian 599 Endodontic Journal 34, 19-24. doi.10.1111/j.1747-4477.2007.00071.x 600
Scottish-Water, 2012a. From where water comes, Fact sheet 1 SWFact WE5 10/12. Scottish 601 Water, Scotland, UK, pp. 1-4. www.scottishwater.co.uk. 602
Scottish-Water, 2012b. Water quality standards explained, Fact sheet 2 SWFact WQ5 10/12. 603
Scottish Water, Scotland, UK, pp. 1-4. www.scottishwater.co.uk. 604
Scully, F.E., Hartman, A.C., 1996. Disinfectoin interference in wastewaters by natural 605
organic nitrogen compounds. Environmental Science and Technology 30, 1466-1471. 606
Scully, F.E., Hogg, P.A., Kennedy, G., Lewicki, C., Rule, A.M., Soffriti, J.G., 1999. 607 Development of disinfection-resistant bacteria during wastewater treatment. Water 608 Environment Research 71, 277-281. 609
Shi, P., Jia, S., Zhang, X.X., Zhang, T., Cheng, S., Li, A., 2013. Metagenomic insights into 610 chlorination effects on microbial antibiotic-resistance in drinking-water. Water Res 47, 111-611 120. doi.10.1016/j.watres.2012.09.046 612
Shrivastava, R., Upreti, R.K., Jain, S.R., Prasad, K.N., Seth, P.K., Chaturvedi, U.C., 2004. 613 Suboptimal chlorine treatment of drinking-water leads to selection of multidrug-resistant 614
Pseudomonas aeruginosa. Ecotoxicology and Environmental Safety 58, 277-283. 615 doi.10.1016/s0147-6513(03)00107-6 616
Su, H.C., Ying, G.G., Tao, R., Zhang, R.Q., Zhao, J.L., Liu, Y.S., 2012. Class 1 and 2 617 integrons, sul resistance genes and antibiotic-resistance in Escherichia coli isolated from 618
Dongjiang River, South China. Environmental Pollution 169, 42-49. 619 doi.10.1016/j.envpol.2012.05.007 620
Takahashi, N., Shinjoh, M., Tomita, H., Fujino, A., Sugita, K., Katohno, Y., Kuroda, T., 621
Kikuchi, K., 2015. Catheter-related blood stream infection caused by Dermacoccus barathri, 622 representing the first case of Dermacoccus infection in humans. Journal of Infection and 623
Chemotherapy 21, 613-616. doi.10.1016/j.jiac.2015.04.007 624
Talukdar, P.K., Rahman, M., Rahman, M., Nabi, A., Islam, Z., Hoque, M.M., Endtz, H.P., 625
Islam, M.A., 2013. Antimicrobial resistance, virulence factors and genetic diversity of 626 Escherichia coli isolates from household water supply in Dhaka, Bangladesh. PloS one 8, 627 e61090. doi.10.1371/journal.pone.0061090 628
Templeton, M.R., Oddy, F., Leung, W.-k., Rogers, M., 2009. Chlorine and UV disinfection 629 of ampicillin-resistant and trimetoprim-resistant Eschirichia coli. Canadian Journal of Civil 630
Engineering 36, 889-894. doi: 10.1139/L09-040 631
Vandamme, P., Coenye, T., 2004. Taxonomy of the genus Cupriavidus: a tale of lost and 632 found. International Journal of Systematic and Evolutionary Microbiology 54, 2285-2289. 633 doi.10.1099/ijs.0.63247-0 634
Wang, H., Masters, S., Hong, Y., Stallings, J., 111, J.O.F., Edwards, M.A., Pruden, A., 2012. 635
Effect of disinfectant, water age, and pipe material on occurence and persistence of 636

Legionella, Mycobacteria, Pseusomonas aeruginosa, and two amoebas. Environmental 637 Science and Technology 46, 11566-11574. dx.doi.org.10.1021/es303212a 638
Wang, H., Edwards, M.A., 111, J.O.F., Pruden, A., 2013. Probiotic approach to pathogen 639 control in premise plumbing systems? A Review. Environmental Scinece and Technology 47, 640 10117-10128. dx.doi.org/10.1021/es402455r 641
Wang, H., Masters, S., Edwards, M.A., 111, J.O.F., Pruden, A., 2014. Effect of disinfectant, 642 water age, and pipe materials on bacterial and eukaryotic community structure in drinking 643 water biofilm. Environmental Science and Technology 48, 1426-1435. 644 dx.doi.org/10.1021/es402636u 645
Wellington, E.M.H., Boxall, A.B.A., Cross, P., Feil, E.J., Gaze, W.H., Hawkey, P.M., 646
Johnson-Rollings, A.S., Jones, D.L., Lee, N.M., Otten, W., Thomas, C.M., Williams, A.P., 647
2013. The role of the natural environment in the emergence of antibiotic-resistance in Gram-648
negative bacteria. The Lancet Infectious Diseases 13, 155-165. doi.10.1016/s1473-649 3099(12)70317-1 650
Wong, H.S., Townsend, K.M., Fenwick, S.G., Trengove, R.D., O'Handley, R.M., 2010. 651 Comparative susceptibility of planktonic and 3-day-old Salmonella typhimurium biofilms to 652 disinfectants. Journal of Applied Microbiology 108, 2222-2228. doi:10.1111/j.1365-653
2672.2009.04630.x 654
Xi, C., Zhang, Y., Marrs, C.F., Ye, W., Simon, C., Foxman, B., Nriagu, J., 2009. Prevalence 655
of antibiotic-resistance in drinking-water treatment and distribution systems. Applied and 656 Environmental Microbiology 75, 5714-5718. doi:10.1128/AEM.00382-09 657
Yuan, Q.B., Guo, M.T., Yang, J., 2015. Fate of Antibiotic-resistant bacteria and genes during 658 wastewater chlorination: Implication for antibiotic-resistance control. PloS one 10, e0119403. 659
doi.10.1371/journal.pone.0119403 660
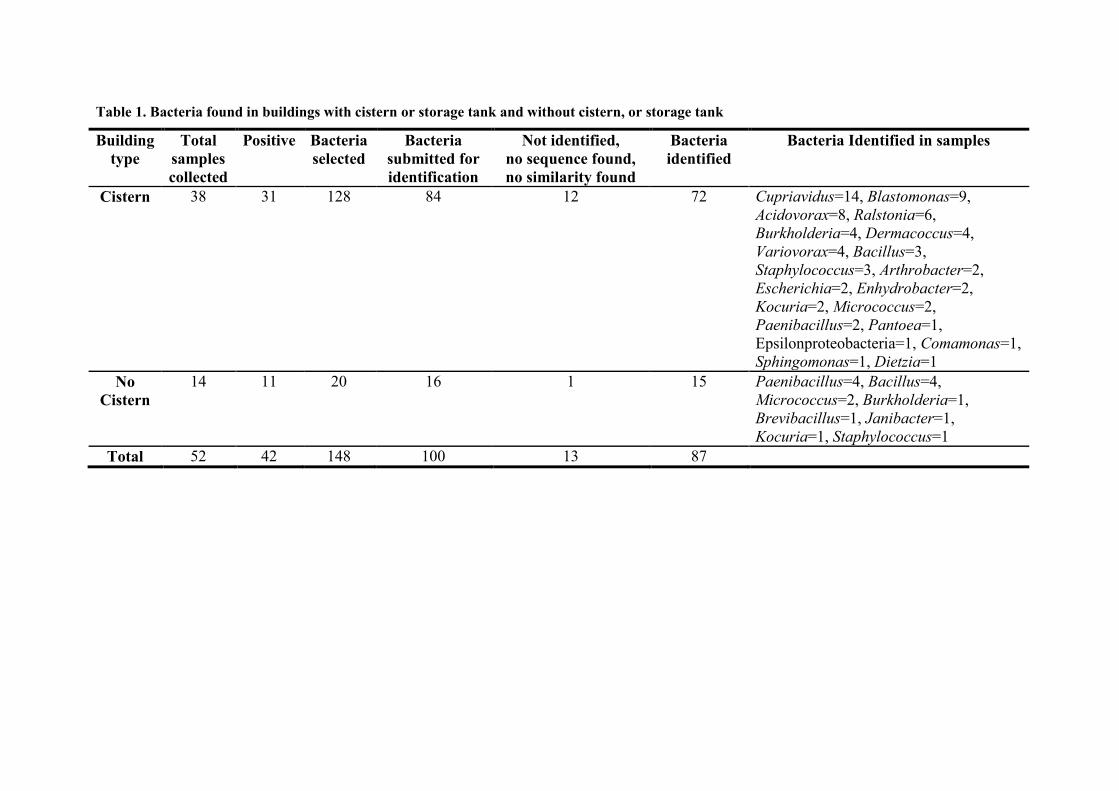
Table 1. Bacteria found in buildings with cistern or storage tank and without cistern, or storage tank
Building
type
Total
samples
collected
Positive Bacteria
selected
Bacteria
submitted for
identification
Not identified,
no sequence found,
no similarity found
Bacteria
identified
Bacteria Identified in samples
Cistern 38 31 128 84 12 72 Cupriavidus=14, Blastomonas=9,
Acidovorax=8, Ralstonia=6,
Burkholderia=4, Dermacoccus=4,
Variovorax=4, Bacillus=3,
Staphylococcus=3, Arthrobacter=2,
Escherichia=2, Enhydrobacter=2,
Kocuria=2, Micrococcus=2,
Paenibacillus=2, Pantoea=1,
Epsilonproteobacteria=1, Comamonas=1,
Sphingomonas=1, Dietzia=1
No
Cistern
14 11 20 16 1 15 Paenibacillus=4, Bacillus=4,
Micrococcus=2, Burkholderia=1,
Brevibacillus=1, Janibacter=1,
Kocuria=1, Staphylococcus=1
Total 52 42 148 100 13 87

Table 2. Disinfectant susceptibility of isolates (zone of inhibition in mm) by Disk Diffusion Method
Disinfectant Size of Zone of inhibition No. of Organisms (%) Organisms
Standard
Sodium
hypochlorite
(14.5%)
< 20 mm 13 (8.8) 5 Bacillus species, 1 Burkholderia specie, 1 Paenibacillus specie, 2 Acidovorax
specie, 4 uncharacterised bacteria
21-40 mm 96 (64.9) 14 Cupriavidus species, 6 Blastomonas species, 4 Acidovorax species, 4
Staphylococcus species, 4 Variovorax species, 2 Paenibacillus species, 2
Arthrobacter species, 2 Bacillus species, 2 Dermacoccus species, 2 Enhydrobacter
species, 2 Kocuria species, 2 Micrococcus species, 2 Ralstonia species, 1
Brevibacillus specie, 1 Comamonas specie, 1 Epsilonproteobacteria, 1 Pantoea
specie, 1 Sphingomonas specie, 43 uncharacterised bacteria
> 41 mm 18 (12.2) 2 Micrococcus species, 2 Paenibacillus species, 1 Acidovorax specie, 1
Blastomonas specie, 1 Escherichia specie, 1 Ralstonia specie, 1 Dietzia specie, 1
Burkholderia specie, 8 uncharacterised bacteria
Commercial
bleach (4.5%
sodium
hypochlorite
< 20 mm 98 (66.2) 13 Cupriavidus species, 6 Blastomonas species, 4 Acidovorax species, 3
Staphylococcus species, 4 Bacillus species, 4 Variovorax species, 4 Paenibacillus
species, 3 Dermacoccus species, 2 Arthrobacter species,, 2 Enhydrobacter species,
2 Ralstonia species, 1 Kocuria species, 1 Micrococcus species, 1 Burkholderia
specie, 1 Comamonas specie, 1 Epsilonproteobacteria, 1 Pantoea specie, 1
Sphingomonas specie, 44 uncharacterised bacteria
21-40 mm 29 (19.6) 3 Acidovorax species, 3 Bacillus species, 2 Micrococcus species, 1 Cupriavidus
species, 1 Blastomonas specie, 1 Staphylococcus specie, 1 Paenibacillus specie, 1
Brevibacillus specie, 1Dietzia specie, 1 Kocuria specie, 1 Ralstonia specie,1
Burkholderia specie, 12 uncharacterised bacteria
> 41 mm 0 No organism
Not tested 21 (14.2) 3 Ralstonia species, 3 Burkholderia species, 2 Dermacoccus species, 1 Kocuria
specie, 1 Blastomonas specie, 1 Acidovorax specie, 1 Janibacter specie, 1
Paenibacillus specie, 1 Escherichia specie, 7 uncharacterised bacteria

Table 3. Single and multiple antibiotic-resistances of bacteria isolated from drinking-water distribution system
Resistant traits Combinations No. of Organisms (%) Isolates
Quadruple TET, SMX, CIP, and AMX 6 (4.1) 1 Cupriavidus specie, 1 Arthrobacter specie, 1 Epsilonproteobacteria, 1 Kocuria
specie, 2 uncharacterised bacteria
Triple TET, SMX, and AMX 7 (4.7) 1 Cupriavidus specie, 4 Burkholderia species, 2 uncharacterised bacteria
SMX, CIP, and AMX 3 (2.0) 1 Micrococcus specie, 1 Acidovorax specie, 1 Dermacoccus specie
Double SMX and AMX 34 (23.0) 9 Cupriavidus species, 1 Comamonas specie, 16 uncharacterised bacteria, 1
Blastomonas specie, 2 Bacillus specie, 1 Acidovorax specie, 2 Staphylococcus
specie, 1 Sphingomonas specie, 1 Kocuria specie
TET and AMX 5 (3.4) 1 Cupriavidus specie, 1Dietzia specie, 3 uncharacterised bacterium
SMX and CIP 4 (2.7) 1 Micrococcus specie, 1Kocuria specie, 1 Bacillus specie, 1 Dermacoccus specie
TET and SMX 1 (0.7) 1 Staphylococcus specie
Single TET 1 (0.7) 1 Uncharacterised bacteria
SMX
13 (8.8) 2 Enhydrobacter species, 1Bacillus specie, 1 Arthrobacter specie, 4
Uncharacterised specie, 1 Brevibacillus specie, 1Dermacoccus specie, 1
Staphylococcus specie, 2 Micrococcus species
AMX
41 (27.7) 6 Acidovorax species, 18 uncharacterised bacteria, 1 Bacillus specie, 4
Variovorax species, 2 Paenibacillus species, 2 Cupriavidus species, 1
Dermacoccus specie, 5 Ralstonia species, 1 Escherichia specie, 1 Burkholderia
specie
No Resistant No Resistance 33 (22.3) 2 Bacillus species, 15 uncharacterised species, 4 Paenibacillus species, 8
Blastomonas species, 1 Escherichia specie, 1 Pantoea specie, 1 Ralstonia specie,
1 Janibacter specie
Resistance organisms: Tetracycline (TET) = 16 µg mL-1, Sulfamethoxazole (SMX) = 512 µg mL-1, Ciprofloxacin (CIP) = 4 µg mL-1 and
Amoxicillin (AMX) = 32 µg mL-1

Table 4. Antibiotic and disinfectant resistance of six test bacteria
Code Identification by 16S-rRNA Antibiotic MICs (µg mL-1)
Resistant Traits for antibiotics Size of zone of inhibition
(mm ± SD) against NaOCl TET SMX CIP AMX
515 Cupriavidus sp. 515 512 16 512 TET, SMX, CIP, and AMX 35 ± 2.8
518 Arthrobacter sp. 512 512 512 512 TET, SMX,CIP, and AMX 40 ± 0.7
527 Bacillus sp. 1 512 0.064 512 SMX and AMX 7 ± 0.0
530 Burkholderia sp. (M) 64 512 0.064 512 TET, SMX, and AMX 15 ± 1.4
641 Paenibacillus sp. 0.016 16 0.008 0.064 Susceptible 54 ± 2.1
643 Burkholderia sp. (S) 8 8 0.032 512 AMX 65 ± 4.2
Resistant organisms: Tetracycline (TET) = 16 µg mL-1, Sulfamethoxazole (SMX) = 512 µg mL-1, Ciprofloxacin (CIP) = 4 µg mL-1 and
Amoxicillin (AMX) = 32 µg mL-1
Table 5: Spearman correlation analysis for size of zone of inhibition by 14.5% standard NaOCl and minimum inhibitory concentrations
(MIC) by four antibiotics (n=127). Significant level was p< 0.05.
TET SMX CIP AMX
Standard NaOCl 14.5% Spearman Correlation -0.219 -0.278 -0.002 -0.303
P value 0.014 0.002 0.981 0.001
Tetracycline (TET), Sulfamethoxazole (SMX), Ciprofloxacin (CIP), Amoxicillin (AMX)
8
4
21
0.5control
0
1
2
3
4
5
015
60
log c
fu m
L-1
min
a. Cupriavidus sp.
8
42
10.5control
0
1
2
3
4
5
015
60
log c
fu m
L-1
min
b. Arthrobacter sp.
8
42
10.5control
0
1
2
3
4
5
015
60
log c
fu m
L-1
min
c. Bacillus sp.
8
4
21
0.5control
0
1
2
3
4
5
015
60
log c
fu m
L-1
min
d. Burkholderia sp. (M)
0.5 mg L-1, 1.0 mg L-1, 2.0 mg L-1, 4.0 mg L-1, 8.0 mg L-1, C = control
Figure 1(a-f). Effect of different concentrations of free chlorine on survival of bacteria (mean log cfu mL-1) at different contact time (n = 3).
8
4
21
0.5control
0
1
2
3
4
5
015
60
log c
fu m
L-1
min
e. Paenibacillus sp.
8
4
21
0.5control
0
1
2
3
4
5
015
60
log c
fu m
L-1
min
f. Burkholderia sp. (S)
8
4
21
0.5control
0
1
2
3
4
5
015
60
log c
fu m
L-1
min
a. Cupriavidus sp.
8
4
21
0.5control
0
1
2
3
4
5
015
60
log c
fu m
L-1
min
b. Arthrobacter sp.
8
4
21
0.5control
0
1
2
3
4
5
015
60
log c
fu m
L-1
min
c. Bacillus sp.
8
4
21
0.5control
0
1
2
3
4
5
015
60
log c
fu m
L-1
min
d. Burkholderia sp. (M)

0.5 mg L-1, 1.0 mg L-1, 2.0 mg L-1, 4.0 mg L-1, 8.0 mg L-1, control
Figure 2(a-f). Effect of different concentrations of monochloramine on survival of bacteria (mean log cfu mL-1) at different contact time (n = 3).
8
4
21
0.5control
0
1
2
3
4
5
015
60
log c
fu m
L-1
min
e. Paenibacillus sp.
8
4
21
0.5control
0
1
2
3
4
5
015
60
log c
fu m
L-1
min
f. Burkholderia sp. (S)

Figure Legend:
Figure 1 (a-f). Effect of different concentrations of free chlorine on survival of bacteria (mean
log cfu mL-1) at different contact time (n = 3).
Figure 2 (a-f). Effect of different concentrations of monochloramine on survival of bacteria
(mean log cfu mL-1) at different contact time (n = 3).