Embed Size (px)
Citation preview
Vol:.(1234567890)
Phenomics (2021) 1:62–72https://doi.org/10.1007/s43657-021-00011-4
1 3
ARTICLE
Distribution Atlas of COVID‑19 Pneumonia on Computed Tomography: A Deep Learning Based Description
Shan Huang1 · Yuancheng Wang1 · Zhen Zhou2 · Qian Yu1 · Yizhou Yu3 · Yi Yang4 · Shenghong Ju1
Received: 2 December 2020 / Revised: 1 January 2021 / Accepted: 7 January 2021 / Published online: 11 May 2021 © International Human Phenome Institutes (Shanghai) 2021
AbstractObjectives To construct a distribution atlas of coronavirus disease 2019 (COVID-19) pneumonia on computed tomography (CT) and further explore the difference in distribution by location and disease severity through a retrospective study of 484 cases in Jiangsu, China.Methods All patients diagnosed with COVID-19 from January 10 to February 18 in Jiangsu Province, China, were enrolled in our study. The patients were further divided into asymptomatic/mild, moderate, and severe/critically ill groups. A deep learning algorithm was applied to the anatomic pulmonary segmentation and pneumonia lesion extraction. The frequency of opacity on CT was calculated, and a color-coded distribution atlas was built. A further comparison was made between the upper and lower lungs, between bilateral lungs, and between various severity groups. Additional lesion-based radiomics analysis was performed to ascertain the features associated with the disease severity.Results A total of 484 laboratory-confirmed patients with 945 repeated CT scans were included. Pulmonary opacity was mainly distributed in the subpleural and peripheral areas. The distances from the opacity to the nearest parietal/visceral pleura were shortest in the asymptomatic/mild group. More diffused lesions were found in the severe/critically ill group. The frequency of opacity increased with increased severity and peaked at about 3–4 or 7–8 o’clock direction in the upper lungs, as opposed to the 5 or 6 o’clock direction in the lower lungs. Lesions with greater energy, more circle-like, and greater surface area were more likely found in severe/critically ill cases than the others.Conclusion This study constructed a detailed distribution atlas of COVID-19 pneumonia and compared specific patterns in different parts of the lungs at various severities. The radiomics features most associated with the severity were also found. These results may be valuable in determining the COVID-19 sub-phenotype.
Keywords COVID-19 · Computed tomography · Deep learning · Distribution atlas · Radiomics
Introduction
As of November 22, more than 57.8 million people were infected with the severe acute respiratory syndrome coro-navirus 2 (SARS-CoV-2) and over 1.3 million deaths were reported worldwide (World Health Organisation 2020). Clinical characteristics, such as typical symptoms, main laboratory findings, and epidemiology of COVID-19, have been reported and updated serially (Huang et al. 2020a; Guan et al. 2020; Special Expert Group for Control of the Epidemic of Novel Coronavirus Pneumonia of the Chinese Preventive Medicine Association 2020).
Since the outbreak, chest computed tomography (CT) has demonstrated particular value in detecting suspected cases and evaluating this illness, especially in epidemic focus (Ai et al. 2020). The imaging findings of coronavirus disease
* Shenghong Ju [email protected]
1 Jiangsu Key Laboratory of Molecular and Functional Imaging, Department of Radiology, Zhongda Hospital, Medical School of Southeast University, 87 Ding Jia Qiao Road, Nanjing 210009, Jiangsu, China
2 School of Electronics Engineering and Computer Science, Peking University, Beijing, China
3 Department of Computer Science, The University of Hong Kong, Hong Kong, China
4 Department of Critical Care Medicine, Zhongda Hospital, School of Medicine, Southeast University, Nanjing, China

63Distribution Atlas of COVID-19 Pneumonia on Computed Tomography: A Deep Learning Based…
1 3
2019 (COVID-19) pneumonia are characterized by bilateral ground-glass opacification and consolidation (Salehi et al. 2020). The pulmonary lesions are distributed as subpleural and peripheral lesions with a predominance in the lower lobe [Salehi et al. (2020); Chung et al. 2020; Xu et al. 2020]. Moreover, it was reported that the imaging manifestation differs various severity of the illness and can reflect the pro-gression or regression throughout the disease course (Feng et al. 2020; Zhang 2020). However, little is known regarding the accurately detailed distribution pattern of the opacity.
Deep learning, in recent years, has been significant in medical imaging processing (Sahiner et al. 2019; Lakhani et al. 2018). Radiomics, which can characterize images quantitatively, demonstrates state-of-the-art performance in radiological imaging analysis (Lambin et al. 2012). These novel approaches have demonstrated great performance in aspects of medical research, such as deferential diagnosis, treatment response and outcome prediction (Sun et al. 2018; She et al. 2018; Coudray et al. 2018).
In this study, we aimed to perform anatomic pulmonary segmentation and pneumonia lesion extraction with a well-trained artificial intelligence (AI) algorithm and make a detailed distribution atlas of COVID-19 pneumonia on chest CT images. We also intended to ascertain some radiomics features that are associated with the disease severity.
Methods
This retrospective study was approved by the Ethics Com-mittee of Zhongda hospital (2020ZDSYLL013-P01 and 2020ZDSYLL019-P01), and the requirement for informed consent was waived. The clinical and radiological data of the cases were collected retrospectively.
All possible patients with COVID-19 entering 24 des-ignated hospitals in Jiangsu Province from January 10 to February 18 were tracked primarily and later checked with diagnostic laboratory results. Patients without crucial clini-cal information or with poor-quality CT images or incom-plete image data were subsequently excluded.
The selected patients were divided into three groups: asymptomatic/mild, moderate and severe/critically ill groups based on the clinical evaluation, in accordance with the crite-ria “Diagnosis and Treatment Program for New Coronavirus Infection (Trial Version 5)” published by the National Health Commission of the People’s Republic of China (National Health Commission of the People’s Republic of China 2020). The asymptomatic/mild group included patients who had no or mild symptoms as well as no abnormal initial radi-ological findings. The moderate group covered patients with typical symptoms, including fever, cough, and radiological findings of pulmonary pneumonia. The patients with the fol-lowing conditions were assigned to the severe/critically ill
group: respiratory distress (respiratory rate ≥ 30 beats/min), mean oxygen saturation (resting state) ≤ 93%, arterial blood oxygen partial pressure/oxygen concentration ≤ 300 mmHg, respiratory failure requiring mechanical ventilation, shock, and intensive care unit (ICU) admission.
CT Acquisition and Imaging Process
All participants underwent initial and follow-up non-contrast high-resolution chest CT examinations in the supine posi-tion. The patients were asked to hold their breath, and scan-ning was conducted at the end of inspiration. Thin-section images were collected preferentially and stored in the format of Digital Imaging and Communications in Medicine.
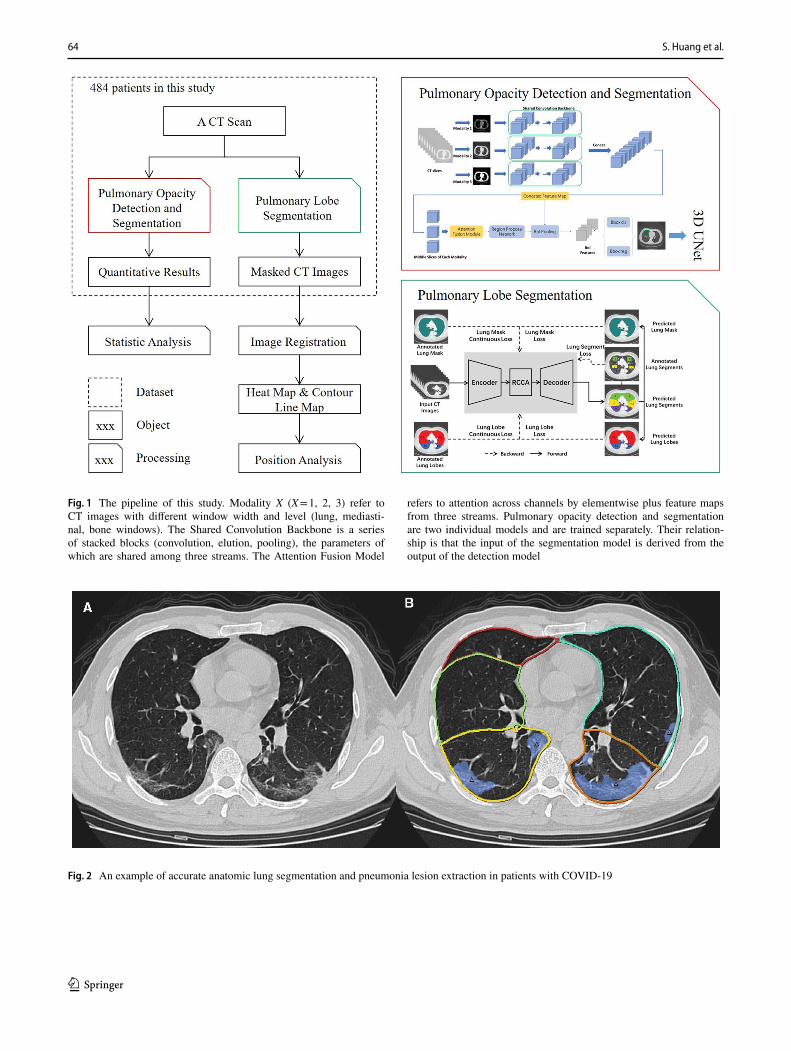
The study pipeline is shown in Fig. 1. The pulmonary lobes and lesions were first segmented via an artificial intel-ligence (AI) system based on a deep learning algorithm (Beijing Deepwise & League of PhD Technology Co.LTD, China). The results were then manually checked by a radi-ologist (W.Y.C, with chest imaging experience of more than 10 years) and modified if any wrong segmentation was found.
An example of accurate segmentation is depicted in Fig. 2. The detailed process of the development of the arti-ficial intelligence (AI) system is completed in the Supple-mentary information.
Image Registration and Distribution Atlas
The image registration method included the following steps: lung mask generation, surface point cloud generation, point cloud registration, and finally, pneumonia position projec-tion. The presumed standard lung (template) was selected from a middle-aged male, who had a good shape of a healthy lung.
1. The lung mask can be obtained through the above seg-mentation process.
2. Some points on the surface of the lung mask were sam-pled to form a point cloud of pseudo-landmarks.
3. Coherent Point Drift (CPD) was used to register the point cloud of a given lung and the template lung, where a transformation was learned.
4. A regression classifier (support vector regression with RBF kernel) was trained to generate the projected loca-tion of each voxel occupied by pneumonia.
All CT images of patients in our study were projected to the template lung, and the heatmap was then generated. That is, the voxel value of the projected standard lung represented the frequency of opacity occurring at this location. By con-necting the points with the same frequency at each slice, the contour line map was drawn. Compared to the heat map, the
64 S. Huang et al.
1 3
Fig. 1 The pipeline of this study. Modality X (X = 1, 2, 3) refer to CT images with different window width and level (lung, mediasti-nal, bone windows). The Shared Convolution Backbone is a series of stacked blocks (convolution, elution, pooling), the parameters of which are shared among three streams. The Attention Fusion Model
refers to attention across channels by elementwise plus feature maps from three streams. Pulmonary opacity detection and segmentation are two individual models and are trained separately. Their relation-ship is that the input of the segmentation model is derived from the output of the detection model
Fig. 2 An example of accurate anatomic lung segmentation and pneumonia lesion extraction in patients with COVID-19
65Distribution Atlas of COVID-19 Pneumonia on Computed Tomography: A Deep Learning Based…
1 3
contour line map could help recognize different regions with different frequencies.
Opacity Location Analysis
The median distance of each voxel in the opacity to the near-est parietal and visceral pleura were calculated in the whole lung and per lobe, respectively.
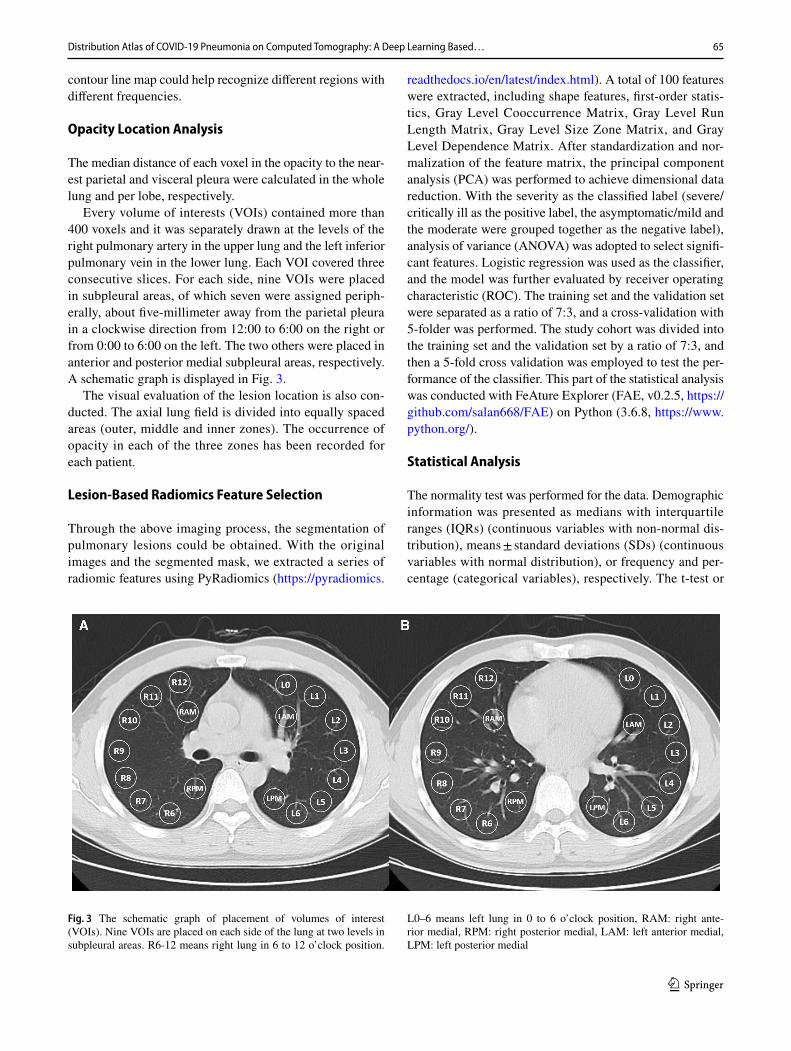
Every volume of interests (VOIs) contained more than 400 voxels and it was separately drawn at the levels of the right pulmonary artery in the upper lung and the left inferior pulmonary vein in the lower lung. Each VOI covered three consecutive slices. For each side, nine VOIs were placed in subpleural areas, of which seven were assigned periph-erally, about five-millimeter away from the parietal pleura in a clockwise direction from 12:00 to 6:00 on the right or from 0:00 to 6:00 on the left. The two others were placed in anterior and posterior medial subpleural areas, respectively. A schematic graph is displayed in Fig. 3.
The visual evaluation of the lesion location is also con-ducted. The axial lung field is divided into equally spaced areas (outer, middle and inner zones). The occurrence of opacity in each of the three zones has been recorded for each patient.
Lesion‑Based Radiomics Feature Selection
Through the above imaging process, the segmentation of pulmonary lesions could be obtained. With the original images and the segmented mask, we extracted a series of radiomic features using PyRadiomics (https:// pyrad iomics.
readt hedocs. io/ en/ latest/ index. html). A total of 100 features were extracted, including shape features, first-order statis-tics, Gray Level Cooccurrence Matrix, Gray Level Run Length Matrix, Gray Level Size Zone Matrix, and Gray Level Dependence Matrix. After standardization and nor-malization of the feature matrix, the principal component analysis (PCA) was performed to achieve dimensional data reduction. With the severity as the classified label (severe/critically ill as the positive label, the asymptomatic/mild and the moderate were grouped together as the negative label), analysis of variance (ANOVA) was adopted to select signifi-cant features. Logistic regression was used as the classifier, and the model was further evaluated by receiver operating characteristic (ROC). The training set and the validation set were separated as a ratio of 7:3, and a cross-validation with 5-folder was performed. The study cohort was divided into the training set and the validation set by a ratio of 7:3, and then a 5-fold cross validation was employed to test the per-formance of the classifier. This part of the statistical analysis was conducted with FeAture Explorer (FAE, v0.2.5, https:// github. com/ salan 668/ FAE) on Python (3.6.8, https:// www. python. org/).
Statistical Analysis
The normality test was performed for the data. Demographic information was presented as medians with interquartile ranges (IQRs) (continuous variables with non-normal dis-tribution), means ± standard deviations (SDs) (continuous variables with normal distribution), or frequency and per-centage (categorical variables), respectively. The t-test or
Fig. 3 The schematic graph of placement of volumes of interest (VOIs). Nine VOIs are placed on each side of the lung at two levels in subpleural areas. R6-12 means right lung in 6 to 12 o’clock position.
L0–6 means left lung in 0 to 6 o’clock position, RAM: right ante-rior medial, RPM: right posterior medial, LAM: left anterior medial, LPM: left posterior medial
66 S. Huang et al.
1 3
analysis of Variance, Kruskal–Wallis or Mann–Whitney test, and Chi-square test were applied in the statistical analysis for normal distributed, non-normal distributed, and categorical data, respectively. All statistical analyses were carried out using R ver. 3.0.3.
Results
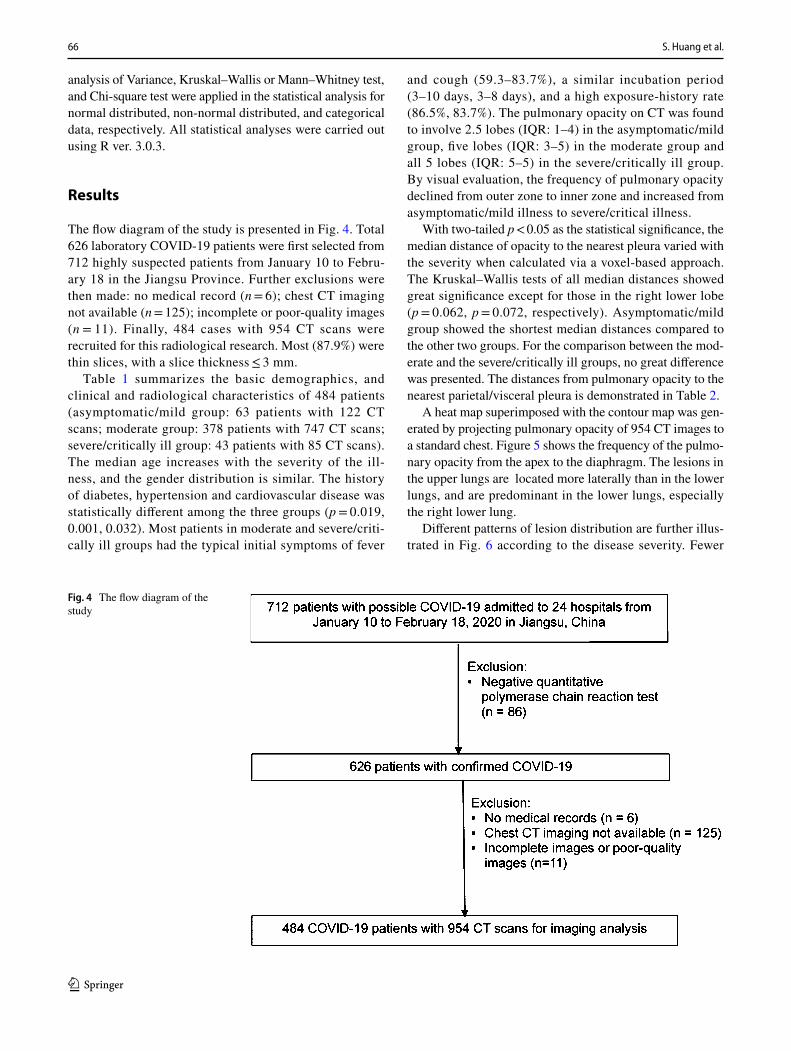
The flow diagram of the study is presented in Fig. 4. Total 626 laboratory COVID-19 patients were first selected from 712 highly suspected patients from January 10 to Febru-ary 18 in the Jiangsu Province. Further exclusions were then made: no medical record (n = 6); chest CT imaging not available (n = 125); incomplete or poor-quality images (n = 11). Finally, 484 cases with 954 CT scans were recruited for this radiological research. Most (87.9%) were thin slices, with a slice thickness ≤ 3 mm.
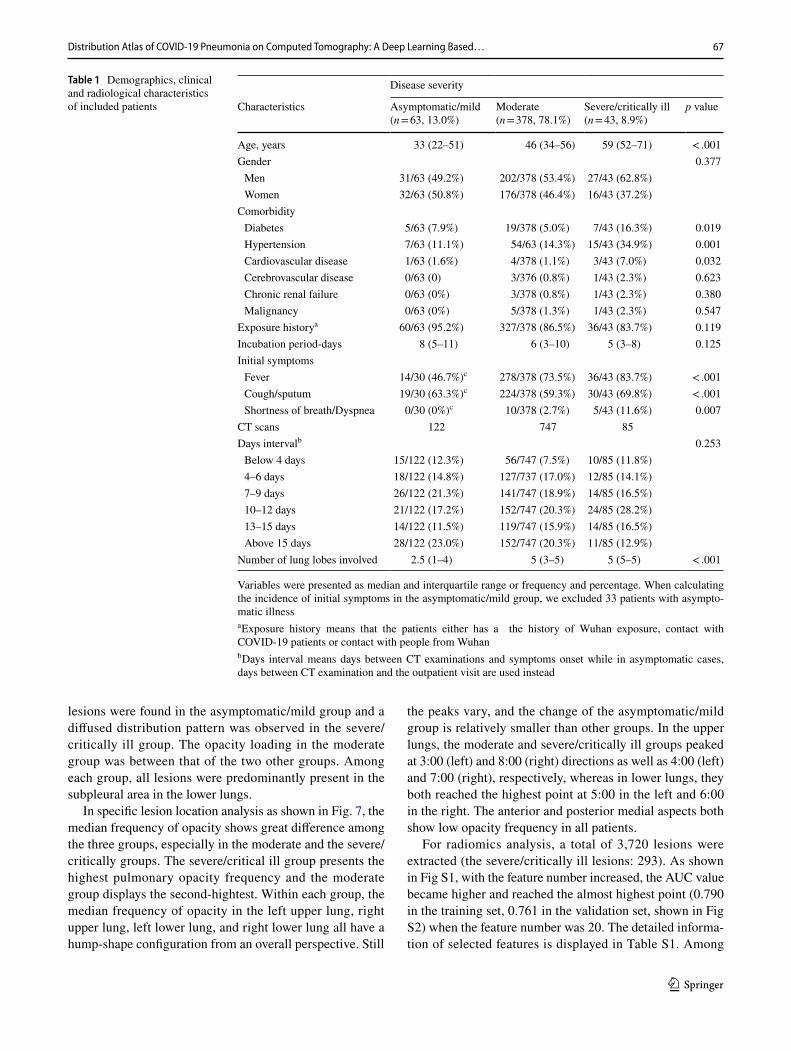
Table 1 summarizes the basic demographics, and clinical and radiological characteristics of 484 patients (asymptomatic/mild group: 63 patients with 122 CT scans; moderate group: 378 patients with 747 CT scans; severe/critically ill group: 43 patients with 85 CT scans). The median age increases with the severity of the ill-ness, and the gender distribution is similar. The history of diabetes, hypertension and cardiovascular disease was statistically different among the three groups (p = 0.019, 0.001, 0.032). Most patients in moderate and severe/criti-cally ill groups had the typical initial symptoms of fever
and cough (59.3–83.7%), a similar incubation period (3–10 days, 3–8 days), and a high exposure-history rate (86.5%, 83.7%). The pulmonary opacity on CT was found to involve 2.5 lobes (IQR: 1–4) in the asymptomatic/mild group, five lobes (IQR: 3–5) in the moderate group and all 5 lobes (IQR: 5–5) in the severe/critically ill group. By visual evaluation, the frequency of pulmonary opacity declined from outer zone to inner zone and increased from asymptomatic/mild illness to severe/critical illness.
With two-tailed p < 0.05 as the statistical significance, the median distance of opacity to the nearest pleura varied with the severity when calculated via a voxel-based approach. The Kruskal–Wallis tests of all median distances showed great significance except for those in the right lower lobe (p = 0.062, p = 0.072, respectively). Asymptomatic/mild group showed the shortest median distances compared to the other two groups. For the comparison between the mod-erate and the severe/critically ill groups, no great difference was presented. The distances from pulmonary opacity to the nearest parietal/visceral pleura is demonstrated in Table 2.
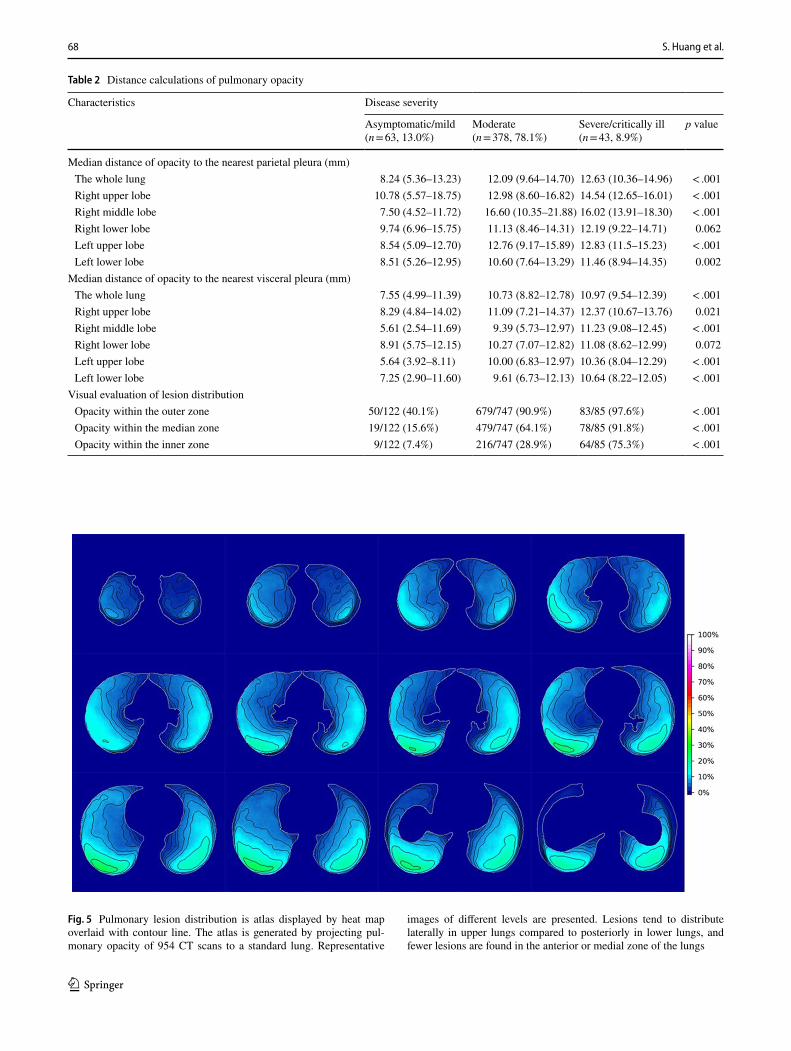
A heat map superimposed with the contour map was gen-erated by projecting pulmonary opacity of 954 CT images to a standard chest. Figure 5 shows the frequency of the pulmo-nary opacity from the apex to the diaphragm. The lesions in the upper lungs are located more laterally than in the lower lungs, and are predominant in the lower lungs, especially the right lower lung.
Different patterns of lesion distribution are further illus-trated in Fig. 6 according to the disease severity. Fewer
Fig. 4 The flow diagram of the study
67Distribution Atlas of COVID-19 Pneumonia on Computed Tomography: A Deep Learning Based…
1 3
lesions were found in the asymptomatic/mild group and a diffused distribution pattern was observed in the severe/critically ill group. The opacity loading in the moderate group was between that of the two other groups. Among each group, all lesions were predominantly present in the subpleural area in the lower lungs.
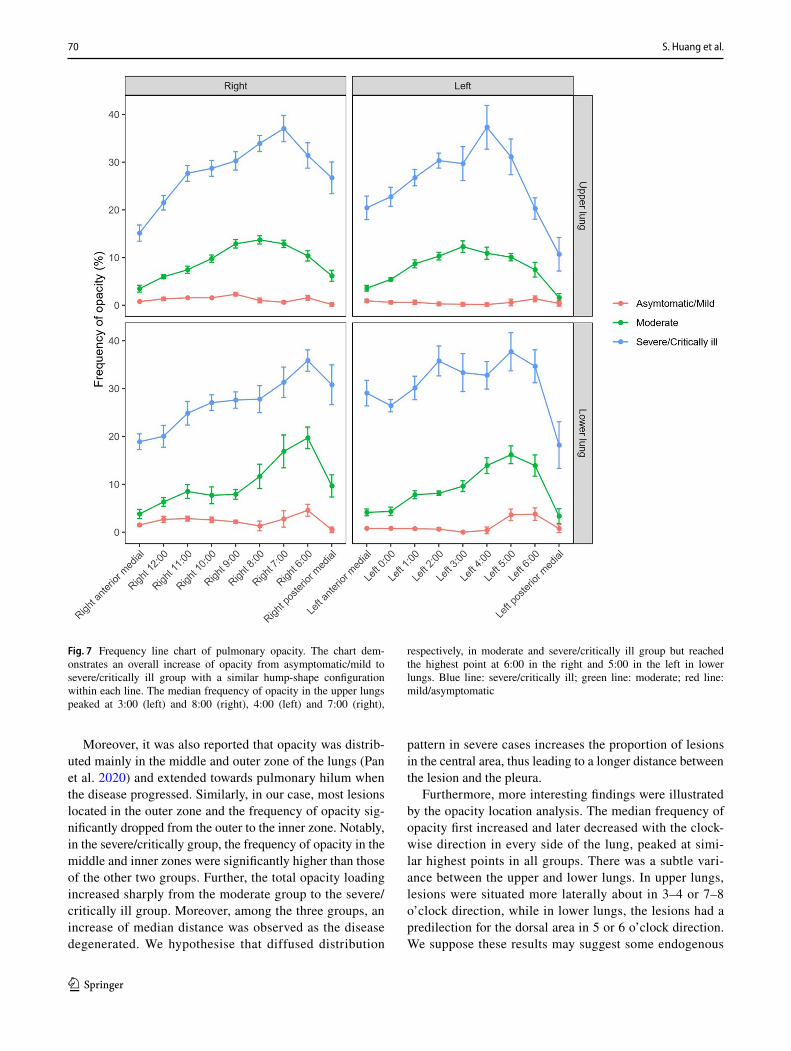
In specific lesion location analysis as shown in Fig. 7, the median frequency of opacity shows great difference among the three groups, especially in the moderate and the severe/critically groups. The severe/critical ill group presents the highest pulmonary opacity frequency and the moderate group displays the second-hightest. Within each group, the median frequency of opacity in the left upper lung, right upper lung, left lower lung, and right lower lung all have a hump-shape configuration from an overall perspective. Still
the peaks vary, and the change of the asymptomatic/mild group is relatively smaller than other groups. In the upper lungs, the moderate and severe/critically ill groups peaked at 3:00 (left) and 8:00 (right) directions as well as 4:00 (left) and 7:00 (right), respectively, whereas in lower lungs, they both reached the highest point at 5:00 in the left and 6:00 in the right. The anterior and posterior medial aspects both show low opacity frequency in all patients.
For radiomics analysis, a total of 3,720 lesions were extracted (the severe/critically ill lesions: 293). As shown in Fig S1, with the feature number increased, the AUC value became higher and reached the almost highest point (0.790 in the training set, 0.761 in the validation set, shown in Fig S2) when the feature number was 20. The detailed informa-tion of selected features is displayed in Table S1. Among
Table 1 Demographics, clinical and radiological characteristics of included patients
Variables were presented as median and interquartile range or frequency and percentage. When calculating the incidence of initial symptoms in the asymptomatic/mild group, we excluded 33 patients with asympto-matic illnessa Exposure history means that the patients either has a the history of Wuhan exposure, contact with COVID-19 patients or contact with people from Wuhanb Days interval means days between CT examinations and symptoms onset while in asymptomatic cases, days between CT examination and the outpatient visit are used instead
Disease severity
Characteristics Asymptomatic/mild(n = 63, 13.0%)
Moderate(n = 378, 78.1%)
Severe/critically ill(n = 43, 8.9%)
p value
Age, years 33 (22–51) 46 (34–56) 59 (52–71) < .001Gender 0.377 Men 31/63 (49.2%) 202/378 (53.4%) 27/43 (62.8%) Women 32/63 (50.8%) 176/378 (46.4%) 16/43 (37.2%)
Comorbidity Diabetes 5/63 (7.9%) 19/378 (5.0%) 7/43 (16.3%) 0.019 Hypertension 7/63 (11.1%) 54/63 (14.3%) 15/43 (34.9%) 0.001 Cardiovascular disease 1/63 (1.6%) 4/378 (1.1%) 3/43 (7.0%) 0.032 Cerebrovascular disease 0/63 (0) 3/376 (0.8%) 1/43 (2.3%) 0.623 Chronic renal failure 0/63 (0%) 3/378 (0.8%) 1/43 (2.3%) 0.380 Malignancy 0/63 (0%) 5/378 (1.3%) 1/43 (2.3%) 0.547
Exposure historya 60/63 (95.2%) 327/378 (86.5%) 36/43 (83.7%) 0.119Incubation period-days 8 (5–11) 6 (3–10) 5 (3–8) 0.125Initial symptoms Fever 14/30 (46.7%)c 278/378 (73.5%) 36/43 (83.7%) < .001 Cough/sputum 19/30 (63.3%)c 224/378 (59.3%) 30/43 (69.8%) < .001 Shortness of breath/Dyspnea 0/30 (0%)c 10/378 (2.7%) 5/43 (11.6%) 0.007
CT scans 122 747 85Days intervalb 0.253 Below 4 days 15/122 (12.3%) 56/747 (7.5%) 10/85 (11.8%) 4–6 days 18/122 (14.8%) 127/737 (17.0%) 12/85 (14.1%) 7–9 days 26/122 (21.3%) 141/747 (18.9%) 14/85 (16.5%) 10–12 days 21/122 (17.2%) 152/747 (20.3%) 24/85 (28.2%) 13–15 days 14/122 (11.5%) 119/747 (15.9%) 14/85 (16.5%) Above 15 days 28/122 (23.0%) 152/747 (20.3%) 11/85 (12.9%)
Number of lung lobes involved 2.5 (1–4) 5 (3–5) 5 (5–5) < .001
68 S. Huang et al.
1 3
Table 2 Distance calculations of pulmonary opacity
Characteristics Disease severity
Asymptomatic/mild(n = 63, 13.0%)
Moderate(n = 378, 78.1%)
Severe/critically ill(n = 43, 8.9%)
p value
Median distance of opacity to the nearest parietal pleura (mm) The whole lung 8.24 (5.36–13.23) 12.09 (9.64–14.70) 12.63 (10.36–14.96) < .001 Right upper lobe 10.78 (5.57–18.75) 12.98 (8.60–16.82) 14.54 (12.65–16.01) < .001 Right middle lobe 7.50 (4.52–11.72) 16.60 (10.35–21.88) 16.02 (13.91–18.30) < .001 Right lower lobe 9.74 (6.96–15.75) 11.13 (8.46–14.31) 12.19 (9.22–14.71) 0.062 Left upper lobe 8.54 (5.09–12.70) 12.76 (9.17–15.89) 12.83 (11.5–15.23) < .001 Left lower lobe 8.51 (5.26–12.95) 10.60 (7.64–13.29) 11.46 (8.94–14.35) 0.002
Median distance of opacity to the nearest visceral pleura (mm) The whole lung 7.55 (4.99–11.39) 10.73 (8.82–12.78) 10.97 (9.54–12.39) < .001 Right upper lobe 8.29 (4.84–14.02) 11.09 (7.21–14.37) 12.37 (10.67–13.76) 0.021 Right middle lobe 5.61 (2.54–11.69) 9.39 (5.73–12.97) 11.23 (9.08–12.45) < .001 Right lower lobe 8.91 (5.75–12.15) 10.27 (7.07–12.82) 11.08 (8.62–12.99) 0.072 Left upper lobe 5.64 (3.92–8.11) 10.00 (6.83–12.97) 10.36 (8.04–12.29) < .001 Left lower lobe 7.25 (2.90–11.60) 9.61 (6.73–12.13) 10.64 (8.22–12.05) < .001
Visual evaluation of lesion distribution Opacity within the outer zone 50/122 (40.1%) 679/747 (90.9%) 83/85 (97.6%) < .001 Opacity within the median zone 19/122 (15.6%) 479/747 (64.1%) 78/85 (91.8%) < .001 Opacity within the inner zone 9/122 (7.4%) 216/747 (28.9%) 64/85 (75.3%) < .001
Fig. 5 Pulmonary lesion distribution is atlas displayed by heat map overlaid with contour line. The atlas is generated by projecting pul-monary opacity of 954 CT scans to a standard lung. Representative
images of different levels are presented. Lesions tend to distribute laterally in upper lungs compared to posteriorly in lower lungs, and fewer lesions are found in the anterior or medial zone of the lungs

69Distribution Atlas of COVID-19 Pneumonia on Computed Tomography: A Deep Learning Based…
1 3
the 20 features, the energy, elongation and surface area con-tributed most to the model, which means that these three features were most associated with the severe/critically of the illness.
The CT images of a typical patient in our study are pre-sented in Fig S3.
Discussion
To the best of our knowledge, this study provides the most detailed description of the patterns of lesion location on chest CT images, which may help improve the specificity of differential diagnosis and surveillance. Further lesion-based radiomics analysis will help to quantify the lesion phenotypes. Additionally, having incorporated almost all confirmed cases in Jiangsu Province with initial and repeated CT examinations, the results of this study are reliable and representative.
The overall demographic characteristics of enrolled patients in our study are similar to those of patients in other studies. Consistent with the previous study, we also con-cluded the crucial impact of the age on the worse outcome with a high susceptibility and a particular tendency. Specifi-cally, in our study, the median age increases by 13 years for every additional one grade of illness. In some reports, males tend to be a larger proportion in all patients with COVID-19 (Guan et al. 2020), which could also be found in moderate and severe/critically ill groups in our study but with no sta-tistical significance.
Since the first descrption of a cluster of COVID-19, the radiographic manifestations have been widely depicted in different cohorts and different sample sizes. Radiology has
published a series of case reports and key points of radio-logical findings about COVID-19 at early outbreak (Chung et al. 2020; Kanne 2020; Shi et al. 2020a; Lei et al. 2020). The most frequent findings were bilateral earlier GGO and later consolidation distributed in the subpleural zone. Later, complete radiological analysis of 63, 50 and 81 laboratory-conformed patients were achieved (Xu et al. 2020; Pan et al. 2020; Shi et al. 2020b). The lesion distribution per lobe and the other CT findings, including fibrous stripes, air broncho-gram and interlobular/ intralobular septa thickening were illustrated in these studies. In our case, the above reported manifestations of COVID-19 were observed.
The pneumonia lesions commonly involved more than two lobes or even 4–5 lobes in severe/critically ill patients, while a single lobe, usually the right lower lobe, was seen in a few cases and generally at early phase (Caruso et al. 2020). The right lower lobe was the most vulnerable while the right middle lobe was the least (Xu et al. 2020). The result that there is a predilection for right lower lobe was further reported in a research at the segmental level, with median involved segments of 10.5 (Shi et al. 2020b). Through the analysis of our cohort, similar results were found. The right lower lung had a significant predominance to be involved, which could be intuitively visualized through the heatmap and the contour map. This was further validated in the study by Luo and Yu et al. in which a diffuse congestive appear-ance with a predominance of right lower lobe was observed on gross examination in a critically ill patient with COVID-19. The underlying mechanisms remain unknown. Shi et al. maintain that the anatomical structure of the trachea and bronchi, wherein the right bronchus is shorter and straighter, partially contribute to this finding (Shi et al. 2020b).
Fig. 6 The heat maps of lesion distribution by disease severity. Among the three groups, all lesions predominate the subpleural area in bilateral lower lungs. Fewer lesions are observed in the asymptomatic/mild group, while more diffused lesions are found in severe/critically ill cases
70 S. Huang et al.
1 3
Moreover, it was also reported that opacity was distrib-uted mainly in the middle and outer zone of the lungs (Pan et al. 2020) and extended towards pulmonary hilum when the disease progressed. Similarly, in our case, most lesions located in the outer zone and the frequency of opacity sig-nificantly dropped from the outer to the inner zone. Notably, in the severe/critically group, the frequency of opacity in the middle and inner zones were significantly higher than those of the other two groups. Further, the total opacity loading increased sharply from the moderate group to the severe/critically ill group. Moreover, among the three groups, an increase of median distance was observed as the disease degenerated. We hypothesise that diffused distribution
pattern in severe cases increases the proportion of lesions in the central area, thus leading to a longer distance between the lesion and the pleura.
Furthermore, more interesting findings were illustrated by the opacity location analysis. The median frequency of opacity first increased and later decreased with the clock-wise direction in every side of the lung, peaked at simi-lar highest points in all groups. There was a subtle vari-ance between the upper and lower lungs. In upper lungs, lesions were situated more laterally about in 3–4 or 7–8 o’clock direction, while in lower lungs, the lesions had a predilection for the dorsal area in 5 or 6 o’clock direction. We suppose these results may suggest some endogenous
Fig. 7 Frequency line chart of pulmonary opacity. The chart dem-onstrates an overall increase of opacity from asymptomatic/mild to severe/critically ill group with a similar hump-shape configuration within each line. The median frequency of opacity in the upper lungs peaked at 3:00 (left) and 8:00 (right), 4:00 (left) and 7:00 (right),
respectively, in moderate and severe/critically ill group but reached the highest point at 6:00 in the right and 5:00 in the left in lower lungs. Blue line: severe/critically ill; green line: moderate; red line: mild/asymptomatic
71Distribution Atlas of COVID-19 Pneumonia on Computed Tomography: A Deep Learning Based…
1 3
characteristics of COVID-19 pneumonia, but more evidence should be provided by pathology. Moreover, the median fre-quency of opacity increased sharply from the mild group to the severe/critically ill group. In the asymptomatic/mild group, the median frequencies were all below 5%, while in the moderate group, frequencies were higher than those in the asymptomatic/mild group, but below 20%, and finally, in the severe/critically ill cases, frequencies were between 20% and 40%. In addition, the median frequency of opacity in the anterior and the posterior medial regions were the least in all three groups, both in the upper and lower lungs. These results were consistent with the visual evaluation of the lesion distribution, as presented in the Table 2. All these findings may contribute to the subphenotype of patients with COVID-19 and may influence the outcome and prognosis of patients with COVID-19.
Additionally, we found a series of radiomic features associated with the severity of the illness. The three most important features were energy, elongation, and surface area and their coefficients in the model were all positive (14.516, 12.117, 4.837, respectively). Energy is a measure of the magnitude of voxel values, of which the lowest gray values contribute the least. Elongation is a morphological based feature, whose value measures the circle-like degree of a shape. And the surface area, as the name implies, calculates the surface area of the lesion. These results indicate that a lesion with a higher gray value, a more circle-like shape, and a greater surface area has more possibility to be presented in severe/critically ill cases.
Since the outbreak, deep learning approaches have been used to detect the pneumonia lesions and assess the opacity quantitatively (Amyar et al. 2020; Huang et al. 2020b). In this article, a deep learning algorism based on 3D U-Net was also applied. Innovatively, in our study, we project the pneu-monia lesions to a standard lung and construct a distribution atlas with the contour map and the heatmap. In this way, the detailed distribution characteristics of COVID-19 pneumo-nia are displayed quantitatively and visually. This accurate description and analysis of the variant distribution pattern in varied regions of the lung and in varied groups would provide new insights into the understanding of COVID-19 pneumonia. These results would help to determine the disease subphenotype. Moreover, we further made a lesion based radiomics analysis, which provide more characteristics of the opacity and can contribute to disease phenotype.
There are some limitations to this study. First of all, the retrospective nature of this study and the nuance of multi-center CT protocols are unavoidable. Second, though we have a relatively large sample size of 484 patients in total, the imbalance between severity groups is evident. More samples should be included in the mild/asymptomatic and severe/critically ill groups. Third, this study is a descrip-tion of the whole cohort and severity subgroups, and further
analysis depending on other factors and temporal changes is needed. These will be done in future studies.
Conclusion
Summarily, we constructed a distribution atlas that clearly shows the frequency of pulmonary opacity in different lung zones on CT, and figured out the most important radiom-ics features related to severity. The pulmonary lesions were mainly distributed in the subpleural and peripheral areas and in addition, the detailed patterns varied between bilateral lungs, upper and lower lungs and different severity groups. For each lesion, higher gray value, more circle-like shape, and greater surface area contributed to the severity of the illness. These results may provide insights into the nature of the disease and are potentially valuable in disease sub phenotype.
Supplementary Information The online version contains supplemen-tary material available at https:// doi. org/ 10. 1007/ s43657- 021- 00011-4.
Authors’ Contributions (I) Conception and design: SH, YW, YY, SJ; (II) Administrative support: YY, SJ; (III) Provision of study materials or patients: SH, YW, YY, SJ; (IV) Collection and assembly of data: SH, YW; (V) Data analysis and interpretation: SH, YW, ZZ, QY; (VI) Manuscript writing: All authors; (VII) Final approval of manuscript: All authors.
Funding Partial financial support was received from the Minis-try of Science and Technology of the People’s Republic of China [2020YFC084370067].
Data Availability The datasets generated and analyzed during the cur-rent study are available from the corresponding author on reasonable request.
Compliance with Ethical Standards
Conflict of Interest The authors have no relevant financial or non-fi-nancial interests to disclose.
References
Ai T, Yang Z, Hou H, Zhan C, Chen C, Lv W, Tao Q, Sun Z, Xia L (2020) Correlation of chest CT and RT-PCR testing for corona-virus disease 2019 (COVID-19) in China: a report of 1014 cases. Radiology 296:E32–E40. https:// doi. org/ 10. 1148/ radiol. 20202 00642
Amyar A, Modzelewski R, Li H, Ruan S (2020) Multi-task deep learn-ing based CT imaging analysis for COVID-19 pneumonia: classi-fication and segmentation. Comput Biol Med 126:104037. https:// doi. org/ 10. 1016/j. compb iomed. 2020. 104037
Caruso D, Zerunian M, Polici M, Pucciarelli F, Polidori T, Rucci C, Guido G, Bracci B, De Dominicis C, Laghi A (2020) Chest CT features of COVID-19 in Rome, Italy. Radiology 296:E79–E85. https:// doi. org/ 10. 1148/ radiol. 20202 01237
72 S. Huang et al.
1 3
Chung M, Bernheim A, Mei X, Zhang N, Huang M, Zeng X, Cui J, Xu W, Yang Y, Fayad ZA, Jacobi A, Li K, Li S, Shan H (2020) CT imaging features of 2019 novel coronavirus (2019-nCoV). Radi-ology 295:202–207. https:// doi. org/ 10. 1148/ radiol. 20202 00230
Coudray N, Ocampo PS, Sakellaropoulos T, Narula N, Snuderl M, Fenyö D, Moreira AL, Razavian N, Tsirigos A (2018) Classifica-tion and mutation prediction from non-small cell lung cancer his-topathology images using deep learning. Nat Med 24:1559–1567. https:// doi. org/ 10. 1038/ s41591- 018- 0177-5
Feng Z, Yu Q, Yao S, Luo L, Zhou W, Mao X, Li J, Duan J, Yan Z, Yang M, Tan H, Ma M, Li T, Yi D, Mi Z, Zhao H, Jiang Y, He Z, Li H, Nie W, Liu Y, Zhao J, Luo M, Liu X, Rong P, Wang W (2020) Early prediction of disease progression in COVID-19 pneumonia patients with chest CT and clinical characteristics. Nat Commun 11:4968. https:// doi. org/ 10. 1038/ s41467- 020- 18786-x
Guan W-J, Ni Z-Y, Hu Y, Liang W-H, Ou C-Q, He J-X, Liu L, Shan H, Lei C-L, Hui DSC, Du B, Li L-J, Zeng G, Yuen K-Y, Chen R-C, Tang C-L, Wang T, Chen P-Y, Xiang J, Li S-Y, Wang J-L, Liang Z-J, Peng Y-X, Wei L, Liu Y, Hu Y-H, Peng P, Wang J-M, Liu J-Y, Chen Z, Li G, Zheng Z-J, Qiu S-Q, Luo J, Ye C-J, Zhu S-Y, Zhong N-S (2020) Clinical characteristics of coronavirus disease 2019 in China. N Engl J Med 382:1708–1720. https:// doi. org/ 10. 1056/ NEJMo a2002 032
Huang L, Han R, Ai T, Yu P, Kang H, Tao Q, Xia L (2020b) Serial quantitative chest CT assessment of COVID-19: a deep learning approach. Radiol Cardiothorac Imaging 2:e200075. https:// doi. org/ 10. 1148/ ryct. 20202 00075
Huang C, Wang Y, Li X, Ren L, Zhao J, Hu Y, Zhang L, Fan G, Xu J, Gu X, Cheng Z, Yu T, Xia J, Wei Y, Wu W, Xie X, Yin W, Li H, Liu M, Xiao Y, Gao H, Guo L, Xie J, Wang G, Jiang R, Gao Z, Jin Q, Wang J, Cao B (2020a) Clinical features of patients infected with 2019 novel coronavirus in Wuhan, China. Lancet 395:497–506. https:// doi. org/ 10. 1016/ S0140- 6736(20) 30183-5
Kanne JP (2020) Chest CT findings in 2019 novel coronavirus (2019-nCoV) infections from Wuhan, China: key points for the radiolo-gist. Radiology 295:16–17. https:// doi. org/ 10. 1148/ radiol. 20202 00241
Lakhani P, Gray DL, Pett CR, Nagy P, Shih G (2018) Hello world deep learning in medical imaging. J Digit Imaging 31:283–289. https:// doi. org/ 10. 1007/ s10278- 018- 0079-6
Lambin P, Rios-Velazquez E, Leijenaar R, Carvalho S, van Stiphout RGPM, Granton P, Zegers CML, Gillies R, Boellard R, Dekker A, Aerts HJWL (2012) Radiomics: extracting more information from medical images using advanced feature analysis. Eur J Cancer 48:441–446. https:// doi. org/ 10. 1016/j. ejca. 2011. 11. 036
Lei J, Li J, Li X, Qi X (2020) CT Imaging of the 2019 Novel Corona-virus (2019-nCoV) Pneumonia. Radiology 31:200236. https:// doi. org/ 10. 1148/ radiol. 20202 00236
Li H, Wang S, Zhong F, Bao W, Li Y, Liu L, Wang H, He Y (2020) Age-dependent risks of incidence and mortality of COVID-19 in Hubei province and other parts of China. Front Med 7:190. https:// doi. org/ 10. 3389/ fmed. 2020. 00190
National Health Commission of the People’s Republic of China, Diag-nosis and Treatment Program for New Coronavirus Infection (Trial Version 5). 2020,8 Febr (n.d.).
Onder G, Rezza G, Brusaferro S (2020) Case-fatality rate and charac-teristics of patients dying in relation to COVID-19 in Italy. JAMA 323:1775–1776. https:// doi. org/ 10. 1001/ jama. 2020. 4683
Pan Y, Guan H, Zhou S, Wang Y, Li Q, Zhu T, Hu Q, Xia L (2020) Initial CT findings and temporal changes in patients with the novel coronavirus pneumonia (2019-nCoV): a study of 63 patients in Wuhan, China. Eur Radiol 30:3306–3309. https:// doi. org/ 10. 1007/ s00330- 020- 06731-x
Sahiner B, Pezeshk A, Hadjiiski LM, Wang X, Drukker K, Cha KH, Summers RM, Giger ML (2019) Deep learning in medical imag-ing and radiation therapy. Med Phys 46:e1–e36. https:// doi. org/ 10. 1002/ mp. 13264
Salehi S, Abedi A, Balakrishnan S, Gholamrezanezhad A (2020) Coro-navirus disease 2019 (COVID-19): a systematic review of imaging findings in 919 patients. Am J Roentgenol 215:87–93. https:// doi. org/ 10. 2214/ AJR. 20. 23034
She Y, Zhang L, Zhu H, Dai C, Xie D, Xie H, Zhang W, Zhao L, Zou L, Fei K, Sun X, Chen C (2018) The predictive value of CT-based radiomics in differentiating indolent from invasive lung adenocarcinoma in patients with pulmonary nodules. Eur Radiol 28:5121–5128. https:// doi. org/ 10. 1007/ s00330- 018- 5509-9
Shi H, Han X, Zheng C (2020) Evolution of CT Manifestations in a Patient Recovered from 2019 Novel Coronavirus (2019-nCoV) Pneumonia in Wuhan, China. Radiology 295:1. https:// doi. org/ 10. 1148/ radiol. 20202 00269
Shi H, Han X, Jiang N, Cao Y, Alwalid O, Gu J, Fan Y, Zheng C (2020b) Radiological findings from 81 patients with COVID-19 pneumonia in Wuhan, China: a descriptive study. Lancet Infect Dis 20:425–434. https:// doi. org/ 10. 1016/ S1473- 3099(20) 30086-4
Special Expert Group for Control of the Epidemic of Novel Coronavi-rus Pneumonia of the Chinese Preventive Medicine Association (2020) An update on the epidemiological characteristics of novel coronavirus pneumonia (COVID-19). Zhonghua Liu Xing Bing Xue Za Zhi 41:139–144
Sun R, Limkin EJ, Vakalopoulou M, Dercle L, Champiat S, Han SR, Verlingue L, Brandao D, Lancia A, Ammari S, Hollebecque A, Scoazec J-Y, Marabelle A, Massard C, Soria J-C, Robert C, Paragios N, Deutsch E, Ferté C (2018) A radiomics approach to assess tumour-infiltrating CD8 cells and response to anti-PD-1 or anti-PD-L1 immunotherapy: an imaging biomarker, retrospective multicohort study. Lancet Oncol 19:1180–1191. https:// doi. org/ 10. 1016/ S1470- 2045(18) 30413-3
WHO, COVID-19 Situation reports. 2020 Nov 24 (n.d.). https:// www. who. int/ publi catio ns/m/ item/ weekly- epide miolo gical- updat e--- 24- novem ber- 2020 (accessed November 27, 2020).
Xu Y, Dong J, An W, Lv X, Yin X, Zhang J, Dong L, Ma X, Zhang H, Gao B (2020) Clinical and computed tomographic imaging features of novel coronavirus pneumonia caused by SARS-CoV-2. J Infect 80:394–400. https:// doi. org/ 10. 1016/j. jinf. 2020. 02. 017
Zhang W (2020) Imaging changes in severe COVID-19 pneumo-nia. Intensive Care Med 46:583–585. https:// doi. org/ 10. 1007/ s00134- 020- 05976-w
Publisher’s Note Springer Nature remains neutral with regard to jurisdictional claims in published maps and institutional affiliations.