Embed Size (px)
Citation preview
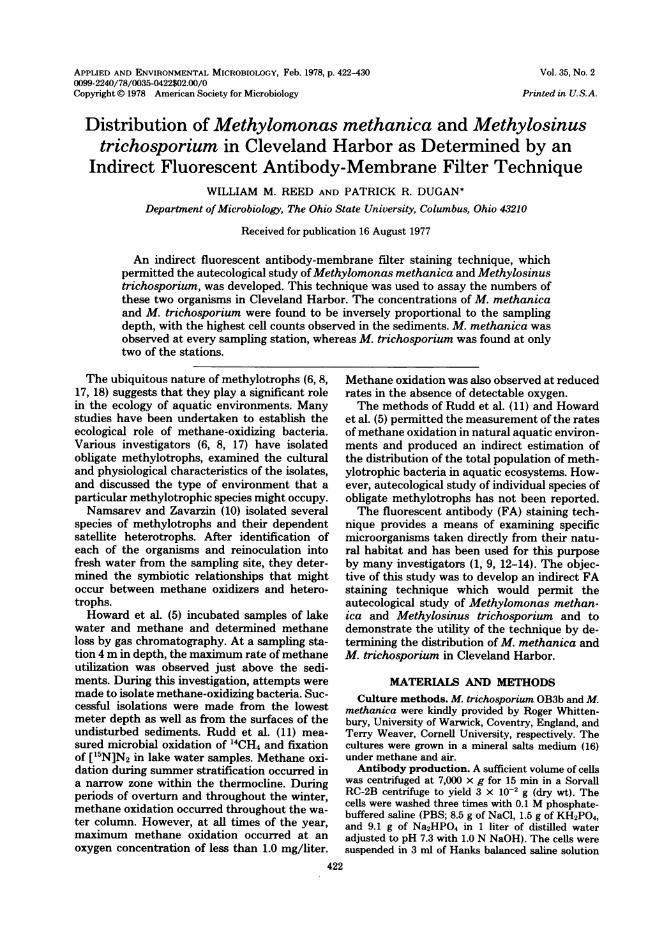
APPLIED AND ENVIRONMENTAL MICROBIOLOGY, Feb. 1978, p. 422-4300099-2240/78/0035-0422$02.00/0Copyright © 1978 American Society for Microbiology
Vol. 35, No. 2
Printed in U.S.A.
Distribution of Methylomonas methanica and Methylosinustrichosporium in Cleveland Harbor as Determined by an
Indirect Fluorescent Antibody-Membrane Filter TechniqueWILLIAM M. REED AND PATRICK R. DUGAN*
Department ofMicrobiology, The Ohio State University, Columbus, Ohio 43210
Received for publication 16 August 1977
An indirect fluorescent antibody-membrane filter staining technique, whichpermitted the autecological study ofMethylomonas methanica and Methylosinustrichosporium, was developed. This technique was used to assay the numbers ofthese two organisms in Cleveland Harbor. The concentrations of M. methanicaand M. trichosporium were found to be inversely proportional to the samplingdepth, with the highest cell counts observed in the sediments. M. methanica wasobserved at every sampling station, whereas M. trichosporium was found at onlytwo of the stations.
The ubiquitous nature of methylotrophs (6, 8,17, 18) suggests that they play a significant rolein the ecology of aquatic environments. Manystudies have been undertaken to establish theecological role of methane-oxidizing bacteria.Various investigators (6, 8, 17) have isolatedobligate methylotrophs, examined the culturaland physiological characteristics of the isolates,and discussed the type of environment that aparticular methylotrophic species might occupy.Namsarev and Zavarzin (10) isolated several
species of methylotrophs and their dependentsatellite heterotrophs. After identification ofeach of the organisms and reinoculation intofresh water from the sampling site, they deter-mined the symbiotic relationships that mightoccur between methane oxidizers and hetero-trophs.Howard et al. (5) incubated samples of lake
water and methane and determined methaneloss by gas chromatography. At a sampling sta-tion 4 m in depth, the maximum rate of methaneutilization was observed just above the sedi-ments. During this investigation, attempts weremade to isolate methane-oxidizing bacteria. Suc-cessful isolations were made from the lowestmeter depth as well as from the surfaces of theundisturbed sediments. Rudd et al. (11) mea-sured microbial oxidation of '4CH4 and fixationof ['5N]N2 in lake water samples. Methane oxi-dation during summer stratification occurred ina narrow zone within the thermocine. Duringperiods of overturn and throughout the winter,methane oxidation occurred throughout the wa-ter column. However, at all times of the year,maximum methane oxidation occurred at anoxygen concentration of less than 1.0 mg/liter.
422
Methane oxidation was also observed at reducedrates in the absence of detectable oxygen.The methods of Rudd et al. (11) and Howard
et al. (5) permitted the measurement of the ratesof methane oxidation in natural aquatic environ-ments and produced an indirect estimation ofthe distribution of the total population of meth-ylotrophic bacteria in aquatic ecosystems. How-ever, autecological study of individual species ofobligate methylotrophs has not been reported.The fluorescent antibody (FA) staining tech-
nique provides a means of examining specificmicroorganisms taken directly from their natu-ral habitat and has been used for this purposeby many investigators (1, 9, 12-14). The objec-tive of this study was to develop an indirect FAstaining technique which would permit theautecological study of Methylomonas methan-ica and Methylosinus trichosporium and todemonstrate the utility of the technique by de-termining the distribution of M. methanica andM. trichosporium in Cleveland Harbor.
MATERIALS AND METHODSCulture methods. M. trichosporium OB3b and M.
methanica were kindly provided by Roger Whitten-bury, University of Warwick, Coventry, England, andTerry Weaver, Cornell University, respectively. Thecultures were grown in a mineral salts medium (16)under methane and air.Antibody production. A sufficient volume of cells
was centrifuged at 7,000 x g for 15 min in a SorvallRC-2B centrifuge to yield 3 x 10⁻² g (dry wt). Thecells were washed three times with 0.1 M phosphate-buffered saline (PBS; 8.5 g of NaCl, 1.5 g of KH2PO4,and 9.1 g of Na2HPO4 in 1 liter of distilled wateradjusted to pH 7.3 with 1.0 N NaOH). The cells weresuspended in 3 ml of Hanks balanced saline solution
M. METHANICA AND M. TRICHOSPORIUM DISTRIBUTION
(Grand Island Biological Co., Grand Island, N.Y.).This solution was mixed with 3 ml of Freund completeadjuvant by passing the mixture between two 10-mlglass syringes connected by a male Luerlok adaptor.The mixing procedure was continued until a drop ofthe emulsion placed on the surface of ice-cold waterremained intact.
Rabbits were shaved on both sides and swabbedwith alcohol. Each received four subcutaneous injec-tions of 1.5 ml, two on each side. Two weeks after theinitial injection, the rabbits were reinjected in thesame manner as stated above. Five days after thesecond injection, the rabbits were injected intrave-nously with 3 x 10² g (dry wt) of cells suspended in1 ml of Hanks balanced saline solution. The intrave-nous injection was repeated 48 and 96 h after theinitial intravenous injection. One week after the finalintravenous injection the rabbits were bled by cardiacpuncture. The titer of the specific antibody in thesame serum was determined by complement fixation.(4).Immunoglobulin G (IgG) was separated from the
serum by the method of Baumstark et al. (2).A Bio fiber Beaker 80 hollow fiber device (Bio-Rad
Laboratories, Inc., Richmond, Calif.) was used forconcentration of the dilute IgG.
After separation and concentration, the IgG wascross-absorbed with washed whole cells in heavy sus-pension. The anti-M. methanica IgG was cross-ab-sorbed twice with Escherichia coli and twice withAzotobacter vinelandii. The cross-absorbed IgG wasthen diluted with PBS to the greatest dilution thatwould give +4 fluorescence when FA staining thehomologous antigen (M. methanica for anti-M. meth-anica IgG and M. trichosporium with anti-M. tricho-sporium IgG). The specific IgG was checked for cross-
reactivity with 25 bacterial isolates. The homologouscontrol reactions of the specific IgG are shown inTable 1.
Collection and handling of environment sam-ples. At designated stations in Cleveland Harbor andthe mouth of the Cuyahoga River, samples were col-lected from: the sediment surface, 1 m above thebottom, midway in the water column, and 1 m belowthe surface of the water. Water samples were collectedin alpha bottles (Wildco Wildlife Co., Saginaw, Mich.).Samples were removed from the alpha bottles bymeans of 20-ml syringes fitted with 18-gauge, 1.5-inch(ca. 3.8 cm) needles and placed in screw-top test tubes.Sediment samples were collected with an Eckmandredge (J.P. Forest, Madison, Wis.) and placed inscrew-top test tubes. The environmental samples weremaintained at 4°C during transport from ClevelandHarbor to the laboratory, where the samples were
quick frozen in an ethanol-dry ice bath. Uniform freez-ing of the samples was obtained by rotating each tubein the ethanol-dry ice bath until it was frozen. Thefrozen samples were stored at -30°C until needed, atwhich time the samples were thawed at room temper-ature.The method of Bohlool and Schmidt (3) was used
to separate bacteria from sediment samples before FAstaining when bacteria were enumerated. For purposesof direct observation of cells in sediment, samples werestained by the method of Apel et al. (1).
TABLE 1. Control reactions demonstrating thespecificity of the rabbit anti-M. methanica and anti-
M. trichosporium IgGReagent Stain-
Antigen ing re-Step 1 Step 2 actionb
M. methanica Saline FITCa-conju-gated goatanti-rabbitIgG
M. methanica Normal serum FITC-conju-gated goatanti-rabbitIgG
M. methanica Absorbed spe- FITC-conju-cific anti-M. gated goatmethanica anti-rabbitserum IgG
M. methanica Specific anti-M. FITC-conju- +4methanica gated goatserum anti-rabbit
IgGM. trichospo- Saline FITC-conju-rium gated goat
anti-rabbitIgG
M. trichospo- Normal serum FITC-conju-rium gated goat
anti-rabbitIgG
M. trichospo- Absorbed spe- FITC-conju-rium cific anti-M. gated goat
trichospo- anti-rabbitrium serum IgG
M. trichospo- Specific anti-M. FITC-conju- +4rium trichospo- gated goat
rium serum anti-rabbitIgG
a FITC, Fluorescein isothiocyanate.Staining reaction classification: -, no fluorescence; +4,
intense fluorescence.
FA staining procedure. The specificity tests men-tioned above were performed on microscope slides.Samples were stained by the method of Apel et al. (1).
Environmental samples were stained by means of amembrane filter-fluorescent antibody (MFFA) stain-ing technique. Before staining, 20-mm circles were cutfrom 47-mm gridded membrane filters (NucleporeCorp.) by means of a no. 12 cork borer. The 20-mmfilters were soaked in India ink (Speedball India Ink,Hunt Manufacturing Co., Satesville, N.C.) for 30 minand washed in distilled water. The filters weremounted on membrane filter holders (Millipore), andenvironmental samples were filtered. At this time, thetubing connecting the filtration apparatus (Fig. 1) tothe vacuum pump (C) was detached and connected toan air outlet (D). With all the valves open, the airoutlet was opened until a slight air flow was detectedat valve A. Then 0.2 ml of rhodamine isothiocyanate(RITC)-conjugated bovine serum albumin (BSA)(Microbiological Associates, Bethesda, Md.; 7.5 mg perml of 0.1 M phosphate buffer) was placed on top ofthe filters, valve A was closed, and after 10 s, the airoutlet was closed. This provided positive pressurewithin each of the filtration flasks, thereby preventingthe staining reagent from flowing through the filters.After 30 min at room temperature, the apparatus was
VOL. 35, 1978 423
424 REED AND DUGAN
B =B, H,
FILTRATION & STAININGAPPARATUS
Vocuum
pump C_
DD4l
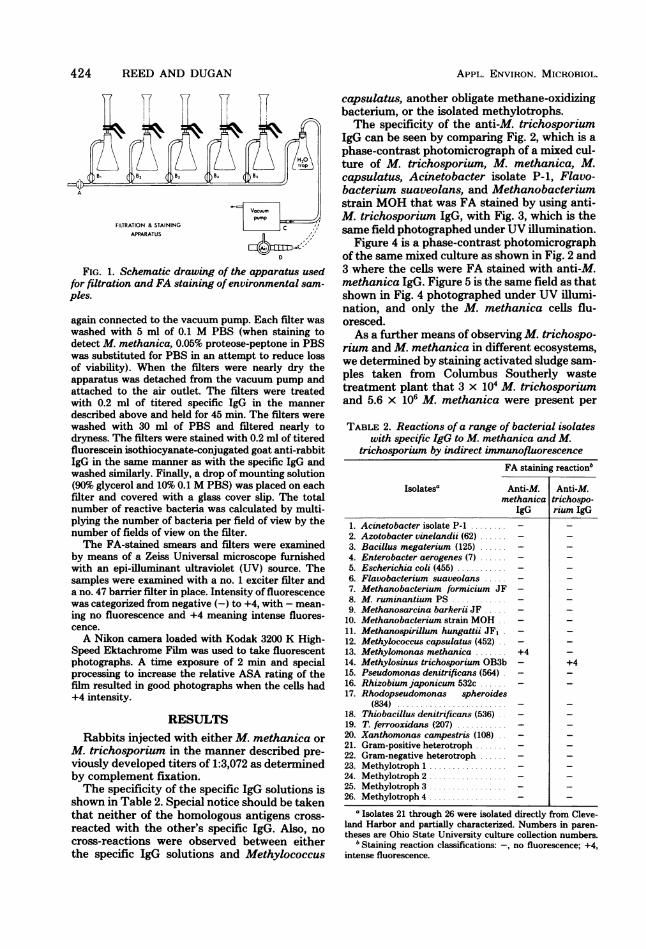
FIG. 1. Schematic drawing of the apparatus usedfor filtration and FA staining ofenvironmental sam-ples.
again connected to the vacuum pump. Each filter waswashed with 5 ml of 0.1 M PBS (when staining todetect M. methanica, 0.05% proteose-peptone in PBSwas substituted for PBS in an attempt to reduce lossof viability). When the filters were nearly dry theapparatus was detached from the vacuum pump andattached to the air outlet. The filters were treatedwith 0.2 ml of titered specific IgG in the mannerdescribed above and held for 45 min. The filters werewashed with 30 ml of PBS and filtered nearly todryness. The filters were stained with 0.2 ml of titeredfluorescein isothiocyanate-conjugated goat anti-rabbitIgG in the same manner as with the specific IgG andwashed similarly. Finally, a drop of mounting solution(90% glycerol and 10% 0.1 M PBS) was placed on eachfilter and covered with a glass cover slip. The totalnumber of reactive bacteria was calculated by multi-plying the number of bacteria per field of view by thenumber of fields of view on the filter.The FA-stained smears and filters were examined
by means of a Zeiss Universal microscope furnishedwith an epi-illuminant ultraviolet (UV) source. Thesamples were examined with a no. 1 exciter filter anda no. 47 barrier filter in place. Intensity of fluorescencewas categorized from negative (-) to +4, with - mean-
ing no fluorescence and +4 meaning intense fluores-cence.A Nikon camera loaded with Kodak 3200 K High-
Speed Ektachrome Film was used to take fluorescentphotographs. A time exposure of 2 min and specialprocessing to increase the relative ASA rating of thefilm resulted in good photographs when the cells had+4 intensity.
RESULTS
Rabbits injected with either M. methanica or
M. trichosporium in the manner described pre-
viously developed titers of 1:3,072 as determinedby complement fixation.The specificity of the specific IgG solutions is
shown in Table 2. Special notice should be takenthat neither of the homologous antigens cross-
reacted with the other's specific IgG. Also, no
cross-reactions were observed between eitherthe specific IgG solutions and Methylococcus
capsulatus, another obligate methane-oxidizingbacterium, or the isolated methylotrophs.The specificity of the anti-M. trichosporium
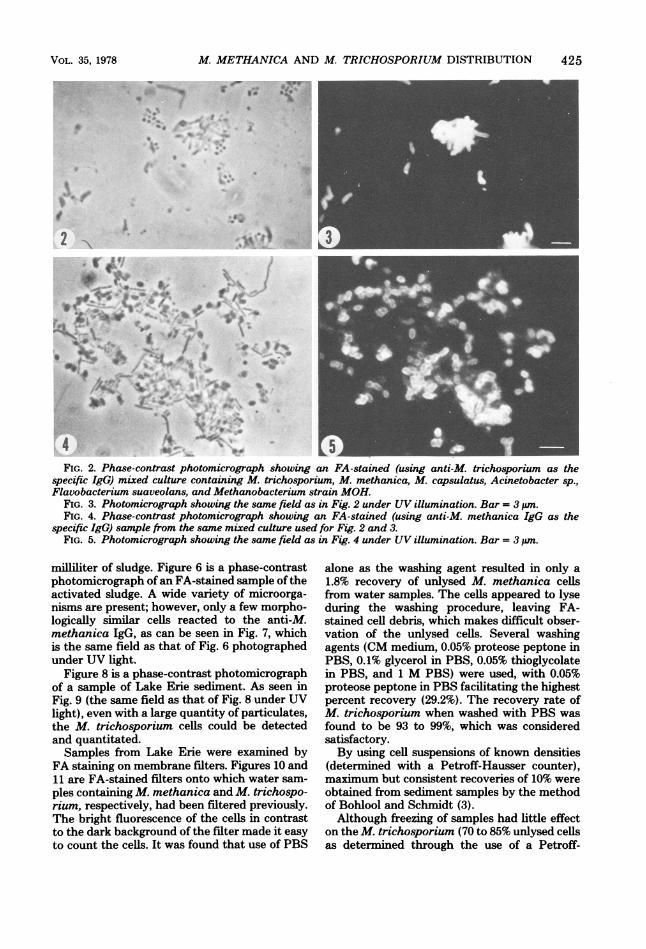
IgG can be seen by comparing Fig. 2, which is aphase-contrast photomicrograph of a mixed cul-ture of M. trichosporium, M. methanica, M.capsulatus, Acinetobacter isolate P-1, Flavo-bacterium suaveolans, and Methanobacteriumstrain MOH that was FA stained by using anti-M. trichosporium IgG, with Fig. 3, which is thesame field photographed under UV illumination.
Figure 4 is a phase-contrast photomicrographof the same mixed culture as shown in Fig. 2 and3 where the cells were FA stained with anti-M.methanica IgG. Figure 5 is the same field as thatshown in Fig. 4 photographed under UV illumi-nation, and only the M. methanica cells flu-oresced.As a further means of observing M. trichospo-
rium and M. methanica in different ecosystems,we determined by staining activated sludge sam-ples taken from Columbus Southerly wastetreatment plant that 3 x 10⁴ M. trichosporiumand 5.6 x 10⁶ M. methanica were present per
TABLE 2. Reactions of a range of bacterial isolateswith specific IgG to M. methanica and M.
trichosporium by indirect immunofluorescenceFA staining reactionb
Isolatesa Anti-M. Anti-M.methanica trichospo-
IgG rium IgG
1. Acinetobacter isolate P-1. - -
2. Azotobacter vinelandii (62) - -
3. Bacillus megaterium (125) - -
4. Enterobacter aerogenes (7) - -
5. Escherichia coli (455) - -
6. Flavobacterium suaveolans - -
7. Methanobacterium formicium JF - -
8. M. ruminantium PS ............ - -
9. Methanosarcina barkerii JF - -
10. Methanobacterium strain MOH -11. Methanospirillum hungattii JF, -12. Methylococcus capsulatus (452) -13. Methylomonas methanica ....... +4 -
14. Methylosinus trichosporium OB3b - +415. Pseudomonas denitrificans (564) -16. Rhizobium japonicum 532c --17. Rhodopseudomonas spheroides
(834) ..-18. Thiobacillus denitrificans (536) -19. T. ferrooxidans (207).. -20. Xanthomonas campestris (108) -21. Gram-positive heterotroph-..22. Gram-negative heterotroph -..23. Methylotroph 1-.24. Methylotroph 2-.25. Methylotroph 3.26. Methylotroph 4 -.l
a Isolates 21 through 26 were isolated directly from Cleve-land Harbor and partially characterized. Numbers in paren-theses are Ohio State University culture collection numbers.
b Staining reaction classifications: -, no fluorescence; +4,intense fluorescence.
APPL. ENVIRON. MICROBIOL.
A
M. METHANICA AND M. TRICHOSPORIUM DISTRIBUTION
FIG. 2. Phase-contrast photomicrograph showing an FA-stained (using anti-M. trichosporium as thespecific IgG) mixed culture containing M. trichosporium, M. methanica, M. capsulatus, Acinetobacter sp.,Flavobacterium suaveolans, and Methanobacterium strain MOH.
FIG. 3. Photomicrograph showing the same field as in Fig. 2 under UV illumination. Bar = 3 pin.FIG. 4. Phase-contrast photomicrograph showing an FA-stained (using anti-M. methanica IgG as the
specific IgG) sample from the same mixed culture used for Fig. 2 and 3.FIG. 5. Photomicrograph showing the same field as in Fig. 4 under UV illumination. Bar = 3 uim.
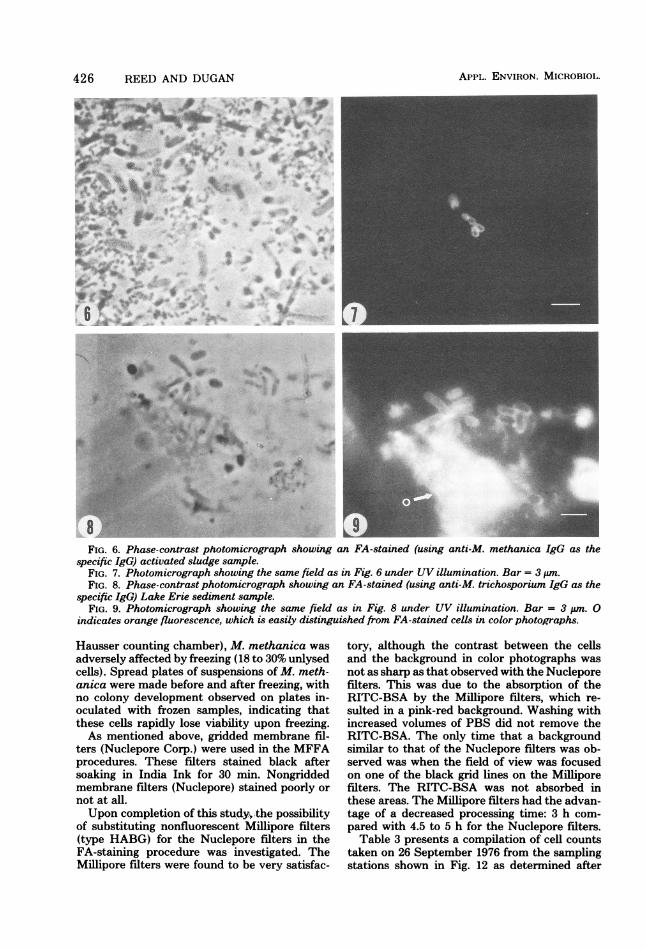
milliliter of sludge. Figure 6 is a phase-contrastphotomicrograph ofan FA-stained sample of theactivated sludge. A wide variety of microorga-nisms are present; however, only a few morpho-logically similar cells reacted to the anti-M.methanica IgG, as can be seen in Fig. 7, whichis the same field as that of Fig. 6 photographedunder UV light.
Figure 8 is a phase-contrast photomicrographof a sample of Lake Erie sediment. As seen inFig. 9 (the same field as that of Fig. 8 under UVlight), even with a large quantity of particulates,the M. trichosporium cells could be detectedand quantitated.Samples from Lake Erie were examined by
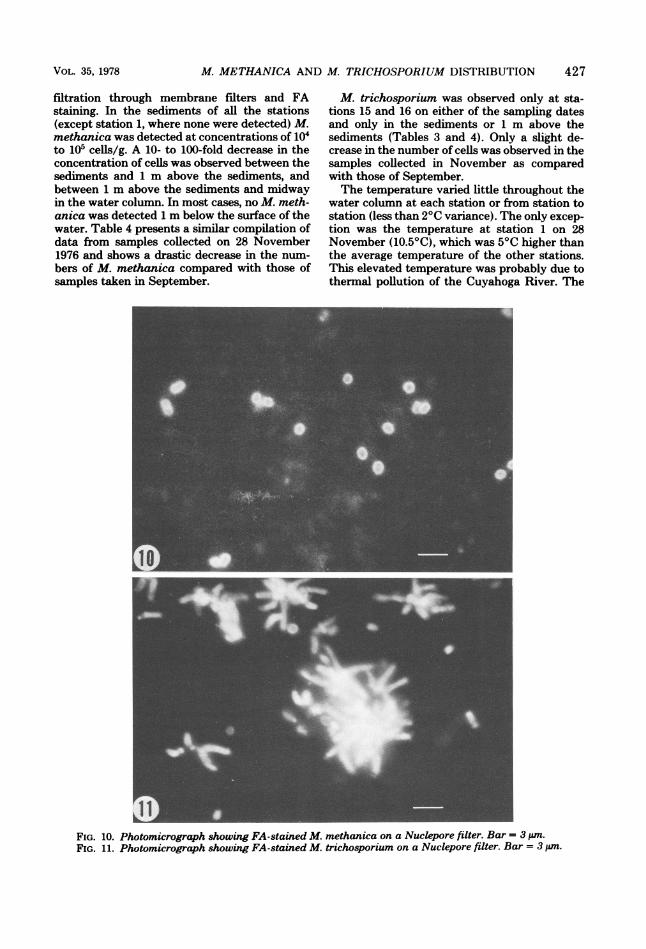
FA staining on membrane filters. Figures 10 and11 are FA-stained filters onto which water sam-ples containing M. methanica and M. trichospo-rium, respectively, had been filtered previously.The bright fluorescence of the cells in contrastto the dark background of the filter made it easyto count the cells. It was found that use of PBS
alone as the washing agent resulted in only a1.8% recovery of unlysed M. methanica cellsfrom water samples. The cells appeared to lyseduring the washing procedure, leaving FA-stained cell debris, which makes difficult obser-vation of the unlysed cells. Several washingagents (CM medium, 0.05% proteose peptone inPBS, 0.1% glycerol in PBS, 0.05% thioglycolatein PBS, and 1 M PBS) were used, with 0.05%proteose peptone in PBS facilitating the highestpercent recovery (29.2%). The recovery rate ofM. trichosporium when washed with PBS wasfound to be 93 to 99%, which was consideredsatisfactory.By using cell suspensions of known densities
(determined with a Petroff-Hausser counter),maximum but consistent recoveries of 10% wereobtained from sediment samples by the methodof Bohlool and Schmidt (3).Although freezing of samples had little effect
on the M. trichosporium (70 to 85% unlysed cellsas determined through the use of a Petroff-
VOL. 35, 1978 425
426 REED AND DUGAN
L8 - -FIG. 6. Phase-contrast photomicrograph showing an FA-stained (using anti-M. methanica IgG as the
specific IgG) activated sludge sample.FIG. 7. Photomicrograph showing the same field as in Fig. 6 under UV illumination. Bar = 3 PM.FIG. 8. Phase-contrast photomicrograph showing an FA-stained (using anti-M. trichosporium IgG as the
specific IgG) Lake Erie sediment sample.FIG. 9. Photomicrograph showing the same field as in Fig. 8 under UV illumination. Bar = 3 pm. 0
indicates orange fluorescence, which is easily distinguished from FA-stained cells in color photographs.
Hausser counting chamber), M. methanica wasadversely affected by freezing (18 to 30% unlysedcells). Spread plates of suspensions of M. meth-anica were made before and after freezing, withno colony development observed on plates in-oculated with frozen samples, indicating thatthese cells rapidly lose viability upon freezing.As mentioned above, gridded membrane fil-
ters (Nuclepore Corp.) were used in the MFFAprocedures. These filters stained black aftersoaking in India Ink for 30 min. Nongriddedmembrane filters (Nuclepore) stained poorly or
not at all.Upon completion of this study, the possibility
of substituting nonfluorescent Millipore filters(type HABG) for the Nuclepore filters in theFA-staining procedure was investigated. TheMillipore filters were found to be very satisfac-
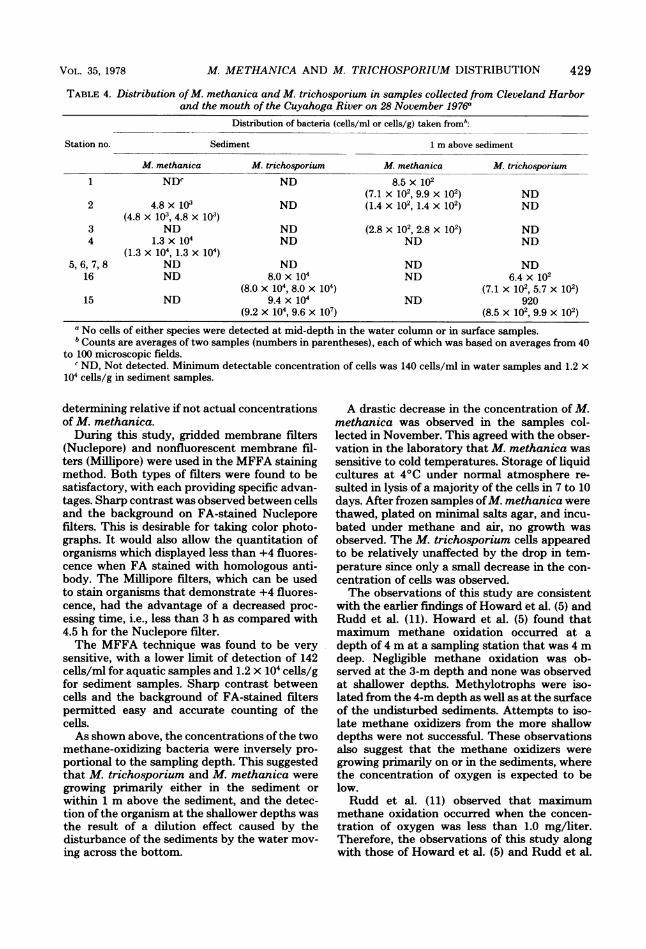
tory, although the contrast between the cellsand the background in color photographs wasnot as sharp as that observed with the Nucleporefilters. This was due to the absorption of theRITC-BSA by the Millipore filters, which re-sulted in a pink-red background. Washing withincreased volumes of PBS did not remove theRITC-BSA. The only time that a backgroundsimilar to that of the Nuclepore filters was ob-served was when the field of view was focusedon one of the black grid lines on the Milliporefilters. The RITC-BSA was not absorbed inthese areas. The Millipore filters had the advan-tage of a decreased processing time: 3 h com-pared with 4.5 to 5 h for the Nuclepore filters.Table 3 presents a compilation of cell counts
taken on 26 September 1976 from the samplingstations shown in Fig. 12 as determined after
APPL. ENVIRON. MICROBIOL.
M. METHANICA AND M. TRICHOSPORIUM DISTRIBUTION
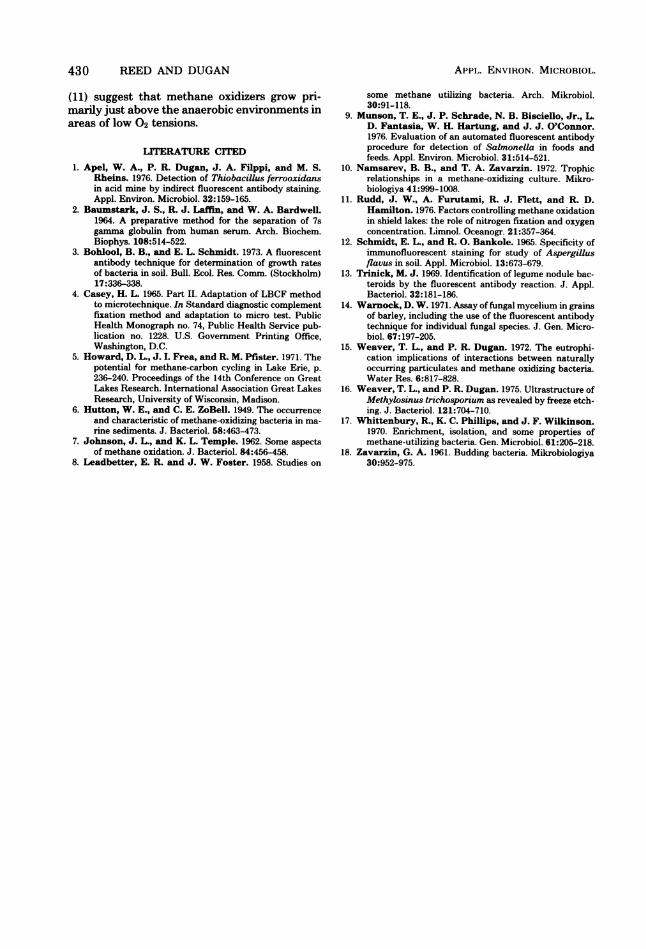
filtration through membrane filters and FAstaining. In the sediments of all the stations(except station 1, where none were detected) M.methanica was detected at concentrations of 104to 105 cells/g. A 10- to 100-fold decrease in theconcentration of cells was observed between thesediments and 1 m above the sediments, andbetween 1 m above the sediments and midwayin the water column. In most cases, no M. meth-anica was detected 1 m below the surface of thewater. Table 4 presents a similar compilation ofdata from samples collected on 28 November1976 and shows a drastic decrease in the num-bers of M. methanica compared with those ofsamples taken in September.
M. trichosporium was observed only at sta-tions 15 and 16 on either of the sampling datesand only in the sediments or 1 m above thesediments (Tables 3 and 4). Only a slight de-crease in the number of cells was observed in thesamples collected in November as comparedwith those of September.The temperature varied little throughout the
water column at each station or from station tostation (less than 2°C variance). The only excep-tion was the temperature at station 1 on 28November (10.5°C), which was 5°C higher thanthe average temperature of the other stations.This elevated temperature was probably due tothermal pollution of the Cuyahoga River. The
FIG. 10. Photomicrograph showing FA-stained M. methanica on a Nuclepore filter. Bar = 3pm.FIG. 11. Photomicrograph showing FA-stained M. trichosporium on a Nuclepore filter. Bar = 3 pm.
VOL. 35, 1978 427
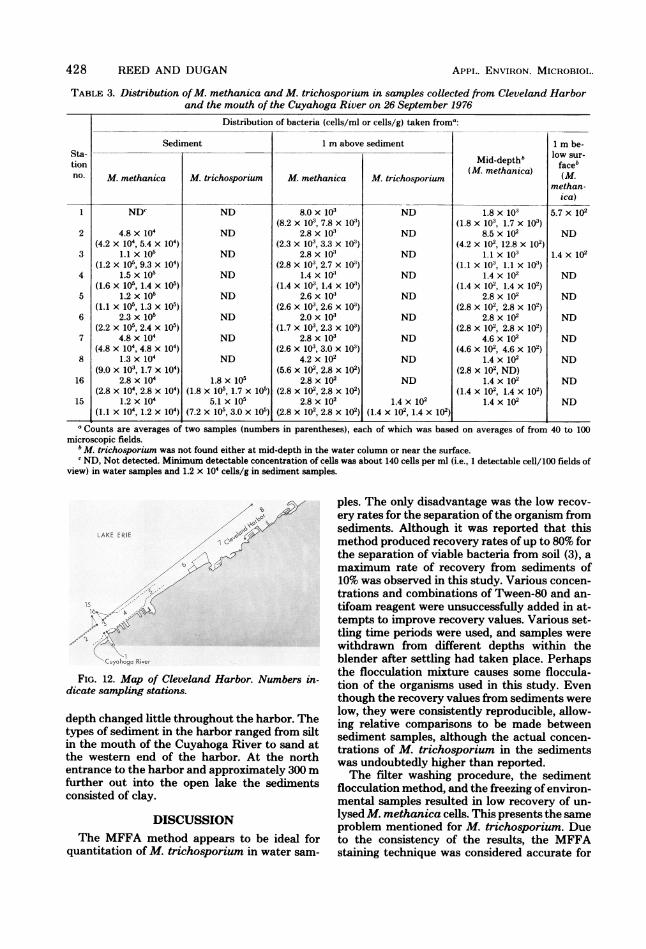
TABLE 3. Distribution ofM. methanica and M. trichosporium in samples collected from Cleveland Harborand the mouth of the Cuyahoga River on 26 September 1976
Distribution of bacteria (cells/ml or cells/g) taken froma:
Sediment 1 m above sediment 1 m be-Sta- b lwsr
tion Mid-depthlwfaceb
no. M. methanica M. trichosporium M. methanica M. trichosporium methan-methan-
ica)1 NDW ND 8.0 x 10³ ND 1.8 x 10:' 5.7 x 10²
(8.2 x 10³, 7.8 x 10:') (1.8 x 10³, 1.7 x 10³)2 4.8x 10⁴ ND 2.8x 10³ ND 8.5x 10² ND
(4.2 x 10⁴, 5.4 x 10⁴) (2.3 x 10³, 3.3 x 10:') (4.2 x 10², 12.8 x 10²)3 1.1 x 10⁵ ND 2.8 x 10' ND 1.1 x 10' 1.4 x 10²
(1.2 x 10⁵, 9.3 x 10⁴) (2.8 x 10³, 2.7 x 10:') (1.1 x 10³, 1.1 x 10:3)4 1.5 x 10⁵ ND 1.4 x 10³ ND 1.4 x 10² ND
(1.6 x 10⁵, 1.4 x 10⁵) (1.4 x 10³, 1.4 x 10:') (1.4 x 10², 1.4 x 10²)5 1.2 x 10⁵ ND 2.6 x 10' ND 2.8 x 10² ND
(1.1 X 10⁵, 1.3 x 10⁵) (2.6 x 10³, 2.6 x 10') (2.8 x 10², 2.8 x 10²)6 2.3 x 10⁵ ND 2.0 x 10³ ND 2.8 x 10² ND
(2.2 x 10⁵, 2.4 x 10⁵) (1.7 x 10³, 2.3 x 10³) (2.8 x 10², 2.8 x 10²)7 4.8 x 10⁴ ND 2.8 x 10³ ND 4.6 x 10² ND
(4.8 x 10⁴, 4.8 x 10W) (2.6 x 10³, 3.0 x 10³) (4.6 x 10², 4.6 x 10²)8 1.3 x 10⁴ ND 4.2 x 10² ND 1.4 x 10² ND
(9.0 x 10³, 1.7 x 10⁴) (5.6 x 10², 2.8 x 10²) (2.8 x 10², ND)16 2.8x 10⁴ 1.8x 10⁵ 2.8x 10² ND 1.4 x 10² ND
(2.8 x 10⁴, 2.8 x 10⁴) (1.8 x 10⁵, 1.7 x 10⁵) (2.8 x 10², 2.8 x 10²) (1.4 x 10², 1.4 x 10²)15 1.2 x 10⁴ 5.1 x 10⁵ 2.8 x 10² 1.4 x 10² 1.4 x 10² ND
(1.1 X 10⁴, 1.2 x 10⁴) (7.2 x 10⁵, 3.0 x 10²)I (2.8 x 10², 2.8 x 10²) (1.4 x 10², 1.4 x 10²)a Counts are averages of two samples (numbers in parentheses), each of which was based on averages of from 40 to 100
microscopic fields.'M. trichosporium was not found either at mid-depth in the water column or near the surface.c ND, Not detected. Minimum detectable concentration of cells was about 140 cells per ml (i.e., 1 detectable cell/100 fields of
view) in water samples and 1.2 x 10⁴ cells/g in sediment samples.
LAKE ERIE
15 . ~~ ~ ~~~~~~b; t,. Ae , ..
hogo River
FIG. 12. Map of Cleveland Harbor. Numbers in-dicate sampling stations.
depth changed little throughout the harbor. Thetypes of sediment in the harbor ranged from siltin the mouth of the Cuyahoga River to sand atthe western end of the harbor. At the northentrance to the harbor and approximately 300 mnfurther out into the open lake the sedimentsconsisted of clay.
DISCUSSIONThe MFFA method appears to be ideal for
quantitation of M. trichosporium in water sam-
ples. The only disadvantage was the low recov-ery rates for the separation of the organism fromsediments. Although it was reported that thismethod produced recovery rates of up to 80% forthe separation of viable bacteria from soil (3), amaximum rate of recovery from sediments of10% was observed in this study. Various concen-trations and combinations of Tween-80 and an-tifoam reagent were unsuccessfully added in at-tempts to improve recovery values. Various set-tling time periods were used, and samples werewithdrawn from different depths within theblender after settling had taken place. Perhapsthe flocculation mixture causes some floccula-tion of the organisms used in this study. Eventhough the recovery values from sediments werelow, they were consistently reproducible, allow-ing relative comparisons to be made betweensediment samples, although the actual concen-trations of M. trichosporium in the sedimentswas undoubtedly higher than reported.The filter washing procedure, the sediment
flocculation method, and the freezing of environ-mental samples resulted in low recovery of un-lysedM. methanica cells. This presents the sameproblem mentioned for M. trichosporium. Dueto the consistency of the results, the MFFAstaining technique was considered accurate for
428 REED AND DUGAN Appi,. ENVIRON. MICROBIOL.
M. METHANICA AND M. TRICHOSPORIUM DISTRIBUTION
TABLE 4. Distribution ofM. methanica and M. trichosporium in samples collected from Cleveland Harborand the mouth of the Cuyahoga River on 28 November 1976P
Distribution of bacteria (cells/ml or cells/g) taken fromb:
Station no. Sediment 1 m above sediment
M. methanica M. trichosporium M. methanica M. trichosporium
1 NDC ND 8.5 x 10²(7.1 x 10², 9.9 x 10²) ND
2 4.8 x 10³ ND (1.4 x 10², 1.4 x 10²) ND(4.8 x 10³, 4.8 x 10³)
3 ND ND (2.8 x 10², 2.8 x 10²) ND4 1.3 x 10⁴ ND ND ND
(1.3 x 10⁴, 1.3 x 10⁴)5,6,7,8 ND ND ND ND
16 ND 8.0 x 10⁴ ND 6.4 x 10²(8.0 x 10⁴, 8.0 x 10⁴) (7.1 x 10², 5.7 x 10²)
15 ND 9.4 x 10⁴ ND 920(9.2 x 10⁴, 9.6 x 10⁷) (8.5 x 10², 9.9 x 10²)
a No cells of either species were detected at mid-depth in the water column or in surface samples.b Counts are averages of two samples (numbers in parentheses), each of which was based on averages from 40
to 100 microscopic fields.c ND, Not detected. Minimum detectable concentration of cells was 140 cells/ml in water samples and 1.2 x
104 cells/g in sediment samples.
determining relative if not actual concentrationsof M. methanica.During this study, gridded membrane filters
(Nuclepore) and nonfluorescent membrane fil-ters (Millipore) were used in the MFFA stainingmethod. Both types of filters were found to besatisfactory, with each providing specific advan-tages. Sharp contrast was observed between cellsand the background on FA-stained Nucleporefilters. This is desirable for taking color photo-graphs. It would also allow the quantitation oforganisms which displayed less than +4 fluores-cence when FA stained with homologous anti-body. The Millipore filters, which can be usedto stain organisms that demonstrate +4 fluores-cence, had the advantage of a decreased proc-essing time, i.e., less than 3 h as compared with4.5 h for the Nuclepore filter.The MFFA technique was found to be very
sensitive, with a lower limit of detection of 142cells/ml for aquatic samples and 1.2 x 10⁴ cells/gfor sediment samples. Sharp contrast betweencells and the background of FA-stained filterspermitted easy and accurate counting of thecells.As shown above, the concentrations ofthe two
methane-oxidizing bacteria were inversely pro-portional to the sampling depth. This suggestedthat M. trichosporium and M. methanica weregrowing primarily either in the sediment orwithin 1 m above the sediment, and the detec-tion of the organism at the shallower depths wasthe result of a dilution effect caused by thedisturbance of the sediments by the water mov-ing across the bottom.
A drastic decrease in the concentration of M.methanica was observed in the samples col-lected in November. This agreed with the obser-vation in the laboratory that M. methanica wassensitive to cold temperatures. Storage of liquidcultures at 4°C under normal atmosphere re-sulted in lysis of a majority of the cells in 7 to 10days. After frozen samples ofM. methanica werethawed, plated on minimal salts agar, and incu-bated under methane and air, no growth wasobserved. The M. trichosporium cells appearedto be relatively unaffected by the drop in tem-perature since only a small decrease in the con-centration of cells was observed.The observations of this study are consistent
with the earlier findings of Howard et al. (5) andRudd et al. (11). Howard et al. (5) found thatmaximum methane oxidation occurred at adepth of 4 m at a sampling station that was 4 mdeep. Negligible methane oxidation was ob-served at the 3-m depth and none was observedat shallower depths. Methylotrophs were iso-lated from the 4-m depth as well as at the surfaceof the undisturbed sediments. Attempts to iso-late methane oxidizers from the more shallowdepths were not successful. These observationsalso suggest that the methane oxidizers weregrowing primarily on or in the sediments, wherethe concentration of oxygen is expected to below.Rudd et al. (11) observed that maximum
methane oxidation occurred when the concen-tration of oxygen was less than 1.0 mg/liter.Therefore, the observations of this study alongwith those of Howard et al. (5) and Rudd et al.
429VOL. 35, 1978
430 REED AND DUGAN
(11) suggest that methane oxidizers grow pri-marily just above the anaerobic environments inareas of low 02 tensions.
LITERATURE CITED
1. Apel, W. A., P. R. Dugan, J. A. Filppi, and M. S.Rheins. 1976. Detection of Thiobacillus ferrooxidansin acid mine by indirect fluorescent antibody staining.Appl. Environ. Microbiol. 32:159-165.
2. Baumstark, J. S., R. J. Laffin, and W. A. Bardwell.1964. A preparative method for the separation of 7sgamma globulin from human serum. Arch. Biochem.Biophys. 108:514-522.
3. Bohlool, B. B., and E. L. Schmidt. 1973. A fluorescentantibody technique for determination of growth ratesof bacteria in soil. Bull. Ecol. Res. Comm. (Stockholm)17:336-338.
4. Casey, H. L. 1965. Part II. Adaptation of LBCF methodto microtechnique. In Standard diagnostic complementfixation method and adaptation to micro test. PublicHealth Monograph no. 74, Public Health Service pub-lication no. 1228. U.S. Government Printing Office,Washington, D.C.
5. Howard, D. L., J. I. Frea, and R. M. Pfister. 1971. Thepotential for methane-carbon cycling in Lake Erie, p.236-240. Proceedings of the 14th Conference on GreatLakes Research. International Association Great LakesResearch, University of Wisconsin, Madison.
6. Hutton, W. E., and C. E. ZoBell. 1949. The occurrenceand characteristic of methane-oxidizing bacteria in ma-rine sediments. J. Bacteriol. 58:463-473.
7. Johnson, J. L., and K. L. Temple. 1962. Some aspectsof methane oxidation. J. Bacteriol. 84:456-458.
8. Leadbetter, E. R. and J. W. Foster. 1958. Studies on
some methane utilizing bacteria. Arch. Mikrobiol.30:91-118.
9. Munson, T. E., J. P. Schrade, N. B. Bisciello, Jr., L.D. Fantasia, W. H. Hartung, and J. J. O'Connor.1976. Evaluation of an automated fluorescent antibodyprocedure for detection of Salmonella in foods andfeeds. Appl. Environ. Microbiol. 31:514-521.
10. Namsarev, B. B., and T. A. Zavarzin. 1972. Trophicrelationships in a methane-oxidizing culture. Mikro-biologiya 41:999-1008.
11. Rudd, J. W., A. Furutami, R. J. Flett, and R. D.Hamilton. 1976. Factors controlling methane oxidationin shield lakes: the role of nitrogen fixation and oxygenconcentration. Limnol. Oceanogr. 21:357-364.
12. Schmidt, E. L., and R. 0. Bankole. 1965. Specificity ofimmunofluorescent staining for study of Aspergillusflavus in soil. Appl. Microbiol. 13:673-679.
13. Trinick, M. J. 1969. Identification of legume nodule bac-teroids by the fluorescent antibody reaction. J. Appl.Bacteriol. 32:181-186.
14. Warnock, D. W. 1971. Assay of fungal mycelium in grainsof barley, including the use of the fluorescent antibodytechnique for individual fungal species. J. Gen. Micro-biol. 67:197-205.
15. Weaver, T. L., and P. R. Dugan. 1972. The eutrophi-cation implications of interactions between naturallyoccurring particulates and methane oxidizing bacteria.Water Res. 6:817-828.
16. Weaver, T. L., and P. R. Dugan. 1975. Ultrastructure ofMethylosinus trichosporium as revealed by freeze etch-ing. J. Bacteriol. 121:704-710.
17. Whittenbury, R., K. C. Phillips, and J. F. Wilkinson.1970. Enrichment, isolation, and some properties ofmethane-utilizing bacteria. Gen. Microbiol. 61:205-218.
18. Zavarzin, G. A. 1961. Budding bacteria. Mikrobiologiya30:952-975.
APPL. ENVIRON. MICROBIOL.


![Classes of Ordinary Differential Equations Obtained for ... · distribution [51], beta distribution [52], raised cosine distribution [53], Lomax distribution [54], beta prime distribution](https://img.pdfslide.net/doc/110x75/5f0b793c7e708231d430b170/classes-of-ordinary-differential-equations-obtained-for-distribution-51-beta.jpg)