Embed Size (px)
Citation preview

District Level Infant Mortality Rate: An Exposition of Small Area Estimation
Awdhesh Yadav1 and Prof. L. Ladusingh
2
Abstract: The present study attempt to explore small area estimation techniques for
estimation of Infant Mortality rate (IMR) at district level for the major state of India.
Since many health data are unavailable at the district level, policymaker sometimes
rely on state-level dataset to understand the health need at district level. District level
data on births and deaths from Civil Registration System and Service Statistics are
inadequate and not access able uniformly for all the districts. To meet the challenge
for the need of district level indicators, the present study is an attempt to assess the
data from the available sources and integrate them through small area estimation
techniques to provide district level estimation infant mortality rate (IMR).The
estimates of IMR by small area method provide robust result as evident from small
gap from Sample Registration System (SRS) and National Family Health Survey
(NFHS-3) at state level. The concluding remark is small area estimation is good for
estimating IMR at district level.
Key word and phrases: Small area technique, Borrowing strength, Synthetic
method, composite method.
1. Introduction: The terms “small area” and “local area” are used to denote a small
geographic area, such as a county or a census division. The demand for small area statistics
has grown tremendously in recent years, especially in the context of decentralized
approaches to population planning and resource of allocation. The consideration of this
study is to utilize the advancement in statistical technique of small area estimation in order
to meet the requirement of district level assessment of mortality in India. Small area
estimation approach can generate reasonably good estimates of mortality and fertility
indicators for subpopulation even when inadequate sample size represents the
subpopulation.
1 Doctoral Fellow, International Institute for Population Sciences (IIPS), Mumbai, India Email: [email protected] 2 Prof and head, Department of Mathematical Demography & Statistics, International Institute for population Sciences, Mumbai, India

It is now widely recognized that direct survey estimates for small area are likely to yield
unacceptable large standard errors due to the small of sample sizes representing the areas.
The approach to small area technique is to “borrow strength” from related areas to
obtained more accurate estimates. This small area estimation technique is called synthetic
estimator. Alternatively model-based procedures have been developed, including those based
on empirical and hierarchical Bayes approaches. Ghosh and Rao (1994) showed that these
Bayesian techniques, for most purposes, seem to have a distinct advantage over other
methods. Farrell, MacGibbon and Tomberlin (1997) developed technique which can be
compared to Empirical bayes estimator, unbiased direct survey estimator and synthetic
estimator.
In many countries, small area estimation techniques are extensively used to produce
the lower area level estimates, e.g. in United Kingdom the estimate of unemployment levels
and rates for their Local Authority Districts (Ambler et al. 2001) and in United States the
estimates of poor school-age children at County level (Citroand Kalton, 2000).In India also,
attempts have been made to use SAE techniques for various purposes (Sharma et al. 2004),
Ladusingh et al. (2007) for estimation of contraceptive prevalence rates among schedule
tribes and schedule caste in empowered action group states.
Ghose and Rao (1994) in their study of small area estimation have highlighted that
small area estimation is becoming important in survey sampling due to a growing demand
for reliable small area statistics at macro and micro level.
Thus, the present study aims to explore small area estimation techniques for estimation
of mortality at sub-national level. Even though there are available estimate of IMR in India,
most of them are at national and states levels. In this study, an attempt is made to estimate
IMR at district level.
2. Need for the study
In India district is the unit of administration and all developmental planning encompassing
multi-sector approach and district level planning has become much vigorous after the 73rd
.
and 74th
. amendments. Decentralized planning has been foster in the XI th
. Plan documents
and the interest of international organizations, in developing local level indices of
development and health. This leads to the growing demand for district level indicators of
development, health, education etc. in the effort for district level monitoring and evaluation
regardless of inadequacy of data from vital registration, service statistics and surveys.
Surveys, even the very largest, are rarely of much use for local level estimation, and if
registration of birth and deaths is still incomplete.
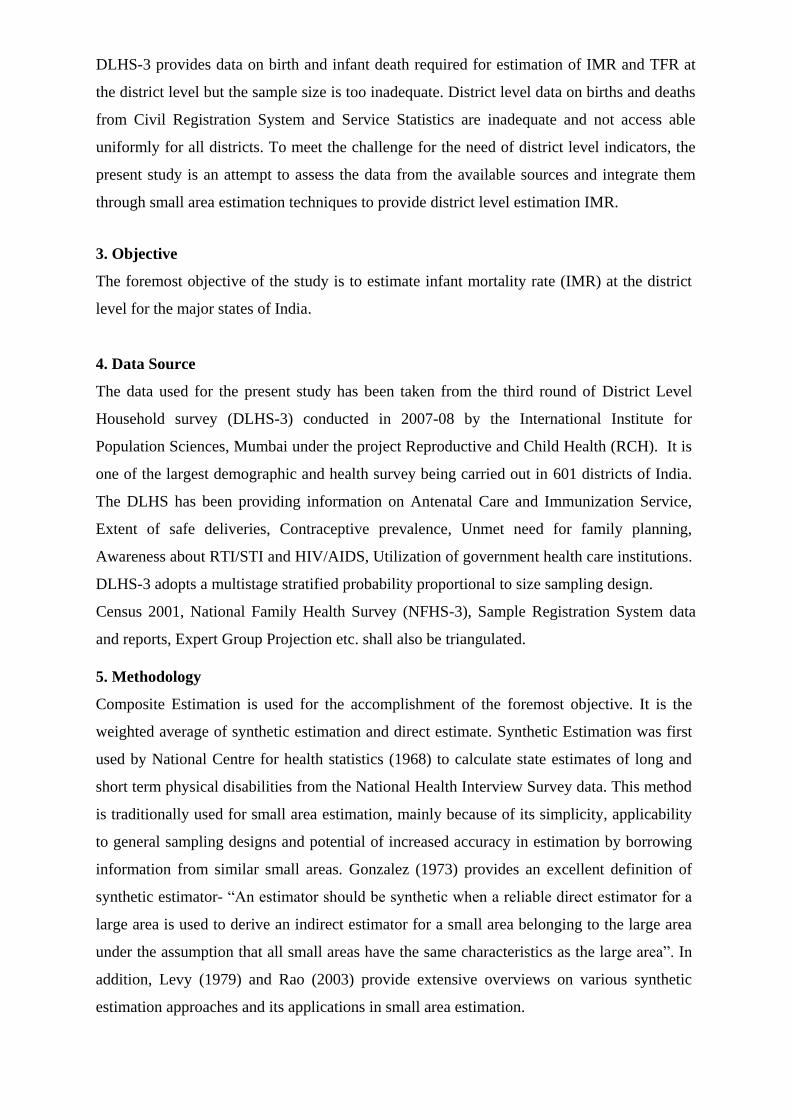
DLHS-3 provides data on birth and infant death required for estimation of IMR and TFR at
the district level but the sample size is too inadequate. District level data on births and deaths
from Civil Registration System and Service Statistics are inadequate and not access able
uniformly for all districts. To meet the challenge for the need of district level indicators, the
present study is an attempt to assess the data from the available sources and integrate them
through small area estimation techniques to provide district level estimation IMR.
3. Objective
The foremost objective of the study is to estimate infant mortality rate (IMR) at the district
level for the major states of India.
4. Data Source
The data used for the present study has been taken from the third round of District Level
Household survey (DLHS-3) conducted in 2007-08 by the International Institute for
Population Sciences, Mumbai under the project Reproductive and Child Health (RCH). It is
one of the largest demographic and health survey being carried out in 601 districts of India.
The DLHS has been providing information on Antenatal Care and Immunization Service,
Extent of safe deliveries, Contraceptive prevalence, Unmet need for family planning,
Awareness about RTI/STI and HIV/AIDS, Utilization of government health care institutions.
DLHS-3 adopts a multistage stratified probability proportional to size sampling design.
Census 2001, National Family Health Survey (NFHS-3), Sample Registration System data
and reports, Expert Group Projection etc. shall also be triangulated.
5. Methodology
Composite Estimation is used for the accomplishment of the foremost objective. It is the
weighted average of synthetic estimation and direct estimate. Synthetic Estimation was first
used by National Centre for health statistics (1968) to calculate state estimates of long and
short term physical disabilities from the National Health Interview Survey data. This method
is traditionally used for small area estimation, mainly because of its simplicity, applicability
to general sampling designs and potential of increased accuracy in estimation by borrowing
information from similar small areas. Gonzalez (1973) provides an excellent definition of
synthetic estimator- “An estimator should be synthetic when a reliable direct estimator for a
large area is used to derive an indirect estimator for a small area belonging to the large area
under the assumption that all small areas have the same characteristics as the large area”. In
addition, Levy (1979) and Rao (2003) provide extensive overviews on various synthetic
estimation approaches and its applications in small area estimation.
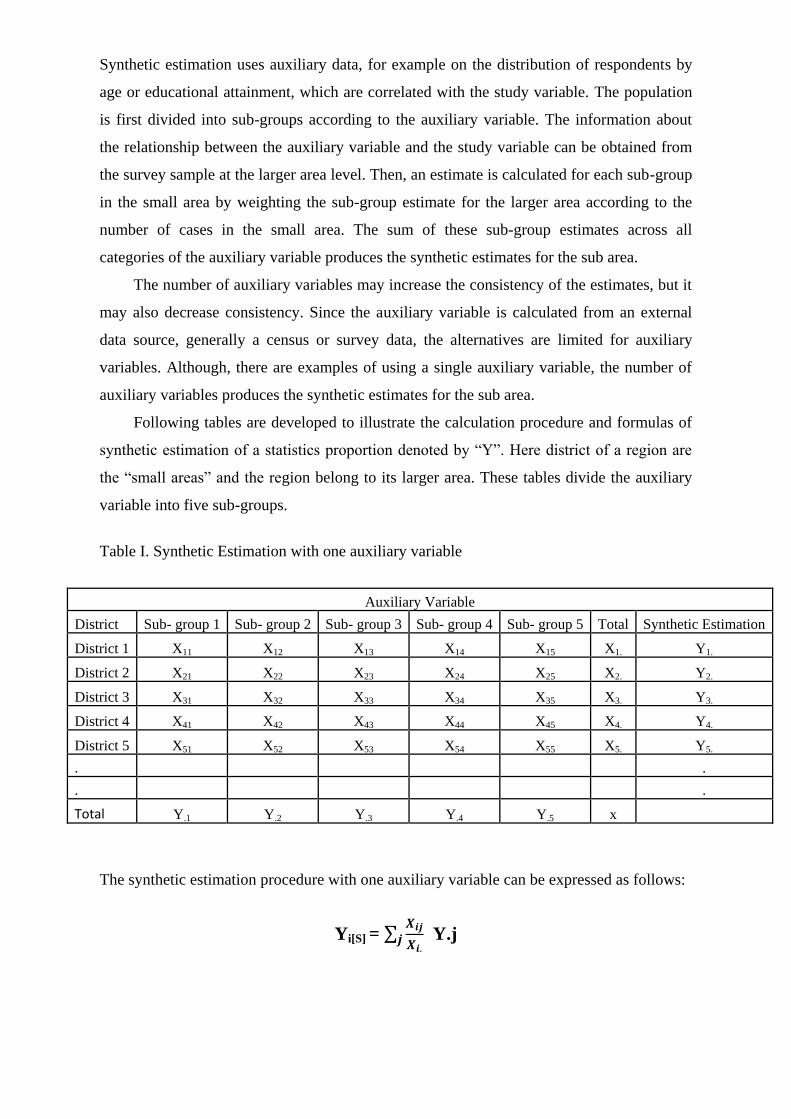
Synthetic estimation uses auxiliary data, for example on the distribution of respondents by
age or educational attainment, which are correlated with the study variable. The population
is first divided into sub-groups according to the auxiliary variable. The information about
the relationship between the auxiliary variable and the study variable can be obtained from
the survey sample at the larger area level. Then, an estimate is calculated for each sub-group
in the small area by weighting the sub-group estimate for the larger area according to the
number of cases in the small area. The sum of these sub-group estimates across all
categories of the auxiliary variable produces the synthetic estimates for the sub area.
The number of auxiliary variables may increase the consistency of the estimates, but it
may also decrease consistency. Since the auxiliary variable is calculated from an external
data source, generally a census or survey data, the alternatives are limited for auxiliary
variables. Although, there are examples of using a single auxiliary variable, the number of
auxiliary variables produces the synthetic estimates for the sub area.
Following tables are developed to illustrate the calculation procedure and formulas of
synthetic estimation of a statistics proportion denoted by “Y”. Here district of a region are
the “small areas” and the region belong to its larger area. These tables divide the auxiliary
variable into five sub-groups.
Table I. Synthetic Estimation with one auxiliary variable
Auxiliary Variable
District Sub- group 1 Sub- group 2 Sub- group 3 Sub- group 4 Sub- group 5 Total Synthetic Estimation
District 1 X11 X12 X13 X14 X15 X1. Y1.
District 2 X21 X22 X23 X24 X25 X2. Y2.
District 3 X31 X32 X33 X34 X35 X3. Y3.
District 4 X41 X42 X43 X44 X45 X4. Y4.
District 5 X51 X52 X53 X54 X55 X5. Y5.
. .
. .
Total Y.1 Y.2 Y.3 Y.4 Y.5 x
The synthetic estimation procedure with one auxiliary variable can be expressed as follows:
Yi[S] =
Y.j
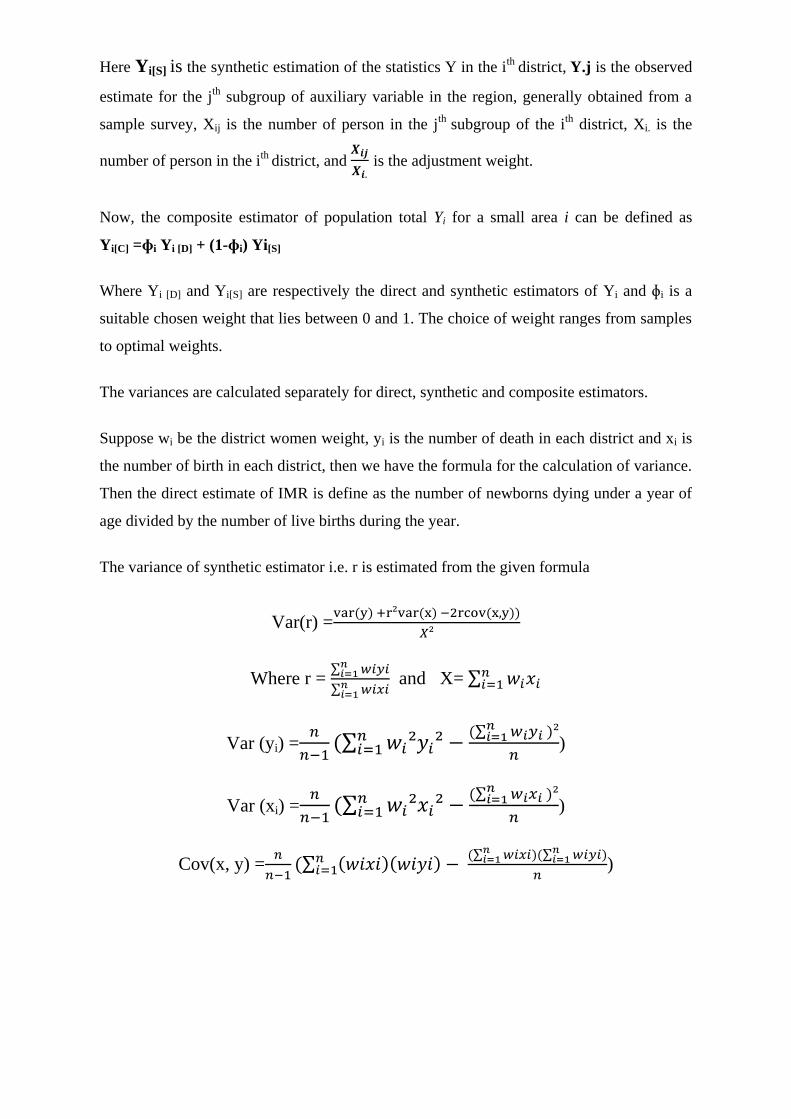
Here Yi[S] is the synthetic estimation of the statistics Y in the ith
district, Y.j is the observed
estimate for the jth
subgroup of auxiliary variable in the region, generally obtained from a
sample survey, Xij is the number of person in the jth
subgroup of the ith
district, Xi. is the
number of person in the ith
district, and
is the adjustment weight.
Now, the composite estimator of population total Yi for a small area i can be defined as
Yi[C] =ɸi Yi [D] + (1-ɸi) Yi[S]
Where Yi [D] and Yi[S] are respectively the direct and synthetic estimators of Yi and ɸi is a
suitable chosen weight that lies between 0 and 1. The choice of weight ranges from samples
to optimal weights.
The variances are calculated separately for direct, synthetic and composite estimators.
Suppose wi be the district women weight, yi is the number of death in each district and xi is
the number of birth in each district, then we have the formula for the calculation of variance.
Then the direct estimate of IMR is define as the number of newborns dying under a year of
age divided by the number of live births during the year.
The variance of synthetic estimator i.e. r is estimated from the given formula
Var(r) =
Where r =
and X=
Var (yi) =
)
Var (xi) =
)
Cov(x, y) =
)

6. Result and Discussion
Table 1 reveals the estimated IMR by using both direct and indirect methods for the districts
of Bihar. In case of direct method, the IMR for Bihar ranges from a lowest of 27.4 per 1000
live births in the district of Madhubani followed by Aurangabad (36.4 per 1000 live births)
to a highest in Kaimur Bhabua (68.2 per 1000 live births) followed by Purnia(63.7 per 1000
live births). In case of Composite estimator, the IMR is lowest in the district of Vaishali and
Saran (40.9 per 1000 live births) followed by Samastipur (45.1 per 1000 live births) to the
highest of Madhepura (68.8 per 1000 live births) followed by Sitamarhi (66.8 per 1000 live
births).
Table 2 reveals the estimated IMR by using both direct and indirect methods for the districts
of Assam. In case of direct method, the IMR for Assam ranges from a lowest of 21.7 per
1000 live births in the district of Sonitpur followed by Chirang (23.4 per 1000 live births) to
a highest in Karimganj (87.1 per 1000 live births) followed by Hailakandi(75.1 per 1000
live births). In case of Composite estimator, the IMR is lowest in the district of Dhemaji
(40.9 per 1000 live births) followed by Kamrup Metro (49.0 per 1000 live births) to the
highest of Kokrajhar (72.7 per 1000 live births) followed by Dhubri(70.6 per 1000 live
births).
Table 3 gives the estimated IMR by using both direct and indirect technique for the district
of Rajasthan. In case of direct method, the estimated IMR ranges from the lowest of 26.3 per
1000 live in the district of Sawai Madhopur followed by Chure (36.8 per 1000 live birth) to
the highest in the district of Dungarpur (68.7 per 1000 live birth) followed by Jaipur (63.8
per 1000 live births). In case of composite estimator, the IMR is lowest in the district of
Jaipur (53.1 per 1000 live births) followed by Churu (53.7 per 1000 live births) to the
highest of Jalore (73.4 per 1000 live births) followed by Barmer (69 per 1000 live births).
The estimated results have been compared with the annual health survey which was
conducted by Registrar General of India in 2010-11 to see the efficacy of proposed method
i.e, composite. The Ministry of Health & Family Welfare, in collaboration with the Registrar
General of India (RGI), Ministry of Home Affair, had launched an Annual Health Survey in
the erstwhile empowered action group (EAG) states (Bihar, Jharkhand, Madhya Pradesh,
Chhattisgarh, Uttar Pradesh, Orissa and Rajasthan) and Assam. The IMR has been estimated
for all major states of India but only the estimates of three states has been given so that these
estimates could make comparable of the AHS result. It has been observed that the
differences are minimal after comparing the results obtained from composite estimator and

AHS result. Also, in each district relative error is calculated and the results are acceptable if
the relative error vary in between 5 to 10. The estimated IMR showing the relative error of
0.81(minimum) to 2.92 (maximum), which enhance the robustness of the used small area
estimation technique at smaller level.
Small area estimation (SAE) is a topic of great importance due to the growing demand
for reliable small area statistics even when only small samples are available for these areas.
Over the year, many statistical agencies have introduced vigorous programs to meet this
demand. Extensive research on the theoretical and practical aspects of SAE is carried out
and many international conference and workshop are held in recent years. Recognizing the
inaccuracies of the administrative data and the fact that even the richest records cannot
cover all the detailed information required for small census tracts, the idea is to test, correct
and supplements the administrative information by sample data.
7. Conclusion
The present study attempts to analyze small area estimation technique at district level. The
consideration of this study is to utilize the advancement in statistical technique of small area
estimation in order to meet the requirement of district level assessment of mortality in India.
Demographic and Health Survey provide accurate and detailed demographic information.
However, this information is limited to nation totals, urban/rural and at most to region due to
the nature of sample surveys. In this study, Synthetic estimation technique were used as an
small area estimation method and finally this synthetic estimation would be used as one of
component of composite estimator to obtained an estimated IMR at district level for the
states in India.
Infant mortality rate has been estimated for the districts of major states of India using direct
method and composite estimator and finally it was compares with the latest Annual Health
Survey (AHS) report. There are minimal differences of two to three points in the estimated
IMRs by composite methods and result from AHS. Since, AHS is the largest demographic
survey in the world and is two and half times that of the Sample Registration System (SRS)
and also there were no issues of sample sizes. On the other hand this small area estimation
technique could give result whenever the sample size is inadequate. So the concluding
remark is that small area estimation is good for estimating estimates like infant mortality
rate (IMR) at district level.
References
Assungao, R. M. , C. P. Schmertmann, J. E. Potter and S. M. Cavenaghi, (2005). “Empirical
Bayes Estimation of Demographic Schedules for Small Areas”. Demography, 42 (3): 537-
558
Beeson, Patricia E., David N. DeJong and Werner Troesken. (2001). “Population Growth in
U.S. Counties, 1840-1990.” Regional Science and Urban Economics 31:669-699.
Bernadinelli, L. and C. Montomoli. (1992). "Empirical Bayes versus Fully Bayesian
Analysis of Geographical Variation in Disease Risk." Statistics in Medicine, 11: 983-1007.
Brick, J.M., and G. Kalton (1996). Handling Missing Data in Survey Research. Statistical
Method in Medical Research, Vol. 5, pp. 215-238.
Citro, C. and Kahon, G. (2000). “Small-area estimates of school age children in poverty. In:
Evaluation of current methodology (National Research Council), Nat. Acad. Press,
Washington DC.
Congdon, Peter. (2009). “Life expectancy for small areas: A Bayesian random effect
methodology.” International Statistical Review, 77(2): 222-240.
Congdon, P. (2010). “Estimating prevalence of Coronary Heart Disease for Small Areas
Using Collateral Indicators of Morbidity”. International Journal of Environmental Research
and Public Health, 7: 164-177.
Fay, R. E. and Herriot, R. A. (1979). “Estimates of income for small places: An application
of James-Stein procedures to Census data”. American Statistical Association, 74: 269-277.
Ghosh, M. and Rao, J. N. K. (1994). “Small area estimation: an appraisal.” Statistical
Sciences, 9: 55-93.
Gonzalez, J.F., Placek, P.J.and Scott, C. (1966). “Synthetic Estimation of follow back
Survey at the National Centre for Health Statistics.” Springer-Verlag: New York, vol. pp.
16-27.
Heady, P., Clarke, P., Brown, G., Ellis, K., Heasman, D., Hennel, S., Longhurst, J.,
Mitchell, B. (2003). “Model-based Small Area Estimation Series No. 2: Small Area
Estimation Project Report”, UK, Office for National Statistics.
J. N. K. Rao (2003). “Small Area Estimation.” John Wiley & Sons, Inc. , Hoboken, New
Jersey.
Levy, P.S. (1968-1979). ”Small Area Estimation-Synthetic and other Procedures”,
Washington, D.C., National Institute on Drug Abuse, vol. 24.
Longford, N. T. (1999). “Multivariate Shrinkage Estimation of Small Area Means and
Proportions.” Journal of the Royal Statistical Society, 162: 227-45.
National Centre For Health Statistics (1968). “Synthetic State Estimate of Disability.” P.H.S.
publication 1759. U.S. Government Printing Office, Washington, DC.
Platek, R., Rao, J. N. K., Sarndal, C. E. and Singh, M. P. (1987). “Small Area Statistics.
Wiley, New York.
Tayman, Jeff, Bob Parrott, and Sue Carnevale. “Locating Fire Station Sites: The Response
Time Component.” In Demographics: A casebook for Business and Government, ed.
Williamson, L., (2006-10). “Developing Strategies for Deriving Small Population Mortality
Rates”. CCSR working paper (from www.ccsr.ac.uk) accessed on 5th
of July, 2010
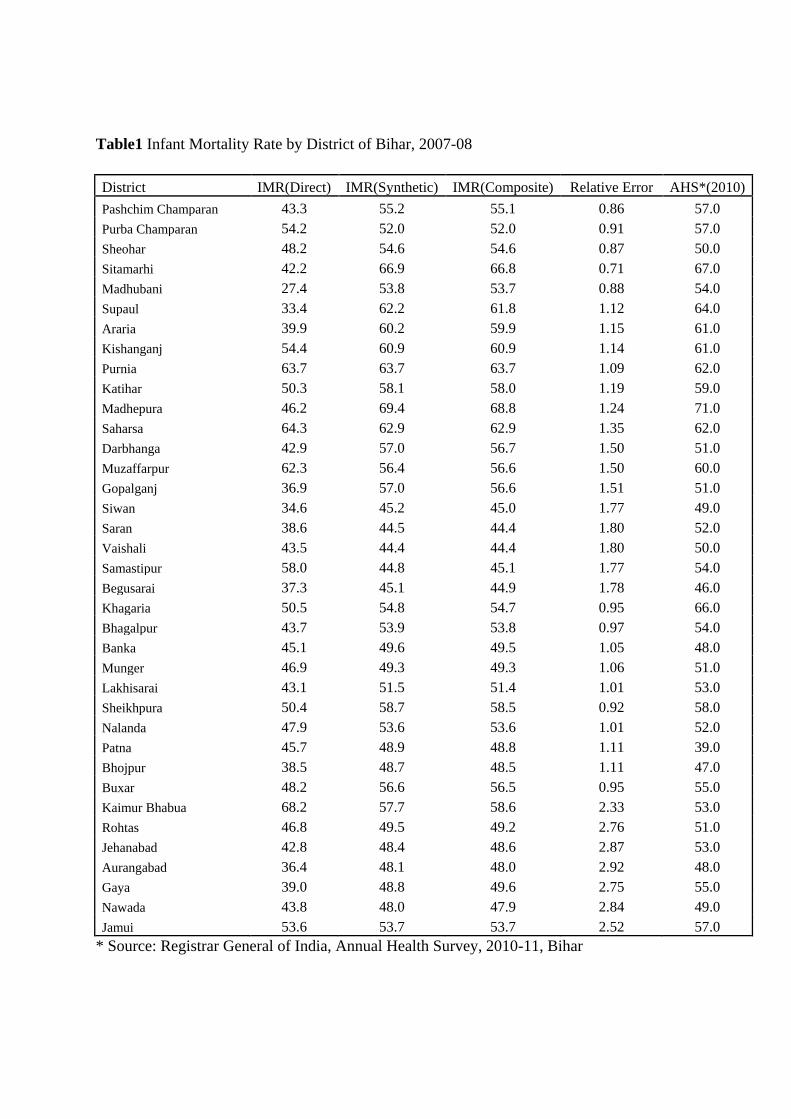
Table1 Infant Mortality Rate by District of Bihar, 2007-08
District IMR(Direct) IMR(Synthetic) IMR(Composite) Relative Error AHS*(2010)
Pashchim Champaran 43.3 55.2 55.1 0.86 57.0
Purba Champaran 54.2 52.0 52.0 0.91 57.0
Sheohar 48.2 54.6 54.6 0.87 50.0
Sitamarhi 42.2 66.9 66.8 0.71 67.0
Madhubani 27.4 53.8 53.7 0.88 54.0
Supaul 33.4 62.2 61.8 1.12 64.0
Araria 39.9 60.2 59.9 1.15 61.0
Kishanganj 54.4 60.9 60.9 1.14 61.0
Purnia 63.7 63.7 63.7 1.09 62.0
Katihar 50.3 58.1 58.0 1.19 59.0
Madhepura 46.2 69.4 68.8 1.24 71.0
Saharsa 64.3 62.9 62.9 1.35 62.0
Darbhanga 42.9 57.0 56.7 1.50 51.0
Muzaffarpur 62.3 56.4 56.6 1.50 60.0
Gopalganj 36.9 57.0 56.6 1.51 51.0
Siwan 34.6 45.2 45.0 1.77 49.0
Saran 38.6 44.5 44.4 1.80 52.0
Vaishali 43.5 44.4 44.4 1.80 50.0
Samastipur 58.0 44.8 45.1 1.77 54.0
Begusarai 37.3 45.1 44.9 1.78 46.0
Khagaria 50.5 54.8 54.7 0.95 66.0
Bhagalpur 43.7 53.9 53.8 0.97 54.0
Banka 45.1 49.6 49.5 1.05 48.0
Munger 46.9 49.3 49.3 1.06 51.0
Lakhisarai 43.1 51.5 51.4 1.01 53.0
Sheikhpura 50.4 58.7 58.5 0.92 58.0
Nalanda 47.9 53.6 53.6 1.01 52.0
Patna 45.7 48.9 48.8 1.11 39.0
Bhojpur 38.5 48.7 48.5 1.11 47.0
Buxar 48.2 56.6 56.5 0.95 55.0
Kaimur Bhabua 68.2 57.7 58.6 2.33 53.0
Rohtas 46.8 49.5 49.2 2.76 51.0
Jehanabad 42.8 48.4 48.6 2.87 53.0
Aurangabad 36.4 48.1 48.0 2.92 48.0
Gaya 39.0 48.8 49.6 2.75 55.0
Nawada 43.8 48.0 47.9 2.84 49.0
Jamui 53.6 53.7 53.7 2.52 57.0
* Source: Registrar General of India, Annual Health Survey, 2010-11, Bihar
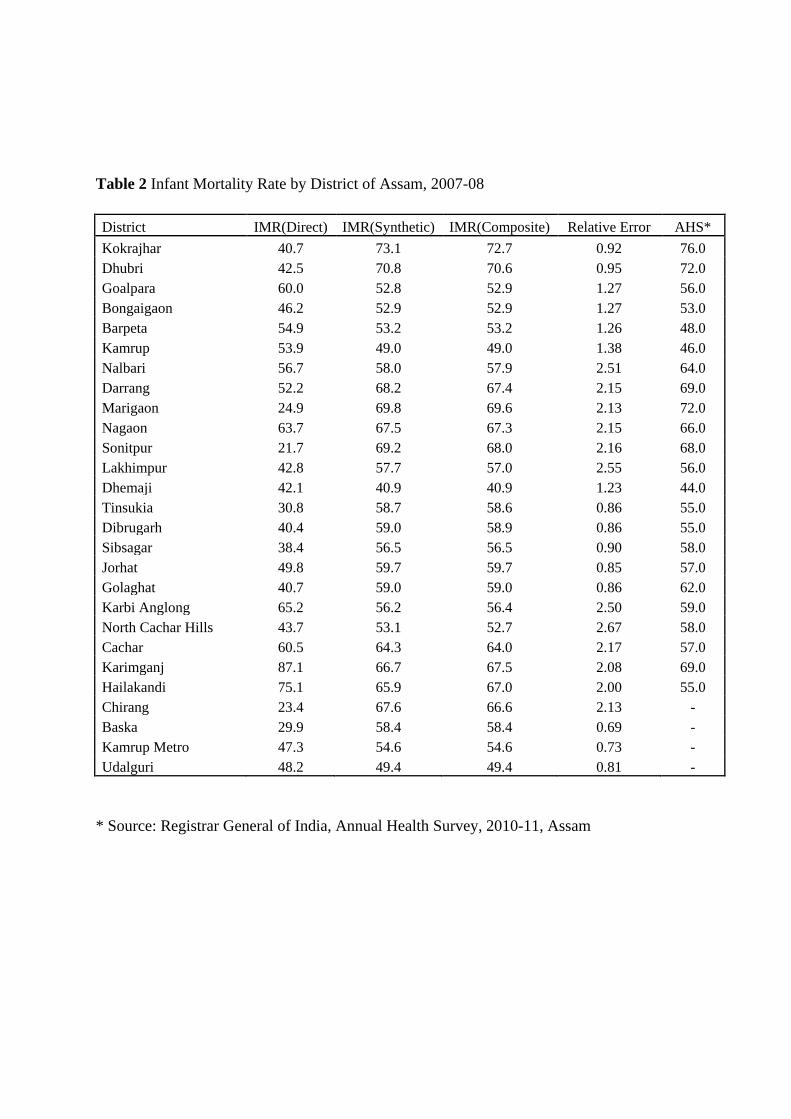
Table 2 Infant Mortality Rate by District of Assam, 2007-08
District IMR(Direct) IMR(Synthetic) IMR(Composite) Relative Error AHS*
Kokrajhar 40.7 73.1 72.7 0.92 76.0
Dhubri 42.5 70.8 70.6 0.95 72.0
Goalpara 60.0 52.8 52.9 1.27 56.0
Bongaigaon 46.2 52.9 52.9 1.27 53.0
Barpeta 54.9 53.2 53.2 1.26 48.0
Kamrup 53.9 49.0 49.0 1.38 46.0
Nalbari 56.7 58.0 57.9 2.51 64.0
Darrang 52.2 68.2 67.4 2.15 69.0
Marigaon 24.9 69.8 69.6 2.13 72.0
Nagaon 63.7 67.5 67.3 2.15 66.0
Sonitpur 21.7 69.2 68.0 2.16 68.0
Lakhimpur 42.8 57.7 57.0 2.55 56.0
Dhemaji 42.1 40.9 40.9 1.23 44.0
Tinsukia 30.8 58.7 58.6 0.86 55.0
Dibrugarh 40.4 59.0 58.9 0.86 55.0
Sibsagar 38.4 56.5 56.5 0.90 58.0
Jorhat 49.8 59.7 59.7 0.85 57.0
Golaghat 40.7 59.0 59.0 0.86 62.0
Karbi Anglong 65.2 56.2 56.4 2.50 59.0
North Cachar Hills 43.7 53.1 52.7 2.67 58.0
Cachar 60.5 64.3 64.0 2.17 57.0
Karimganj 87.1 66.7 67.5 2.08 69.0
Hailakandi 75.1 65.9 67.0 2.00 55.0
Chirang 23.4 67.6 66.6 2.13 -
Baska 29.9 58.4 58.4 0.69 -
Kamrup Metro 47.3 54.6 54.6 0.73 -
Udalguri 48.2 49.4 49.4 0.81 -
* Source: Registrar General of India, Annual Health Survey, 2010-11, Assam

Table 3 Infant Mortality Rate by District of Rajasthan, 2007-08
District IMR(Direct) IMR(Synthetic) IMR(Composite) Relative Error AHS*
Ganganagar 45.8 63.4 63.1 1.45 60.0
Hamumangarh 57.5 55.6 55.6 1.65 54.0
Bikaner 53.1 58.0 57.9 1.58 54.0
Churu 36.8 54.0 53.7 1.70 55.0
Jhunjhunun 38.1 56.3 56.1 1.64 54.0
Alwar 40.4 55.1 55.0 1.67 59.0
Bharatpur 51.0 58.3 57.9 2.02 55.0
Dhaulpur 48.9 66.4 65.5 1.79 63.0
Karauli 51.7 69.6 68.8 1.71 68.0
Sawai Madhopur 26.3 64.9 64.4 1.86 67.0
Dausa 53.5 56.8 56.6 2.08 57.0
Jaipur 63.8 52.7 53.1 2.22 55.0
Sikar 43.8 57.3 57.3 0.73 56.0
Nagaur 51.6 59.3 59.3 0.71 59.0
Jodhpur 53.2 58.9 58.9 0.71 54.0
Jaisalmer 52.5 61.6 61.6 0.68 58.0
Barmer 50.2 69.2 69.0 0.61 72.0
Jalore 49.1 73.5 73.4 0.57 79.0
Sirohi 49.0 59.9 59.8 1.13 62.0
Pali 49.2 58.3 58.2 1.16 55.0
Ajmer 43.9 57.1 56.9 1.18 57.0
Tonk 53.3 58.1 58.1 1.16 51.0
Bundi 51.0 58.3 58.2 1.16 65.0
Bhilwara 52.8 58.6 58.5 1.15 68.0
Rajsamand 49.9 63.9 63.9 0.89 65.0
Udaipur 53.0 56.0 56.0 1.01 62.0
Dungarpur 49.1 66.0 65.9 0.86 67.0
Banswara 49.1 66.0 65.9 0.86 62.0
Chittaurgarh 49.9 64.1 64.0 1.14 62.0
Kota 55.6 68.3 68.1 1.07 36.0
Baran 68.7 64.9 64.9 1.12 60.0
Jhalawar 54.6 65.0 64.9 1.12 65.0
* Source: Registrar General of India, Annual Health Survey, 2010-11, Rajasthan