Embed Size (px)
Citation preview
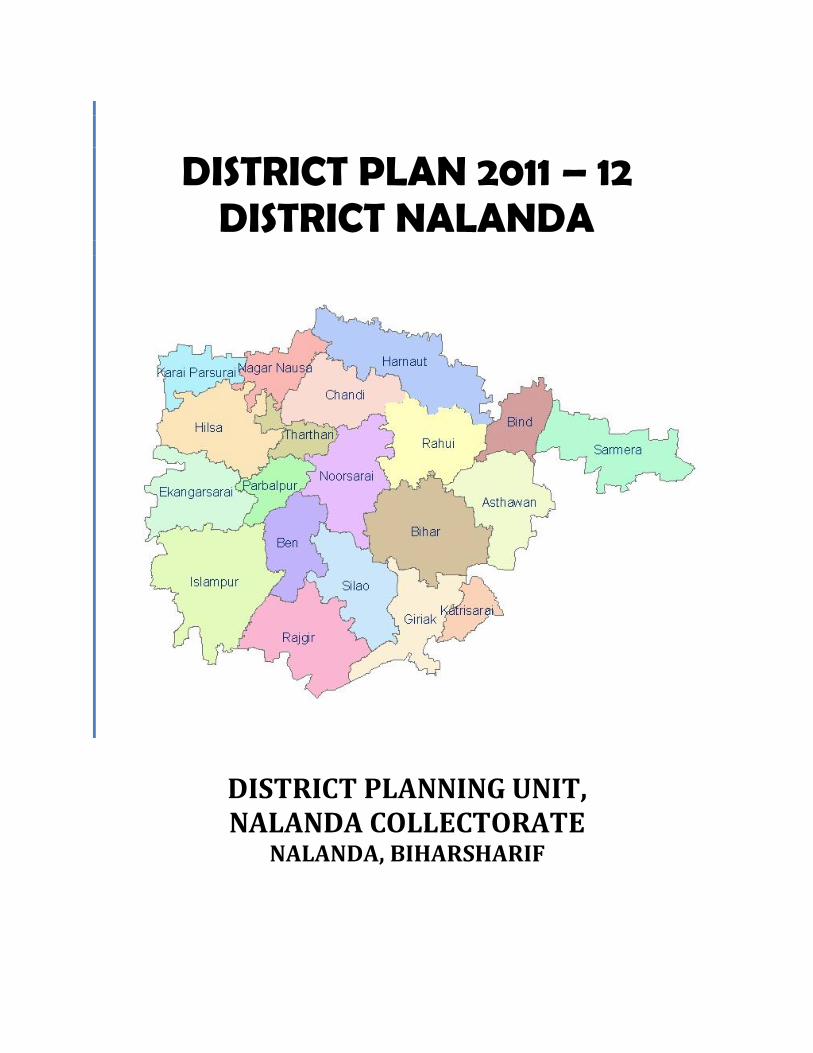
DISTRICT PLAN 2011 – 12 DISTRICT NALANDA
DISTRICT PLANNING UNIT, NALANDA COLLECTORATE
NALANDA, BIHARSHARIF
Page 1 of 89
ACKNOWLEDGEMENTS
In pursuance of the decision taken by Govt. of Bihar to ensure that district plan is an
integral part of State plan for the year 2011-12. It is my pleasure to bringing it out Nalanda
District Plan 2011-12. Being the first integrated district Plan, it sets-down the status of
development schemes in district and identified areas of concern, both sectoral and spatial.
The experience of last few years saw considerable progress on many fronts in the district
but also brought out in sharp contrast the gaps in infrastructure that became impeders and
decelerators in development progress. Across the district, basic road connectivity, and
basic power availability were turning into development concerns. It is also required for
growth and providing people equality of opportunities in today’s changing economy were
also identified as needing assessment.
The initiative of preparing the integrated district plan has been taken with technical
support of GoI-UN Joint Convergence Program steered by the Department of Planning and
Development, GoB. Besides, the district facilitator deputed at districts, the support of state
project officials Mr. Brajesh Kumar Das, State Project Officer; Mr. Raj Kamal Srivastava,
State Convergence Facilitator and Mr. Abhishek Singh, State Convergence Facilitator
rendered their regular and valuable support in designing the District Plan.
Preparation of Integrated District Plan could not be thought-of without the guidance of
departmental officials. I am sincerely thankful to Mr. Vijoy Prakash, Principal Secretary,
Planning and all the departmental officials. The processes could not be actualized without
untiring support of Dr. Harendra Prasad, Joint Director cum nodal officer, GoI-UNJCP,
Planning department. I would submit my special thanks to him.
I am grateful to Ms. Sunita Devi and all the Members of DPC who took such a keen interest
in the deliberations. Mr. Jai Singh, Deputy Development Commissioner, Mr. Aditya Kumar
Das (Ex-DDC), Mr. Ravinder Singh & Mr. Ashutush Kumar, Deputy Collectors made
invaluable contributions by putting together the material received from Departments and
his own deep insights and practical experience of the Plan preparation. I would also like to
express my thanks to Mr. Rajesh Kumar-District Planning Officer and Mr. Ashish Dwivedi-
DF, Mr. Kaushal Kishore-DSO from UNJCP who worked tirelessly and help to fill a critical
gap in all sectors and its integration with the District plan for the district.
I hope this Annual District Plan after its approval will further accelerate the development of
the district and mark a new milestone in the district to fulfil the hopes and aspirations of
the people for sustainable development.
Sanjay Kumar Agrawal IAS District Magistrate,
Nalanda-Bihar
Page 2 of 89
CONTENTS
INTRODUCTION: ................................................................................................................................................................................6
PLANNING OBJECTIVES: ................................................................................................................................................................6
APPROACH OF THE DISTRICT PLANNING: ..........................................................................................................................7
DISTRICT PLANNING PROCESS: ................................................................................................................................................8
DISTRICT CONSULTATION WORKSHOP: .........................................................................................................................8
TOOLS AND TECHNIQUES: ......................................................................................................................................................9
COLLECTION OF BASIC DATA FOR PLANNING: ...........................................................................................................9
DATA ANALYSIS AND PLAN PREPARATION: ................................................................................................................9
OUTCOME OF THE PLAN PREPARATION: .......................................................................................................................9
HISTORICAL PERSPECTIVE: ..................................................................................................................................................... 10
DISTRICT PROFILE: ....................................................................................................................................................................... 10
ADMINISTRATIVE SET – UP: ............................................................................................................................................... 10
DISTRICT DEMOGRAPHY AND DISTRICT DEVELOPMENT INDICATORS: .................................................. 11
LAND USE PATTERN: .............................................................................................................................................................. 13
CLIMATE AND AGRO ECOLOGICAL SITUATION: ...................................................................................................... 14
SOCIAL STRUCTURE: ............................................................................................................................................................... 15
FACT SHEET OF BLOCKS AND URBAN LOCAL BODIES: ....................................................................................... 16
SWOT ANALYSIS OF THE DISTRICT: .................................................................................................................................... 19
SECTORAL SWOT ANALYSIS..................................................................................................................................................... 26
AGRICULTURE AND ALLIED ACTIVITIES: .................................................................................................................... 26
LAND & CROP HUSBANDRY ............................................................................................................................................ 26
HORTICULTURE SECTOR ................................................................................................................................................. 28
LIVESTOCK SECTOR: .......................................................................................................................................................... 29
FISHERIES SECTOR: ............................................................................................................................................................ 30
RURAL DEVELOPMENT: ........................................................................................................................................................ 31
IRRIGATION AND FLOOD CONTROL: .............................................................................................................................. 33
Page 3 of 89
ENERGY: ......................................................................................................................................................................................... 34
INDUSTRY & MINERALS: ....................................................................................................................................................... 34
TRANSPORTS ............................................................................................................................................................................... 35
FOREST ........................................................................................................................................................................................... 35
GENERAL ECONOMIC SERVICES: ...................................................................................................................................... 36
SOCIAL SERVICES: ..................................................................................................................................................................... 36
GENERAL SERVICES: ............................................................................................................................................................... 38
RESOURCE ENVELOP OF THE DISTRICT: 2011 – 12 ................................................................................................... 40
AVAILABILITY OF FUND:....................................................................................................................................................... 40
REQUIREMENT OF FUND 2011 - 12:............................................................................................................................... 44
DIFFERENCE OF FUND (PROPOSED OUTLAY AND REQUIREMENT):........................................................... 47
SECTORAL DISTRICT PLANS/SCHEMES: 2011 - 12 ..................................................................................................... 52
I. AGRICULTURE AND ALLIED ACTIVITIES: ................................................................................................................ 52
(A) BIHAR RAJYA BEEJ NIGAM ...................................................................................................................................... 52
(B) SEED PRODUCTION ON GOVERNMENT FARMS .......................................................................................... 52
(C) MAIZE & POULTRY TASK FORCE ......................................................................................................................... 52
II. RURAL DEVELOPMENT: ................................................................................................................................................... 52
SWARNJAYANTI GRAM SWAROJGARYOJANA ....................................................................................................... 52
INDIRA AWASYOJANA (IAY)........................................................................................................................................... 52
D.P.A.P. AND I.W.D.P............................................................................................................................................................ 53
D.R.D.A. ADMINISTRATION AND BUILDING .......................................................................................................... 53
III. SPECIAL AREA PROGRAMME: ..................................................................................................................................... 53
SCA TO TSA .............................................................................................................................................................................. 53
IV. IRRIGATION AND FLOOD CONTROL ........................................................................................................................ 53
IRRIGATION SECTOR (MAJOR & MEDIUM IRRIGATION SCHEMES) ......................................................... 53
V. ENERGY ..................................................................................................................................................................................... 54
VI. INDUSTRY AND MINERALS ........................................................................................................................................... 54
HANDICRAFTS ....................................................................................................................................................................... 54
VII. TRANSPORT ......................................................................................................................................................................... 54
VIII. SCIENCE, TECHNOLOGY AND ENVIRONMENT ............................................................................................... 54
Page 4 of 89
IX. GENERAL ECONOMIC SERVICES ................................................................................................................................ 54
STRENGTHENING OF PLANNING MACHINERY AT THE DISTRICT LEVEL ............................................ 54
DISTRICT PLANNING COMMITTEE: ........................................................................................................................... 55
X. SOCIAL SERVICE.................................................................................................................................................................... 55
SECONDARY EDUCATION: ............................................................................................................................................... 55
RAJBHASHA ............................................................................................................................................................................. 55
ART, CULTURE AND YOUTH SERVICES .................................................................................................................... 56
WATER SUPPLY AND SANITATION ............................................................................................................................ 56
INDRAAWASYOJANA .......................................................................................................................................................... 57
INFORMATION AND PUBLIC RELATIONS ............................................................................................................... 57
SC & ST WELFARE ................................................................................................................................................................ 57
PROGRAMME OUTLINE: ................................................................................................................................................... 58
WELFARE OF SCHEDULED CASTES ............................................................................................................................ 58
DEVELOPMENT OF OBC & EBC ..................................................................................................................................... 58
LABOUR EMPLOYMENT.................................................................................................................................................... 58
LABOUR WING ....................................................................................................................................................................... 59
ORGANIZATION OF TRAINING CAMPS FOR RURAL AND UNORGANIZED WORKERS .................... 59
XI. GENERAL SERVICES .......................................................................................................................................................... 59
JAIL:- ............................................................................................................................................................................................ 59
FINANCE DEPARTMENT MODERNIZATION .......................................................................................................... 59
PUBLIC WORKS ..................................................................................................................................................................... 59
JUDICIAL BUILDING ............................................................................................................................................................ 60
EXCISE ........................................................................................................................................................................................ 60
MINORITY FINANCING ...................................................................................................................................................... 60
BRIEF MINORITY BENIFIT .............................................................................................................................................. 61
LAW ............................................................................................................................................................................................. 62
REGISTRATION ...................................................................................................................................................................... 62
BIHAR RURAL LIVELIHOOD PROJECT (JEEVIKA) ............................................................................................... 62
INFORMATION AND PUBLIC RELATIONS ............................................................................................................... 63
COMMERCIAL TAXES ......................................................................................................................................................... 63
Page 5 of 89
SCHEDULED CASTE SUB PLAN: 2011 – 12 ....................................................................................................................... 64
INTRODUCTION: ........................................................................................................................................................................ 64
OBJECTIVES: ................................................................................................................................................................................. 64
STRATEGIES: ................................................................................................................................................................................ 65
SCSP PLAN 2011 - 12 ............................................................................................................................................................... 65
TRIBAL SUB PLAN (TSP): 2011 – 12 .................................................................................................................................... 72
INTRODUCTION: ........................................................................................................................................................................ 72
OBJECTIVES: ................................................................................................................................................................................. 72
STRATEGIES: ................................................................................................................................................................................ 72
TSP 2011 - 12 ............................................................................................................................................................................... 73
WOMEN COMPONENT OF DISTRICT ANNUAL PLAN: 2011 – 12.......................................................................... 79
INTRODUCTION: ........................................................................................................................................................................ 79
OBJECTIVES: ................................................................................................................................................................................. 79
STRATEGIES: ................................................................................................................................................................................ 79
WOMEN COMPONENT IN ANNUAL PLAN 2011 - 12 .............................................................................................. 79
DISTRICT PLAN 2011-12: A SNAPSHOT ............................................................................................................................. 86
Page 6 of 89
CHAPTER I INTRODUCTION, METHODOLOGY AND PROFILE OF THE DISTRICT
INTRODUCTION:
The Eleventh Five Year Plan marked a major shift in the development strategy of the Indian state, by foregrounding the need for “faster and more inclusive growth”. This was in sharp contrast to the post economic reform agenda of pursuing vigorous growth, reflective of the government’s belief that “there cannot be inclusive growth without growth itself” [Ministry of Finance 2007: 15]. This shift was borne out of the realization that while at one level the country had recorded an impressive growth rate of 8.9%, at another level, contradictions between different sections of society continued to persevere. The Planning Commission noted in the approach to the Eleventh Five-Year Plan, that “large parts of our population are still to experience a decisive improvement in their standard of living…. far too many of our people still lack the basic requirements for a decent living...disadvantaged groups, especially the Scheduled Castes and Scheduled Tribes and the minorities have benefited less than they should have. Regional imbalances have emerged across and even within states” [Planning Commission 2006: 1]. To address these growing disparities, there was an immediate need thus to reorient the development strategy and make it more inclusive so that the country’s growth would be indicative of not just “the distribution of economic gains but also the security, vulnerability, empowerment, and sense of full participation that people may enjoy in social life”. The GoI-UN Joint Convergence Program is providing technical support in effective and efficient service delivery of the flagship schemes in the convergence district Nalanda under Joint UN program. The program is putting its efforts in system strengthening to facilitate in providing enabling environment for decentralized planning, integration and convergence among various government programs. The joint program on convergence is having four outcomes viz. JP OUTCOME 1: Integrated and inclusive district planning adopted; JP OUTCOME 2: Districts able to mobilize and utilize maximum of resources from
government programs and other sources; JP OUTCOME 3: Service delivery under government programs improved at local level; JP OUTCOME 4: Monitoring used for management and planning purposes.
PLANNING OBJECTIVES:
The core objective of the integrated planning exercise was to demonstrate the processes of integration and equipped the district administration with a handbook on compiled planning covering key sectors. The efforts showcase the modus operandi of operationalizing integrated planning process with effective participation of all sectoral line departments and stakeholders. The integration is conducted with special reference to the disadvantaged community viz. women and scheduled castes.
Page 7 of 89
The initiatives summarily focus in realizing the following objectives…
To understand the issues and their demographic variance at the district and blocks level
Identify and analysing major bottlenecks across key sectors by the exercising SWOT analysis
Explore opportunities available in the district across all major sectors
To comprehend the process of integration as per vision prepared for the district. Mapping all sectoral resources and compiling in as integrated district plan Planning as per the concept of civic entitlements Identifying gap in resource allocations across all key sectors Identify the area of Convergence among various schemes & programs Preparing a comprehensive District Plan handbook Use it as an advocacy tool for future planning and resource mobilisation
To tap the issue of social exclusion and discrimination so that the gap between the disadvantaged groups viz. Women, SC and others is reduced to reasonable minimum, following measures could be taken.
Developing data base and information of the excluded community Disaggregated information on development indicators Develop exclusive plan for the excluded community Promote social messages towards social inclusion and non discriminatory behavior Ensure social inclusion and non-discrimination as underpinning common threads in all
interventions Giving voice to the socially excluded communities and their experiences
APPROACH OF THE DISTRICT PLANNING:
Mere formulation through the 73rd Constitutional Amendment Act has not been enough to institutionalize and empower local bodies because of various political compulsions existing at the time of bringing about the amendment. The need and challenge is to demonstrate with formulating convergent and integrated plan, which suits the local demand and cater the needs the district. The need of inter-sectoral convergence is largely recognized at various levels.
With decentralized planning gaining momentum, it is important that various departments come together and explore the various points of convergence through integrated district planning. But still the concept of district planning is considerably diluted by the fact that most departmental schemes and programs envisage in their guidelines, separate and self contained ‘planning processes and it would be extremely difficult to revert this process with immediate effect. Also, the PRIs lack the technical capacity to take up planning process. Therefore, rolling out integrated planning simultaneously in complete district would be extremely demanding.
Page 8 of 89
Looking to the present scenario of development and governance, the District Administration, Nalanda under the GoI-UN Joint Program on Convergence adopted an approach of integration of sectoral plans in the process of compiling an integrated district plan.
DISTRICT PLANNING PROCESS:
Planned development in India has completed Ten Five Year Plans and is in the final stage of the Eleventh Five Year Plan. Growth with justice has been the broader goals and challenges of exclusion have been the concerns of policy makers and planners which have been duly emphasized in the process of micro planning and inclusive development of this country. With the 73rd and 74th Amendments of the Indian Constitution decentralised development policy planning and governance emerged as an important institutional legal framework. Local Self Governance has been brought into the prominent roles as development agency. The Thirteenth Finance Commission has also categorically emphasised and focused on addressing the issues of horizontal vertical disparities. This has further reinforced the importance of capacity building of various stake holders engaged in integrated development policy planning and governance. For effective participation of the agencies of Local Self Governance and other stakeholders, multi-dimensional training and capacity building initiatives have been taken up towards strengthening these institutions. Still there is long way to go in terms of capacity building at different levels of local self governance and other stakeholders for effective participatory development planning and governance towards fulfillment of the mandate created through 73rd and 74th Constitutional Amendments. This also needs effective integration and convergence of resources and initiatives for their optimal application. The current process of integrating sectoral plans with an objective of preparation of District Plan for the financial year 2011-12 is based on brainstorming among intra-sectoral officials vis-à-vis inter-sectoral officials along with Zila Parishad representative for better understanding on the convergent issues. The initiative is innovative in terms that the basis of planning is civic entitlements. The process also categorically devises in such manner so that provisioning is made for the vulnerable and disadvantaged community viz. women, SC, ST through special component plans. The integrated district plan is reviewed and endorsed by the District Planning Committee and submitted to the State Planning Board for needful action.
DISTRICT CONSULTATION WORKSHOP:
To understand the key issues of the district, constraints associated in the way of greater output realization and to capture the plan requirements, a consultative meeting was organized at district level involving government officials from different departments, UN representatives, academicians and people’s representatives, PRI members etc. A brief presentation was made before the members on the context of the district planning, key information requirements for planning and overall strategy to be adopted in the process. Members discussed on the present district situation from different development context.
Page 9 of 89
Various issues of the district were discussed and presented by members during the open house session. Their suggestions were taken in to consideration and incorporated in the overall design for preparing the district plan.
TOOLS AND TECHNIQUES:
Consultative workshop for the preparation of integrated plan was conducted. Brainstorming and negotiation among the line departments on the issues of convergence and integration was discussed. Sectoral departments converged for discussing various dimensions of the sectoral strength, weakness, opportunity and threat in the process to strategize their future course of action. Sectoral plans prepared by the line departments are collected and collated for making an integrated comprehensive plan of the district. Data collected on the specified formats approved by the Department of Planning and Development, GoB, Patna.
COLLECTION OF BASIC DATA FOR PLANNING:
Sectoral plans prepared by the line departments are collected and collated for making an integrated comprehensive plan of the district. Secondly, as per district scenario expected/calculated beneficiaries for social security measures are also provisioned on the basis of entitlements under various schemes. Sectoral SWOT was also compiled for better understanding of the district through sectoral perspectives.
DATA ANALYSIS AND PLAN PREPARATION:
The district sector resource planning is the basic thrust of the entire planning process, however, other resources pooled through various schemes is also earmarked. The collected information is judged based on the need assessment and gap analysis through the perspective of civic entitlement. Additional requirements of resource allocations are proposed to State Planning Board for further provisioning.
OUTCOME OF THE PLAN PREPARATION:
1. District plan encompassing all the sectors / sub‐sectors along with its resource allocation is submitted for discussion and approval in the DPC.
2. District sector plans for 2011‐12 is prepared and submitted to the District Planning Office for discussion and approval in the DPC.
3. Schedule Caste Sub Plan for the year 2011 – 12 4. Tribal Sub Plan for the year 2011 – 12 5. Women component in the annual district plan 2011 – 12
Page 10 of 89
HISTORICAL PERSPECTIVE:
Founded in the 5th century A.D. Nalanda is known as the ancient seat of learning. World's most ancient University lies in ruins which is 62 kms. from Bodhgaya and 90 kms south of Patna. Emperor Ashoka built many monasteries, temples and Viharas here. Though the Buddha visited Nalanda several times during his lifetime, this famous centre of Buddhist learning shot to fame much later, during 5th-12th centuries. Hiuen Tsang stayed here in 7th century and has left detailed description of the excellence of education and purity of monastic life practiced here. In this first residential international university of the world, 2,000 teachers and 10,000 students from all over the Buddhist world lived and studied here. The Gupta kings patronized these monasteries, built in old Kushan architectural style, in a row of cells around a courtyard.
DISTRICT PROFILE: Nalanda (also called Bihar Sharif) district is one of the districts of Bihar, and Bihar Sharif town is the administrative headquarters of this district. Nalanda was a part of Patna Division. The subdivision of Biharsharif in the old Patna district was upgraded to an independent district on November 9, 1972 and named Nalanda, after the famous university (the world’s oldest) located here. Nalanda is 67 meters above sea level. It is referred to frequently in Jain and Buddhist scriptures. As the centre of the great Magadha Empire, Nalanda has had a rich and glorious history extending over 2,500 years. Till its destruction by Mohammed Bin Bakhtiyar Khilji, army chief of Kutubuddin Ibak, in 1205 AD, Nalanda was the leading centre of learning in India.
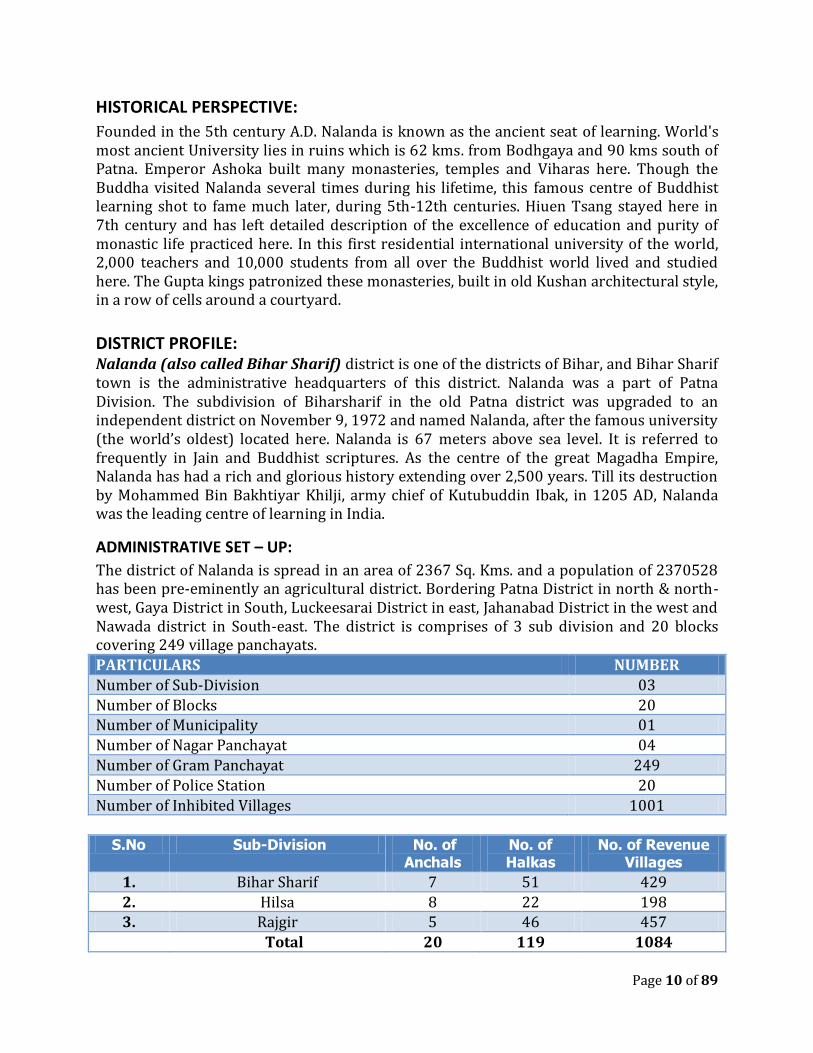
ADMINISTRATIVE SET – UP:
The district of Nalanda is spread in an area of 2367 Sq. Kms. and a population of 2370528 has been pre-eminently an agricultural district. Bordering Patna District in north & north-west, Gaya District in South, Luckeesarai District in east, Jahanabad District in the west and Nawada district in South-east. The district is comprises of 3 sub division and 20 blocks covering 249 village panchayats.
PARTICULARS NUMBER
Number of Sub-Division 03
Number of Blocks 20 Number of Municipality 01
Number of Nagar Panchayat 04
Number of Gram Panchayat 249
Number of Police Station 20
Number of Inhibited Villages 1001
S.No Sub-Division No. of Anchals
No. of Halkas
No. of Revenue Villages
1. Bihar Sharif 7 51 429
2. Hilsa 8 22 198 3. Rajgir 5 46 457
Total 20 119 1084
Page 11 of 89
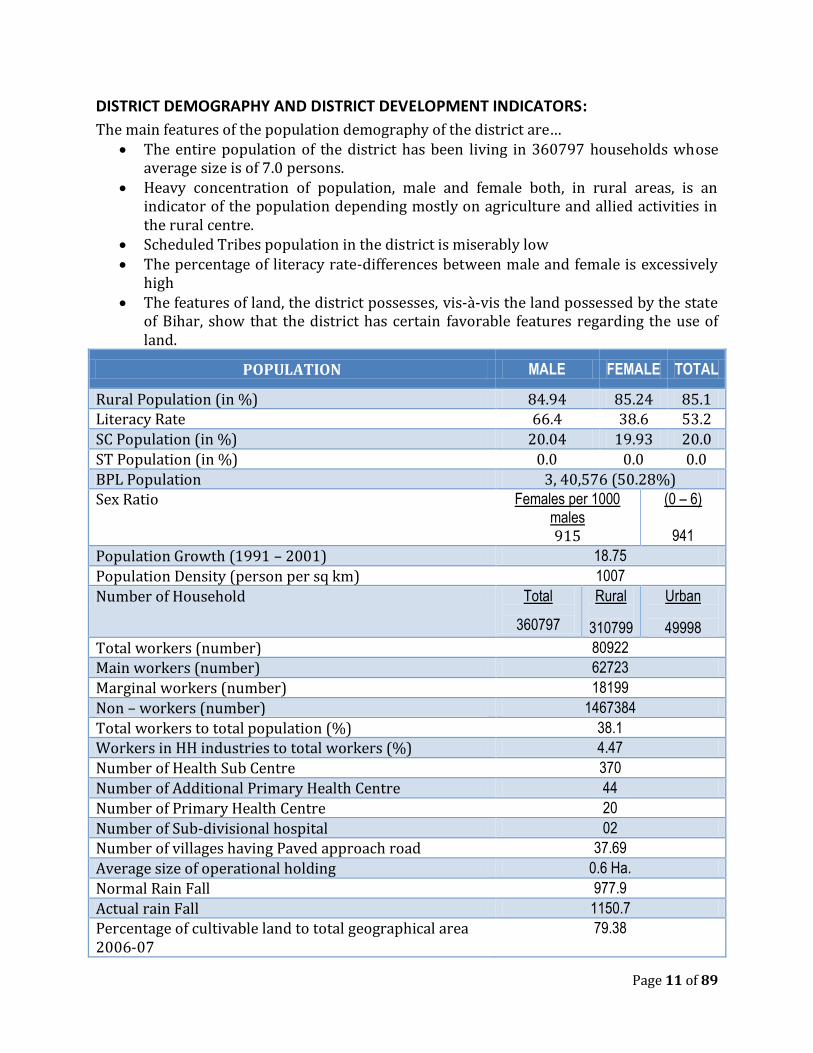
DISTRICT DEMOGRAPHY AND DISTRICT DEVELOPMENT INDICATORS:
The main features of the population demography of the district are… The entire population of the district has been living in 360797 households whose
average size is of 7.0 persons. Heavy concentration of population, male and female both, in rural areas, is an
indicator of the population depending mostly on agriculture and allied activities in the rural centre.
Scheduled Tribes population in the district is miserably low The percentage of literacy rate-differences between male and female is excessively
high The features of land, the district possesses, vis-à-vis the land possessed by the state
of Bihar, show that the district has certain favorable features regarding the use of land.
POPULATION MALE FEMALE TOTAL
Rural Population (in %) 84.94 85.24 85.1 Literacy Rate 66.4 38.6 53.2
SC Population (in %) 20.04 19.93 20.0
ST Population (in %) 0.0 0.0 0.0
BPL Population 3, 40,576 (50.28%) Sex Ratio Females per 1000
males 915
(0 – 6)
941
Population Growth (1991 – 2001) 18.75
Population Density (person per sq km) 1007
Number of Household Total
360797
Rural
310799
Urban
49998
Total workers (number) 80922
Main workers (number) 62723
Marginal workers (number) 18199
Non – workers (number) 1467384
Total workers to total population (%) 38.1
Workers in HH industries to total workers (%) 4.47
Number of Health Sub Centre 370
Number of Additional Primary Health Centre 44
Number of Primary Health Centre 20
Number of Sub-divisional hospital 02
Number of villages having Paved approach road 37.69
Average size of operational holding 0.6 Ha.
Normal Rain Fall 977.9
Actual rain Fall 1150.7
Percentage of cultivable land to total geographical area 2006-07
79.38
Page 12 of 89
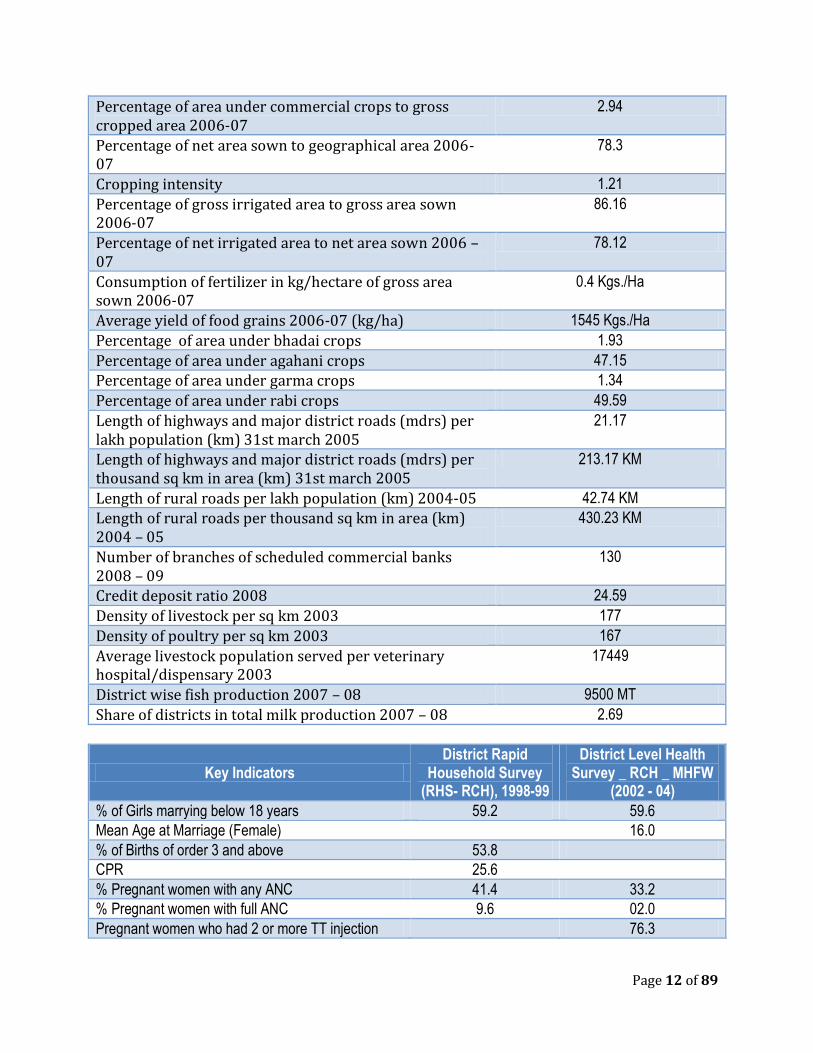
Percentage of area under commercial crops to gross cropped area 2006-07
2.94
Percentage of net area sown to geographical area 2006-07
78.3
Cropping intensity 1.21
Percentage of gross irrigated area to gross area sown 2006-07
86.16
Percentage of net irrigated area to net area sown 2006 – 07
78.12
Consumption of fertilizer in kg/hectare of gross area sown 2006-07
0.4 Kgs./Ha
Average yield of food grains 2006-07 (kg/ha) 1545 Kgs./Ha
Percentage of area under bhadai crops 1.93
Percentage of area under agahani crops 47.15
Percentage of area under garma crops 1.34
Percentage of area under rabi crops 49.59
Length of highways and major district roads (mdrs) per lakh population (km) 31st march 2005
21.17
Length of highways and major district roads (mdrs) per thousand sq km in area (km) 31st march 2005
213.17 KM
Length of rural roads per lakh population (km) 2004-05 42.74 KM
Length of rural roads per thousand sq km in area (km) 2004 – 05
430.23 KM
Number of branches of scheduled commercial banks 2008 – 09
130
Credit deposit ratio 2008 24.59
Density of livestock per sq km 2003 177
Density of poultry per sq km 2003 167
Average livestock population served per veterinary hospital/dispensary 2003
17449
District wise fish production 2007 – 08 9500 MT
Share of districts in total milk production 2007 – 08 2.69
Key Indicators District Rapid
Household Survey (RHS- RCH), 1998-99
District Level Health Survey _ RCH _ MHFW
(2002 - 04)
% of Girls marrying below 18 years 59.2 59.6
Mean Age at Marriage (Female) 16.0
% of Births of order 3 and above 53.8
CPR 25.6
% Pregnant women with any ANC 41.4 33.2
% Pregnant women with full ANC 9.6 02.0
Pregnant women who had 2 or more TT injection 76.3
Page 13 of 89
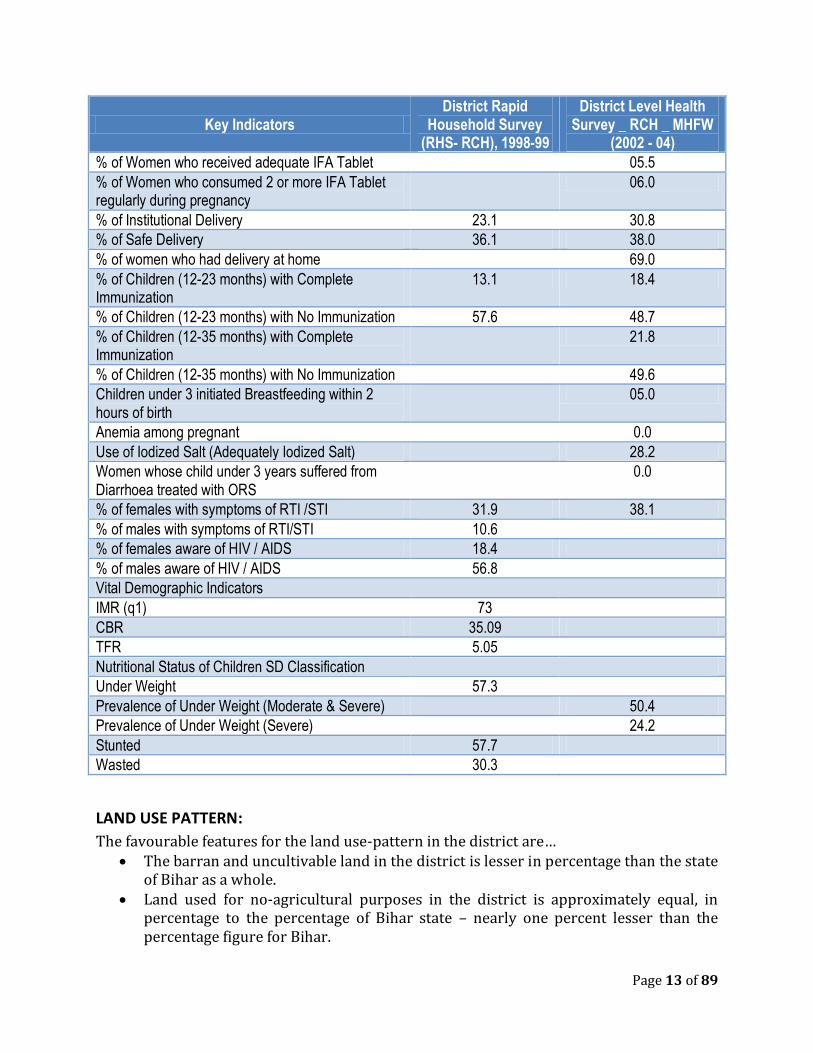
Key Indicators District Rapid
Household Survey (RHS- RCH), 1998-99
District Level Health Survey _ RCH _ MHFW
(2002 - 04)
% of Women who received adequate IFA Tablet 05.5
% of Women who consumed 2 or more IFA Tablet regularly during pregnancy
06.0
% of Institutional Delivery 23.1 30.8
% of Safe Delivery 36.1 38.0
% of women who had delivery at home 69.0
% of Children (12-23 months) with Complete Immunization
13.1 18.4
% of Children (12-23 months) with No Immunization 57.6 48.7
% of Children (12-35 months) with Complete Immunization
21.8
% of Children (12-35 months) with No Immunization 49.6
Children under 3 initiated Breastfeeding within 2 hours of birth
05.0
Anemia among pregnant 0.0
Use of Iodized Salt (Adequately Iodized Salt) 28.2
Women whose child under 3 years suffered from Diarrhoea treated with ORS
0.0
% of females with symptoms of RTI /STI 31.9 38.1
% of males with symptoms of RTI/STI 10.6
% of females aware of HIV / AIDS 18.4
% of males aware of HIV / AIDS 56.8
Vital Demographic Indicators
IMR (q1) 73
CBR 35.09
TFR 5.05
Nutritional Status of Children SD Classification
Under Weight 57.3
Prevalence of Under Weight (Moderate & Severe) 50.4
Prevalence of Under Weight (Severe) 24.2
Stunted 57.7
Wasted 30.3
LAND USE PATTERN:
The favourable features for the land use-pattern in the district are… The barran and uncultivable land in the district is lesser in percentage than the state
of Bihar as a whole. Land used for no-agricultural purposes in the district is approximately equal, in
percentage to the percentage of Bihar state – nearly one percent lesser than the percentage figure for Bihar.
Page 14 of 89
Cultivable wasteland in the district is lesser in percentage than the percentage figure for Bihar State.
The percentage of current follow land in the district is lesser than the same figure for the state of Bihar, and so is with the other follow land.
The total uncultivable land in the district is in lesser percentage than the percentage figure for the state of Bihar.
The percentage figures for net sown area, cropped area and the area sown more than once of district are higher than the percentage figure in this head for the state of Bihar.
But there are certain disquieting features also, which can be mentioned as… The percentage of permanent water area in the district is lower that the same figure
for the state of Bihar. The percentage figure for temporary water area in the district is higher than the
same figure for the state of Bihar. The availability of forest area in the district is lesser than the average percentage
figure for the state of Bihar.
All these aforesaid demographic features of the district of Nalanda are indicators of the fact that there is paucity of cultivable barren land, forest and water land in the district, consequently the development of the agricultural sector of the district depends mostly on the modernization of the agricultural, by the application of modern technique instead of the enlargement of the net sown area. Secondly its Rabbi cultivation requires wide ranged irrigation net work because the temporary water land cannot provide adequate irrigational facilities to Rabbi Cultivation. The need for irrigational net work required by the district agriculture can be substantiated by the rain fall.
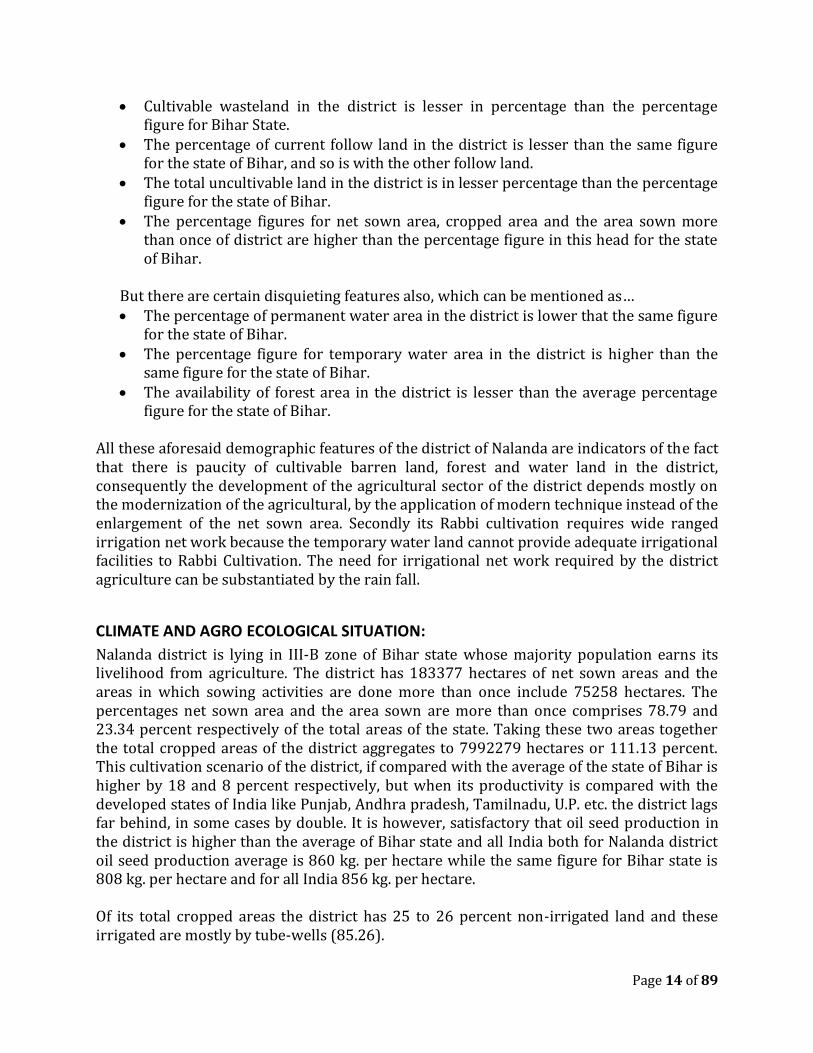
CLIMATE AND AGRO ECOLOGICAL SITUATION:
Nalanda district is lying in III-B zone of Bihar state whose majority population earns its livelihood from agriculture. The district has 183377 hectares of net sown areas and the areas in which sowing activities are done more than once include 75258 hectares. The percentages net sown area and the area sown are more than once comprises 78.79 and 23.34 percent respectively of the total areas of the state. Taking these two areas together the total cropped areas of the district aggregates to 7992279 hectares or 111.13 percent. This cultivation scenario of the district, if compared with the average of the state of Bihar is higher by 18 and 8 percent respectively, but when its productivity is compared with the developed states of India like Punjab, Andhra pradesh, Tamilnadu, U.P. etc. the district lags far behind, in some cases by double. It is however, satisfactory that oil seed production in the district is higher than the average of Bihar state and all India both for Nalanda district oil seed production average is 860 kg. per hectare while the same figure for Bihar state is 808 kg. per hectare and for all India 856 kg. per hectare. Of its total cropped areas the district has 25 to 26 percent non-irrigated land and these irrigated are mostly by tube-wells (85.26).
Page 15 of 89
The odd part of the district agriculture is its slow rate of seed replacement ratio, which has been calculated merely being 10 percent, whereas it has been calculated that this figure should have been at least 33 percent. In general perusal the agricultural scenario of the district cannot be said to have been fully satisfactory, rather it requires improvement to comply with the productivity ratio of developed states agriculture. To bring the district agriculture to have higher rate of productivity improved variety of paddy requires to be adopted by the peasants for their upper land. There is need for soil testing, which can enable the cultivators to have greater yields by less use of fertilizers. To develop agricultural farms, administrative device there are need to assure the actual cultivators that the benefits earned by the development of agriculture will positively go to them, and in technical devices, mechanization and plant protection are the two major areas which require special cares. Besides all these constraints there are several others whose removal is a sign-qua-non to give the agriculture in Nalanda district an impetus to achieve higher goals in production.
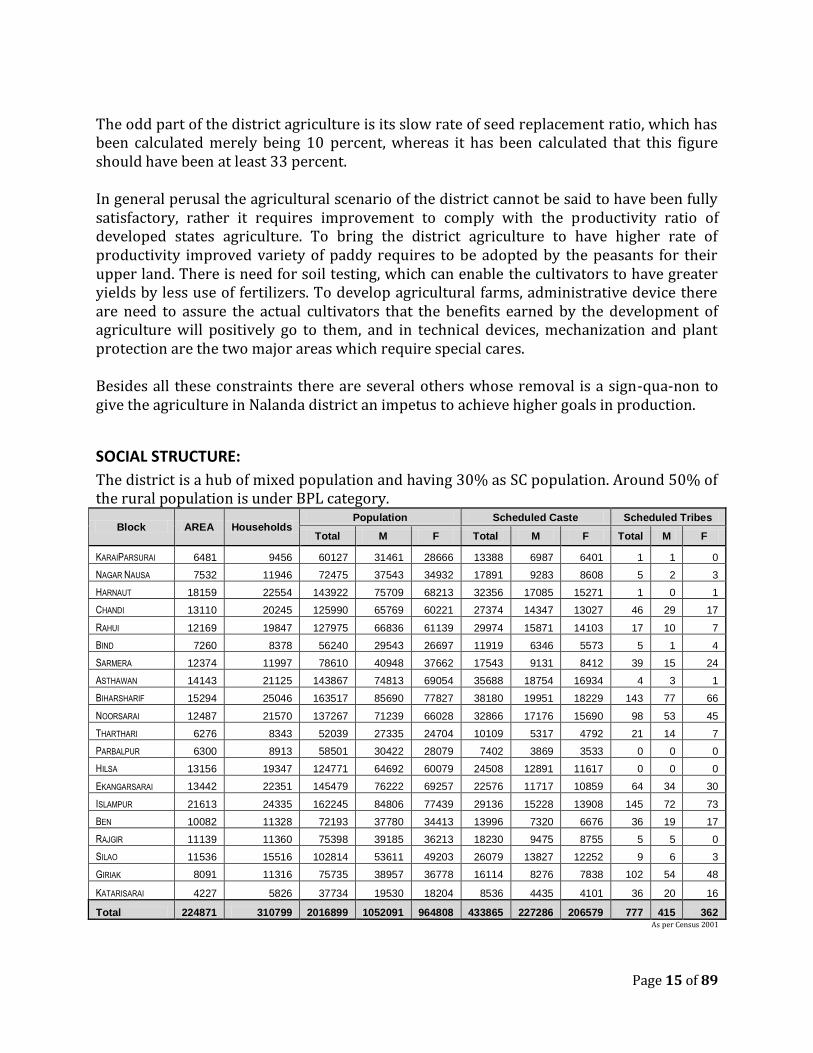
SOCIAL STRUCTURE:
The district is a hub of mixed population and having 30% as SC population. Around 50% of the rural population is under BPL category.
Block AREA Households Population Scheduled Caste Scheduled Tribes
Total M F Total M F Total M F
KARAIPARSURAI 6481 9456 60127 31461 28666 13388 6987 6401 1 1 0
NAGAR NAUSA 7532 11946 72475 37543 34932 17891 9283 8608 5 2 3
HARNAUT 18159 22554 143922 75709 68213 32356 17085 15271 1 0 1
CHANDI 13110 20245 125990 65769 60221 27374 14347 13027 46 29 17
RAHUI 12169 19847 127975 66836 61139 29974 15871 14103 17 10 7
BIND 7260 8378 56240 29543 26697 11919 6346 5573 5 1 4
SARMERA 12374 11997 78610 40948 37662 17543 9131 8412 39 15 24
ASTHAWAN 14143 21125 143867 74813 69054 35688 18754 16934 4 3 1
BIHARSHARIF 15294 25046 163517 85690 77827 38180 19951 18229 143 77 66
NOORSARAI 12487 21570 137267 71239 66028 32866 17176 15690 98 53 45
THARTHARI 6276 8343 52039 27335 24704 10109 5317 4792 21 14 7
PARBALPUR 6300 8913 58501 30422 28079 7402 3869 3533 0 0 0
HILSA 13156 19347 124771 64692 60079 24508 12891 11617 0 0 0
EKANGARSARAI 13442 22351 145479 76222 69257 22576 11717 10859 64 34 30
ISLAMPUR 21613 24335 162245 84806 77439 29136 15228 13908 145 72 73
BEN 10082 11328 72193 37780 34413 13996 7320 6676 36 19 17
RAJGIR 11139 11360 75398 39185 36213 18230 9475 8755 5 5 0
SILAO 11536 15516 102814 53611 49203 26079 13827 12252 9 6 3
GIRIAK 8091 11316 75735 38957 36778 16114 8276 7838 102 54 48
KATARISARAI 4227 5826 37734 19530 18204 8536 4435 4101 36 20 16
Total 224871 310799 2016899 1052091 964808 433865 227286 206579 777 415 362 As per Census 2001
Page 16 of 89
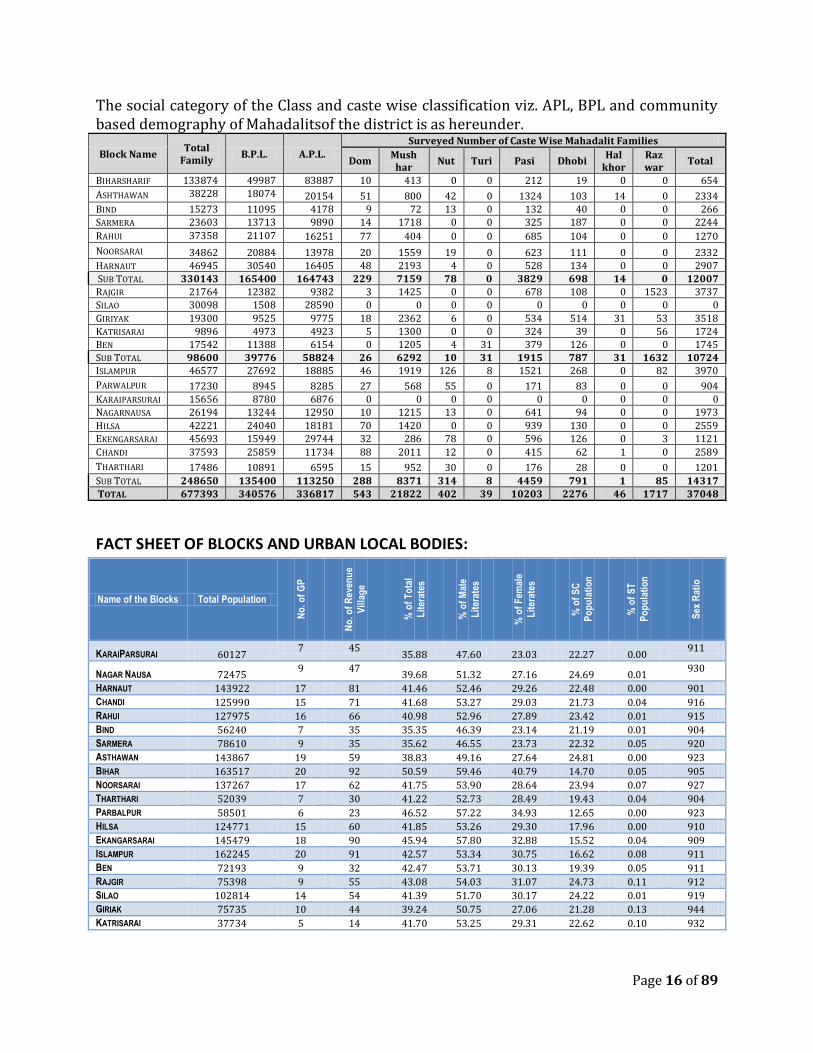
The social category of the Class and caste wise classification viz. APL, BPL and community based demography of Mahadalitsof the district is as hereunder.
Block Name Total
Family B.P.L. A.P.L.
Surveyed Number of Caste Wise Mahadalit Families
Dom Mush
har Nut Turi Pasi Dhobi
Hal khor
Raz war
Total
BIHARSHARIF 133874 49987 83887 10 413 0 0 212 19 0 0 654
ASHTHAWAN 38228 18074 20154 51 800 42 0 1324 103 14 0 2334 BIND 15273 11095 4178 9 72 13 0 132 40 0 0 266 SARMERA 23603 13713 9890 14 1718 0 0 325 187 0 0 2244
RAHUI 37358 21107 16251 77 404 0 0 685 104 0 0 1270
NOORSARAI 34862 20884 13978 20 1559 19 0 623 111 0 0 2332 HARNAUT 46945 30540 16405 48 2193 4 0 528 134 0 0 2907 SUB TOTAL 330143 165400 164743 229 7159 78 0 3829 698 14 0 12007 RAJGIR 21764 12382 9382 3 1425 0 0 678 108 0 1523 3737 SILAO 30098 1508 28590 0 0 0 0 0 0 0 0 0
GIRIYAK 19300 9525 9775 18 2362 6 0 534 514 31 53 3518 KATRISARAI 9896 4973 4923 5 1300 0 0 324 39 0 56 1724 BEN 17542 11388 6154 0 1205 4 31 379 126 0 0 1745 SUB TOTAL 98600 39776 58824 26 6292 10 31 1915 787 31 1632 10724 ISLAMPUR 46577 27692 18885 46 1919 126 8 1521 268 0 82 3970
PARWALPUR 17230 8945 8285 27 568 55 0 171 83 0 0 904 KARAIPARSURAI 15656 8780 6876 0 0 0 0 0 0 0 0 0 NAGARNAUSA 26194 13244 12950 10 1215 13 0 641 94 0 0 1973
HILSA 42221 24040 18181 70 1420 0 0 939 130 0 0 2559 EKENGARSARAI 45693 15949 29744 32 286 78 0 596 126 0 3 1121
CHANDI 37593 25859 11734 88 2011 12 0 415 62 1 0 2589
THARTHARI 17486 10891 6595 15 952 30 0 176 28 0 0 1201
SUB TOTAL 248650 135400 113250 288 8371 314 8 4459 791 1 85 14317 TOTAL 677393 340576 336817 543 21822 402 39 10203 2276 46 1717 37048
FACT SHEET OF BLOCKS AND URBAN LOCAL BODIES:
Name of the Blocks Total Population
No
. of
GP
No
. of
Rev
enu
e
Vil
lag
e
% o
f T
ota
l
Lit
erat
es
% o
f M
ale
Lit
erat
es
% o
f F
emal
e
Lit
erat
es
% o
f S
C
Po
pu
lati
on
% o
f S
T
Po
pu
lati
on
Sex
Rat
io
KARAIPARSURAI 60127 7 45
35.88 47.60 23.03 22.27 0.00 911
NAGAR NAUSA 72475 9 47
39.68 51.32 27.16 24.69 0.01 930
HARNAUT 143922 17 81 41.46 52.46 29.26 22.48 0.00 901
CHANDI 125990 15 71 41.68 53.27 29.03 21.73 0.04 916
RAHUI 127975 16 66 40.98 52.96 27.89 23.42 0.01 915
BIND 56240 7 35 35.35 46.39 23.14 21.19 0.01 904
SARMERA 78610 9 35 35.62 46.55 23.73 22.32 0.05 920
ASTHAWAN 143867 19 59 38.83 49.16 27.64 24.81 0.00 923
BIHAR 163517 20 92 50.59 59.46 40.79 14.70 0.05 905
NOORSARAI 137267 17 62 41.75 53.90 28.64 23.94 0.07 927
THARTHARI 52039 7 30 41.22 52.73 28.49 19.43 0.04 904
PARBALPUR 58501 6 23 46.52 57.22 34.93 12.65 0.00 923
HILSA 124771 15 60 41.85 53.26 29.30 17.96 0.00 910
EKANGARSARAI 145479 18 90 45.94 57.80 32.88 15.52 0.04 909
ISLAMPUR 162245 20 91 42.57 53.34 30.75 16.62 0.08 911
BEN 72193 9 32 42.47 53.71 30.13 19.39 0.05 911
RAJGIR 75398 9 55 43.08 54.03 31.07 24.73 0.11 912
SILAO 102814 14 54 41.39 51.70 30.17 24.22 0.01 919
GIRIAK 75735 10 44 39.24 50.75 27.06 21.28 0.13 944
KATRISARAI 37734 5 14 41.70 53.25 29.31 22.62 0.10 932
Page 17 of 89
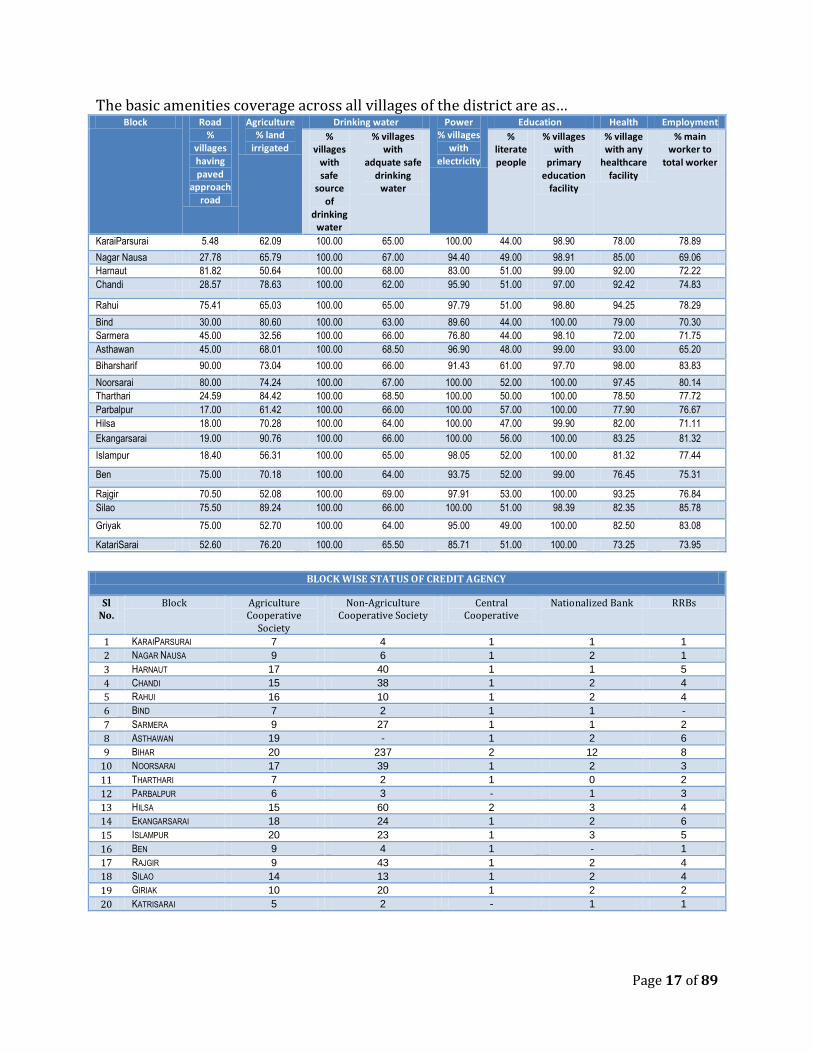
The basic amenities coverage across all villages of the district are as… Block Road
% villages having paved
approach road
Agriculture % land
irrigated
Drinking water Power % villages
with electricity
Education Health Employment
% villages
with safe
source of
drinking water
% villages with
adquate safe drinking
water
% literate people
% villages with
primary education
facility
% village with any
healthcare facility
% main worker to
total worker
KaraiParsurai 5.48 62.09 100.00 65.00 100.00 44.00 98.90 78.00 78.89
Nagar Nausa 27.78 65.79 100.00 67.00 94.40 49.00 98.91 85.00 69.06
Harnaut 81.82 50.64 100.00 68.00 83.00 51.00 99.00 92.00 72.22
Chandi 28.57 78.63 100.00 62.00 95.90 51.00 97.00 92.42 74.83
Rahui 75.41 65.03 100.00 65.00 97.79 51.00 98.80 94.25 78.29
Bind 30.00 80.60 100.00 63.00 89.60 44.00 100.00 79.00 70.30
Sarmera 45.00 32.56 100.00 66.00 76.80 44.00 98.10 72.00 71.75
Asthawan 45.00 68.01 100.00 68.50 96.90 48.00 99.00 93.00 65.20
Biharsharif 90.00 73.04 100.00 66.00 91.43 61.00 97.70 98.00 83.83
Noorsarai 80.00 74.24 100.00 67.00 100.00 52.00 100.00 97.45 80.14
Tharthari 24.59 84.42 100.00 68.50 100.00 50.00 100.00 78.50 77.72
Parbalpur 17.00 61.42 100.00 66.00 100.00 57.00 100.00 77.90 76.67
Hilsa 18.00 70.28 100.00 64.00 100.00 47.00 99.90 82.00 71.11
Ekangarsarai 19.00 90.76 100.00 66.00 100.00 56.00 100.00 83.25 81.32
Islampur 18.40 56.31 100.00 65.00 98.05 52.00 100.00 81.32 77.44
Ben 75.00 70.18 100.00 64.00 93.75 52.00 99.00 76.45 75.31
Rajgir 70.50 52.08 100.00 69.00 97.91 53.00 100.00 93.25 76.84
Silao 75.50 89.24 100.00 66.00 100.00 51.00 98.39 82.35 85.78
Griyak 75.00 52.70 100.00 64.00 95.00 49.00 100.00 82.50 83.08
KatariSarai 52.60 76.20 100.00 65.50 85.71 51.00 100.00 73.25 73.95
BLOCK WISE STATUS OF CREDIT AGENCY
Sl No.
Block Agriculture Cooperative
Society
Non-Agriculture Cooperative Society
Central Cooperative
Nationalized Bank RRBs
1 KARAIPARSURAI 7 4 1 1 1
2 NAGAR NAUSA 9 6 1 2 1
3 HARNAUT 17 40 1 1 5
4 CHANDI 15 38 1 2 4
5 RAHUI 16 10 1 2 4
6 BIND 7 2 1 1 -
7 SARMERA 9 27 1 1 2
8 ASTHAWAN 19 - 1 2 6
9 BIHAR 20 237 2 12 8
10 NOORSARAI 17 39 1 2 3
11 THARTHARI 7 2 1 0 2
12 PARBALPUR 6 3 - 1 3
13 HILSA 15 60 2 3 4
14 EKANGARSARAI 18 24 1 2 6
15 ISLAMPUR 20 23 1 3 5
16 BEN 9 4 1 - 1
17 RAJGIR 9 43 1 2 4
18 SILAO 14 13 1 2 4
19 GIRIAK 10 20 1 2 2
20 KATRISARAI 5 2 - 1 1
Page 18 of 89
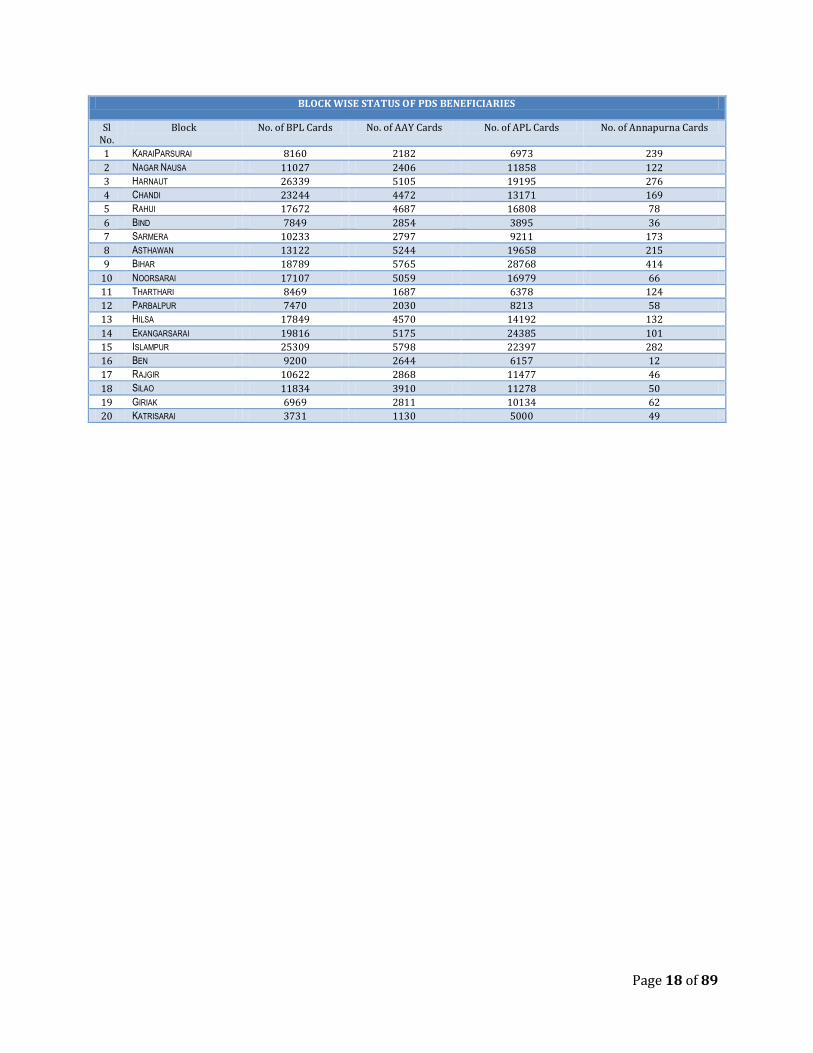
BLOCK WISE STATUS OF PDS BENEFICIARIES
Sl No.
Block No. of BPL Cards No. of AAY Cards No. of APL Cards No. of Annapurna Cards
1 KARAIPARSURAI 8160 2182 6973 239
2 NAGAR NAUSA 11027 2406 11858 122
3 HARNAUT 26339 5105 19195 276
4 CHANDI 23244 4472 13171 169
5 RAHUI 17672 4687 16808 78
6 BIND 7849 2854 3895 36
7 SARMERA 10233 2797 9211 173
8 ASTHAWAN 13122 5244 19658 215
9 BIHAR 18789 5765 28768 414
10 NOORSARAI 17107 5059 16979 66
11 THARTHARI 8469 1687 6378 124
12 PARBALPUR 7470 2030 8213 58
13 HILSA 17849 4570 14192 132
14 EKANGARSARAI 19816 5175 24385 101
15 ISLAMPUR 25309 5798 22397 282
16 BEN 9200 2644 6157 12
17 RAJGIR 10622 2868 11477 46
18 SILAO 11834 3910 11278 50
19 GIRIAK 6969 2811 10134 62
20 KATRISARAI 3731 1130 5000 49
Page 19 of 89
CHAPTER II SWOT ANALYSIS OF THE DISTRICT AND INDIVIDUAL SECTORS
SWOT ANALYSIS OF THE DISTRICT:
To identify the strength, weakness, opportunities and threats of districts a workshop was organized during the plan preparation process and suggestions were taken from different stakeholders from different sectors. The strategic planning workshops highlight the followings as SWOT in different sectors / sub‐sectors.
The brief introduction of Nalanda district, given above, is testimony to the fact that the district possesses certain features which are much conducive for its economic uplift if the congenial steps are initiated to exploit the available resources the district has. The district is sited in neighbor to state headquarters Patna and lying on the National highway connecting Bihar and Jharkhand state headquarters. The district is having cooperatively good infrastructure. First and foremost the district presents a unique vision among the various communities, particularly between the Hindus and the Muslims, who live in the district together without much communal biases in spite that communal forces have been trying to flare up communal frenzies in the district. Biharsharif, Rajgir, Nalanda etc. bear examples that Hindus and Muslims have equal devotions to each one's religious centers and places. One can see Hindus going to the tomb of Makhdum Shah Sharif-ud-din for worship and so is with the Muslims people who visit the Buddh and Jain pilgrimages. In fact for the local communities all these historical places have their importance more as heritages of India's history than religious matters. This is an amicable sign for peaceful and harmonious social required for economic activities. Secondly, even though that the district has no mineral deposits required for bigger industrial ventures, yet the organization of agro-based industrial activities and their available people in the district cannot be denied. Because the land in the district is alluvial and what requires giving it an upward boost is to modernize the agriculture by extending financial and other supports to the peasants. For modernizations of the district agriculture there is required capital which the peasantry doing subsistent agriculture does not have. Besides, it there is severe paucity of infrastructural facilities which affect peasants multi dimensionally, neither allowing the peasantry to add substantially to the income of the district nor being benefited by the schemes and programs launched for eradication of poverty and amelioration of agricultural constraints. Effective planning at grass root level and involvement of peasants in planning procedure can have been an effective method to give the agriculture of the district chances to be transformed into a higher stage of production. This mission can be achieved through introducing changes in production procedures in favour of the peasants and agricultural workers.
STRENGTH

Page 20 of 89
The ancient historical relies that have come out through excavation have provided to the district enough opportunities to organize them as tourist centers by the application of modern developed technology in arrangement of the material available at those centers. To avail its historical position to attract tourists, various initiatives have been taken so far. Additional ambitious project have been taken and further planned to develop the tourist sites of the district as preferred place to attract the tourists. The state and central governments through various schemes and programs are putting its efforts in realizing the dream. The forest wealth of the district which has assimilated in it many previous herbals has been left without care. A carefully managed forest can give employment and income both to the district. Rajgir block is the district forest area with scenic beauty which is rich greenery that control pollution. The district has favorable climatic condition for piggeries, poultries, goataries and animal husbandry, but no planning is there to organize all these sectors. Briefly speaking, for the diversified economic activities in the district there is a need for coordinated planning in which government, financial institutions, peasants and agricultural labour should be the main participants at all levels, right from the decision making to the final disposal of the produced good services. Under education sector, the district has reached the targets related to accessibility through various strategies like opening, reconstructing primary and upper primary schools and upgrading PS in UPS. The PTR has also been maintained. Besides, almost 100% enrolled children are covered with MDM program to retain children in schools and supplementing them with nutritious food. The drop-out rate has fall-down considerably. Special focus has been dawn for mental and physical health of children. Implementation of KGBV and NPEGEL coupled with SSA and MDM make remarkable impact on inclusion of socially and economically left-out community and further in mainstreaming their regular education. Under health sector, all major health centres are working on 24x7 services with diet to all in-patients and having uninterrupted water, sanitation and power supply. Connectivity to health facilities is very good and that are catering a large population residing in rural and urban areas. Rogi Kalyan Samities are constituted and functional in all health institutions up to block level. The status of district statistics has improved in due course of time as district statistics office and different line department offices are computerized and to some extent linked with internet facility. The initiatives under different flagships and E-governance and Bihar Prashashnik Sudhar Mission have added value in data management. District website has been updated and uploaded with quality documents like case studies, progress reports, circulars, civil amenities forms, news clippings etc. Digitization of land records are under progress and expected to be completed soon. Besides, 145 Vasudha Kendra are functional across all 20 development blocks.
Page 21 of 89
In a common assessment Nalanda district with its subsistence agriculture, weak industrial base and infrastructural facilities, lack of required technical and para-workers has been facing numerous constraints. However, initiatives have been taken to supplement through engaging human resources on contract services for fixed tenure. With its lesser productivity in all section, and comparatively backward appliances, used for production activities, acute paucity of institutional credit, infrastructural net work etc in agriculture and allied sector. Its economy can hardly compete with the produces coming to its local markets from developed industrial countries. Rampant poverty, unemployment, population burden on agriculture etc. combined together have synchronized its internal market which appears to day one of the biggest impediments for growth of the district. For irrigation the district has very limited source other than ground water, however the ground water source of water is considerably good.
Irregular and low quality power supply has negative bearing on village, cottage and other farm and non-farm SSIs. This has also affect the irrigation and other farm activities. Week infrastructure of power sub centers and transmission equipments like wire, transformers may cause havoc in some or many parts of the district. There is huge gap in supply and demand of power. The district has insufficient transformers for power transmission. Besides 33/11 K.M. power sub centers is very old and not equipped with requisite machines. Alternative source of energy i.e. non-conventional energy infrastructure is very poor.
Pertaining to education sector, the percentage differences between enrolled and non-enrolled girls and boys separately in the district are 6 percent for boys and 6 percent for girls. The percentage of drop out for boys and girls are besides the non-enrolled. The percentage of non-enrolled collective, boys and girls combined is of 12 percent and to cover this 12 percent non-enrolled collective there would be required 12 percent increases in number of schools and teachers at the existing ratio between student and teachers. To cover the children un-enrolled and to put ban on drop out there is required at least 12 to 15 percent increase in number of schools and teachers at the present ratio between the teachers and students. On the one hand there is increase in retention on the other dropout rate has also decreased significantly. The shade area of education sector is the engagement of teachers in other work and it adversely affect exact hour to student’s education. Teacher’s concentration and devotion also deteriorates. Quality supplementation of food shortage has also recurred when SFC failed to supply food grains.
In Statistics section of Nalanda Collectorate prima-facie looks devoid of supervisory and clerical staff which in turn impeded the its regular assignment like publicity , printing and publication of District Statistical Handbook which is the resource data book for any department. If assume the domain area of statistics section it require an independent
WEAKNESS
Page 22 of 89
infrastructure for running its full flexed office. Information Technology is the base for statistics and it must be supported and can be linked with IT & E-Governance.
In health sector, barring BCG, in majority of the vaccines the targets fixed have partially been achieved. The retention needs to be improved as drop out until complete immunization is high. Although, the district has achieved remarkable milestones but to assure the targets to be fulfilled in time, more staff and greater awareness among people are needed as unmet need is high. This can be made possible through deployment of medically trained persons who are unemployed and or being exploited by private clinics in the state. Supplementary motivation and supportive supervision needs to be rendered to frontline workers like ANM, AWW and ASHAs. As per IPHS norms there is shortage of doctors/paramedics. Lack of motivation among medical and paramedical staffs hospital is not attracting vast population who chooses private doctors clinics. Lack of physical infrastructure does not support medical and paramedics in order to get optimum patient load. There is no suggestion/complaint cell so sometimes it shows lack of transparency. SSI and Banking: The total contribution of SSI units to the district production is too meager to believe – only 2.40 percent. There is a much closer linkage between the SSI sector and banking sector, the latter being the main provider of finance to the former. But the credit-deposit ratio of banks in the district is highly poor – only 26 percent which is much below than the states like Punjab, Haryana, Andhra etc. Bank should be directed to raise their credit deposit ratio at least to the all India average rate of credit deposit ratio of banks. Whatever credit has been extended in the district the position of agriculture is second in respect of bank credit. Agriculture is a sector in the district which contributes highest in the district income and employs highest number of labour force; hence this position of agriculture in regard to bank credit should be placed at first position, In spite of all different odds the district faces today, there is no lack of opportunities to exploit them for giving an upward developmental boost to the district economy. To avail these opportunities for the transformation of the district economy into a developed one there is required appropriate exploitation of district's local resources for production purposes. The government of Bihar has floated numerous schemes and programs for development of agriculture, dairy, horticulture, poultry, piggery etc. Beside these scheme there are several other which have been initiated by the central government. In all these programs areas found to be appropriate for the execution of each program, districts have been located and Nalanda district has been included in majority of these scheme. Some of the important schemes floated by the state government are:
Seed production program aim at production of quality seeds in selected areas. State scheme for development of Tal and Diara area: Nalanda district has been
included among various district of the state in which this scheme has to be executed. Watershed management scheme under the state land production program: The
main objective of this scheme covers multi-dimensional areas right from crop development to environment protection.
OPPORTUNITY
Page 23 of 89
Establishment of laboratory for soil, seed and fertilizers test: But in Nalanda district facilities of soil, seed and fertilizer testing are extremely poor.
Re-strengthening of plant protection centers: Under this scheme certain modern equipments have to be given to each centre to assist the peasants.
Among the schemes and programs sponsored by the central government are Integrated cereal development scheme; Same kit Keet Prabandhan Program (I.P.M.); Mechanization of agriculture program; National watershed development scheme; Oil seeds, pulses and maize integrated scheme; Jute development program; ATMA; BAMETI; Seed village scheme etc.
However, the peasants in Nalanda district are by and large unaware of all these schemes and to that sequel are not benefited by them. Their acquaintances with these entire schemes and facilities can prove much helpful for them in raising their in raising their economic activities. Similarly to assist horticultural activities various programs have been launched, such as Vegetable seed production, schemes for horticulture plantation. In irrigation sector there are schemes like micro irrigation project, drip irrigation system, sprinkler irrigation system etc. under which various amounts have been sanctioned as subsidy to the peasants. Moreover, all these schemes for their execution demand finance, technical knowhow and that is what Nalanda district lacks.
There have been organized media supports through Krishi Darshan, Kesarivani. Kisan call centre etc. and institutional assistance have been provided through Rashtriya Krishi Vikas Yojana, Constitution of KisanYagoga, constitution of Udayan Mahavidyalaya, Nandan Bharty Krishi Mahavidyalaya etc. The above mentioned are the opportunities that can be exploited by the district to accelerate its production capabilities and come out of the constraints the district has been faced with.
If all these facilities are availed and exploited in a saner manner the productivity of the district till 1912-13 can be enhanced commendably, at least to that percentage which has been set and decided by the state government for Bihar as whole. Under the scheme of National Food Security Mission Central government has floated schemes to increase production of wheat, paddy and pulses in selected district of Bihar. Nalanda district is one of them.
In the district, the population aggregated to 2370,528 (2001 census) and the average annual growth rate of India is 2.11 percent. Within five years the total growth of population in the district, according to this matrix would be 10.55 percent. So, in 2012 the total population of the district would be increased to 2607580.80 or 237052 extra people's burden would fall upon the district for arrangement for arrangement for them of food stuffs and other necessary commodities. This target can easily be achieved through the repair of dead tube wells. Since 2007 onwards no new tubewells in the district has been installed either by government of by the NABARD, of all the 158 total government tube wells 74 are non-functioning (more than 50 percent are non-functioning). If all these non functioning tube wells are repaired, ponds and tanks are desilted, the none-electrified the
Page 24 of 89
food stuff, increase in the district would meet the requirement of extra food for the increased population of the district.
In dairy sector the numbers of indigenous cattle of all types are 158204 and breed cattle are only 10389 of breeded cattle are 6 percent of the total cattle wealth. The transformation of replacement of all indigenous milch animals into or by breeded cattle would increase milk production to an unimaginable extent higher than what the district has been producing now. With the increase milk production would automatically increase the number of persons engaged in dairy business, number of milk collection centers etc. But to make it an effective program there would be required more health care infrastructure, and unless government provides them the objective cannot be achieved.
In health sector various initiatives have been taking under the umbrella of NRHM like strengthening health facilities, institutional and outreach facilities, incentivize for health services. Still there are abundant areas to intervene. Hospital administration can do study related to satisfaction level of patients like availability of the space construction of new building. As per IPHS norms hospital can get ISO 9001 certification by the vertical and horizontal transfer of hospital staffs it services. Public-private partnership can be strengthened.
In forest area of Rajgir, there is a great scope of improving greenery in order to check pollution and develop as the tourist and picnic site. It has great role in maintaining ecological balance and environment. It provides an opportunity for initiatives such as soil and water conservation. The area can be develop as wild life protection and conservation.
Many a times, the district had faced natural calamities like droughts and flood. Fog is also
regular occurrence in winter season. Irregular and low quality power supply has negative
bearing on village, cottage and other farm and non-farm SSIs. This has also affect the
irrigation and other farm activities. Week infrastructure of power sub centers and
transmission equipments like wire, transformers may cause havoc in some or many parts
of the district. There is huge gap in supply and demand of power. Alternative source of
energy i.e. non-conventional energy infrastructure is very poor.
Likewise other district of Bihar, Nalanda is also facing acute problem of migration. The migration coupled with landlessness keep them away from the coverage of government initiatives in rural and urban areas. Although different schemes like MGNREGS, SGSY, Jeevika etc. are being implemented in the district but the migrants are not been kept in the coverage to full of its extent. Besides, the key threats are as hereunder.
Immense biotic pressure, urbanization, unplanned infrastructure development interfering with natural resource management.
Absentee farmers
THREATS
Page 25 of 89
Large scale migration of rural work force. No Judicious use of agricultural chemicals, polluting ground aquifers and surface
water resources. Destruction of natural water bodies due to various reasons. Non availability of labour force at peak agricultural season. Large-scale migration of rural work force. Indifference attitude of the farming community towards cultivation. Not encouraging C:D ratio in the district.
Page 26 of 89
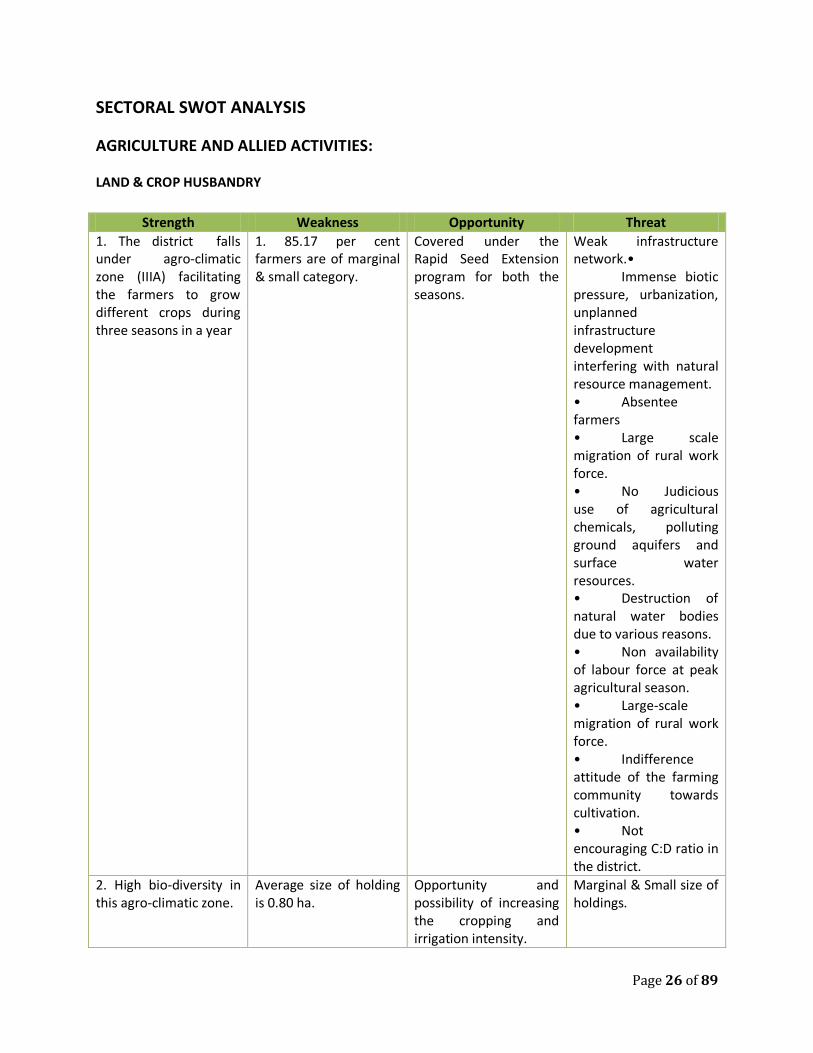
SECTORAL SWOT ANALYSIS
AGRICULTURE AND ALLIED ACTIVITIES:
LAND & CROP HUSBANDRY
Strength Weakness Opportunity Threat
1. The district falls under agro-climatic zone (IIIA) facilitating the farmers to grow different crops during three seasons in a year
1. 85.17 per cent farmers are of marginal & small category.
Covered under the Rapid Seed Extension program for both the seasons.
Weak infrastructure network.• Immense biotic pressure, urbanization, unplanned infrastructure development interfering with natural resource management. • Absentee farmers • Large scale migration of rural work force. • No Judicious use of agricultural chemicals, polluting ground aquifers and surface water resources. • Destruction of natural water bodies due to various reasons. • Non availability of labour force at peak agricultural season. • Large-scale migration of rural work force. • Indifference attitude of the farming community towards cultivation. • Not encouraging C:D ratio in the district.
2. High bio-diversity in this agro-climatic zone.
Average size of holding is 0.80 ha.
Opportunity and possibility of increasing the cropping and irrigation intensity.
Marginal & Small size of holdings.
Page 27 of 89
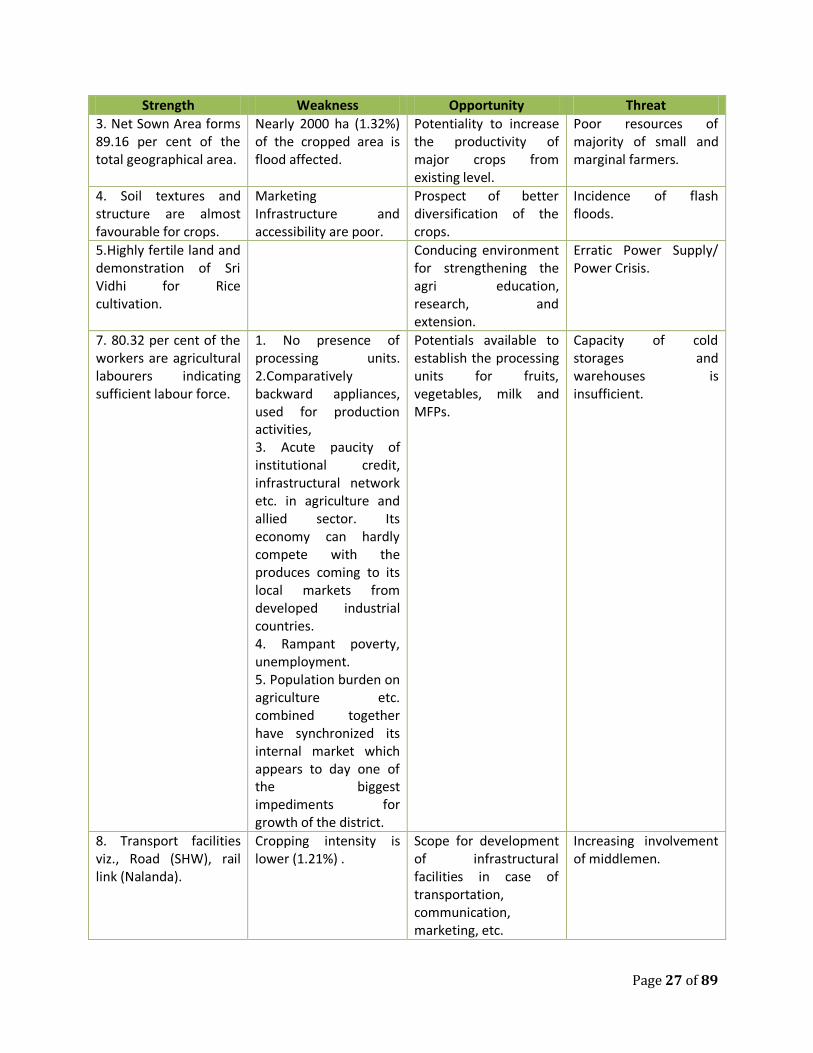
Strength Weakness Opportunity Threat
3. Net Sown Area forms 89.16 per cent of the total geographical area.
Nearly 2000 ha (1.32%) of the cropped area is flood affected.
Potentiality to increase the productivity of major crops from existing level.
Poor resources of majority of small and marginal farmers.
4. Soil textures and structure are almost favourable for crops.
Marketing Infrastructure and accessibility are poor.
Prospect of better diversification of the crops.
Incidence of flash floods.
5.Highly fertile land and demonstration of Sri Vidhi for Rice cultivation.
Conducing environment for strengthening the agri education, research, and extension.
Erratic Power Supply/ Power Crisis.
7. 80.32 per cent of the workers are agricultural labourers indicating sufficient labour force.
1. No presence of processing units. 2.Comparatively backward appliances, used for production activities, 3. Acute paucity of institutional credit, infrastructural network etc. in agriculture and allied sector. Its economy can hardly compete with the produces coming to its local markets from developed industrial countries. 4. Rampant poverty, unemployment. 5. Population burden on agriculture etc. combined together have synchronized its internal market which appears to day one of the biggest impediments for growth of the district.
Potentials available to establish the processing units for fruits, vegetables, milk and MFPs.
Capacity of cold storages and warehouses is insufficient.
8. Transport facilities viz., Road (SHW), rail link (Nalanda).
Cropping intensity is lower (1.21%) .
Scope for development of infrastructural facilities in case of transportation, communication, marketing, etc.
Increasing involvement of middlemen.

Page 28 of 89
Strength Weakness Opportunity Threat
9. Capability of cultivable land is up to 76.30 per cent
Adoption of mechanization in agriculture is poor.
Improvement in forward and backward linkages between production and disposal of crops.
Co-operative structures at the primary level are weak.
HORTICULTURE SECTOR
Strength Weakness Opportunity Threat
1. Variation in nature of soil, agro-climatic and abundant underground water. Conducive environment of potato and other vegetables.
Production of horticultural crops is lower than other districts.
Broad scope to boost the quality oriented production of vegetables, flowers, fruits etc., to provide genuine and high quality material to the growers.
Food security mission (FSM) may be hampered if change in cropping pattern in favour of horticultural crops takes place.
2. Considerable scope of marketing of vegetables, fruits, flowers and MFPs.
Non-availability of quality planting material and hybrid seed.
Rejuvenation of old orchards and scientific management of trees for good production of fruits.
Qualities and old varieties of horticultural crops may be replaced with the use hi-tech.
3. Off season horticultural crops have good potential.
Lack of financial support and technological bottleneck in potential areas.
Losses in the production of vegetables, fruits and flowers could be minimized by improving post-harvest management technology.
Dependency on the traditional system of medicines, largely plant based, will reduce in a time when the global demand of the same has risen.
4. Majority of the farmers have marginal & small size of holdings, which forces them to grow horticultural crops.
Lack of certification centre for processed fruits and vegetables.
Credit and subsidy facilities are given by the state which needs to be propagated.
5. Maximum growers of horticultural crops are attached with it since generation.
Inadequate infrastructural facilities to keep the produces in cold storages.
Export possibilities for mango and litchi are immense.
6. Maximum scope of diversion of agricultural crops to horticultural crops.
Inadequate infrastructural facilities to keep the produces in cold storages.
Export possibilities for mango and litchi are immense.
Page 29 of 89
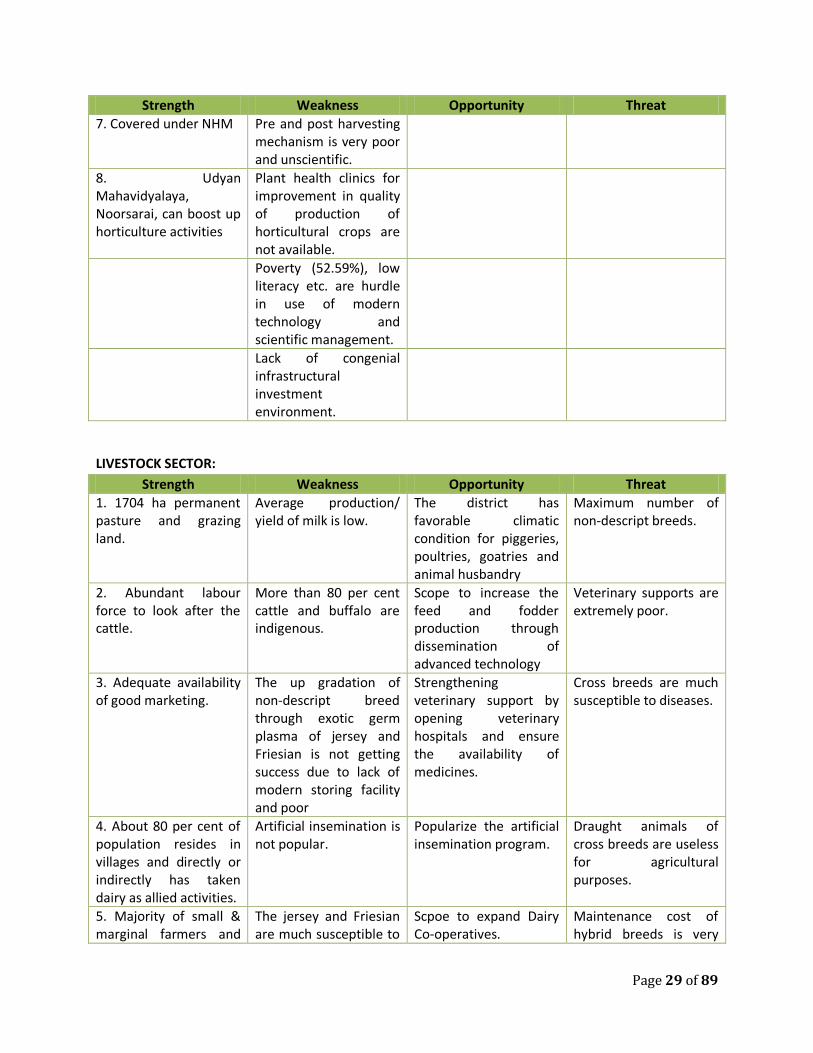
Strength Weakness Opportunity Threat
7. Covered under NHM Pre and post harvesting mechanism is very poor and unscientific.
8. Udyan Mahavidyalaya, Noorsarai, can boost up horticulture activities
Plant health clinics for improvement in quality of production of horticultural crops are not available.
Poverty (52.59%), low literacy etc. are hurdle in use of modern technology and scientific management.
Lack of congenial infrastructural investment environment.
LIVESTOCK SECTOR:
Strength Weakness Opportunity Threat
1. 1704 ha permanent pasture and grazing land.
Average production/ yield of milk is low.
The district has favorable climatic condition for piggeries, poultries, goatries and animal husbandry
Maximum number of non-descript breeds.
2. Abundant labour force to look after the cattle.
More than 80 per cent cattle and buffalo are indigenous.
Scope to increase the feed and fodder production through dissemination of advanced technology
Veterinary supports are extremely poor.
3. Adequate availability of good marketing.
The up gradation of non-descript breed through exotic germ plasma of jersey and Friesian is not getting success due to lack of modern storing facility and poor
Strengthening veterinary support by opening veterinary hospitals and ensure the availability of medicines.
Cross breeds are much susceptible to diseases.
4. About 80 per cent of population resides in villages and directly or indirectly has taken dairy as allied activities.
Artificial insemination is not popular.
Popularize the artificial insemination program.
Draught animals of cross breeds are useless for agricultural purposes.
5. Majority of small & marginal farmers and
The jersey and Friesian are much susceptible to
Scpoe to expand Dairy Co-operatives.
Maintenance cost of hybrid breeds is very
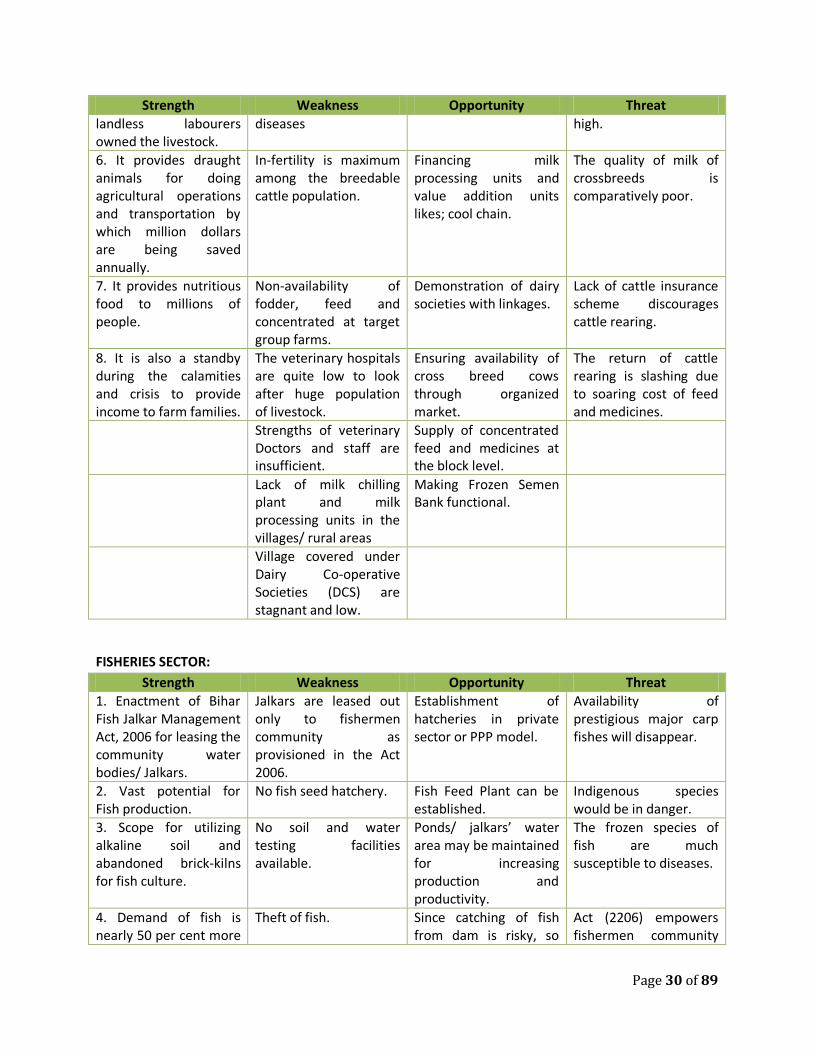
Page 30 of 89
Strength Weakness Opportunity Threat
landless labourers owned the livestock.
diseases high.
6. It provides draught animals for doing agricultural operations and transportation by which million dollars are being saved annually.
In-fertility is maximum among the breedable cattle population.
Financing milk processing units and value addition units likes; cool chain.
The quality of milk of crossbreeds is comparatively poor.
7. It provides nutritious food to millions of people.
Non-availability of fodder, feed and concentrated at target group farms.
Demonstration of dairy societies with linkages.
Lack of cattle insurance scheme discourages cattle rearing.
8. It is also a standby during the calamities and crisis to provide income to farm families.
The veterinary hospitals are quite low to look after huge population of livestock.
Ensuring availability of cross breed cows through organized market.
The return of cattle rearing is slashing due to soaring cost of feed and medicines.
Strengths of veterinary Doctors and staff are insufficient.
Supply of concentrated feed and medicines at the block level.
Lack of milk chilling plant and milk processing units in the villages/ rural areas
Making Frozen Semen Bank functional.
Village covered under Dairy Co-operative Societies (DCS) are stagnant and low.
FISHERIES SECTOR:
Strength Weakness Opportunity Threat
1. Enactment of Bihar Fish Jalkar Management Act, 2006 for leasing the community water bodies/ Jalkars.
Jalkars are leased out only to fishermen community as provisioned in the Act 2006.
Establishment of hatcheries in private sector or PPP model.
Availability of prestigious major carp fishes will disappear.
2. Vast potential for Fish production.
No fish seed hatchery. Fish Feed Plant can be established.
Indigenous species would be in danger.
3. Scope for utilizing alkaline soil and abandoned brick-kilns for fish culture.
No soil and water testing facilities available.
Ponds/ jalkars’ water area may be maintained for increasing production and productivity.
The frozen species of fish are much susceptible to diseases.
4. Demand of fish is nearly 50 per cent more
Theft of fish. Since catching of fish from dam is risky, so
Act (2206) empowers fishermen community
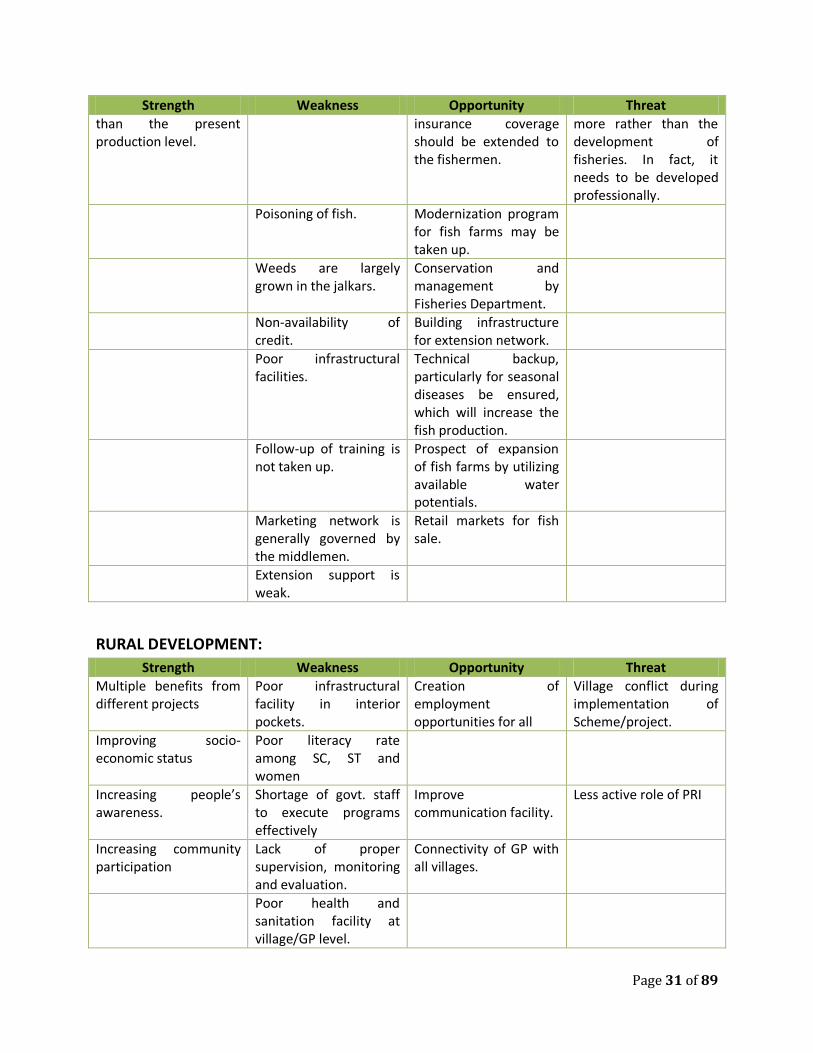
Page 31 of 89
Strength Weakness Opportunity Threat
than the present production level.
insurance coverage should be extended to the fishermen.
more rather than the development of fisheries. In fact, it needs to be developed professionally.
Poisoning of fish. Modernization program for fish farms may be taken up.
Weeds are largely grown in the jalkars.
Conservation and management by Fisheries Department.
Non-availability of credit.
Building infrastructure for extension network.
Poor infrastructural facilities.
Technical backup, particularly for seasonal diseases be ensured, which will increase the fish production.
Follow-up of training is not taken up.
Prospect of expansion of fish farms by utilizing available water potentials.
Marketing network is generally governed by the middlemen.
Retail markets for fish sale.
Extension support is weak.
RURAL DEVELOPMENT:
Strength Weakness Opportunity Threat
Multiple benefits from different projects
Poor infrastructural facility in interior pockets.
Creation of employment opportunities for all
Village conflict during implementation of Scheme/project.
Improving socio- economic status
Poor literacy rate among SC, ST and women
Increasing people’s awareness.
Shortage of govt. staff to execute programs effectively
Improve communication facility.
Less active role of PRI
Increasing community participation
Lack of proper supervision, monitoring and evaluation.
Connectivity of GP with all villages.
Poor health and sanitation facility at village/GP level.
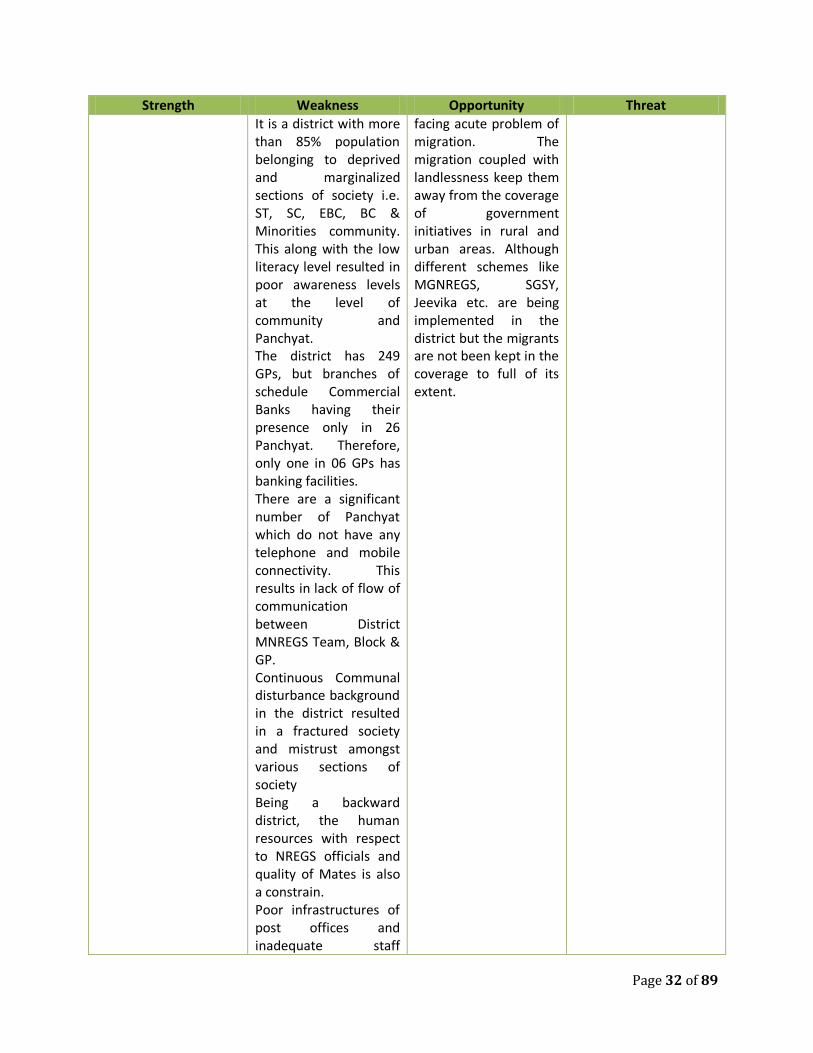
Page 32 of 89
Strength Weakness Opportunity Threat
It is a district with more than 85% population belonging to deprived and marginalized sections of society i.e. ST, SC, EBC, BC & Minorities community. This along with the low literacy level resulted in poor awareness levels at the level of community and Panchyat. The district has 249 GPs, but branches of schedule Commercial Banks having their presence only in 26 Panchyat. Therefore, only one in 06 GPs has banking facilities. There are a significant number of Panchyat which do not have any telephone and mobile connectivity. This results in lack of flow of communication between District MNREGS Team, Block & GP. Continuous Communal disturbance background in the district resulted in a fractured society and mistrust amongst various sections of society Being a backward district, the human resources with respect to NREGS officials and quality of Mates is also a constrain. Poor infrastructures of post offices and inadequate staff
facing acute problem of migration. The migration coupled with landlessness keep them away from the coverage of government initiatives in rural and urban areas. Although different schemes like MGNREGS, SGSY, Jeevika etc. are being implemented in the district but the migrants are not been kept in the coverage to full of its extent.
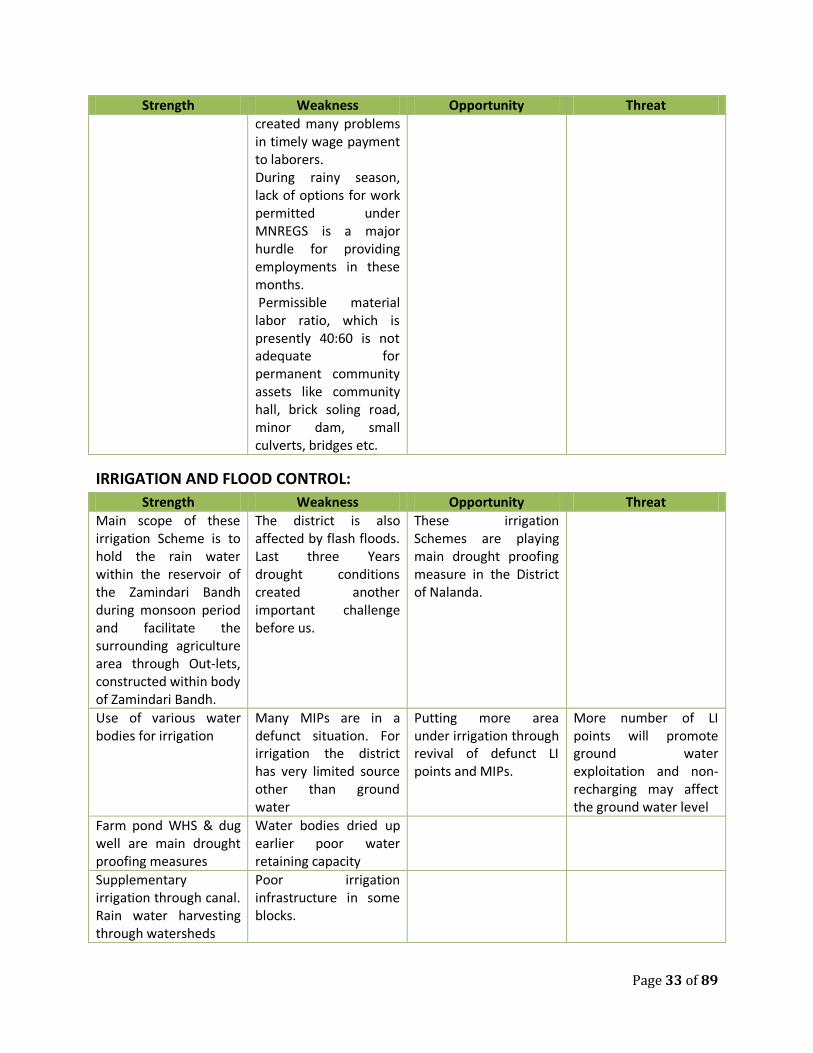
Page 33 of 89
Strength Weakness Opportunity Threat
created many problems in timely wage payment to laborers. During rainy season, lack of options for work permitted under MNREGS is a major hurdle for providing employments in these months. Permissible material labor ratio, which is presently 40:60 is not adequate for permanent community assets like community hall, brick soling road, minor dam, small culverts, bridges etc.
IRRIGATION AND FLOOD CONTROL:
Strength Weakness Opportunity Threat
Main scope of these irrigation Scheme is to hold the rain water within the reservoir of the Zamindari Bandh during monsoon period and facilitate the surrounding agriculture area through Out-lets, constructed within body of Zamindari Bandh.
The district is also affected by flash floods. Last three Years drought conditions created another important challenge before us.
These irrigation Schemes are playing main drought proofing measure in the District of Nalanda.
Use of various water bodies for irrigation
Many MIPs are in a defunct situation. For irrigation the district has very limited source other than ground water
Putting more area under irrigation through revival of defunct LI points and MIPs.
More number of LI points will promote ground water exploitation and non- recharging may affect the ground water level
Farm pond WHS & dug well are main drought proofing measures
Water bodies dried up earlier poor water retaining capacity
Supplementary irrigation through canal. Rain water harvesting through watersheds
Poor irrigation infrastructure in some blocks.
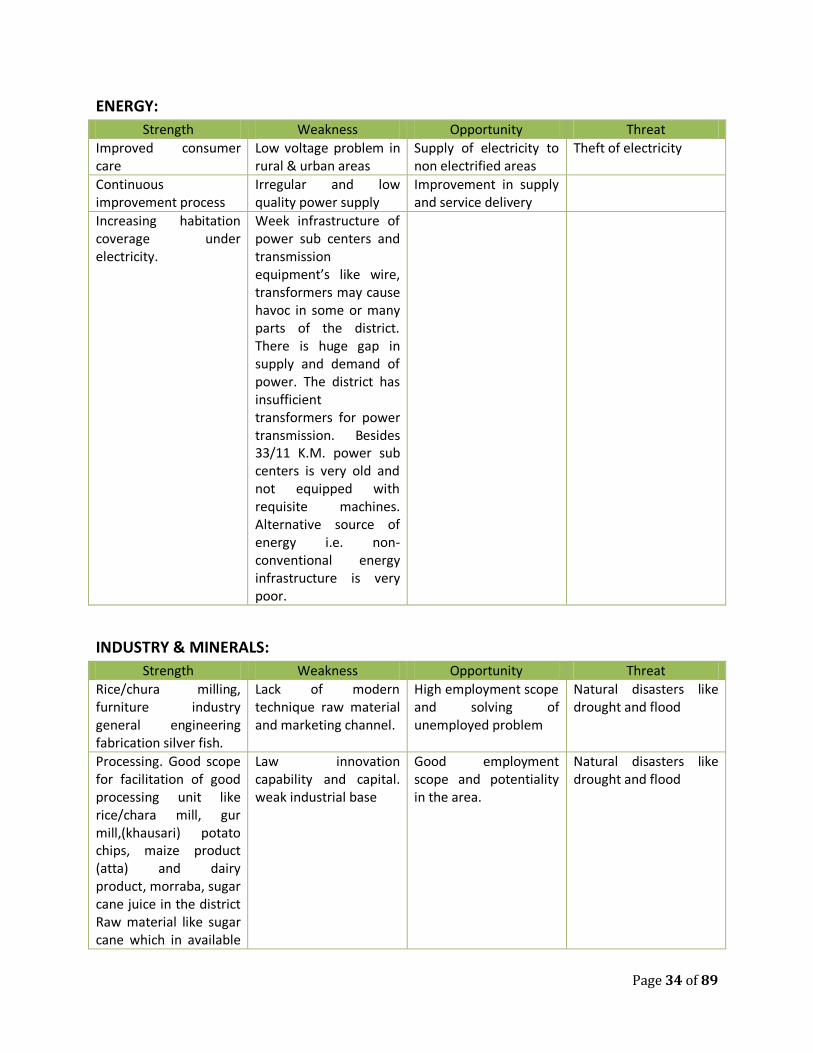
Page 34 of 89
ENERGY:
Strength Weakness Opportunity Threat
Improved consumer care
Low voltage problem in rural & urban areas
Supply of electricity to non electrified areas
Theft of electricity
Continuous improvement process
Irregular and low quality power supply
Improvement in supply and service delivery
Increasing habitation coverage under electricity.
Week infrastructure of power sub centers and transmission equipment’s like wire, transformers may cause havoc in some or many parts of the district. There is huge gap in supply and demand of power. The district has insufficient transformers for power transmission. Besides 33/11 K.M. power sub centers is very old and not equipped with requisite machines. Alternative source of energy i.e. non-conventional energy infrastructure is very poor.
INDUSTRY & MINERALS:
Strength Weakness Opportunity Threat
Rice/chura milling, furniture industry general engineering fabrication silver fish.
Lack of modern technique raw material and marketing channel.
High employment scope and solving of unemployed problem
Natural disasters like drought and flood
Processing. Good scope for facilitation of good processing unit like rice/chara mill, gur mill,(khausari) potato chips, maize product (atta) and dairy product, morraba, sugar cane juice in the district Raw material like sugar cane which in available
Law innovation capability and capital. weak industrial base
Good employment scope and potentiality in the area.
Natural disasters like drought and flood
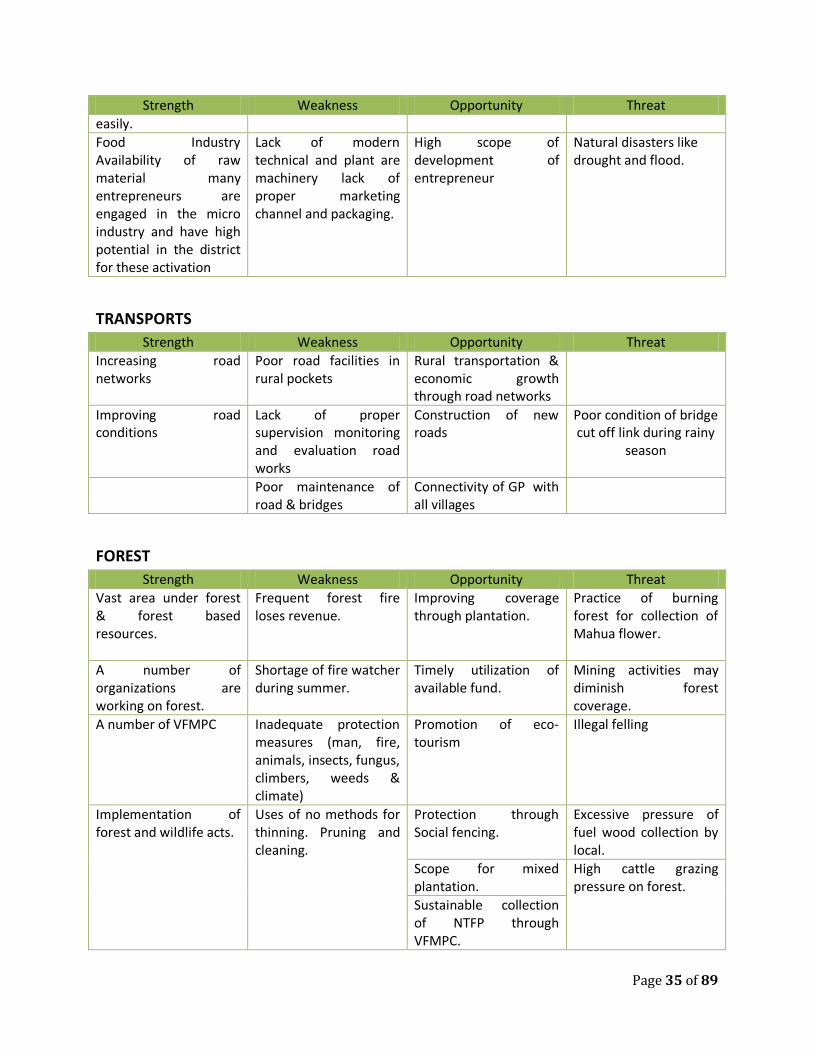
Page 35 of 89
Strength Weakness Opportunity Threat
easily.
Food Industry Availability of raw material many entrepreneurs are engaged in the micro industry and have high potential in the district for these activation
Lack of modern technical and plant are machinery lack of proper marketing channel and packaging.
High scope of development of entrepreneur
Natural disasters like drought and flood.
TRANSPORTS
Strength Weakness Opportunity Threat
Increasing road networks
Poor road facilities in rural pockets
Rural transportation & economic growth through road networks
Improving road conditions
Lack of proper supervision monitoring and evaluation road works
Construction of new roads
Poor condition of bridge cut off link during rainy
season
Poor maintenance of road & bridges
Connectivity of GP with all villages
FOREST
Strength Weakness Opportunity Threat
Vast area under forest & forest based resources.
Frequent forest fire loses revenue.
Improving coverage through plantation.
Practice of burning forest for collection of Mahua flower.
A number of organizations are working on forest.
Shortage of fire watcher during summer.
Timely utilization of available fund.
Mining activities may diminish forest coverage.
A number of VFMPC Inadequate protection measures (man, fire, animals, insects, fungus, climbers, weeds & climate)
Promotion of eco-tourism
Illegal felling
Implementation of forest and wildlife acts.
Uses of no methods for thinning. Pruning and cleaning.
Protection through Social fencing.
Excessive pressure of fuel wood collection by local.
Scope for mixed plantation.
High cattle grazing pressure on forest.
Sustainable collection of NTFP through VFMPC.
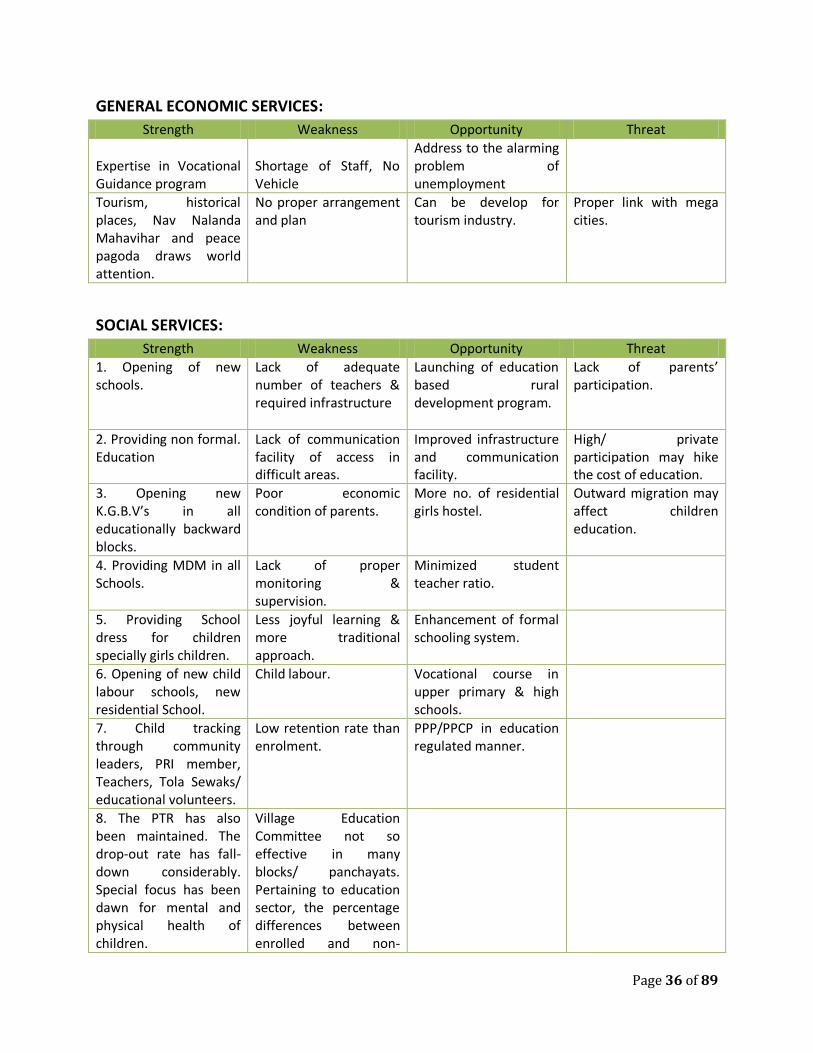
Page 36 of 89
GENERAL ECONOMIC SERVICES:
Strength Weakness Opportunity Threat
Expertise in Vocational Guidance program
Shortage of Staff, No Vehicle
Address to the alarming problem of unemployment
Tourism, historical places, Nav Nalanda Mahavihar and peace pagoda draws world attention.
No proper arrangement and plan
Can be develop for tourism industry.
Proper link with mega cities.
SOCIAL SERVICES:
Strength Weakness Opportunity Threat
1. Opening of new schools.
Lack of adequate number of teachers & required infrastructure
Launching of education based rural development program.
Lack of parents’ participation.
2. Providing non formal. Education
Lack of communication facility of access in difficult areas.
Improved infrastructure and communication facility.
High/ private participation may hike the cost of education.
3. Opening new K.G.B.V’s in all educationally backward blocks.
Poor economic condition of parents.
More no. of residential girls hostel.
Outward migration may affect children education.
4. Providing MDM in all Schools.
Lack of proper monitoring & supervision.
Minimized student teacher ratio.
5. Providing School dress for children specially girls children.
Less joyful learning & more traditional approach.
Enhancement of formal schooling system.
6. Opening of new child labour schools, new residential School.
Child labour. Vocational course in upper primary & high schools.
7. Child tracking through community leaders, PRI member, Teachers, Tola Sewaks/ educational volunteers.
Low retention rate than enrolment.
PPP/PPCP in education regulated manner.
8. The PTR has also been maintained. The drop-out rate has fall-down considerably. Special focus has been dawn for mental and physical health of children.
Village Education Committee not so effective in many blocks/ panchayats. Pertaining to education sector, the percentage differences between enrolled and non-
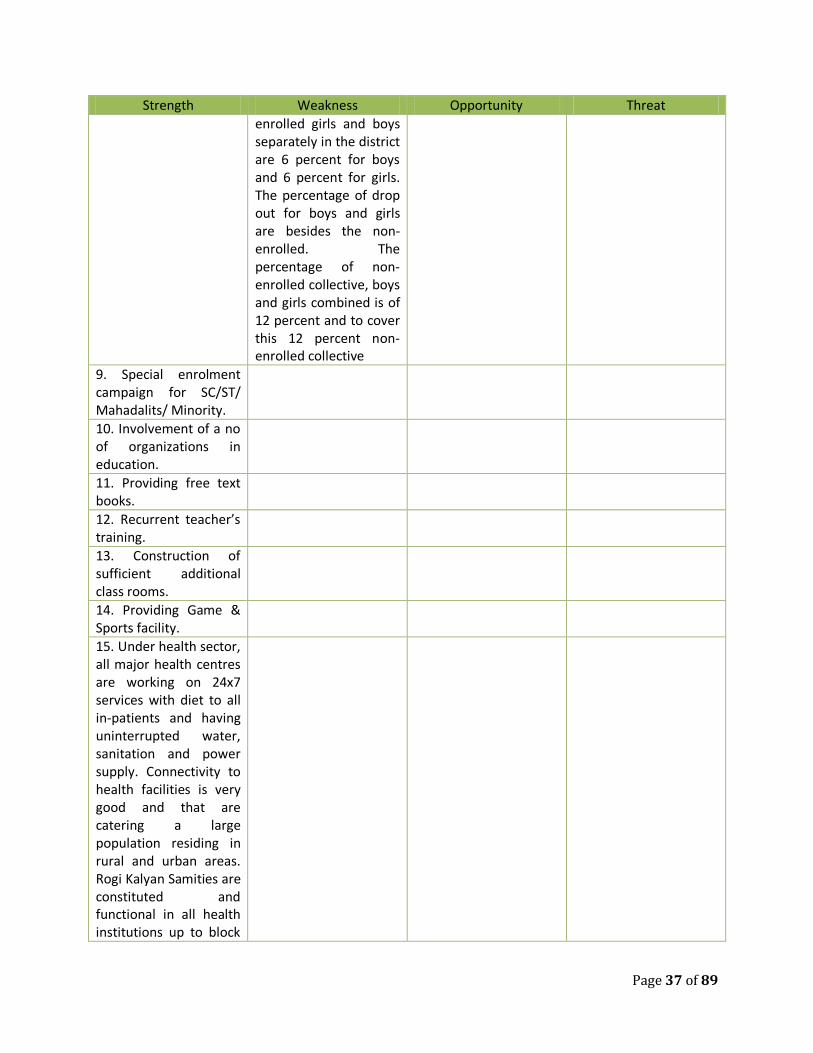
Page 37 of 89
Strength Weakness Opportunity Threat
enrolled girls and boys separately in the district are 6 percent for boys and 6 percent for girls. The percentage of drop out for boys and girls are besides the non-enrolled. The percentage of non-enrolled collective, boys and girls combined is of 12 percent and to cover this 12 percent non-enrolled collective
9. Special enrolment campaign for SC/ST/ Mahadalits/ Minority.
10. Involvement of a no of organizations in education.
11. Providing free text books.
12. Recurrent teacher’s training.
13. Construction of sufficient additional class rooms.
14. Providing Game & Sports facility.
15. Under health sector, all major health centres are working on 24x7 services with diet to all in-patients and having uninterrupted water, sanitation and power supply. Connectivity to health facilities is very good and that are catering a large population residing in rural and urban areas. Rogi Kalyan Samities are constituted and functional in all health institutions up to block
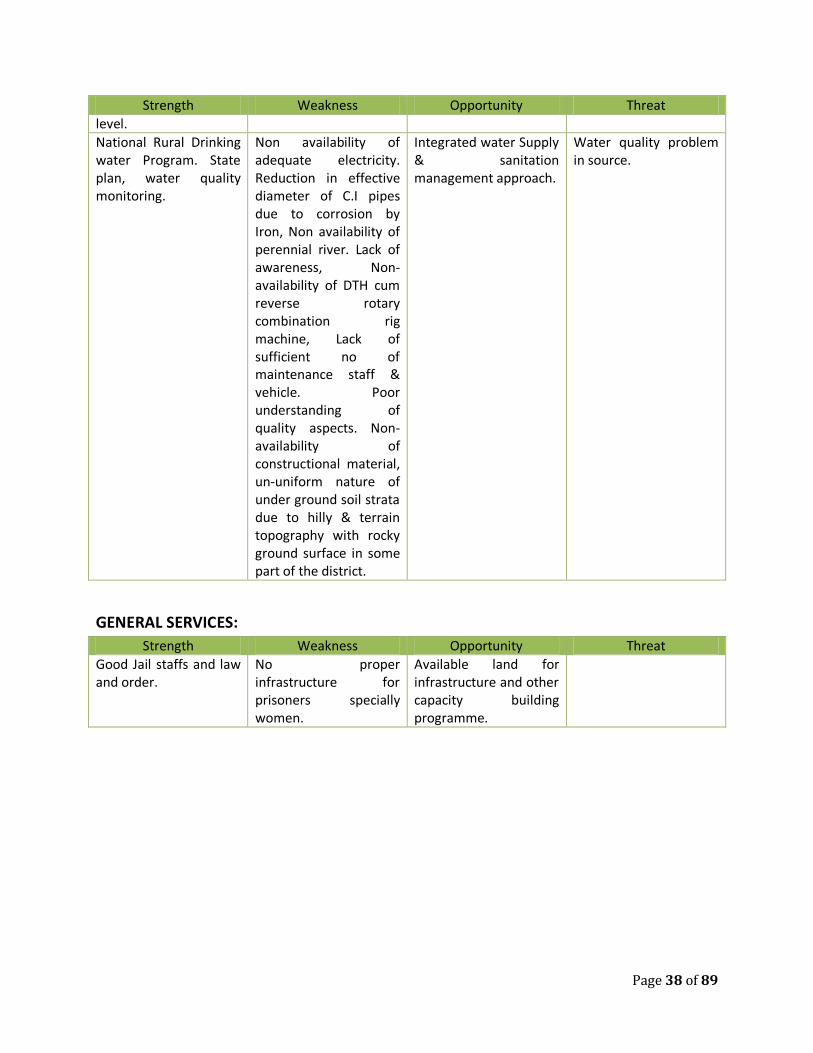
Page 38 of 89
Strength Weakness Opportunity Threat
level.
National Rural Drinking water Program. State plan, water quality monitoring.
Non availability of adequate electricity. Reduction in effective diameter of C.I pipes due to corrosion by Iron, Non availability of perennial river. Lack of awareness, Non-availability of DTH cum reverse rotary combination rig machine, Lack of sufficient no of maintenance staff & vehicle. Poor understanding of quality aspects. Non-availability of constructional material, un-uniform nature of under ground soil strata due to hilly & terrain topography with rocky ground surface in some part of the district.
Integrated water Supply & sanitation management approach.
Water quality problem in source.
GENERAL SERVICES:
Strength Weakness Opportunity Threat
Good Jail staffs and law and order.
No proper infrastructure for prisoners specially women.
Available land for infrastructure and other capacity building programme.
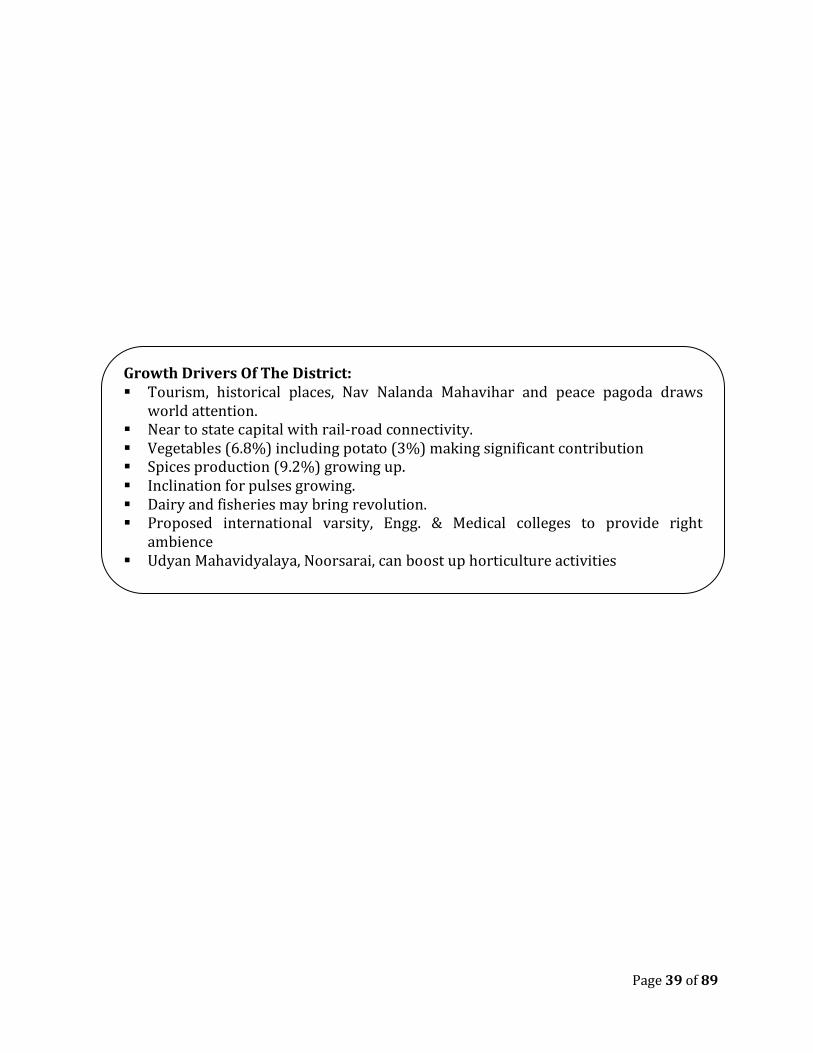
Page 39 of 89
Growth Drivers Of The District: Tourism, historical places, Nav Nalanda Mahavihar and peace pagoda draws
world attention. Near to state capital with rail-road connectivity. Vegetables (6.8%) including potato (3%) making significant contribution Spices production (9.2%) growing up. Inclination for pulses growing. Dairy and fisheries may bring revolution. Proposed international varsity, Engg. & Medical colleges to provide right
ambience Udyan Mahavidyalaya, Noorsarai, can boost up horticulture activities
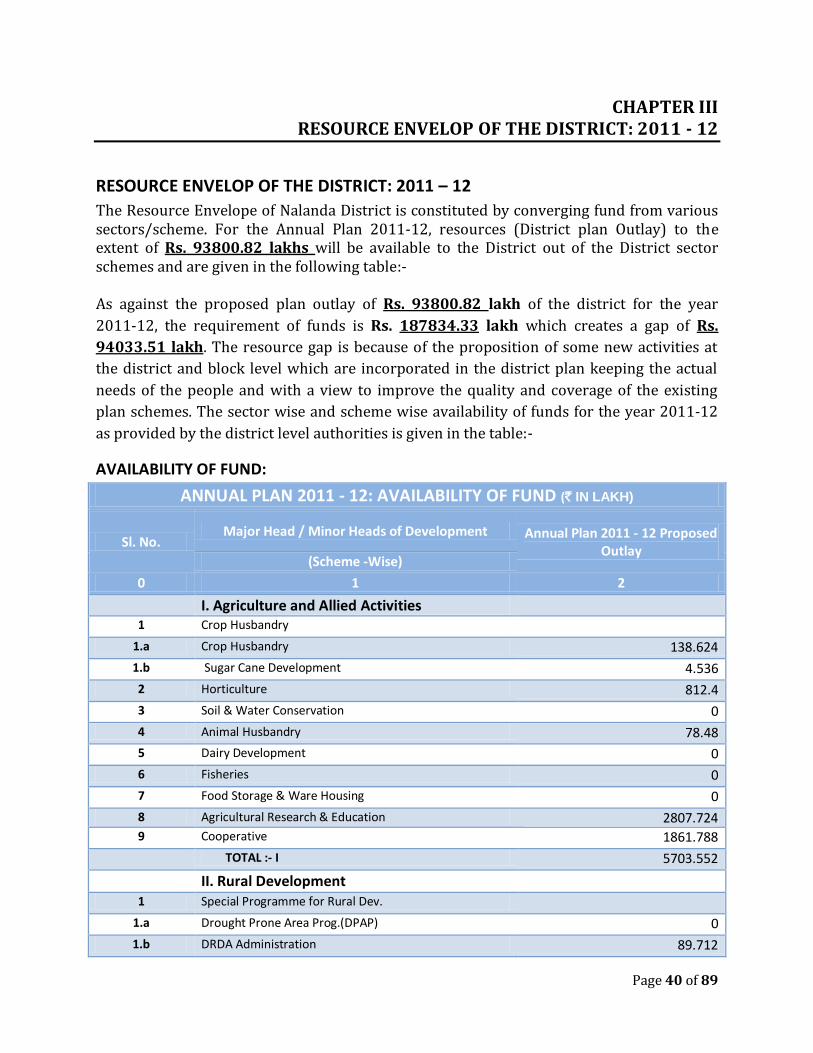
Page 40 of 89
CHAPTER III RESOURCE ENVELOP OF THE DISTRICT: 2011 - 12
RESOURCE ENVELOP OF THE DISTRICT: 2011 – 12
The Resource Envelope of Nalanda District is constituted by converging fund from various sectors/scheme. For the Annual Plan 2011‐12, resources (District plan Outlay) to the extent of Rs. 93800.82 lakhs will be available to the District out of the District sector schemes and are given in the following table:- As against the proposed plan outlay of Rs. 93800.82 lakh of the district for the year
2011‐12, the requirement of funds is Rs. 187834.33 lakh which creates a gap of Rs.
94033.51 lakh. The resource gap is because of the proposition of some new activities at
the district and block level which are incorporated in the district plan keeping the actual
needs of the people and with a view to improve the quality and coverage of the existing
plan schemes. The sector wise and scheme wise availability of funds for the year 2011‐12
as provided by the district level authorities is given in the table:-
AVAILABILITY OF FUND:
ANNUAL PLAN 2011 - 12: AVAILABILITY OF FUND (` IN LAKH)
Sl. No. Major Head / Minor Heads of Development Annual Plan 2011 - 12 Proposed
Outlay (Scheme -Wise)
0 1 2
I. Agriculture and Allied Activities
1 Crop Husbandry
1.a Crop Husbandry 138.624
1.b Sugar Cane Development 4.536
2 Horticulture 812.4
3 Soil & Water Conservation 0
4 Animal Husbandry 78.48
5 Dairy Development 0
6 Fisheries 0
7 Food Storage & Ware Housing 0
8 Agricultural Research & Education 2807.724 9 Cooperative 1861.788
TOTAL :- I 5703.552
II. Rural Development
1 Special Programme for Rural Dev.
1.a Drought Prone Area Prog.(DPAP) 0
1.b DRDA Administration 89.712

Page 41 of 89
ANNUAL PLAN 2011 - 12: AVAILABILITY OF FUND (` IN LAKH)
Sl. No. Major Head / Minor Heads of Development Annual Plan 2011 - 12 Proposed
Outlay (Scheme -Wise)
0 1 2
2 Rural Employment
2.a SGSY 706.788
2.b MNREGS 10866.864
3 Land Reforms 18.6
4 Other Rural Development Programmes 4.a Community Development 652.008
4.b Panchayats 2125.344
4.c M.L.A./M.L.C. Schemes 1260
TOTAL :- II 15719.316
III. Special Area Programme
1 Other Special Areas Programmes
1.a BADP 0
1.b Backward Region Grant Fund 2032.8
1.c Grant under proviso to Article 275(1) 1618.584
1.d Special Central Assistance to TSP 0
1.e Mukhyamantri Zila Vikas Yojana 0
TOTAL :- III 3651.384
IV. Irrigation & Flood Control
1 Major & Medium Irrigation 3433.2
2 Minor Irrigation 357.6
3 Command Area Development 0
4 Disaster Management 37.2
5 Flood Control (Incl. Flood Protect. works) 534
TOTAL :- IV 4362
V. Energy
1 Power 0
1.a B.S.E.B. 0
1.b B.S.H.P.C. 0
2 Non-conventional Sources of Energy 0 TOTAL:- V 0
VI. Industry & Minerals
1 Village & Small Enterprises 0
2 Other Industries(Other than VSE) 111.6
3 Minerals 0
TOTAL :- VI 111.6

Page 42 of 89
ANNUAL PLAN 2011 - 12: AVAILABILITY OF FUND (` IN LAKH)
Sl. No. Major Head / Minor Heads of Development Annual Plan 2011 - 12 Proposed
Outlay (Scheme -Wise)
0 1 2
VII. Transport
1 Civil Aviation 0
2 Roads and Bridges
2.a R.C.D. Roads 0
2.b Rural Roads 7057.86
2.c Urban Roads 0
3 Road Transport 0
TOTAL :- VII 7057.86
VIII. Science, Tech. & Environment
1 Scientific Research 0
2 IT & E-Governance 0
3 Ecology & Environment 10.98
4 Forestry & Wildlife 0
TOTAL :- VIII 10.98
IX. General Economic Services
1 Secretariat Economic Services 2346.036
1 Tourism 991.644
2 Census, Surveys & Statistics 0
3 Civil Supplies 0
4 Other General Economic Services (National Saving)
4.a District Planning(Untied Fund) 0
TOTAL:- IX 3337.68
X. Social Service
1 General Education
1.a Elementary & Adult Education 25116.192
1.b Secondary Education 3539.76
1.c Higher Education 0
1.d Rajbhasha 0
2 Technical Education 0
3 Sports and Youth Services 249.852
4 Art and Culture 0
5 Medical & Public Health
5.a Med. Education & Family Welfare 2160.78
5.b Public Health 0
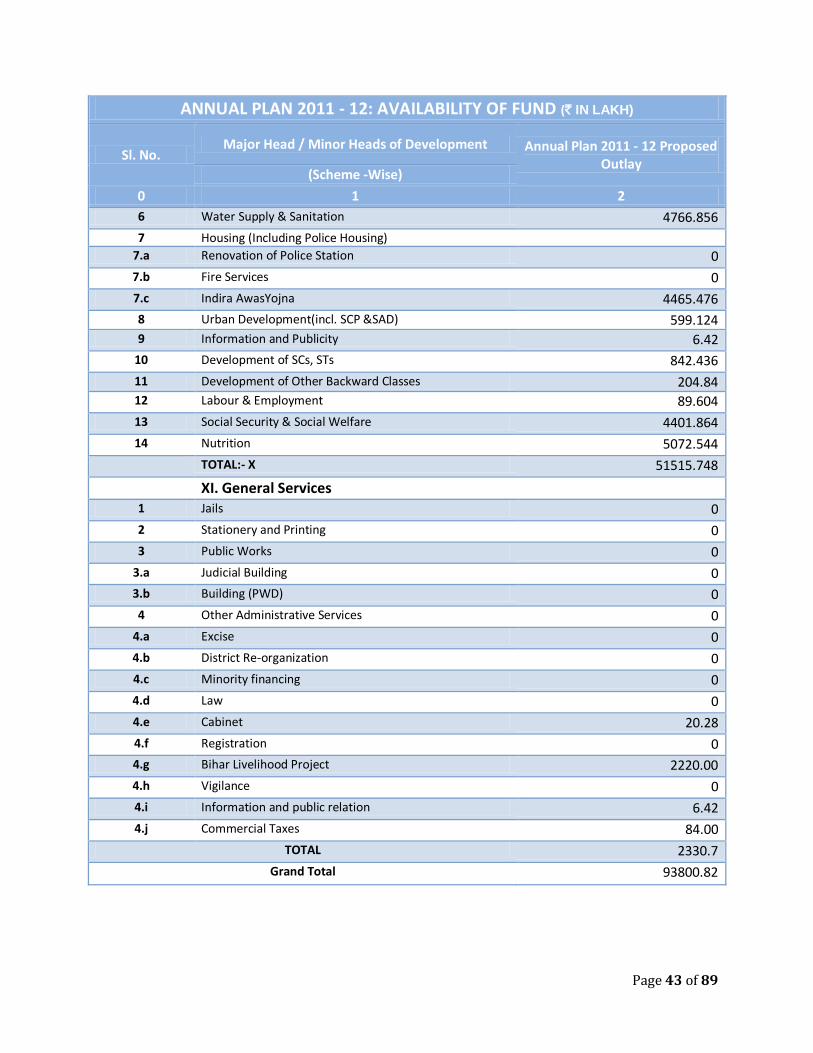
Page 43 of 89
ANNUAL PLAN 2011 - 12: AVAILABILITY OF FUND (` IN LAKH)
Sl. No. Major Head / Minor Heads of Development Annual Plan 2011 - 12 Proposed
Outlay (Scheme -Wise)
0 1 2
6 Water Supply & Sanitation 4766.856
7 Housing (Including Police Housing) 7.a Renovation of Police Station 0
7.b Fire Services 0
7.c Indira AwasYojna 4465.476
8 Urban Development(incl. SCP &SAD) 599.124 9 Information and Publicity 6.42
10 Development of SCs, STs 842.436
11 Development of Other Backward Classes 204.84 12 Labour & Employment 89.604
13 Social Security & Social Welfare 4401.864
14 Nutrition 5072.544
TOTAL:- X 51515.748
XI. General Services
1 Jails 0
2 Stationery and Printing 0
3 Public Works 0
3.a Judicial Building 0
3.b Building (PWD) 0
4 Other Administrative Services 0
4.a Excise 0
4.b District Re-organization 0
4.c Minority financing 0
4.d Law 0
4.e Cabinet 20.28
4.f Registration 0
4.g Bihar Livelihood Project 2220.00
4.h Vigilance 0
4.i Information and public relation 6.42
4.j Commercial Taxes 84.00
TOTAL 2330.7
Grand Total 93800.82
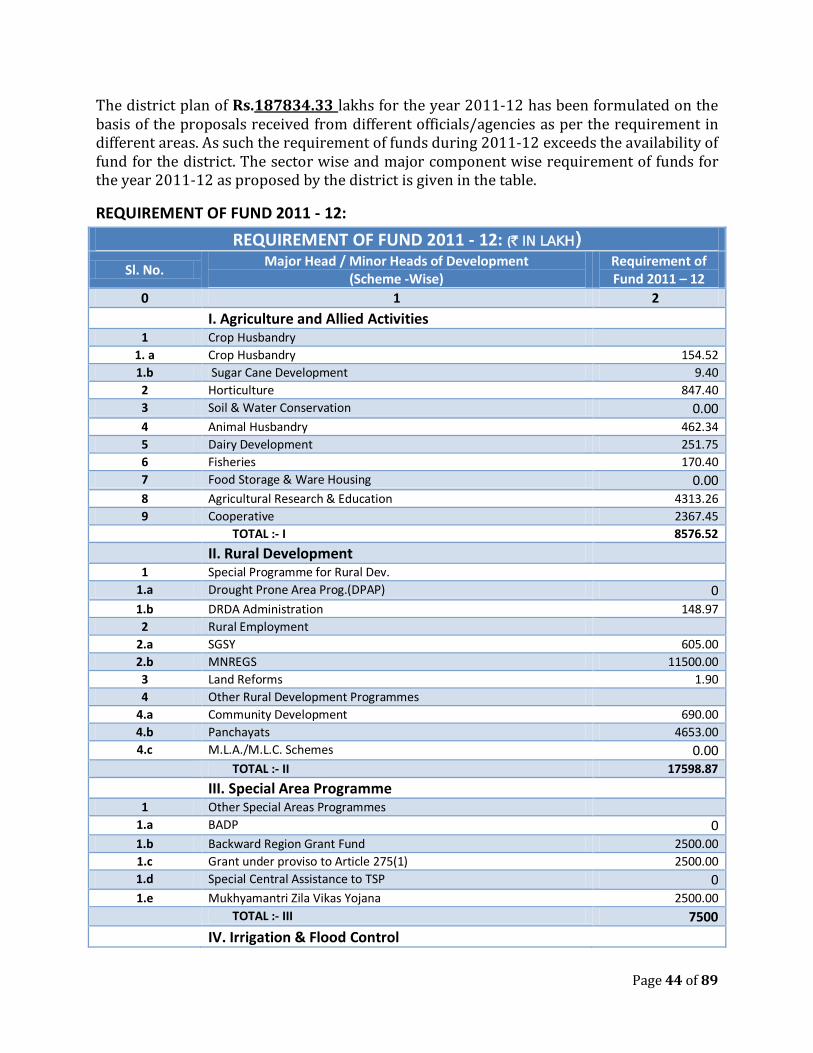
Page 44 of 89
The district plan of Rs.187834.33 lakhs for the year 2011‐12 has been formulated on the basis of the proposals received from different officials/agencies as per the requirement in different areas. As such the requirement of funds during 2011‐12 exceeds the availability of fund for the district. The sector wise and major component wise requirement of funds for the year 2011‐12 as proposed by the district is given in the table.
REQUIREMENT OF FUND 2011 - 12:
REQUIREMENT OF FUND 2011 - 12: (` IN LAKH)
Sl. No. Major Head / Minor Heads of Development
(Scheme -Wise) Requirement of Fund 2011 – 12
0 1 2 I. Agriculture and Allied Activities
1 Crop Husbandry
1. a Crop Husbandry 154.52 1.b Sugar Cane Development 9.40
2 Horticulture 847.40
3 Soil & Water Conservation 0.00 4 Animal Husbandry 462.34
5 Dairy Development 251.75
6 Fisheries 170.40
7 Food Storage & Ware Housing 0.00 8 Agricultural Research & Education 4313.26
9 Cooperative 2367.45
TOTAL :- I 8576.52
II. Rural Development
1 Special Programme for Rural Dev. 1.a Drought Prone Area Prog.(DPAP) 0 1.b DRDA Administration 148.97
2 Rural Employment 2.a SGSY 605.00
2.b MNREGS 11500.00
3 Land Reforms 1.90
4 Other Rural Development Programmes 4.a Community Development 690.00
4.b Panchayats 4653.00
4.c M.L.A./M.L.C. Schemes 0.00 TOTAL :- II 17598.87
III. Special Area Programme
1 Other Special Areas Programmes 1.a BADP 0 1.b Backward Region Grant Fund 2500.00
1.c Grant under proviso to Article 275(1) 2500.00
1.d Special Central Assistance to TSP 0 1.e Mukhyamantri Zila Vikas Yojana 2500.00
TOTAL :- III 7500 IV. Irrigation & Flood Control
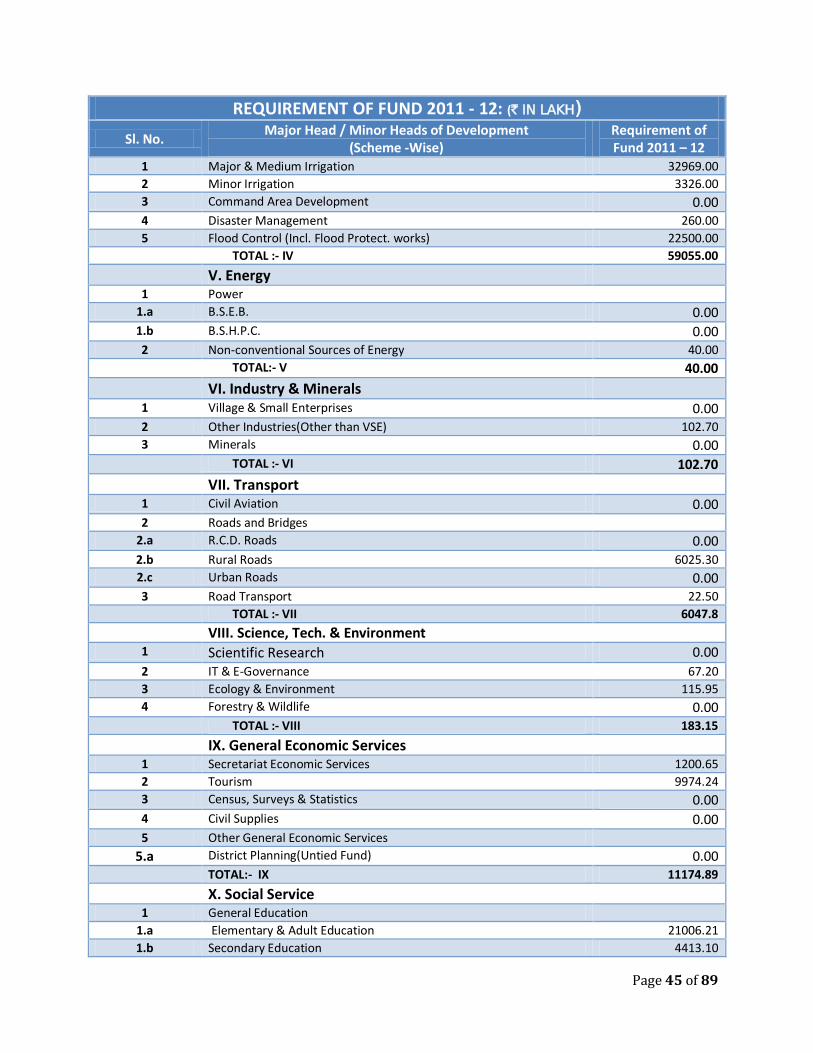
Page 45 of 89
REQUIREMENT OF FUND 2011 - 12: (` IN LAKH)
Sl. No. Major Head / Minor Heads of Development
(Scheme -Wise) Requirement of Fund 2011 – 12
1 Major & Medium Irrigation 32969.00
2 Minor Irrigation 3326.00
3 Command Area Development 0.00 4 Disaster Management 260.00
5 Flood Control (Incl. Flood Protect. works) 22500.00
TOTAL :- IV 59055.00
V. Energy
1 Power 1.a B.S.E.B. 0.00 1.b B.S.H.P.C. 0.00 2 Non-conventional Sources of Energy 40.00
TOTAL:- V 40.00 VI. Industry & Minerals
1 Village & Small Enterprises 0.00 2 Other Industries(Other than VSE) 102.70
3 Minerals 0.00 TOTAL :- VI 102.70 VII. Transport
1 Civil Aviation 0.00 2 Roads and Bridges
2.a R.C.D. Roads 0.00 2.b Rural Roads 6025.30 2.c Urban Roads 0.00 3 Road Transport 22.50
TOTAL :- VII 6047.8
VIII. Science, Tech. & Environment
1 Scientific Research 0.00
2 IT & E-Governance 67.20
3 Ecology & Environment 115.95
4 Forestry & Wildlife 0.00
TOTAL :- VIII 183.15
IX. General Economic Services
1 Secretariat Economic Services 1200.65
2 Tourism 9974.24
3 Census, Surveys & Statistics 0.00 4 Civil Supplies 0.00 5 Other General Economic Services
5.a District Planning(Untied Fund) 0.00 TOTAL:- IX 11174.89
X. Social Service
1 General Education 1.a Elementary & Adult Education 21006.21
1.b Secondary Education 4413.10
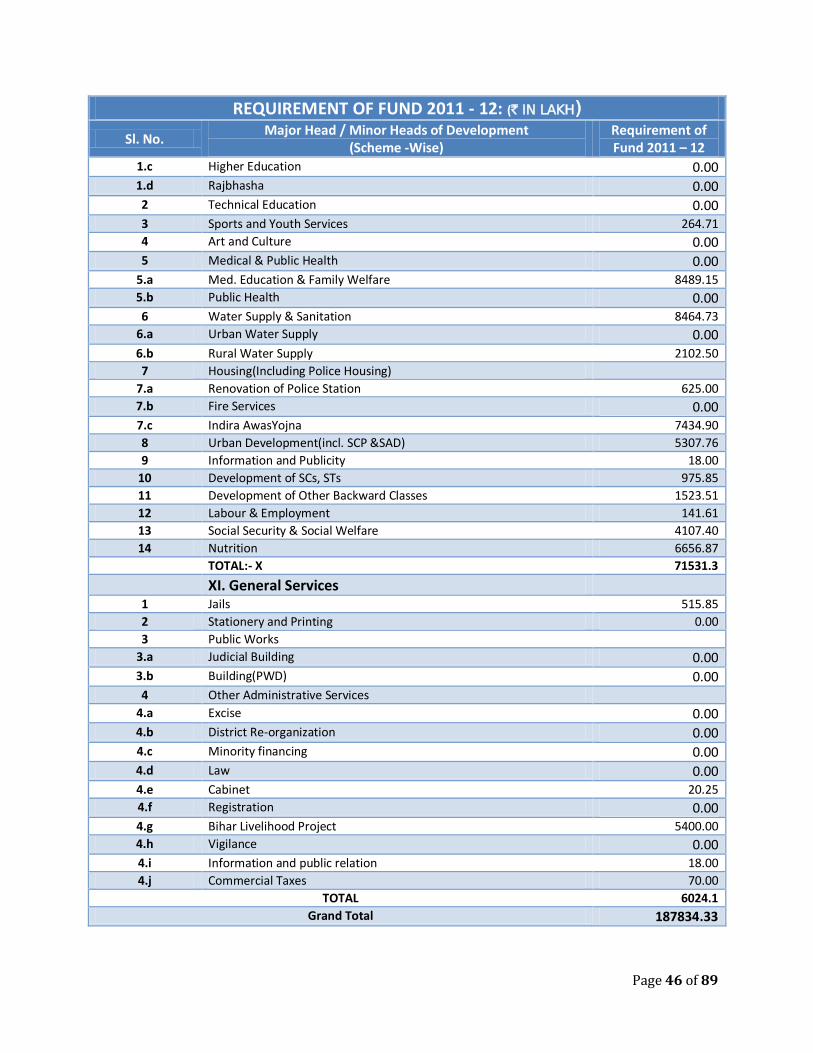
Page 46 of 89
REQUIREMENT OF FUND 2011 - 12: (` IN LAKH)
Sl. No. Major Head / Minor Heads of Development
(Scheme -Wise) Requirement of Fund 2011 – 12
1.c Higher Education 0.00 1.d Rajbhasha 0.00 2 Technical Education 0.00 3 Sports and Youth Services 264.71
4 Art and Culture 0.00 5 Medical & Public Health 0.00
5.a Med. Education & Family Welfare 8489.15
5.b Public Health 0.00 6 Water Supply & Sanitation 8464.73
6.a Urban Water Supply 0.00 6.b Rural Water Supply 2102.50
7 Housing(Including Police Housing) 7.a Renovation of Police Station 625.00
7.b Fire Services 0.00 7.c Indira AwasYojna 7434.90
8 Urban Development(incl. SCP &SAD) 5307.76
9 Information and Publicity 18.00
10 Development of SCs, STs 975.85
11 Development of Other Backward Classes 1523.51
12 Labour & Employment 141.61
13 Social Security & Social Welfare 4107.40
14 Nutrition 6656.87
TOTAL:- X 71531.3
XI. General Services
1 Jails 515.85
2 Stationery and Printing 0.00
3 Public Works 3.a Judicial Building 0.00 3.b Building(PWD) 0.00 4 Other Administrative Services
4.a Excise 0.00 4.b District Re-organization 0.00 4.c Minority financing 0.00 4.d Law 0.00 4.e Cabinet 20.25
4.f Registration 0.00 4.g Bihar Livelihood Project 5400.00
4.h Vigilance 0.00 4.i Information and public relation 18.00
4.j Commercial Taxes 70.00
TOTAL 6024.1
Grand Total 187834.33
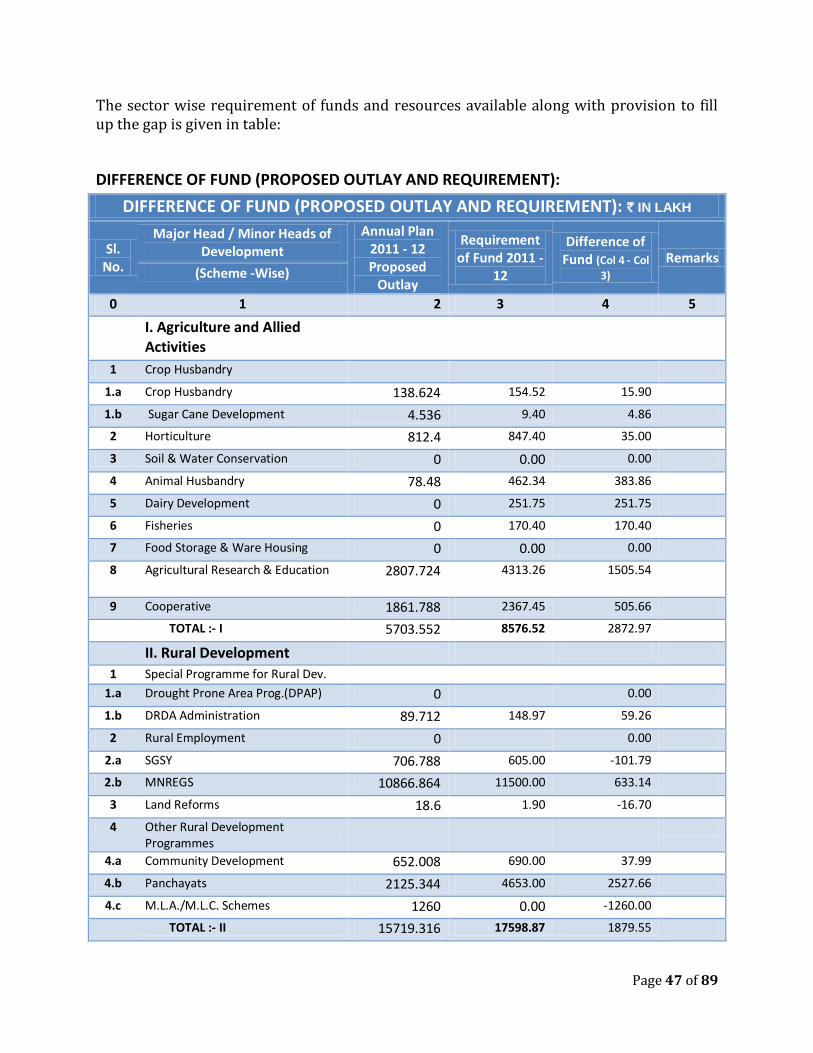
Page 47 of 89
The sector wise requirement of funds and resources available along with provision to fill up the gap is given in table:
DIFFERENCE OF FUND (PROPOSED OUTLAY AND REQUIREMENT):
DIFFERENCE OF FUND (PROPOSED OUTLAY AND REQUIREMENT): ` IN LAKH
Sl. No.
Major Head / Minor Heads of Development
Annual Plan 2011 - 12 Proposed
Outlay
Requirement of Fund 2011 -
12
Difference of Fund (Col 4 - Col
3) Remarks
(Scheme -Wise)
0 1 2 3 4 5
I. Agriculture and Allied Activities
1 Crop Husbandry
1.a Crop Husbandry 138.624 154.52 15.90
1.b Sugar Cane Development 4.536 9.40 4.86
2 Horticulture 812.4 847.40 35.00
3 Soil & Water Conservation 0 0.00 0.00
4 Animal Husbandry 78.48 462.34 383.86
5 Dairy Development 0 251.75 251.75
6 Fisheries 0 170.40 170.40
7 Food Storage & Ware Housing 0 0.00 0.00
8 Agricultural Research & Education 2807.724 4313.26 1505.54
9 Cooperative 1861.788 2367.45 505.66
TOTAL :- I 5703.552 8576.52 2872.97
II. Rural Development
1 Special Programme for Rural Dev. 1.a Drought Prone Area Prog.(DPAP) 0 0.00
1.b DRDA Administration 89.712 148.97 59.26
2 Rural Employment 0 0.00
2.a SGSY 706.788 605.00 -101.79
2.b MNREGS 10866.864 11500.00 633.14
3 Land Reforms 18.6 1.90 -16.70
4 Other Rural Development Programmes
4.a Community Development 652.008 690.00 37.99
4.b Panchayats 2125.344 4653.00 2527.66
4.c M.L.A./M.L.C. Schemes 1260 0.00 -1260.00
TOTAL :- II 15719.316 17598.87 1879.55
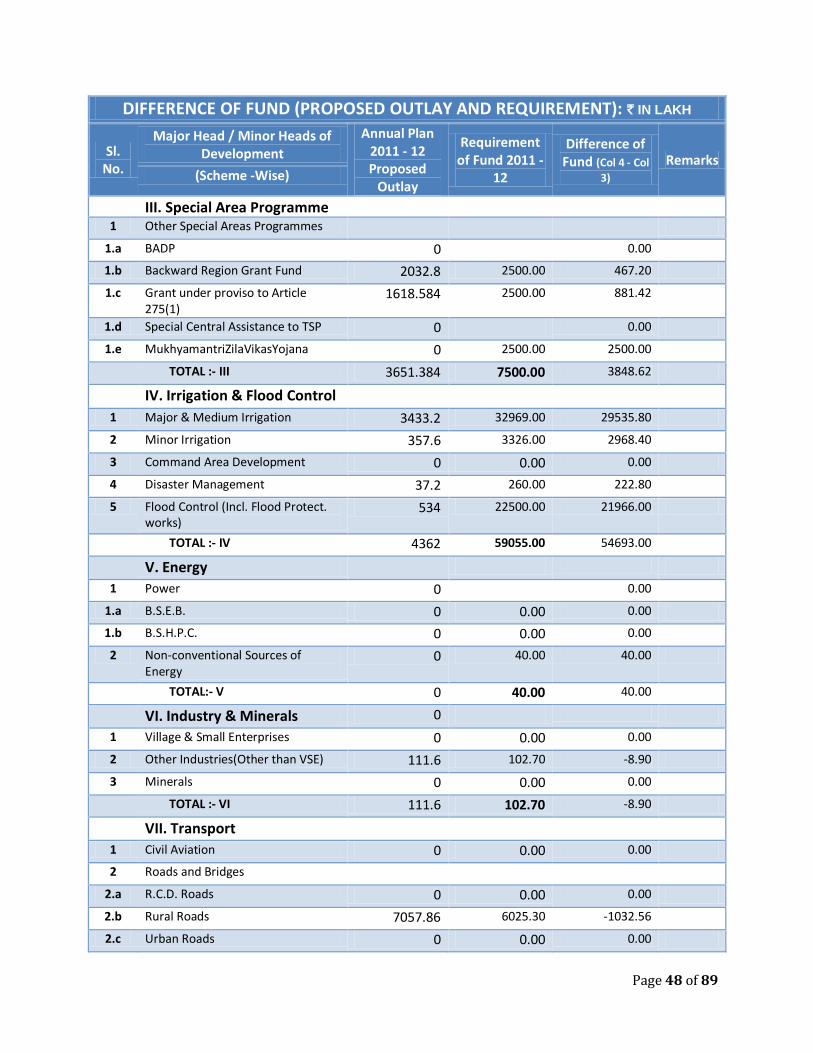
Page 48 of 89
DIFFERENCE OF FUND (PROPOSED OUTLAY AND REQUIREMENT): ` IN LAKH
Sl. No.
Major Head / Minor Heads of Development
Annual Plan 2011 - 12 Proposed
Outlay
Requirement of Fund 2011 -
12
Difference of Fund (Col 4 - Col
3) Remarks
(Scheme -Wise)
III. Special Area Programme
1 Other Special Areas Programmes
1.a BADP 0 0.00
1.b Backward Region Grant Fund 2032.8 2500.00 467.20
1.c Grant under proviso to Article 275(1)
1618.584 2500.00 881.42
1.d Special Central Assistance to TSP 0 0.00
1.e MukhyamantriZilaVikasYojana 0 2500.00 2500.00
TOTAL :- III 3651.384 7500.00 3848.62
IV. Irrigation & Flood Control
1 Major & Medium Irrigation 3433.2 32969.00 29535.80
2 Minor Irrigation 357.6 3326.00 2968.40
3 Command Area Development 0 0.00 0.00
4 Disaster Management 37.2 260.00 222.80
5 Flood Control (Incl. Flood Protect. works)
534 22500.00 21966.00
TOTAL :- IV 4362 59055.00 54693.00
V. Energy
1 Power 0 0.00
1.a B.S.E.B. 0 0.00 0.00
1.b B.S.H.P.C. 0 0.00 0.00
2 Non-conventional Sources of Energy
0 40.00 40.00
TOTAL:- V 0 40.00 40.00
VI. Industry & Minerals 0
1 Village & Small Enterprises 0 0.00 0.00
2 Other Industries(Other than VSE) 111.6 102.70 -8.90
3 Minerals 0 0.00 0.00
TOTAL :- VI 111.6 102.70 -8.90
VII. Transport
1 Civil Aviation 0 0.00 0.00
2 Roads and Bridges
2.a R.C.D. Roads 0 0.00 0.00
2.b Rural Roads 7057.86 6025.30 -1032.56
2.c Urban Roads 0 0.00 0.00
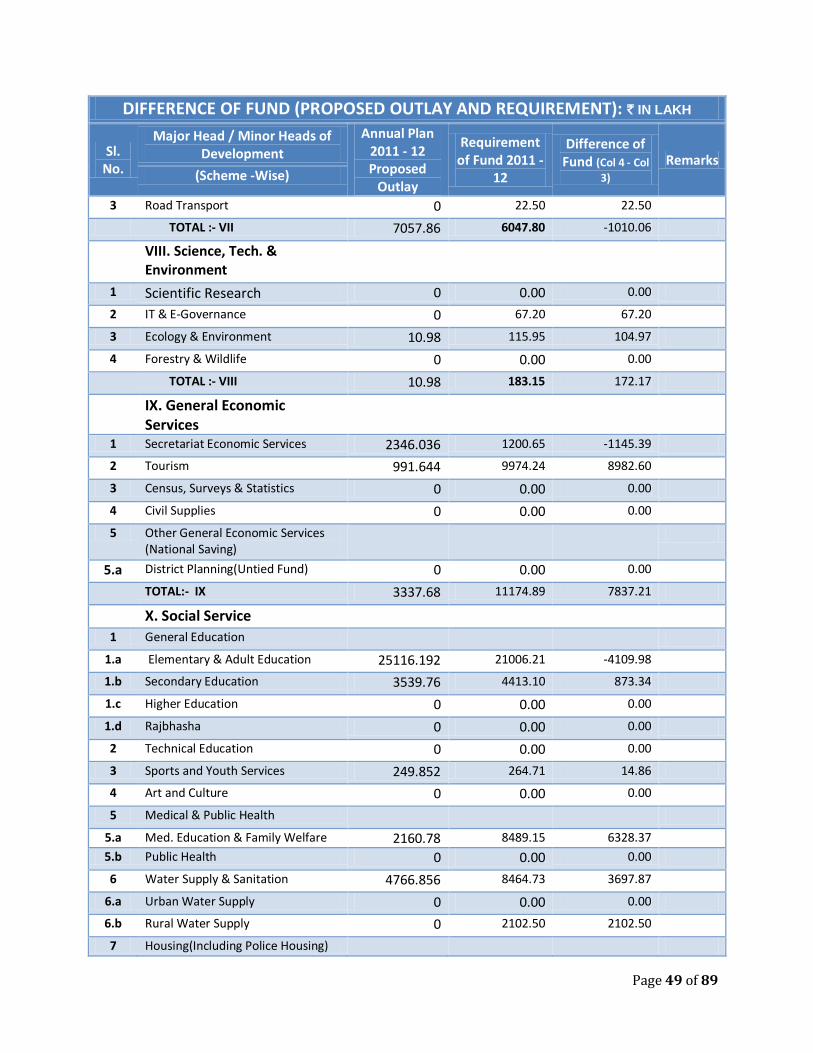
Page 49 of 89
DIFFERENCE OF FUND (PROPOSED OUTLAY AND REQUIREMENT): ` IN LAKH
Sl. No.
Major Head / Minor Heads of Development
Annual Plan 2011 - 12 Proposed
Outlay
Requirement of Fund 2011 -
12
Difference of Fund (Col 4 - Col
3) Remarks
(Scheme -Wise)
3 Road Transport 0 22.50 22.50
TOTAL :- VII 7057.86 6047.80 -1010.06
VIII. Science, Tech. & Environment
1 Scientific Research 0 0.00 0.00
2 IT & E-Governance 0 67.20 67.20
3 Ecology & Environment 10.98 115.95 104.97
4 Forestry & Wildlife 0 0.00 0.00
TOTAL :- VIII 10.98 183.15 172.17
IX. General Economic Services
1 Secretariat Economic Services 2346.036 1200.65 -1145.39
2 Tourism 991.644 9974.24 8982.60
3 Census, Surveys & Statistics 0 0.00 0.00
4 Civil Supplies 0 0.00 0.00
5 Other General Economic Services (National Saving)
5.a District Planning(Untied Fund) 0 0.00 0.00
TOTAL:- IX 3337.68 11174.89 7837.21
X. Social Service
1 General Education
1.a Elementary & Adult Education 25116.192 21006.21 -4109.98
1.b Secondary Education 3539.76 4413.10 873.34
1.c Higher Education 0 0.00 0.00
1.d Rajbhasha 0 0.00 0.00
2 Technical Education 0 0.00 0.00
3 Sports and Youth Services 249.852 264.71 14.86
4 Art and Culture 0 0.00 0.00
5 Medical & Public Health
5.a Med. Education & Family Welfare 2160.78 8489.15 6328.37
5.b Public Health 0 0.00 0.00
6 Water Supply & Sanitation 4766.856 8464.73 3697.87
6.a Urban Water Supply 0 0.00 0.00
6.b Rural Water Supply 0 2102.50 2102.50
7 Housing(Including Police Housing)
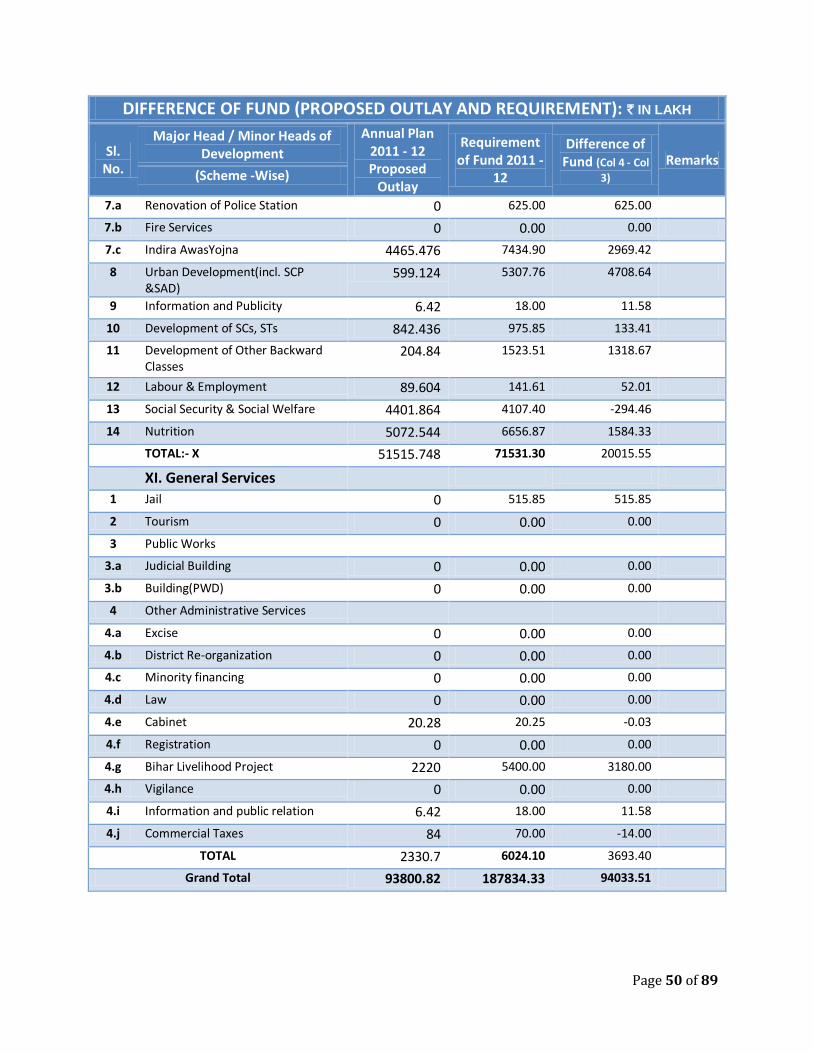
Page 50 of 89
DIFFERENCE OF FUND (PROPOSED OUTLAY AND REQUIREMENT): ` IN LAKH
Sl. No.
Major Head / Minor Heads of Development
Annual Plan 2011 - 12 Proposed
Outlay
Requirement of Fund 2011 -
12
Difference of Fund (Col 4 - Col
3) Remarks
(Scheme -Wise)
7.a Renovation of Police Station 0 625.00 625.00
7.b Fire Services 0 0.00 0.00
7.c Indira AwasYojna 4465.476 7434.90 2969.42
8 Urban Development(incl. SCP &SAD)
599.124 5307.76 4708.64
9 Information and Publicity 6.42 18.00 11.58
10 Development of SCs, STs 842.436 975.85 133.41
11 Development of Other Backward Classes
204.84 1523.51 1318.67
12 Labour & Employment 89.604 141.61 52.01
13 Social Security & Social Welfare 4401.864 4107.40 -294.46
14 Nutrition 5072.544 6656.87 1584.33
TOTAL:- X 51515.748 71531.30 20015.55
XI. General Services
1 Jail 0 515.85 515.85
2 Tourism 0 0.00 0.00
3 Public Works
3.a Judicial Building 0 0.00 0.00
3.b Building(PWD) 0 0.00 0.00
4 Other Administrative Services
4.a Excise 0 0.00 0.00
4.b District Re-organization 0 0.00 0.00
4.c Minority financing 0 0.00 0.00
4.d Law 0 0.00 0.00
4.e Cabinet 20.28 20.25 -0.03
4.f Registration 0 0.00 0.00
4.g Bihar Livelihood Project 2220 5400.00 3180.00
4.h Vigilance 0 0.00 0.00
4.i Information and public relation 6.42 18.00 11.58
4.j Commercial Taxes 84 70.00 -14.00
TOTAL 2330.7 6024.10 3693.40
Grand Total 93800.82 187834.33 94033.51
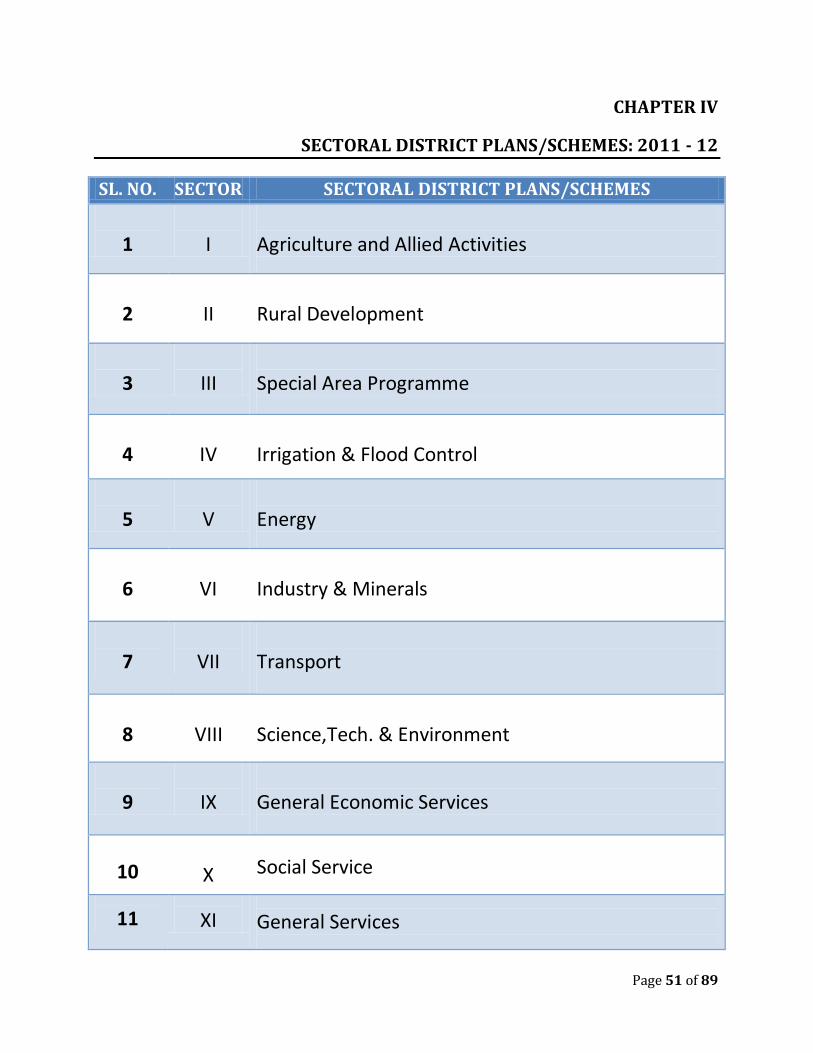
Page 51 of 89
CHAPTER IV
SECTORAL DISTRICT PLANS/SCHEMES: 2011 - 12
SL. NO. SECTOR SECTORAL DISTRICT PLANS/SCHEMES
1
I
Agriculture and Allied Activities
2
II
Rural Development
3
III
Special Area Programme
4
IV
Irrigation & Flood Control
5
V
Energy
6
VI
Industry & Minerals
7
VII
Transport
8
VIII
Science,Tech. & Environment
9
IX
General Economic Services
10
X
Social Service
11
XI
General Services
Page 52 of 89
SECTORAL DISTRICT PLANS/SCHEMES: 2011 - 12
I. AGRICULTURE AND ALLIED ACTIVITIES:
Agriculture continues to be the cornerstone of the state economy. State government is
implementing a road map for agricultural development since 2008. Road Map programmes
have brought agriculture on the priority agenda. It has started showing results in terms of
the increased food grain production and substantive improvement in the availability or use
of the quality agriculture inputs
(A) BIHAR RAJYA BEEJ NIGAM
Bihar Rajya Beej Nigam has to play an important role in achieving the seed replacement
rate targets envisaged in the road map. The Nigam requires assistance for seed
procurement, its processing, storage etc.
(B) SEED PRODUCTION ON GOVERNMENT FARMS
All the 5 government seed multiplication farms are now engaged in foundation/certified
seed production. The foundation seed produced on these farms are processed by BRBN and
it finds its use in CM Crash Seed programme.
(C) MAIZE & POULTRY TASK FORCE
On initiative of International Finance Corporation, a Maize & Poultry Task Force has been
constituted. To fund task force activities a new scheme has been proposed.
II. RURAL DEVELOPMENT:
The rural development department, which is the nodal department for implementation of
rural development programmes for enhancement of income and employment
opportunities and provision rural housing to the poor people has taken up programmes.
SWARNJAYANTI GRAM SWAROJGARYOJANA
This scheme was launched from April 1999, as a holistic programme covering all aspects of
self employment such as organization of the poor into self-help groups, training, credit,
technology, infrastructure and marketing, to bring the assisted poor families above the
poverty line in three years by providing them income generating assets through bank
credit and government subsidy. The Number of 111.90 lakh BPL families found in Bihar in
survey during 2007-08
INDIRA AWASYOJANA (IAY)
The Government of India in its determination to end all housing shortage in rural areas by
the end of the ninth plan diversified its flagship rural housing scheme for the BPL families
Page 53 of 89
as Indira AwasYojana, to tackle the problem of upgrading the unserviceable Kutcha houses
in rural areas and earmarked 20 percent of IAY funds for this purpose.
D.P.A.P. AND I.W.D.P
The Drought prone Area programme is currently oprational in Nalanda districts of the
state, wherein 3 watersheds are in process of development. These watershed projects, will
be completed and new watershed projects will be taken-up as the Planning Commission
has laid stress on schemes of public participation.
D.R.D.A. ADMINISTRATION AND BUILDING
The D.R.D.A. Administration scheme has been introduced from 1.4.1999, on the
recommendation of the Shanker Committee with the objective to strengthen the D.R.D.A.
and to make them more professional and effective in managing the anti-poverty
programmes.
III. SPECIAL AREA PROGRAMME:
After the bifurcation of the State, the major target groups have been the SCs & STs. The STs
are now only 0.91 percent of the total population of the State and SCs have population of
15.72% of the State.
There are a number of schemes for the SCs & STs for educational development, social
assistance and economic development. Dept. of SC & ST Welfare is the nodal department
for the implementation of SCSP and TSP,
SCA to TSA
This scheme is a 100% Govt. of India sponsored scheme. Under this scheme there is
provision to take up income generating schemes and infrastructure development scheme.
Out of the funds received from GOI, 70% of the funds are to be spent for income generating
activities and 30% for infrastructure development incidental to those income generating
activities.
IV. IRRIGATION AND FLOOD CONTROL
IRRIGATION SECTOR (MAJOR & MEDIUM IRRIGATION SCHEMES)
Under Major & Medium Irrigation Sector for Annual Plan 2011-12 different Source of
funding has been shown. Assembling the sectoral break-up of Irrigation sector, flood
sector, drainage sector and CADWM sector as mentioned in annual plan outlay for the
financial year 2011-12 of Water Resources Department has been formulated.
Page 54 of 89
V. ENERGY
Various institutions and programs are running in the areas of energy. The strategy would
be to improve quality production and transmission. Due weightage has been drawn upon
conventional and non-conventional energy as well.
VI. INDUSTRY AND MINERALS
HANDICRAFTS
It is an important scheme for the development of PashanShilp (Stoneware). The main
component of the scheme is to provide financial assistance and guidance to the
artisans/sculptures for their self-employment. Hundreds of trained artisans are earning
livelihood from the handicraft of PashanShilp. There is provision to impart training to 25
artisans in a year with a stipend of Rs. 500.00 per month per trainee.
VII. TRANSPORT
Mass interventions from state level and district level have been taken to strengthen the
sectoral infrastructure, institutions and facilities. Civil aviation, rail and waterways are
thrust areas besides intensifying roadways.
VIII. SCIENCE, TECHNOLOGY AND ENVIRONMENT
In order to make the economy knowledge based and sustain prosperity in the face of
accelerating global competition, there is a need to improve Technical Education system in
order to boost skills and innovation. This requires encouragement of innovative
applications of technology over entire range of economic activities.
Department has been making consistent effort to keep pace with the changing national science and technology scenario. Various programmes and activities are aimed at encouraging and promoting indigenous science and technology especially in technical education.
IX. GENERAL ECONOMIC SERVICES
STRENGTHENING OF PLANNING MACHINERY AT THE DISTRICT LEVEL
(Computerization, Capacity building and MIS based monitoring of Plan schemes):
To strengthen the Computer Cells at State and district level, Capacity building and MIS
based computer aided monitoring of Plan schemes are essential
.
Page 55 of 89
DISTRICT PLANNING COMMITTEE:
The District Planning Committee was constituted during the year 1999 under the Zila
Parisad and reconstituted from time to time according to the changing need. The President
of Zila Parisad of the district is the Chairman of the District Planning Committee.
The Committee has the following objectives:-
To prepare Perspective Plan of the District. To issue guidelines for decentralized Planning. To review the progress of Perspective Plan. To advise the different department of state to change the nature of Plans according
to the change and development in field of Science and Technology. Policy decision for Plan formulation in the light of resources available with the state
as well as economy of the State. To advise the state on such policy matters which will be helpful in creating the basic
infrastructure of the State
X. SOCIAL SERVICE
SECONDARY EDUCATION:
The Secondary level education provides an important link between the elementary and
higher education. It also serves as training ground for workforce. Senior secondary stage or
Intermediate stage is very important for skill development, because at this stage,
diversification of curriculum and selection of professional streams by students occur.
The success of Sarva Shiksha Abhiyan will mean that Secondary Education during the next
few years would face simultaneously strong pool for quantitative expansion and qualitative
improvement. The enrollment rate will increase and dropout rate will decrease. This would
create great demand for infrastructure facilities for secondary education. Due to global
competitiveness, industry, business and service sectors will demand for higher quality of
manpower. Secondary education is the single largest supplier of workforce in the country.
RAJBHASHA
For giving a new dimension to the development of Rajbhasha Hindi, it is necessary that
authors and government servants with excellent work in Hindi language should be
encouraged and rewarded, so that Hindi may become a symbol of our self respect and
language of common mass. Under the scheme of awards constituted by Rajbhasha
Directorate for the development of Hindi and Urdu, named awards (Namit Puraskar) have
also been included in this annual Plan (2011-12).
Page 56 of 89
In 1981, Urdu was adopted as second official language of the state and since then the
Government has to play an important role in the development and propagations of Urdu
language as well.
For the fulfillment of above objectives, the Department has plans to organize various
Conferences, Seminars, and Exhibitions etc. for the propagation of Rajbhasha Hindi and
Urdu. In addition to that, the Department proposes to publish/republish some
new/previously published books/dictionaries. The Department also proposes to purchase
modern and technical dictionaries of Urdu language as well as the books awarded at
national level.
For running Urdu Training Centers at headquarter and +field offices, a proposal have also
been retained this year i.e. 2011-12.
A special component scheme for the benefit of scheduled caste students has been started
since the year 2003-04. This scheme is also being proposed in this year 2011-12 for the
benefit of Scheduled Castes.
ART, CULTURE AND YOUTH SERVICES
DIRECTORATE OF YOUTH AFFAIRS & SPORTS
The Sports Policy of the state has been framed to facilitate over all development of sports
and Youth activities from grassroots level to national level and to create renaissance among
youth for sports. Efforts have been made to have the energy to the youth towards the
national building through their active participation in sports activities.
With a view to foster competition with other states in the field of sports and glorify the
state at the national map, the following schemes have been proposed
WATER SUPPLY AND SANITATION
The Public Health Engineering Department is the nodal agency for providing safe drinking
water and sanitation facilities in the rural areas of Bihar. Generally hand tube wells/drilled
tube wells are constructed and special repair of choked tube wells are done for drinking
water supply in rural areas. After enforcement of Panchayat Raj System in the state, the
responsibility of repair-maintenance of tube wells has been given to the Panchayats.
Execution of piped water supply in Urban, Semi-urban and rural areas are done by the
department. Water quality testing of drinking water and its remedial measures for quality
problem in rural areas also come under the purview of the department. Maintenance of
Rural water Supply, Urban water supply schemes and water supply & sanitary fitting to
Govt. buildings is under the jurisdiction of the department. In addition to these works,
department is also looking after the rural sanitation programme as per the guidelines of
Page 57 of 89
Govt. of India. Rural Sanitation Programme is being implemented by the District Water and
Sanitation Mission (DWSM).
INDIRA AWAS YOJANA
The Government of India in its determination to end all housing shortage in rural areas by
the end of the ninth plan diversified its flagship rural housing scheme for the BPL families
as Indira Awas Yojana, to tackle the problem of upgrading the unserviceable Kutcha houses
in rural areas and earmarked 20 percent of IAY funds for this purpose.
INFORMATION AND PUBLIC RELATIONS
1- The Department of Information and Public Relations is entrusted with the responsibility
of carrying the message of the Government to the people of the State and to give feedback
to the Government, regarding Government schemes and policies. The department also has
an educative role. The Government has to reach to the people to garner the cooperation of
the people in the implementation of measures related to the welfare of the population.
2-The Department educated people about various development and welfare measures
undertaken by the state government. It keeps public informed about the current measures
that are necessary for the maintenance of law and order. In order to fulfill this objective,
the department gathers information and feedback regarding various state activities. The
Department acts as a tool and catalyst in the developmental process of the state. Coverage
of the population of over eight crores of people through information network is a massive
job. The Department intends to achieve this job through various technologies of mass
media, both traditional and modern.
3-The Governmental of Bihar is undergoing a developmental metamorphosis. In this
changing scenario it is imperative that the changes being brought about, is made known
not only to the people inside Bihar, but also to the various stakeholders outside the state.
This requires special effort from the department, so that a congenial environment is built
for development investment. To achieve this end, a comprehensive mass awareness
campaign is to be carried out, both inside and outside the state.
SC & ST WELFARE
After the bifurcation of the State, the major target groups have been the SCs & STs. The STs
are now only 0.91 percent of the total population of the State and SCs have population of
15.72% of the State.
There are a number of schemes for the SCs & STs for educational development, social
assistance and economic development. Dept. of SC & ST Welfare is the nodal department
for the implementation of SCSP and TSP,
Page 58 of 89
ORGANISATION SET UP
The present organizational setup will need a huge revamping and a new setup for the
projects under SCSP and TSP will be proposed in the plan.
PROGRAMME OUTLINE:
WELFARE OF SCHEDULED CASTES
Stipend schemes will be the focus area during this plan period. Apart from that uniform to
girls’ schemes pre examination training scheme, Assistance to SCs under SC, ST prevention
of atrocities schemes shall be implemented with more sincerity.
STIPEND SCHEMES
Different stipend programmes such as school stipend, post matric stipend, technical
stipend, sports stipend, Mushahar/Bhuiya stipend for SC students are being run. The rates
of the stipend are fixed by the department. The Scheme Stipend rate are as follows.
(i) Class I to IV - Rs. 15.00 per month (ii) Class V to VI - Rs. 30.00 per month (iii) Class VII to X – Rs. 55.00 per month The rate of Post Matric Stipend is fixed as per the norms of GoI.
DEVELOPMENT OF OBC & EBC
Social empowerment of backward and most backward classes is aimed at removing all
persisting inequalities and disparities, especially in the areas of education and access to
basic minimum services. Towards improving the educational level of backward classes,
stipend schemes and establishment of residential schools have been accorded priority.
LABOUR EMPLOYMENT
Department of Labour Resources has been mandated to perform the task relating to
maintenance of industrial peace and labour welfare including enforcement of labour laws,
skill up gradation of the youth with a view to increase their employability in the labour
market, establishing linkages between the employable and the job market through the
mechanism of Employment Exchanges, and taking care of the medical needs of the Insured
Persons (IPs) and their families under the ESI Act. However, a paradigm shift has taken
place in the approach to be followed in performing the aforesaid mandate since early
nineties. The role labour laws play has been perceived differently by different social
stakeholders, notably, the employers and employees.
With the advent of new economic policy in the early 90's and policies of carrying out
reforms in every sector of India's economy, the perceptions have converged at least to one
realization that labour laws needs be simplified to spur growth and generate employment
rather than merely protecting the well-entrenched interests of the workers engaged in the
organized sector, and issues confronting the vulnerable sections of the labour be addressed
through effective implementation of labour laws and focused welfare policies; a realization
Page 59 of 89
has dawned upon all the stakeholders that most vulnerable sections of the labour
resources, e.g., child labour, women, bonded labour, migrant labour and vast mass of labour
working in the unorganized of informal sector need special attention.
LABOUR WING
ORGANIZATION OF TRAINING CAMPS FOR RURAL AND UNORGANIZED WORKERS
The workers of rural areas and unorganized sector remain ignorant about their legal rights
under various labour laws and unaware about the rates of minimum wages fixed by the
Government due to illiteracy and other reasons. It makes them to be devoid of the due
benefits which are available to them under the laws. Hence, there is a need to train and
empower these workers in a concerted way by organizing special camps.
It is planned to organize training camps for rural workers at district level for all the 38
districts participated by workers drawn from every panchayat of that district. While
selecting the participant workers for the training camps, preference would be given to the
women/SC/ST workers. Currently we have 8463 panchayats in the State, hence it is
planned to train these number of workers in a year.
XI. GENERAL SERVICES
JAIL
The Central scheme of prison modernization has come to end. The extra fund to the tune of
Rs. 120 crore is now required to complete the pending works.
FINANCE DEPARTMENT MODERNIZATION
Finance Department will be modernized and renovated with modular furniture for placing
the working personnel and employees with better working environment. It will enhance
the efficiencies of the employees.
PUBLIC WORKS
The Building department meets the demand of various government departments by
constructing administrative buildings, residential buildings for officers and staffs, court
building and residential buildings for judiciary etc.
The main objective of the department is to reduce the gap between demand and supply of
administrative and residential buildings. The plan schemes are but only for those buildings
which are executed by the department. Apart from this, this is the nodal agency for all
building construction activities of the government. The department undertakes building
construction from design to construction and finishing of the government buildings of the
state. It shall be the main objectives of the department to deliver these services in time to
other government departments.
Page 60 of 89
With the increase in the development activities, in the course of various five years Plans,
the activities of Public Works (Building) Department have increased manifold. This
department meets the demand of various government departments by constructing
administrative buildings, residential buildings for officers and staffs, court buildings and
residential buildings for judiciary etc.
JUDICIAL BUILDING
District Judges Courts Building and presiding officer’s courts building are to be constructed
in Nalanda and some sub-divisional courts buildings are also to be constructed.
EXCISE
The Department of Excise and Prohibition is responsible for realization of revenue from the
sale of excisable articles. The department takes preventive steps to stop inter district
smuggling, tax evasion, illicit distillation and black marketing of excise revenue. Excise
cases are detected with the help of district administration and public personnel.
MINORITY FINANCING
In order to help preserve the culture and language of religions and linguistic minorities, the
Department of Minority Welfare undertakes targeted programmes. The Government is
committed to the welfare of minorities in the state. Under this sector, the Department
proposes to computerize survey of minority properties and its development. The
department provides scholarships, and coaching for minority students preparing for the
Public Service Commission and other competitive examinations. It’s also makes
arrangements for vocational training for artisans, skilled labourers and female
entrepreneurs.
The strategy consists of (i) strengthening infrastructure to assist minority students
preparing for competitive examination; (ii) looking after the welfare of minority women,
mainly divorced women, who need to be helped economically for self employment. (iii)
Computerizing the survey of wakf property and making arrangement for its development.
(iv) Scholarship and one time grant to the Minority Student after passing the level of class X
& XII to continue their further studies. (v) To facilitate skilled and semi skilled workers by
further giving them training after providing stipend and then to provide loan for self
employment through Bihar State Minority Financial Corporation. (VI) Providing vocational
training to the artisan and low level educated Muslim with facility of loan to them from
Bihar State Minority Financial Corporation for self employment (VII) Establishing Maulana
Azad Residential Training School for Minority Boys & Girls in districts and pockets of some
of blocks where there is concentration of Muslim population.
Page 61 of 89
BRIEF MINORITY BENIFIT
1- MUKHMANTRI SHARAM SHAKTI YOJANA
Under the scheme the minority artisan and literate labour will be trained to upgrade their
artistic and technical skill for which stipend of Rs.1500-2000 per month per person may be
given by the state govt. and after the training is over, they may be provided with a loan of
Rs. 50,000/- by Bihar State Minority Financial Corporation for their self employment.
2- CONSTRUCTION OF HOSTELS FOR MINORITY STUDENTS (BOYS & GIRLS)
Maintenance and Furnishing: The Department constructs and maintains hostels for
minority students (boys and girls). In Annual plan 2011-12, there is a proposal to carry out
maintenance and furnishing of these hostels.
3. CONSTRUCTION OF MONUMENTS IN THE NAME OF GREAT PERSONALITIES BELONGING TO
MINORITY COMMUNITIES
4. STATE SHARE FOR EQUITY PARTICIPATION OF FOR THE NATIONAL MINORITY DEVELOPMENT
FINANCIAL CORPORATION
The National Minority Development Financial Cooperation provide loans to needy artisans
and self-employed in the minority community.
5. SHARE CAPITAL OF THE STATE TO MINORITY FINANCIAL CORPORATION
Assistance to help carry out activities of the State Minority Financial Corporation.
6. COMPUTERIZATION OF THE SURVEY OF WAQF PROPERTIES
The date base on waqf Board properties will require computerization on a big scale.
7. SCHOLARSHIPS FOR COLLEGE STUDENTS ON THE BASIS OF MERIT-CUM-POVERTY BASIS
Scholarships are given to meritorious students of the minority community for their
education
8. MAINTENANCE AND PROTECTION OF WAKF PROPERTIES
Properties of the Waqf Board need to be maintained and protected so that they can serve
members of the minority community.
9. GRANT-IN-AID AS REVOLVING FUND TO STATE WAQF BOARD FOR DEVELOPING OF WAQF
PROPERTIES
The government provides grant-in-aid to the corpus fund for developing waqf properties.
10. FINANCIAL ASSISTANCE TO DIVORCED MUSLIM WOMEN
A Scheme to financially assist to divorced Muslim women procures gainful self-
employment will be routed through the Waqf Board.
Page 62 of 89
11. MUKHMANTRI VIDYARTH PROTSAHAN YOJANA
All minority students who have passed with first division from Bihar School Examination
Board in 2007 and onwards will be given 10,000/- per student only one time from
Mukhmantri Vidyarth Protsahan Yojana. This will be given on certain criteria to such
students continuing their further studies.
12. COACHING FOR STUDENTS FOR BELONGING TO MINORITY COMMUNITY PREPARATION OF
COMPETITIVE EXAMINATION OF PUBLIC SERVICE COMMISSION
The Department provides aspirants with scholarship to help them to prepare for
competitive examination of the public service commission.
13. TRAINING OF MINORITY ARTISAN AND LITERATE YOUTH
14. PRE METRIC SCHOLARSHIP (CSP)
Outlay of the 25% state Share for Pre Metric Scholarship (CSP)
15. MULTI SECTORAL DEVELOPMENT PLAN (CSP)
Outlay of the 30-35% state Share for Multi Sectoral Development Plan (CSP)
LAW
The Law Department regulates and co-ordinate the legal functions of the State. It also
guides and advises to all the department of the State where legal points are involved. The
size of the annual plan outlay of the Law Department is not very large like other works
department simply because it is not a scheme implementing department. In order to
strengthen the legal and judicial administration in the State Law Department is
implementing some selected centrally sponsored scheme like Fast Track Courts and Family
courts as well as state sponsored scheme like construction of Bihar Judicial Academy,
construction of Judicial Building and construction of additional Building for the Advocate.
REGISTRATION
The key function of Registration Department is the Registration of various kinds of
documents. The Stamp duty and Registration Fees Chargeable on documents are main
sources of revenue.
BIHAR RURAL LIVELIHOOD PROJECT (JEEVIKA)
Jeevika-Bihar Rural Livelihood Project (BRLP) is a World Bank assisted project designed to
address rural poverty in Bihar through the collaboration of the poor, the Government of
Bihar and the World Bank. The main objective of the Project is to enhance social and
economic empowerment of the rural poor people.
Page 63 of 89
INFORMATION AND PUBLIC RELATIONS
The Department of Information and Public Relations is entrusted with the responsibility of
carrying the message of the Government to the people of the State and to give feedback to
the Government, regarding Government schemes and policies. The department also has an
educative role. The Government has to reach to the people to garner the cooperation of the
people in the implementation of measures related to the welfare of the population.
COMMERCIAL TAXES
The plans such as, the residential problems of Officers and Staffs, the Construction of Office building, the renovation, alteration and modification of damaged buildings and construction of boundary walls which enhance the tax collection efficiency and deter tax evasion have been included in the Annual Plan 2011-12.

Page 64 of 89
CHAPTER V
SCHEDULED CASTE SUB PLAN: 2011 - 12
SCHEDULED CASTE SUB PLAN: 2011 – 12
INTRODUCTION:
The Scheduled caste population of the district is 473786 constituting 20% of the total population of the district. Majority of the workers in Scheduled caste communities are agricultural labourers. Most of the cultivators among the Scheduled castes are marginal farmers, share croppers and small farmers. Other occupational groups are weavers, sweeper and cobblers. As per DISE report during 2009-10 the GER (SC) for Primary school was 91.67. During 2009-10 the GER (SC) for Upper Primary school was 50.7. Improvement in the category of SC enrolment is in improving trend. Lack of awareness among the Scheduled castes about their civil rights and lack of desired economic development make these communities vulnerable to social discrimination. A Central Act namely, the Scheduled Caste and Scheduled Tribes (Prevention of Atrocities) Act. 1989 has been enacted for prevention of atrocities on Scheduled Caste and Scheduled Tribes. The people of this community suffer from several economic disadvantages. They are counted as socially, educationally and economically disadvantaged group of the society. Spread of literacy and education among the scheduled caste persons is another positive indication of development. Besides the regulatory measures, beneficiary oriented programs are being taken up necessary flow of benefits to this weaker section of the district, for their socio‐economic development. The special component plan for SCs has been renamed as Scheduled Caste Sub‐plan is not area specific.
OBJECTIVES:
The broad objectives of the SCSP are as stated below:
1. Raising Socio‐economic condition of the SCs and reducing poverty. 2. Creating/increasing capability for self‐employment / wage employment of the SCs
in order to bring their income level at par with general population. 3. Up gradation of traditional skills of occupational groups. 4. Developing critical infrastructure including communication etc. 5. Providing free access to education, health and housing. 6. Providing basic minimum services to improve the quality of their lives. 7. Empowerment through legislative and regulatory measures. 8. Elimination of scavenging.
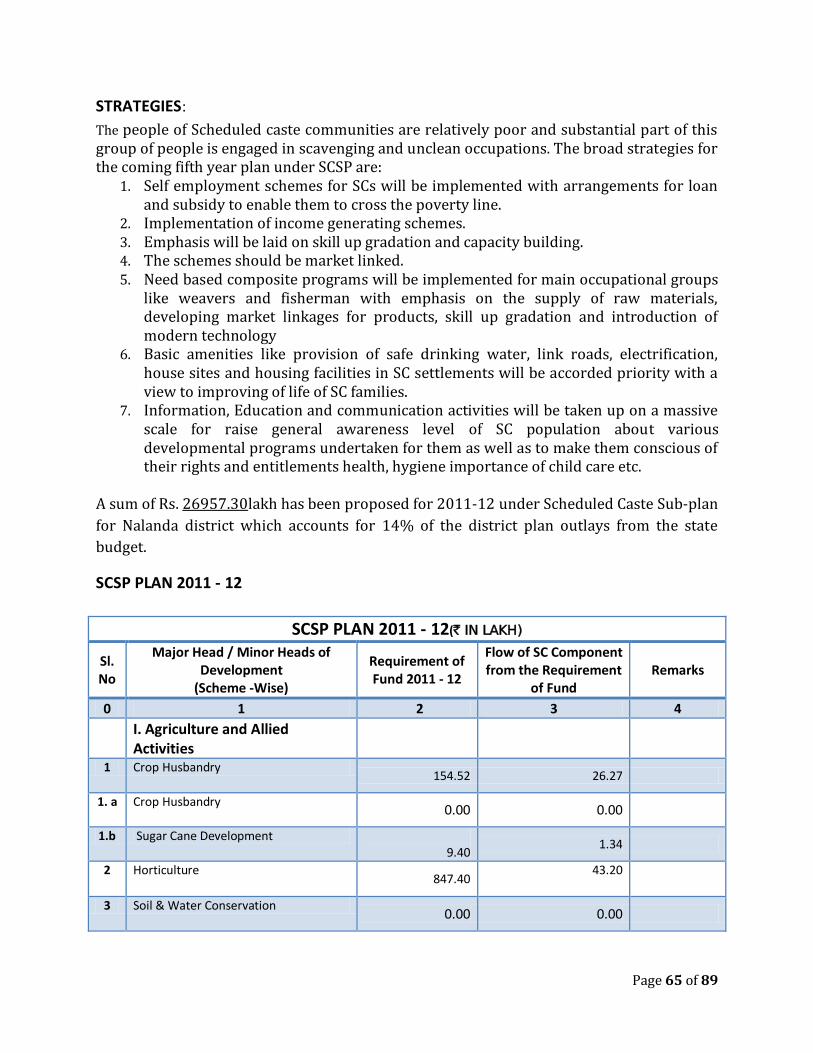
Page 65 of 89
STRATEGIES:
The people of Scheduled caste communities are relatively poor and substantial part of this group of people is engaged in scavenging and unclean occupations. The broad strategies for the coming fifth year plan under SCSP are:
1. Self employment schemes for SCs will be implemented with arrangements for loan and subsidy to enable them to cross the poverty line.
2. Implementation of income generating schemes. 3. Emphasis will be laid on skill up gradation and capacity building. 4. The schemes should be market linked. 5. Need based composite programs will be implemented for main occupational groups
like weavers and fisherman with emphasis on the supply of raw materials, developing market linkages for products, skill up gradation and introduction of modern technology
6. Basic amenities like provision of safe drinking water, link roads, electrification, house sites and housing facilities in SC settlements will be accorded priority with a view to improving of life of SC families.
7. Information, Education and communication activities will be taken up on a massive scale for raise general awareness level of SC population about various developmental programs undertaken for them as well as to make them conscious of their rights and entitlements health, hygiene importance of child care etc.
A sum of Rs. 26957.30lakh has been proposed for 2011‐12 under Scheduled Caste Sub‐plan
for Nalanda district which accounts for 14% of the district plan outlays from the state
budget.
SCSP PLAN 2011 - 12
SCSP PLAN 2011 - 12(` IN LAKH)
Sl. No
Major Head / Minor Heads of Development
(Scheme -Wise)
Requirement of Fund 2011 - 12
Flow of SC Component from the Requirement
of Fund Remarks
0 1 2 3 4 I. Agriculture and Allied
Activities
1 Crop Husbandry 154.52 26.27
1. a Crop Husbandry 0.00 0.00
1.b Sugar Cane Development 9.40
1.34
2 Horticulture 847.40
43.20
3 Soil & Water Conservation 0.00 0.00
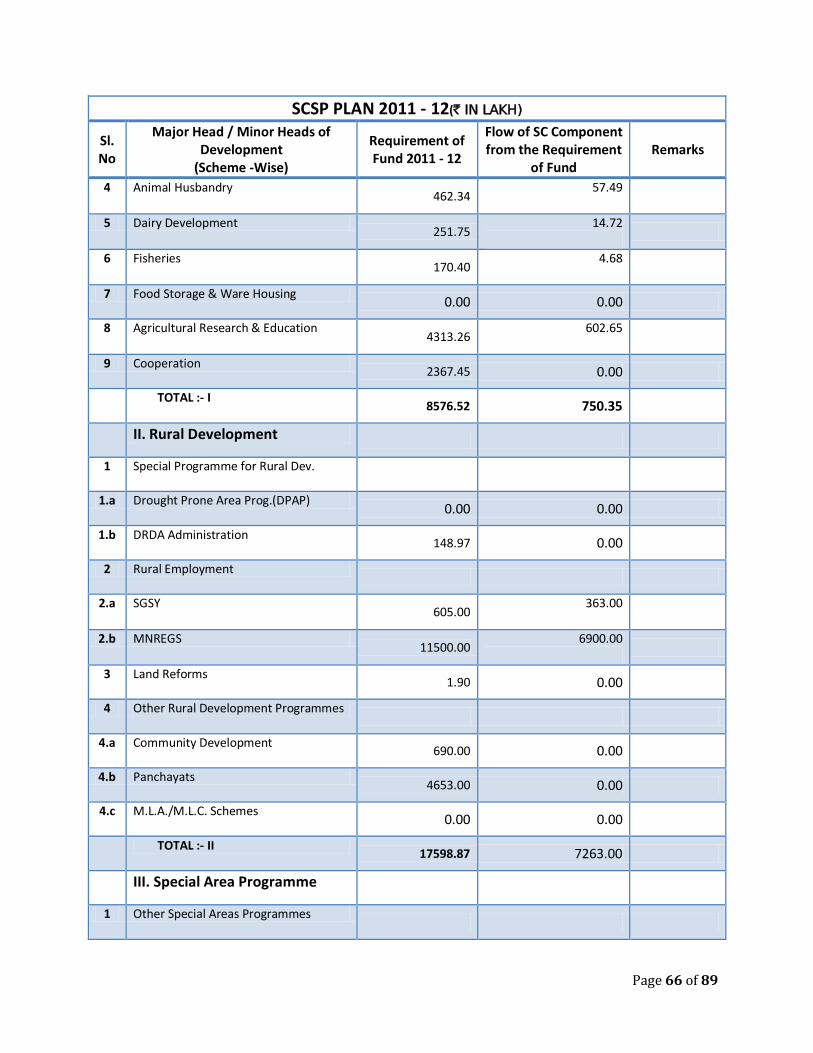
Page 66 of 89
SCSP PLAN 2011 - 12(` IN LAKH)
Sl. No
Major Head / Minor Heads of Development
(Scheme -Wise)
Requirement of Fund 2011 - 12
Flow of SC Component from the Requirement
of Fund Remarks
4 Animal Husbandry 462.34
57.49
5 Dairy Development 251.75
14.72
6 Fisheries 170.40
4.68
7 Food Storage & Ware Housing 0.00 0.00
8 Agricultural Research & Education 4313.26
602.65
9 Cooperation 2367.45 0.00
TOTAL :- I 8576.52 750.35
II. Rural Development
1 Special Programme for Rural Dev.
1.a Drought Prone Area Prog.(DPAP) 0.00 0.00
1.b DRDA Administration 148.97 0.00
2 Rural Employment
2.a SGSY 605.00
363.00
2.b MNREGS 11500.00
6900.00
3 Land Reforms 1.90 0.00
4 Other Rural Development Programmes
4.a Community Development 690.00 0.00
4.b Panchayats 4653.00 0.00
4.c M.L.A./M.L.C. Schemes 0.00 0.00
TOTAL :- II 17598.87 7263.00
III. Special Area Programme
1 Other Special Areas Programmes
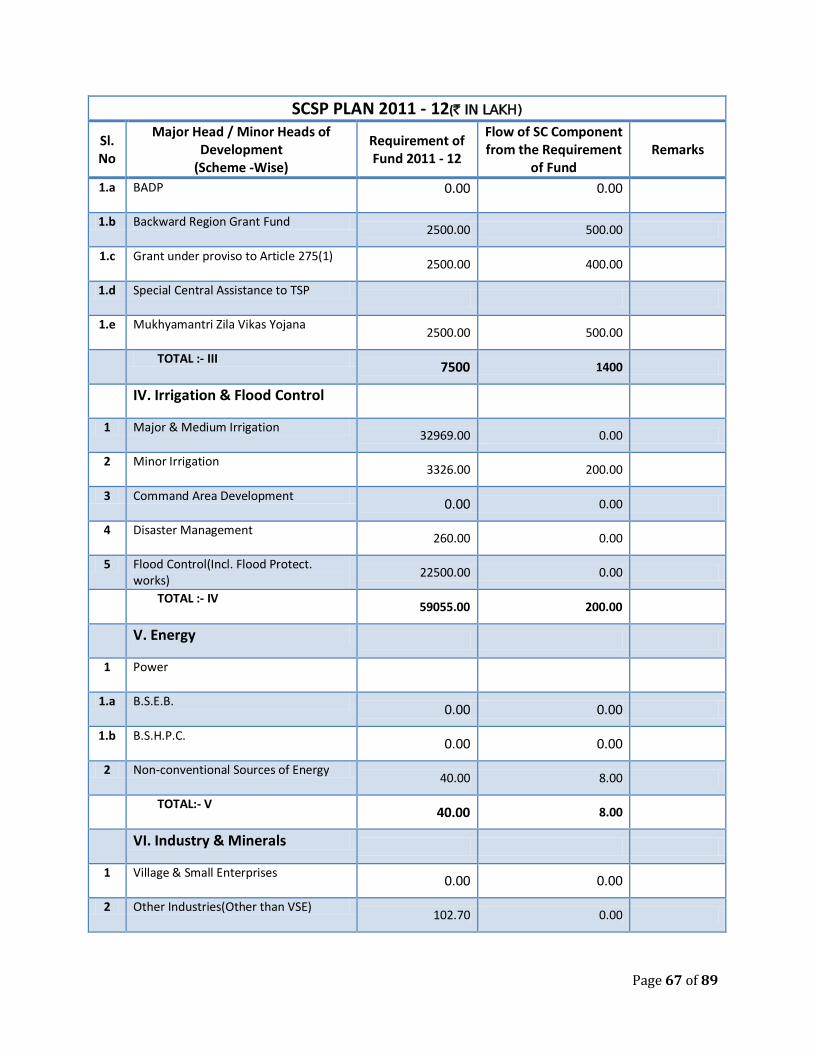
Page 67 of 89
SCSP PLAN 2011 - 12(` IN LAKH)
Sl. No
Major Head / Minor Heads of Development
(Scheme -Wise)
Requirement of Fund 2011 - 12
Flow of SC Component from the Requirement
of Fund Remarks
1.a BADP 0.00 0.00
1.b Backward Region Grant Fund 2500.00 500.00
1.c Grant under proviso to Article 275(1) 2500.00 400.00
1.d Special Central Assistance to TSP
1.e Mukhyamantri Zila Vikas Yojana 2500.00 500.00
TOTAL :- III 7500 1400
IV. Irrigation & Flood Control
1 Major & Medium Irrigation 32969.00 0.00
2 Minor Irrigation 3326.00 200.00
3 Command Area Development 0.00 0.00
4 Disaster Management 260.00 0.00
5 Flood Control(Incl. Flood Protect. works)
22500.00 0.00
TOTAL :- IV 59055.00 200.00
V. Energy
1 Power
1.a B.S.E.B. 0.00 0.00
1.b B.S.H.P.C. 0.00 0.00
2 Non-conventional Sources of Energy 40.00 8.00
TOTAL:- V 40.00 8.00
VI. Industry & Minerals
1 Village & Small Enterprises 0.00 0.00
2 Other Industries(Other than VSE) 102.70 0.00
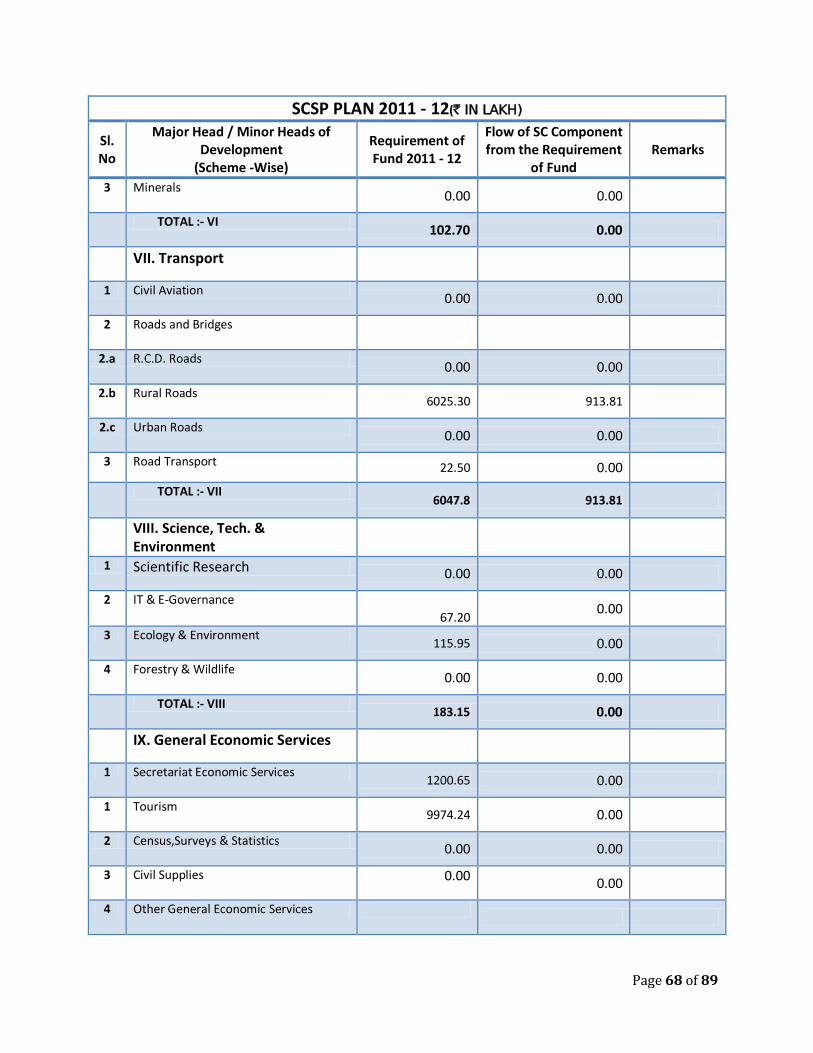
Page 68 of 89
SCSP PLAN 2011 - 12(` IN LAKH)
Sl. No
Major Head / Minor Heads of Development
(Scheme -Wise)
Requirement of Fund 2011 - 12
Flow of SC Component from the Requirement
of Fund Remarks
3 Minerals 0.00 0.00
TOTAL :- VI 102.70 0.00
VII. Transport
1 Civil Aviation 0.00 0.00
2 Roads and Bridges
2.a R.C.D. Roads 0.00 0.00
2.b Rural Roads 6025.30 913.81
2.c Urban Roads 0.00 0.00
3 Road Transport 22.50 0.00
TOTAL :- VII 6047.8 913.81
VIII. Science, Tech. & Environment
1 Scientific Research 0.00 0.00
2 IT & E-Governance 67.20
0.00
3 Ecology & Environment 115.95 0.00
4 Forestry & Wildlife 0.00 0.00
TOTAL :- VIII 183.15 0.00
IX. General Economic Services
1 Secretariat Economic Services 1200.65 0.00
1 Tourism 9974.24 0.00
2 Census,Surveys & Statistics 0.00 0.00
3 Civil Supplies 0.00 0.00
4 Other General Economic Services
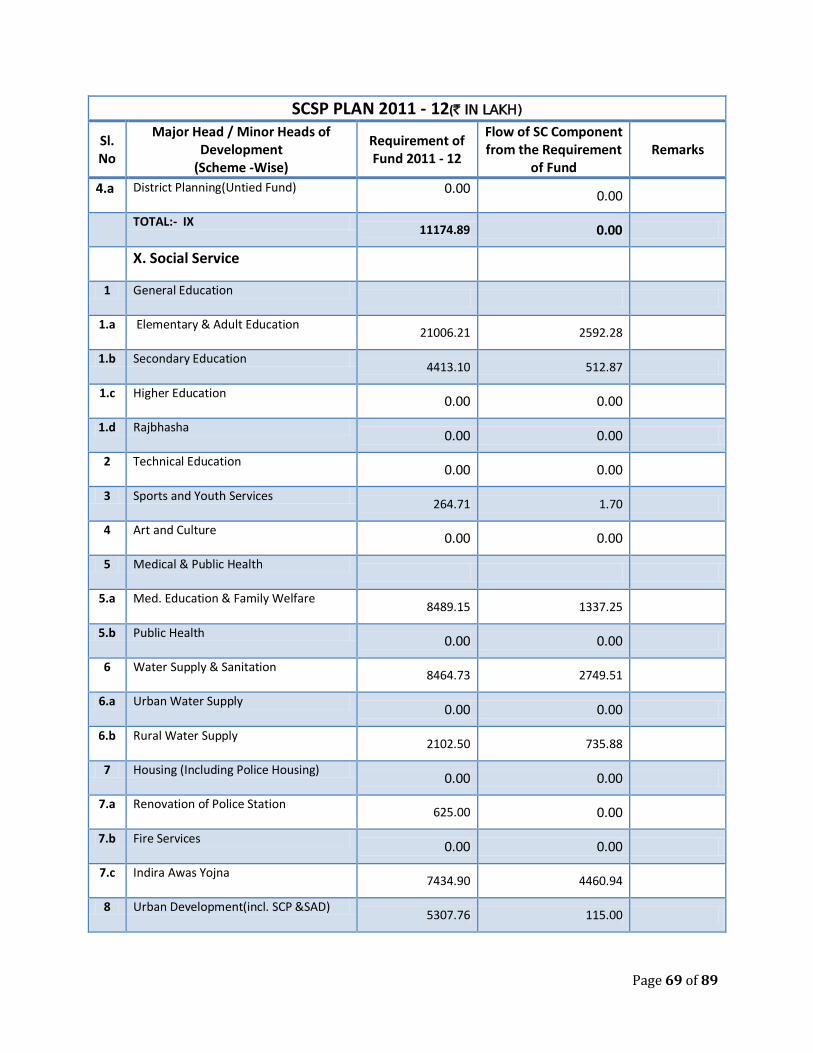
Page 69 of 89
SCSP PLAN 2011 - 12(` IN LAKH)
Sl. No
Major Head / Minor Heads of Development
(Scheme -Wise)
Requirement of Fund 2011 - 12
Flow of SC Component from the Requirement
of Fund Remarks
4.a District Planning(Untied Fund) 0.00 0.00
TOTAL:- IX 11174.89 0.00
X. Social Service
1 General Education
1.a Elementary & Adult Education 21006.21 2592.28
1.b Secondary Education 4413.10 512.87
1.c Higher Education 0.00 0.00
1.d Rajbhasha 0.00 0.00
2 Technical Education 0.00 0.00
3 Sports and Youth Services 264.71 1.70
4 Art and Culture 0.00 0.00
5 Medical & Public Health
5.a Med. Education & Family Welfare 8489.15 1337.25
5.b Public Health 0.00 0.00
6 Water Supply & Sanitation 8464.73 2749.51
6.a Urban Water Supply 0.00 0.00
6.b Rural Water Supply 2102.50 735.88
7 Housing (Including Police Housing) 0.00 0.00
7.a Renovation of Police Station 625.00 0.00
7.b Fire Services 0.00 0.00
7.c Indira Awas Yojna 7434.90 4460.94
8 Urban Development(incl. SCP &SAD) 5307.76 115.00
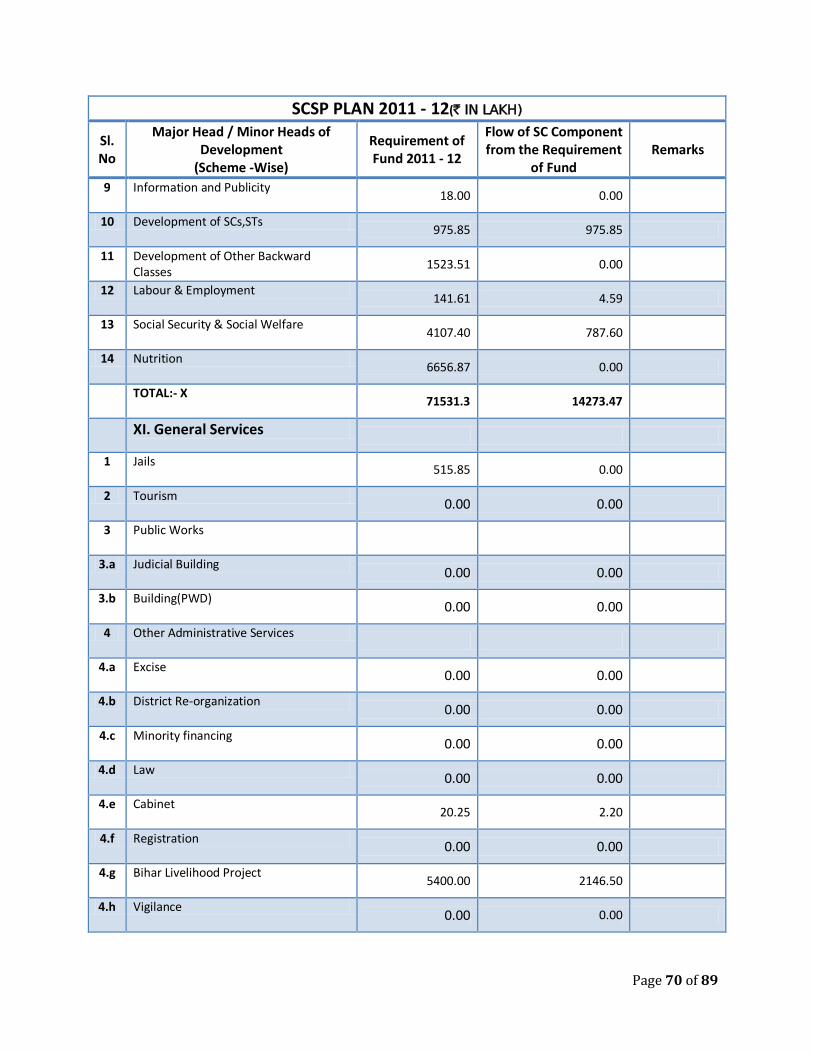
Page 70 of 89
SCSP PLAN 2011 - 12(` IN LAKH)
Sl. No
Major Head / Minor Heads of Development
(Scheme -Wise)
Requirement of Fund 2011 - 12
Flow of SC Component from the Requirement
of Fund Remarks
9 Information and Publicity 18.00 0.00
10 Development of SCs,STs 975.85 975.85
11 Development of Other Backward Classes
1523.51 0.00
12 Labour & Employment 141.61 4.59
13 Social Security & Social Welfare 4107.40 787.60
14 Nutrition 6656.87 0.00
TOTAL:- X 71531.3 14273.47
XI. General Services
1 Jails 515.85 0.00
2 Tourism 0.00 0.00
3 Public Works
3.a Judicial Building 0.00 0.00
3.b Building(PWD) 0.00 0.00
4 Other Administrative Services
4.a Excise 0.00 0.00
4.b District Re-organization 0.00 0.00
4.c Minority financing 0.00 0.00
4.d Law 0.00 0.00
4.e Cabinet 20.25 2.20
4.f Registration 0.00 0.00
4.g Bihar Livelihood Project 5400.00 2146.50
4.h Vigilance 0.00 0.00
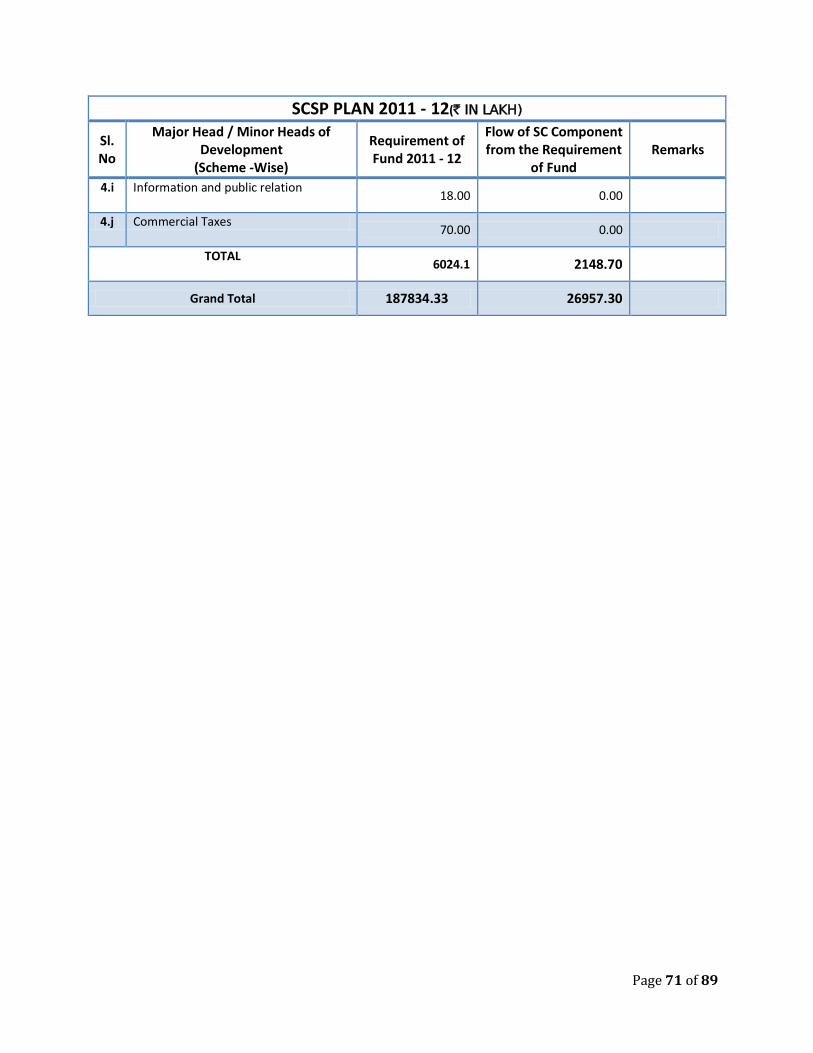
Page 71 of 89
SCSP PLAN 2011 - 12(` IN LAKH)
Sl. No
Major Head / Minor Heads of Development
(Scheme -Wise)
Requirement of Fund 2011 - 12
Flow of SC Component from the Requirement
of Fund Remarks
4.i Information and public relation 18.00 0.00
4.j Commercial Taxes 70.00 0.00
TOTAL 6024.1 2148.70
Grand Total 187834.33 26957.30
Page 72 of 89
CHAPTER VI TRIBAL SUB PLAN (TSP): 2011 - 12
TRIBAL SUB PLAN (TSP): 2011 – 12
INTRODUCTION:
As per Census 2001, the Scheduled tribe population of the district is 970 constituting
0.01% of the total population of the district. Majority of the workers in Scheduled tribes
communities are agricultural labourers. Most of the cultivators among the Scheduled tribes
are marginal farmers, share croppers and small farmers. Lack of awareness among the
Scheduled tribes about their civil rights and lack of desired economic development make
these communities vulnerable to social discrimination. A Central Act namely, the Scheduled
Caste and Scheduled Tribes (Prevention of Atrocities) Act. 1989 has been enacted for
prevention of atrocities on Scheduled Caste and Scheduled Tribes. The people of this
community suffer from several economic disadvantages. They are counted as socially,
educationally and economically disadvantaged group of the society. Spread of literacy and
education among the scheduled tribes persons is another positive indication of
development. Besides the regulatory measures, beneficiary oriented programs are being
taken up necessary flow of benefits to this weaker section of the district, for their
socio‐economic development. The special component plan for STs has been renamed as
Tribal Sub‐plan.
OBJECTIVES:
The broad objectives of the TSP are as stated below:
STRATEGIES:
The people of Scheduled tribe communities are relatively poor and substantial part of this
group of people is engaged in scavenging and unclean occupations. The broad strategies for
the coming fifth year plan under TSP would devised to meet the needs of the particular
population.
A sum of Rs. 330.42 lakh has been proposed for 2011‐12 under TSP for Nalanda district
which accounts for 0.18% of the district plan outlays from the state budget.
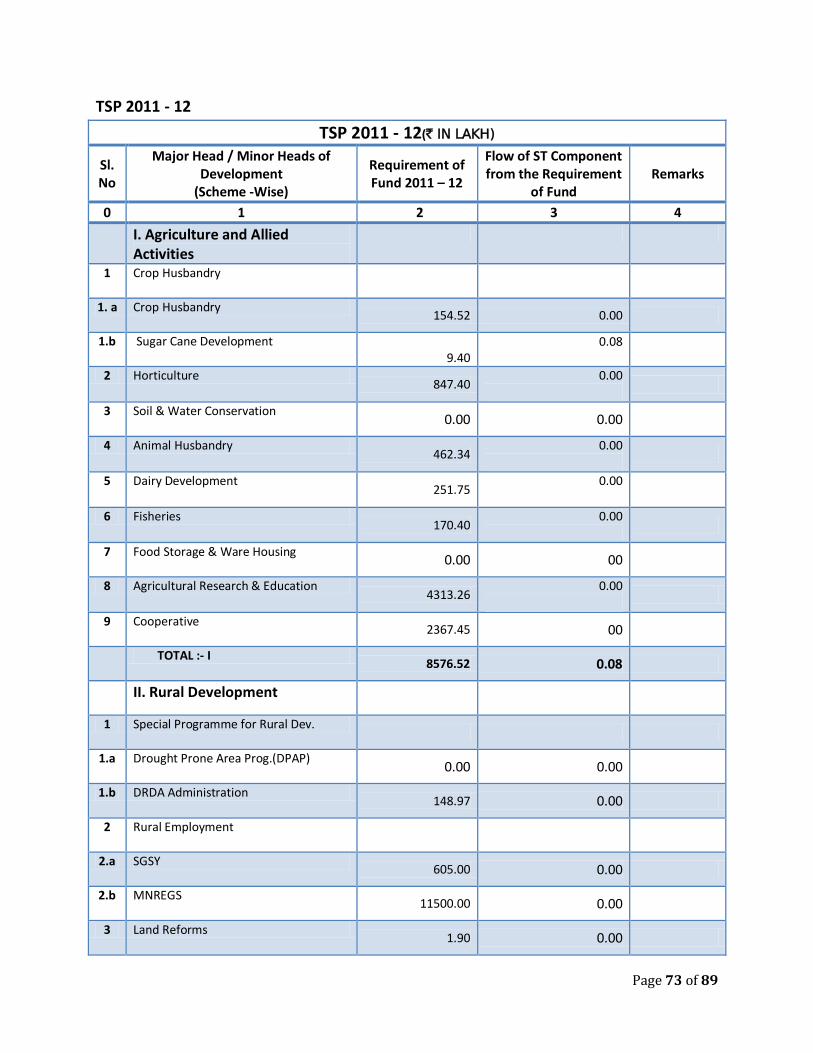
Page 73 of 89
TSP 2011 - 12
TSP 2011 - 12(` IN LAKH)
Sl. No
Major Head / Minor Heads of Development
(Scheme -Wise)
Requirement of Fund 2011 – 12
Flow of ST Component from the Requirement
of Fund Remarks
0 1 2 3 4
I. Agriculture and Allied Activities
1 Crop Husbandry
1. a Crop Husbandry 154.52 0.00
1.b Sugar Cane Development 9.40
0.08
2 Horticulture 847.40
0.00
3 Soil & Water Conservation 0.00 0.00
4 Animal Husbandry 462.34
0.00
5 Dairy Development 251.75
0.00
6 Fisheries 170.40
0.00
7 Food Storage & Ware Housing 0.00 00
8 Agricultural Research & Education 4313.26
0.00
9 Cooperative 2367.45 00
TOTAL :- I 8576.52 0.08
II. Rural Development
1 Special Programme for Rural Dev.
1.a Drought Prone Area Prog.(DPAP) 0.00 0.00
1.b DRDA Administration 148.97 0.00
2 Rural Employment
2.a SGSY 605.00 0.00
2.b MNREGS 11500.00 0.00
3 Land Reforms 1.90 0.00
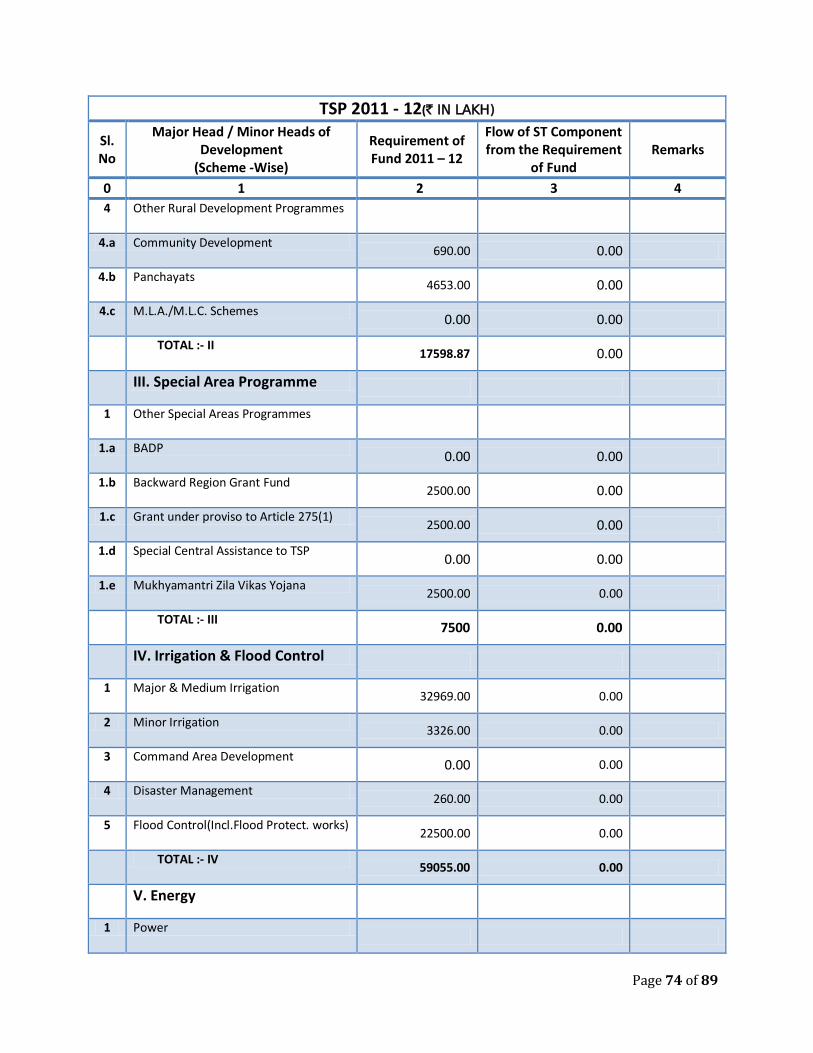
Page 74 of 89
TSP 2011 - 12(` IN LAKH)
Sl. No
Major Head / Minor Heads of Development
(Scheme -Wise)
Requirement of Fund 2011 – 12
Flow of ST Component from the Requirement
of Fund Remarks
0 1 2 3 4
4 Other Rural Development Programmes
4.a Community Development 690.00 0.00
4.b Panchayats 4653.00 0.00
4.c M.L.A./M.L.C. Schemes 0.00 0.00
TOTAL :- II 17598.87 0.00
III. Special Area Programme
1 Other Special Areas Programmes
1.a BADP 0.00 0.00
1.b Backward Region Grant Fund 2500.00 0.00
1.c Grant under proviso to Article 275(1) 2500.00 0.00
1.d Special Central Assistance to TSP 0.00 0.00
1.e Mukhyamantri Zila Vikas Yojana 2500.00 0.00
TOTAL :- III 7500 0.00
IV. Irrigation & Flood Control
1 Major & Medium Irrigation 32969.00 0.00
2 Minor Irrigation 3326.00 0.00
3 Command Area Development 0.00 0.00
4 Disaster Management 260.00 0.00
5 Flood Control(Incl.Flood Protect. works) 22500.00 0.00
TOTAL :- IV 59055.00 0.00
V. Energy
1 Power
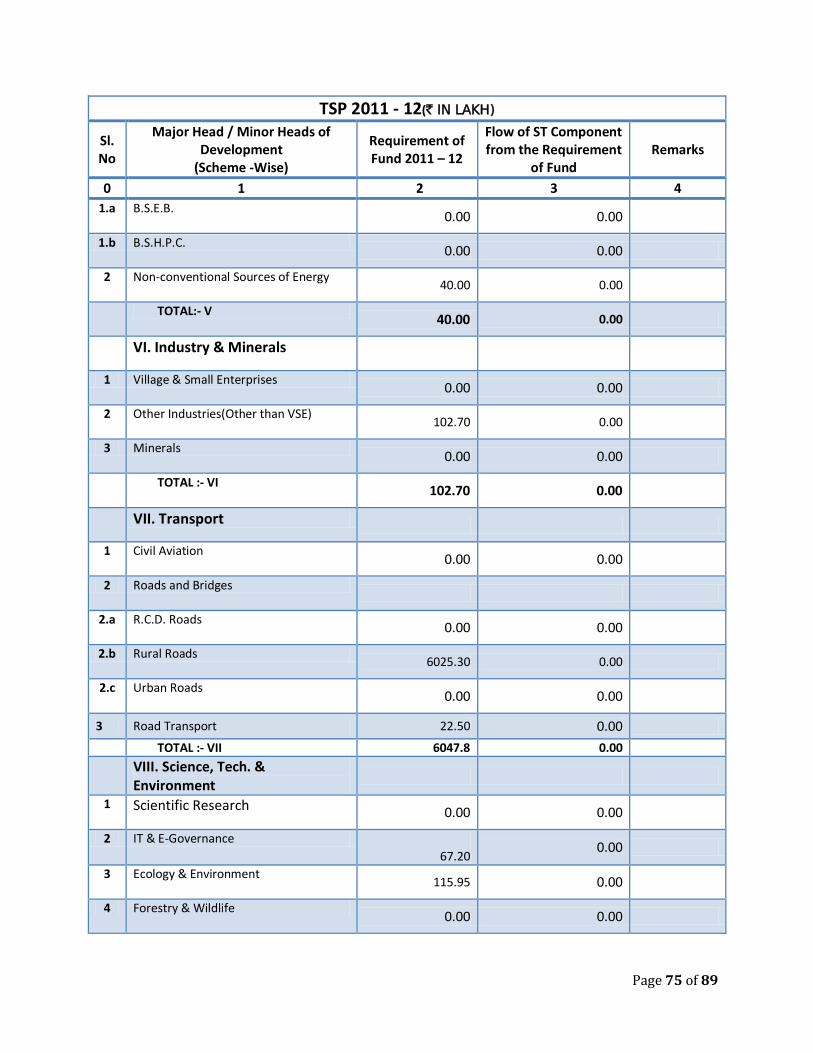
Page 75 of 89
TSP 2011 - 12(` IN LAKH)
Sl. No
Major Head / Minor Heads of Development
(Scheme -Wise)
Requirement of Fund 2011 – 12
Flow of ST Component from the Requirement
of Fund Remarks
0 1 2 3 4
1.a B.S.E.B. 0.00 0.00
1.b B.S.H.P.C. 0.00 0.00
2 Non-conventional Sources of Energy 40.00 0.00
TOTAL:- V 40.00 0.00
VI. Industry & Minerals
1 Village & Small Enterprises 0.00 0.00
2 Other Industries(Other than VSE) 102.70 0.00
3 Minerals 0.00 0.00
TOTAL :- VI 102.70 0.00
VII. Transport
1 Civil Aviation 0.00 0.00
2 Roads and Bridges
2.a R.C.D. Roads 0.00 0.00
2.b Rural Roads 6025.30 0.00
2.c Urban Roads 0.00 0.00
3 Road Transport 22.50 0.00
TOTAL :- VII 6047.8 0.00
VIII. Science, Tech. & Environment
1 Scientific Research 0.00 0.00
2 IT & E-Governance 67.20
0.00
3 Ecology & Environment 115.95 0.00
4 Forestry & Wildlife 0.00 0.00
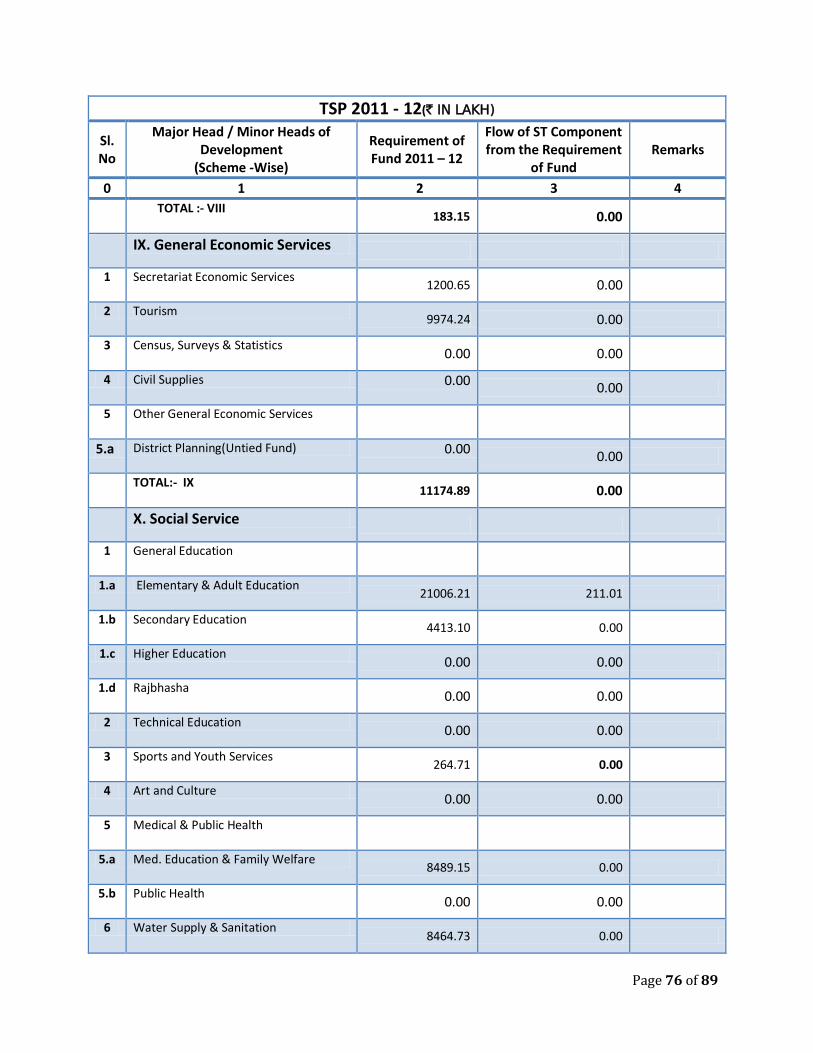
Page 76 of 89
TSP 2011 - 12(` IN LAKH)
Sl. No
Major Head / Minor Heads of Development
(Scheme -Wise)
Requirement of Fund 2011 – 12
Flow of ST Component from the Requirement
of Fund Remarks
0 1 2 3 4
TOTAL :- VIII 183.15 0.00
IX. General Economic Services
1 Secretariat Economic Services 1200.65 0.00
2 Tourism 9974.24 0.00
3 Census, Surveys & Statistics 0.00 0.00
4 Civil Supplies 0.00 0.00
5 Other General Economic Services
5.a District Planning(Untied Fund) 0.00 0.00
TOTAL:- IX 11174.89 0.00
X. Social Service
1 General Education
1.a Elementary & Adult Education 21006.21 211.01
1.b Secondary Education 4413.10 0.00
1.c Higher Education 0.00 0.00
1.d Rajbhasha 0.00 0.00
2 Technical Education 0.00 0.00
3 Sports and Youth Services 264.71 0.00
4 Art and Culture 0.00 0.00
5 Medical & Public Health
5.a Med. Education & Family Welfare 8489.15 0.00
5.b Public Health 0.00 0.00
6 Water Supply & Sanitation 8464.73 0.00
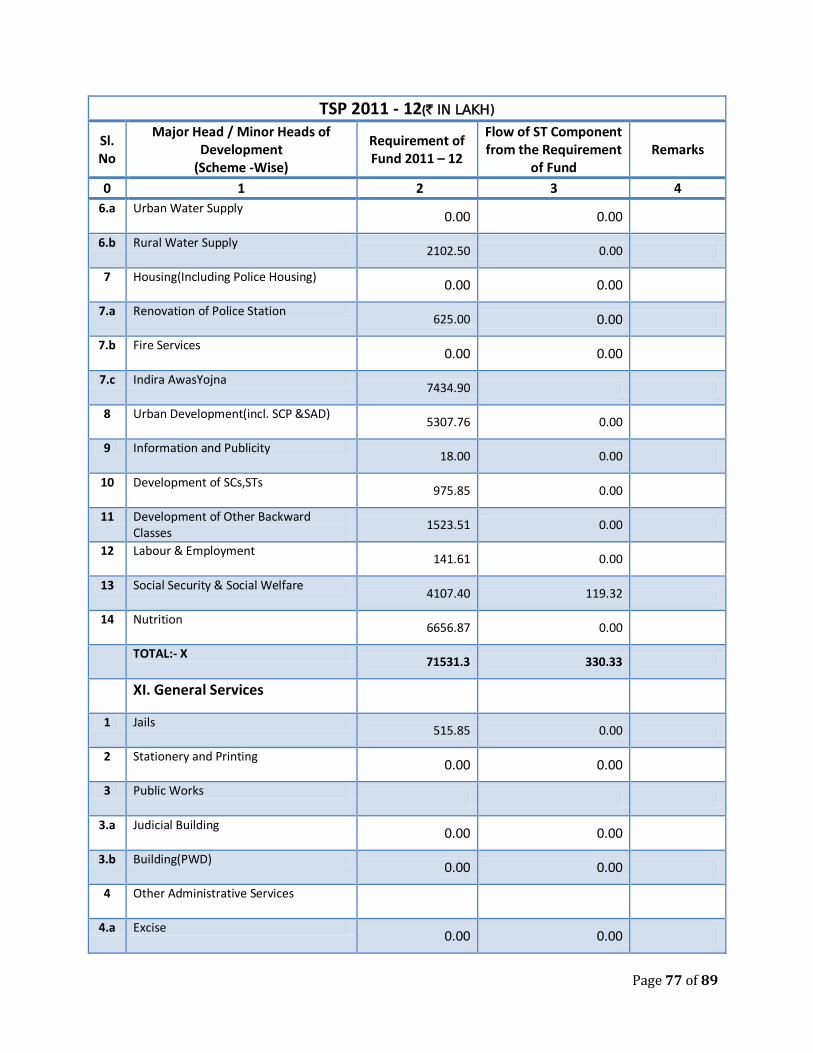
Page 77 of 89
TSP 2011 - 12(` IN LAKH)
Sl. No
Major Head / Minor Heads of Development
(Scheme -Wise)
Requirement of Fund 2011 – 12
Flow of ST Component from the Requirement
of Fund Remarks
0 1 2 3 4
6.a Urban Water Supply 0.00 0.00
6.b Rural Water Supply 2102.50 0.00
7 Housing(Including Police Housing) 0.00 0.00
7.a Renovation of Police Station 625.00 0.00
7.b Fire Services 0.00 0.00
7.c Indira AwasYojna 7434.90
8 Urban Development(incl. SCP &SAD) 5307.76 0.00
9 Information and Publicity 18.00 0.00
10 Development of SCs,STs 975.85 0.00
11 Development of Other Backward Classes
1523.51 0.00
12 Labour & Employment 141.61 0.00
13 Social Security & Social Welfare 4107.40 119.32
14 Nutrition 6656.87 0.00
TOTAL:- X 71531.3 330.33
XI. General Services
1 Jails 515.85 0.00
2 Stationery and Printing 0.00 0.00
3 Public Works
3.a Judicial Building 0.00 0.00
3.b Building(PWD) 0.00 0.00
4 Other Administrative Services
4.a Excise 0.00 0.00
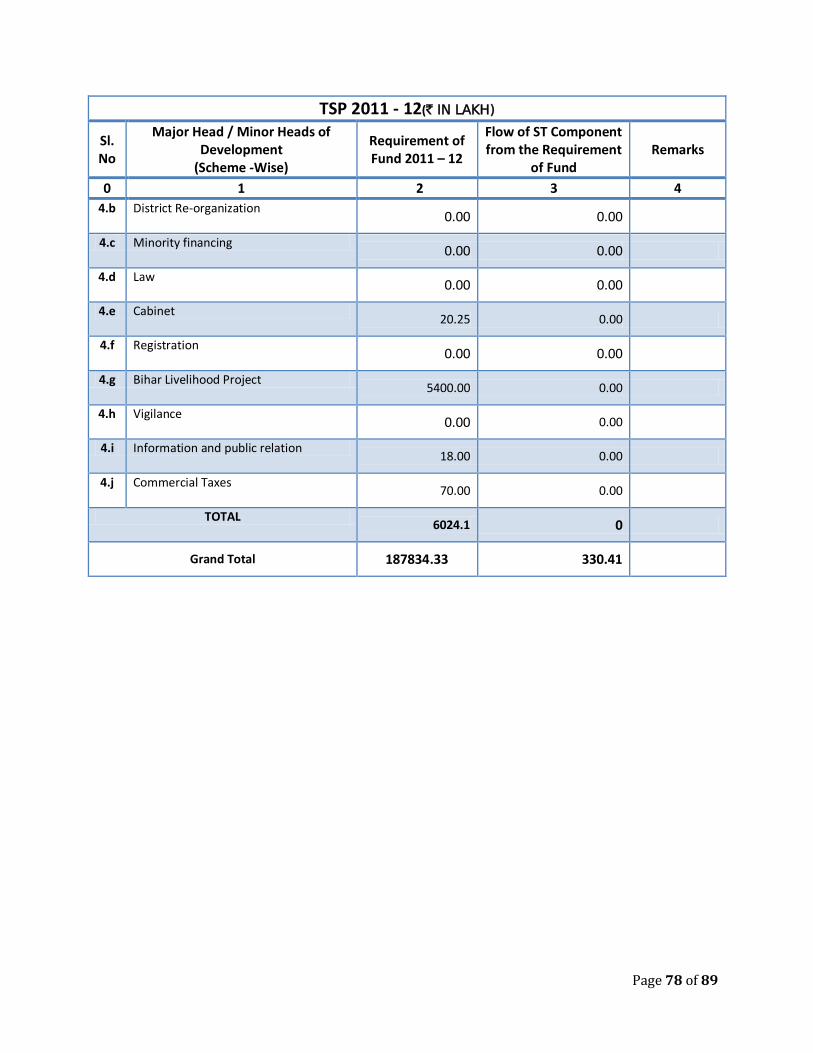
Page 78 of 89
TSP 2011 - 12(` IN LAKH)
Sl. No
Major Head / Minor Heads of Development
(Scheme -Wise)
Requirement of Fund 2011 – 12
Flow of ST Component from the Requirement
of Fund Remarks
0 1 2 3 4
4.b District Re-organization 0.00 0.00
4.c Minority financing 0.00 0.00
4.d Law 0.00 0.00
4.e Cabinet 20.25 0.00
4.f Registration 0.00 0.00
4.g Bihar Livelihood Project 5400.00 0.00
4.h Vigilance 0.00 0.00
4.i Information and public relation 18.00 0.00
4.j Commercial Taxes 70.00 0.00
TOTAL 6024.1 0
Grand Total 187834.33 330.41
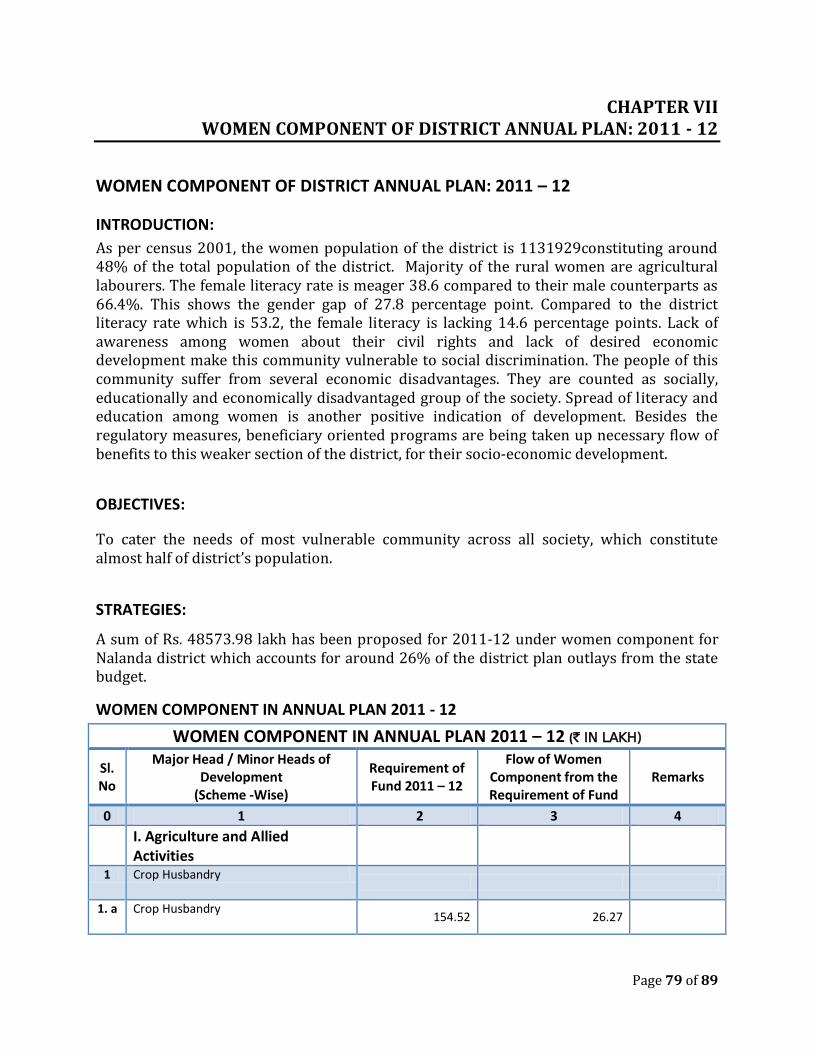
Page 79 of 89
CHAPTER VII WOMEN COMPONENT OF DISTRICT ANNUAL PLAN: 2011 - 12
WOMEN COMPONENT OF DISTRICT ANNUAL PLAN: 2011 – 12
INTRODUCTION:
As per census 2001, the women population of the district is 1131929constituting around 48% of the total population of the district. Majority of the rural women are agricultural labourers. The female literacy rate is meager 38.6 compared to their male counterparts as 66.4%. This shows the gender gap of 27.8 percentage point. Compared to the district literacy rate which is 53.2, the female literacy is lacking 14.6 percentage points. Lack of awareness among women about their civil rights and lack of desired economic development make this community vulnerable to social discrimination. The people of this community suffer from several economic disadvantages. They are counted as socially, educationally and economically disadvantaged group of the society. Spread of literacy and education among women is another positive indication of development. Besides the regulatory measures, beneficiary oriented programs are being taken up necessary flow of benefits to this weaker section of the district, for their socio‐economic development.
OBJECTIVES:
To cater the needs of most vulnerable community across all society, which constitute almost half of district’s population.
STRATEGIES:
A sum of Rs. 48573.98 lakh has been proposed for 2011‐12 under women component for Nalanda district which accounts for around 26% of the district plan outlays from the state budget.
WOMEN COMPONENT IN ANNUAL PLAN 2011 - 12
WOMEN COMPONENT IN ANNUAL PLAN 2011 – 12 (` IN LAKH)
Sl. No
Major Head / Minor Heads of Development
(Scheme -Wise)
Requirement of Fund 2011 – 12
Flow of Women Component from the Requirement of Fund
Remarks
0 1 2 3 4 I. Agriculture and Allied
Activities
1 Crop Husbandry
1. a Crop Husbandry 154.52 26.27
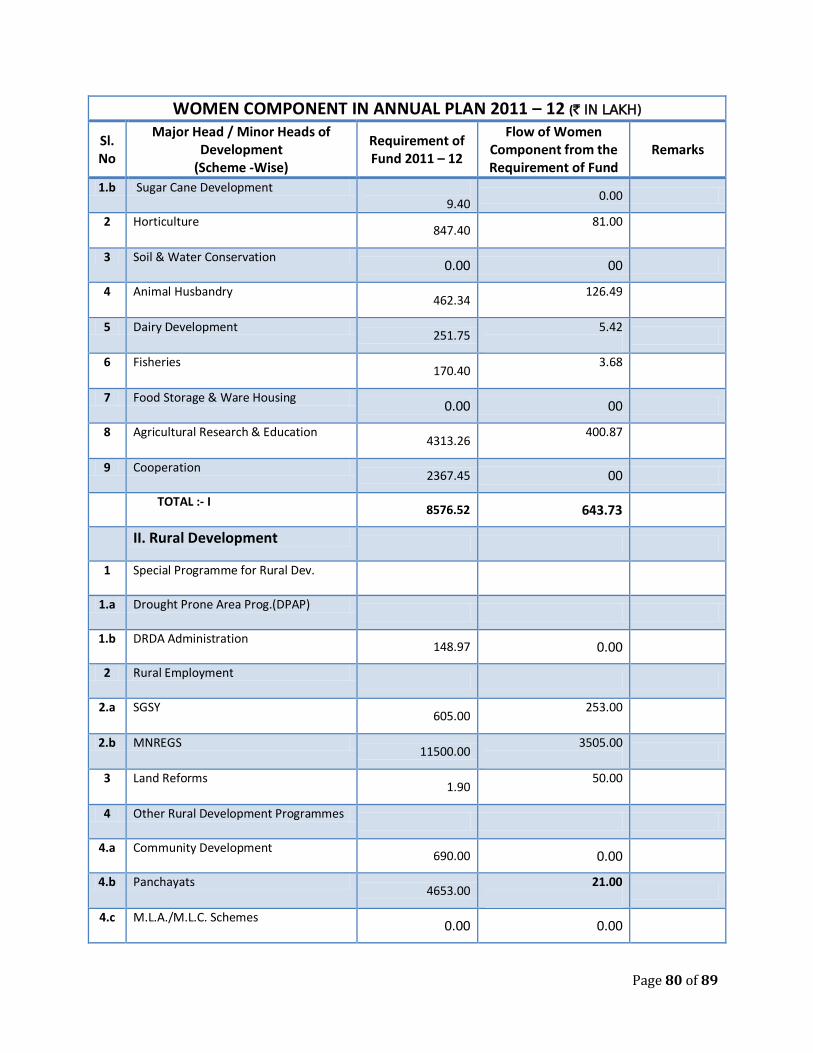
Page 80 of 89
WOMEN COMPONENT IN ANNUAL PLAN 2011 – 12 (` IN LAKH)
Sl. No
Major Head / Minor Heads of Development
(Scheme -Wise)
Requirement of Fund 2011 – 12
Flow of Women Component from the Requirement of Fund
Remarks
1.b Sugar Cane Development 9.40
0.00
2 Horticulture 847.40
81.00
3 Soil & Water Conservation 0.00 00
4 Animal Husbandry 462.34
126.49
5 Dairy Development 251.75
5.42
6 Fisheries 170.40
3.68
7 Food Storage & Ware Housing 0.00 00
8 Agricultural Research & Education 4313.26
400.87
9 Cooperation 2367.45 00
TOTAL :- I 8576.52 643.73
II. Rural Development
1 Special Programme for Rural Dev.
1.a Drought Prone Area Prog.(DPAP)
1.b DRDA Administration 148.97 0.00
2 Rural Employment
2.a SGSY 605.00
253.00
2.b MNREGS 11500.00
3505.00
3 Land Reforms 1.90
50.00
4 Other Rural Development Programmes
4.a Community Development 690.00 0.00
4.b Panchayats 4653.00
21.00
4.c M.L.A./M.L.C. Schemes 0.00 0.00
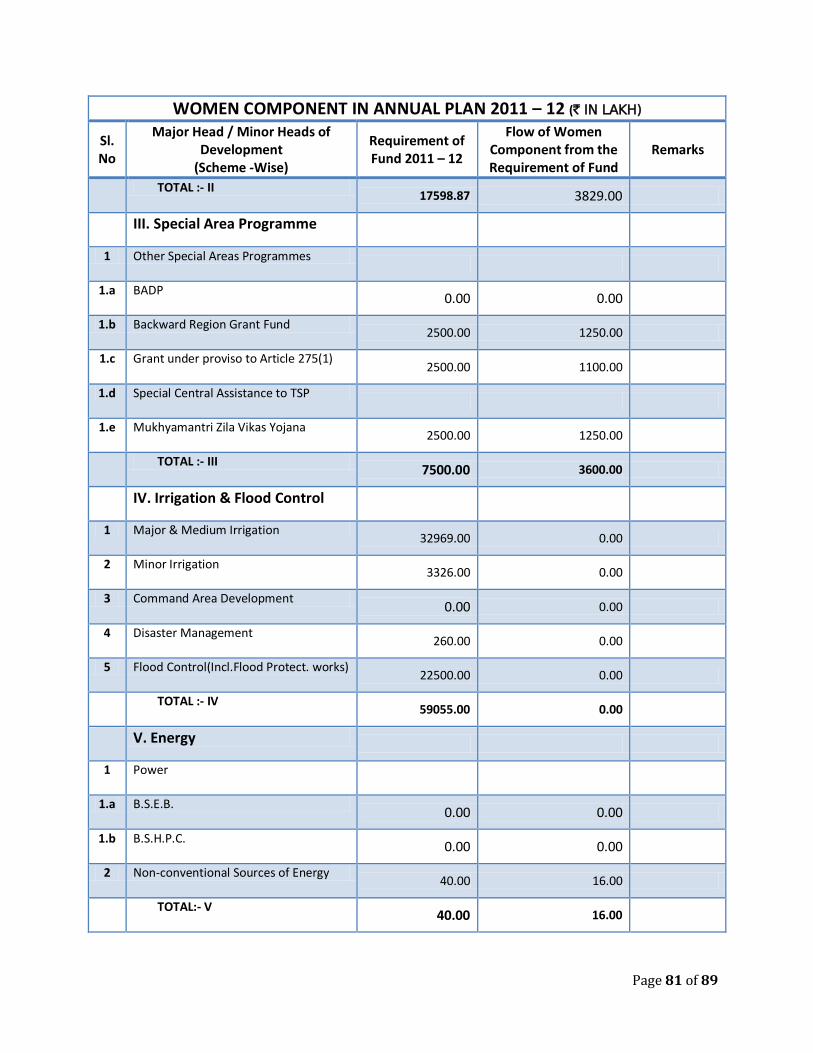
Page 81 of 89
WOMEN COMPONENT IN ANNUAL PLAN 2011 – 12 (` IN LAKH)
Sl. No
Major Head / Minor Heads of Development
(Scheme -Wise)
Requirement of Fund 2011 – 12
Flow of Women Component from the Requirement of Fund
Remarks
TOTAL :- II 17598.87 3829.00
III. Special Area Programme
1 Other Special Areas Programmes
1.a BADP 0.00 0.00
1.b Backward Region Grant Fund 2500.00 1250.00
1.c Grant under proviso to Article 275(1) 2500.00 1100.00
1.d Special Central Assistance to TSP
1.e Mukhyamantri Zila Vikas Yojana 2500.00 1250.00
TOTAL :- III 7500.00 3600.00
IV. Irrigation & Flood Control
1 Major & Medium Irrigation 32969.00 0.00
2 Minor Irrigation 3326.00 0.00
3 Command Area Development 0.00 0.00
4 Disaster Management 260.00 0.00
5 Flood Control(Incl.Flood Protect. works) 22500.00 0.00
TOTAL :- IV 59055.00 0.00
V. Energy
1 Power
1.a B.S.E.B. 0.00 0.00
1.b B.S.H.P.C. 0.00 0.00
2 Non-conventional Sources of Energy 40.00 16.00
TOTAL:- V 40.00 16.00
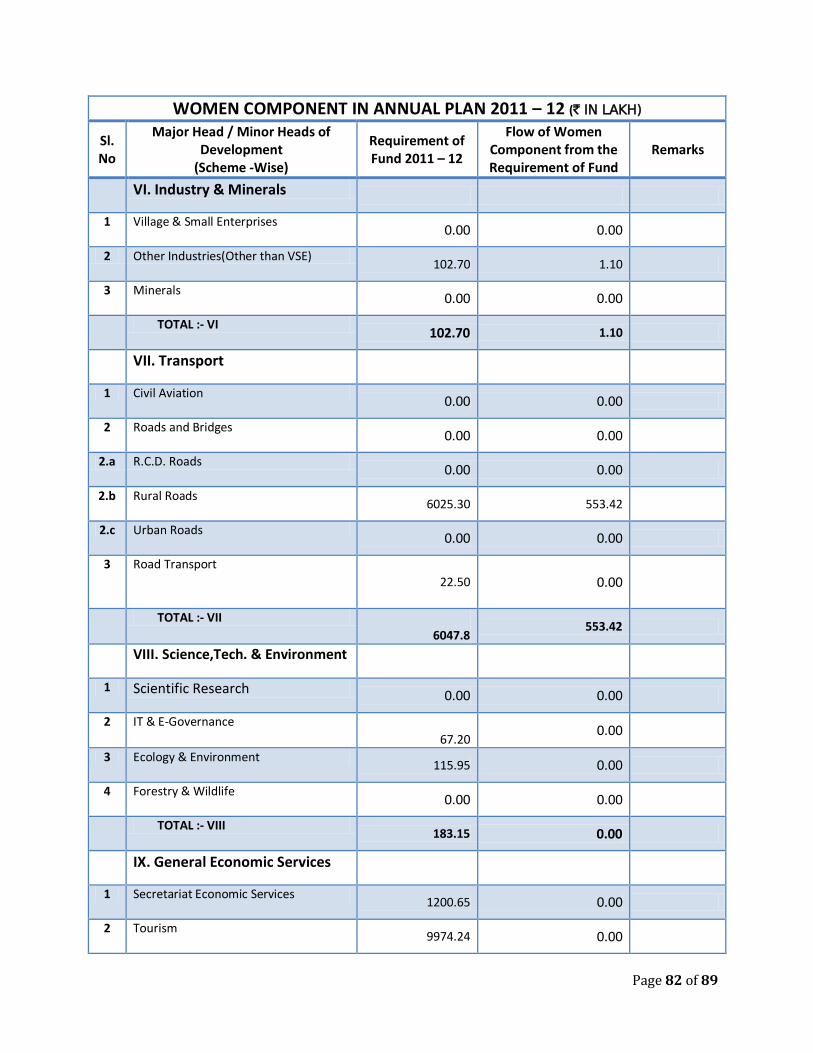
Page 82 of 89
WOMEN COMPONENT IN ANNUAL PLAN 2011 – 12 (` IN LAKH)
Sl. No
Major Head / Minor Heads of Development
(Scheme -Wise)
Requirement of Fund 2011 – 12
Flow of Women Component from the Requirement of Fund
Remarks
VI. Industry & Minerals
1 Village & Small Enterprises 0.00 0.00
2 Other Industries(Other than VSE) 102.70 1.10
3 Minerals 0.00 0.00
TOTAL :- VI 102.70 1.10
VII. Transport
1 Civil Aviation 0.00 0.00
2 Roads and Bridges 0.00 0.00
2.a R.C.D. Roads 0.00 0.00
2.b Rural Roads 6025.30 553.42
2.c Urban Roads 0.00 0.00
3 Road Transport 22.50
0.00
TOTAL :- VII 6047.8
553.42
VIII. Science,Tech. & Environment
1 Scientific Research 0.00 0.00
2 IT & E-Governance 67.20
0.00
3 Ecology & Environment 115.95 0.00
4 Forestry & Wildlife 0.00 0.00
TOTAL :- VIII 183.15 0.00
IX. General Economic Services
1 Secretariat Economic Services 1200.65 0.00
2 Tourism 9974.24 0.00
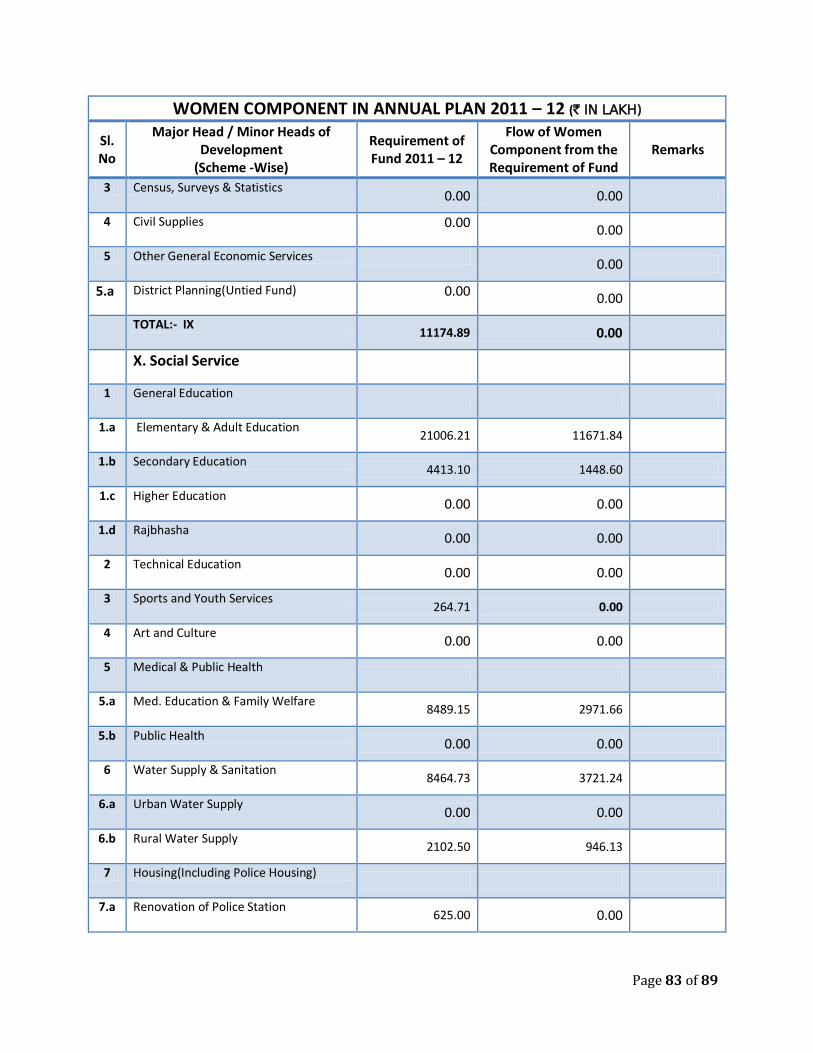
Page 83 of 89
WOMEN COMPONENT IN ANNUAL PLAN 2011 – 12 (` IN LAKH)
Sl. No
Major Head / Minor Heads of Development
(Scheme -Wise)
Requirement of Fund 2011 – 12
Flow of Women Component from the Requirement of Fund
Remarks
3 Census, Surveys & Statistics 0.00 0.00
4 Civil Supplies 0.00 0.00
5 Other General Economic Services 0.00
5.a District Planning(Untied Fund) 0.00 0.00
TOTAL:- IX 11174.89 0.00
X. Social Service
1 General Education
1.a Elementary & Adult Education 21006.21 11671.84
1.b Secondary Education 4413.10 1448.60
1.c Higher Education 0.00 0.00
1.d Rajbhasha 0.00 0.00
2 Technical Education 0.00 0.00
3 Sports and Youth Services 264.71 0.00
4 Art and Culture 0.00 0.00
5 Medical & Public Health
5.a Med. Education & Family Welfare 8489.15 2971.66
5.b Public Health 0.00 0.00
6 Water Supply & Sanitation 8464.73 3721.24
6.a Urban Water Supply 0.00 0.00
6.b Rural Water Supply 2102.50 946.13
7 Housing(Including Police Housing)
7.a Renovation of Police Station 625.00 0.00
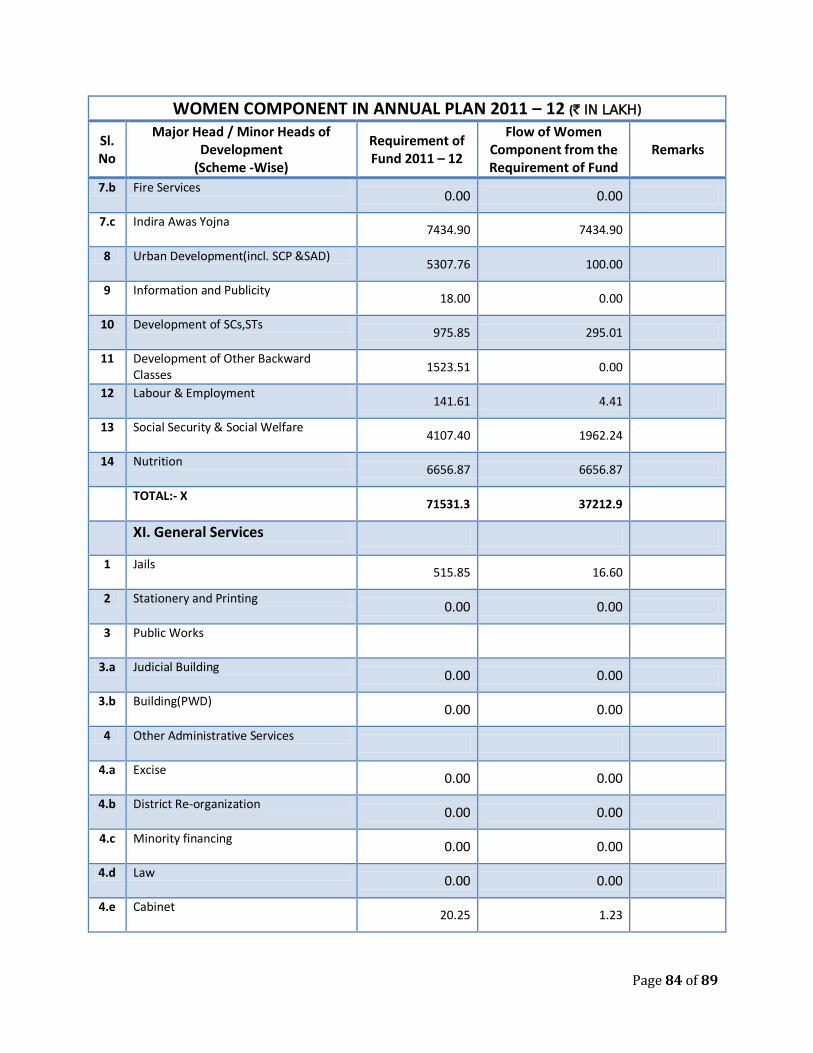
Page 84 of 89
WOMEN COMPONENT IN ANNUAL PLAN 2011 – 12 (` IN LAKH)
Sl. No
Major Head / Minor Heads of Development
(Scheme -Wise)
Requirement of Fund 2011 – 12
Flow of Women Component from the Requirement of Fund
Remarks
7.b Fire Services 0.00 0.00
7.c Indira Awas Yojna 7434.90 7434.90
8 Urban Development(incl. SCP &SAD) 5307.76 100.00
9 Information and Publicity 18.00 0.00
10 Development of SCs,STs 975.85 295.01
11 Development of Other Backward Classes
1523.51 0.00
12 Labour & Employment 141.61 4.41
13 Social Security & Social Welfare 4107.40 1962.24
14 Nutrition 6656.87 6656.87
TOTAL:- X 71531.3 37212.9
XI. General Services
1 Jails 515.85 16.60
2 Stationery and Printing 0.00 0.00
3 Public Works
3.a Judicial Building 0.00 0.00
3.b Building(PWD) 0.00 0.00
4 Other Administrative Services
4.a Excise 0.00 0.00
4.b District Re-organization 0.00 0.00
4.c Minority financing 0.00 0.00
4.d Law 0.00 0.00
4.e Cabinet 20.25 1.23
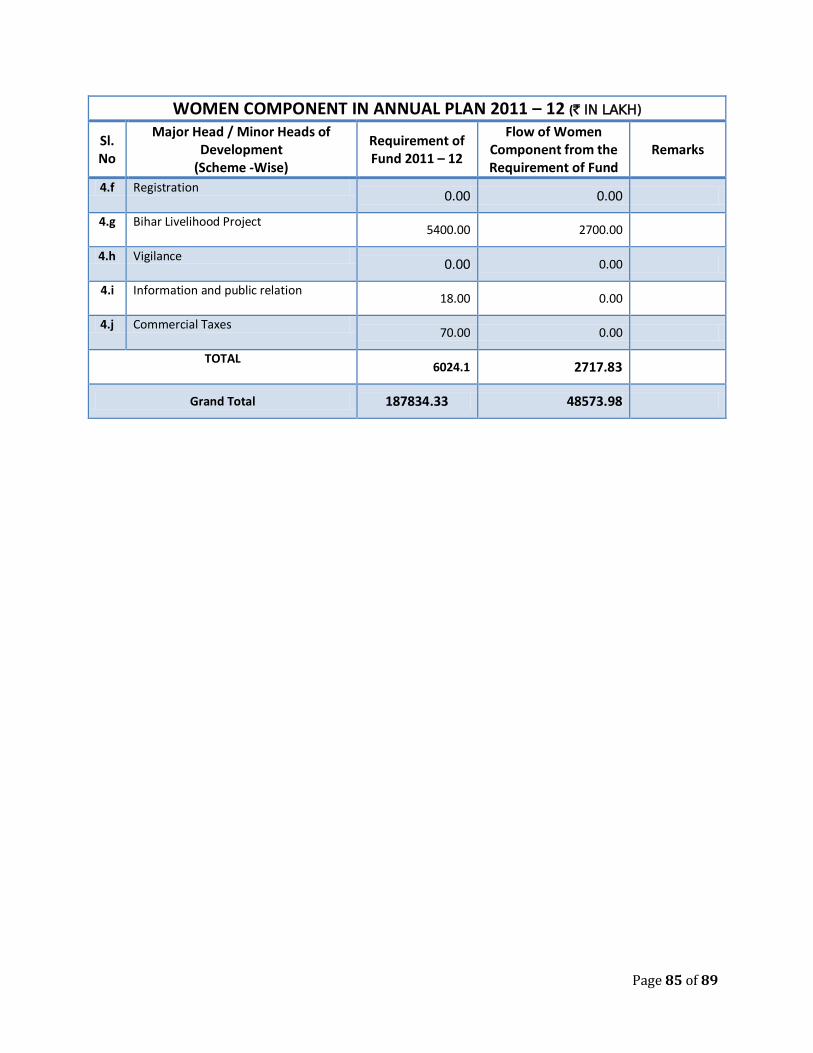
Page 85 of 89
WOMEN COMPONENT IN ANNUAL PLAN 2011 – 12 (` IN LAKH)
Sl. No
Major Head / Minor Heads of Development
(Scheme -Wise)
Requirement of Fund 2011 – 12
Flow of Women Component from the Requirement of Fund
Remarks
4.f Registration 0.00 0.00
4.g Bihar Livelihood Project 5400.00 2700.00
4.h Vigilance 0.00 0.00
4.i Information and public relation 18.00 0.00
4.j Commercial Taxes 70.00 0.00
TOTAL 6024.1 2717.83
Grand Total 187834.33 48573.98
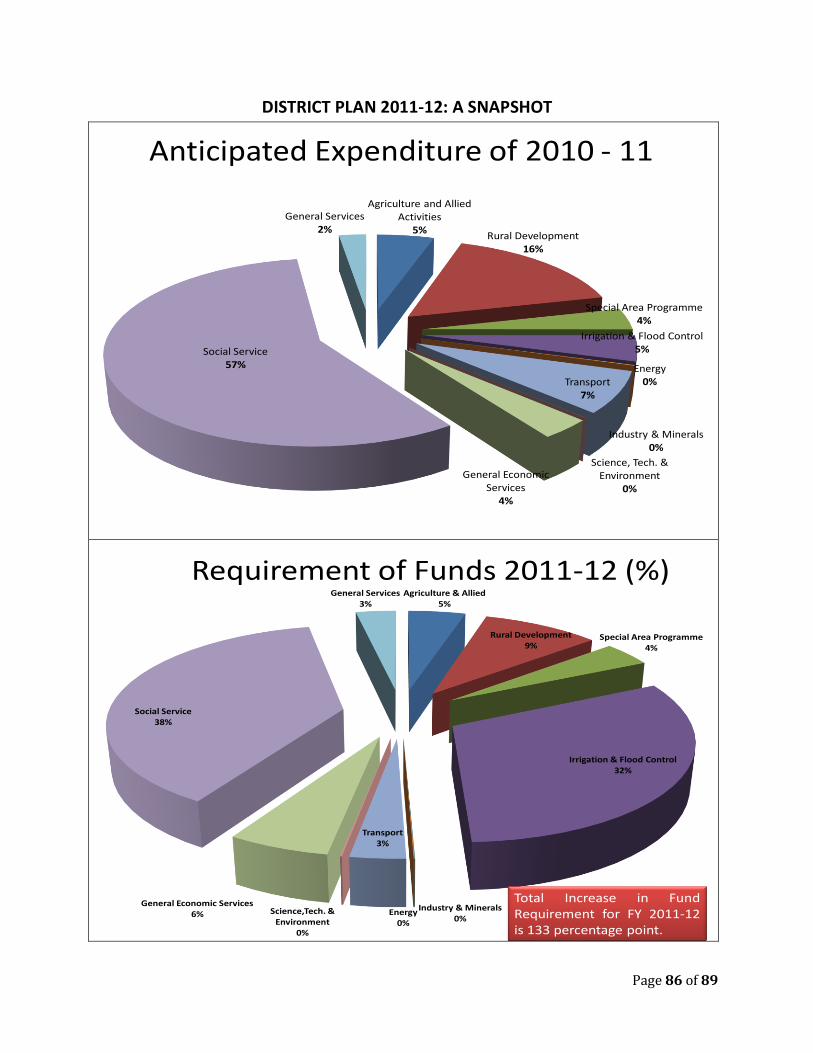
Page 86 of 89
DISTRICT PLAN 2011-12: A SNAPSHOT
Anticipated Expenditure of 2010 - 11
Agriculture and Allied Activities
5%Rural Development
16%
Special Area Programme4%
Irrigation & Flood Control5%
Energy0%
Industry & Minerals0%
Transport 7%
Science, Tech. & Environment
0%
General Economic Services
4%
Social Service57%
General Services2%
Requirement of Funds 2011-12 (%)Agriculture & Allied
5%
Rural Development9%
Special Area Programme4%
Irrigation & Flood Control32%
Energy0%
Industry & Minerals0%
Transport 3%
Science,Tech. & Environment
0%
General Economic Services6%
Social Service38%
General Services3%
Total Increase in FundRequirement for FY 2011-12is 133 percentage point.
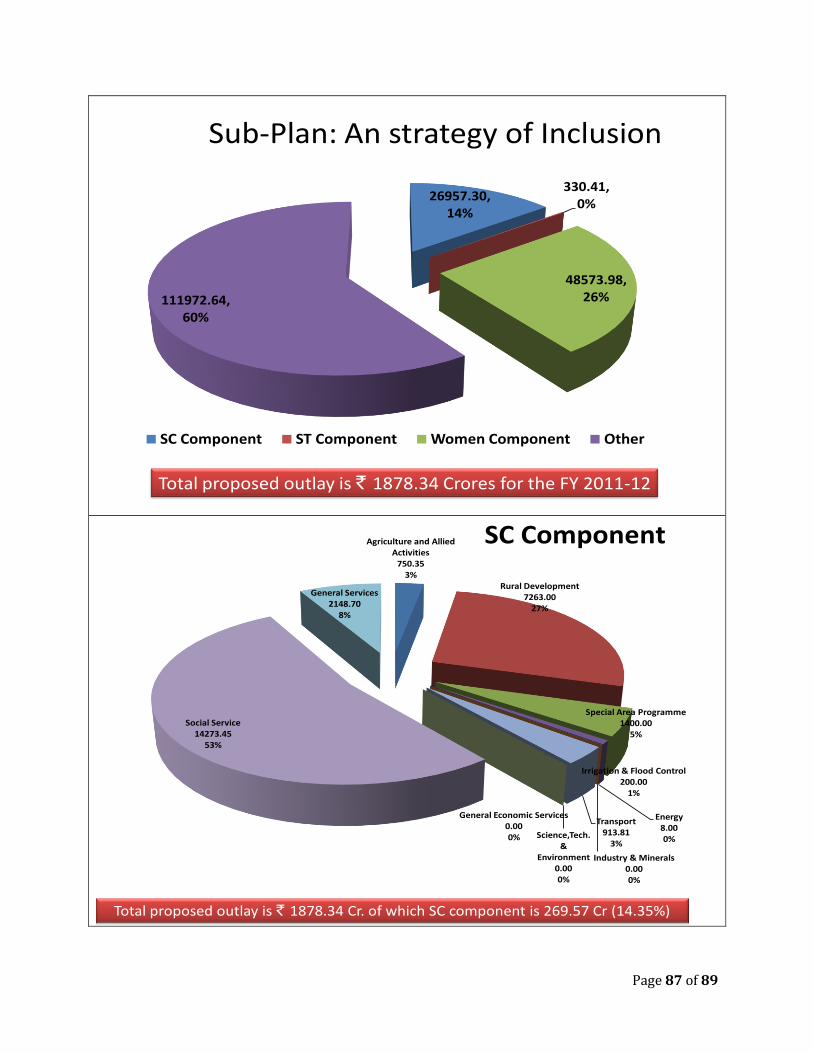
Page 87 of 89
Sub-Plan: An strategy of Inclusion
26957.30, 14%
330.41, 0%
48573.98, 26%111972.64,
60%
SC Component ST Component Women Component Other
Total proposed outlay is ` 1878.34 Crores for the FY 2011-12
Agriculture and Allied Activities
750.353%
Rural Development7263.00
27%
Special Area Programme1400.00
5%
Irrigation & Flood Control200.00
1%
Energy8.000%
Industry & Minerals0.000%
Transport 913.81
3%Science,Tech.
& Environment
0.000%
General Economic Services0.000%
Social Service14273.45
53%
General Services2148.70
8%
SC Component
Total proposed outlay is ` 1878.34 Cr. of which SC component is 269.57 Cr (14.35%)
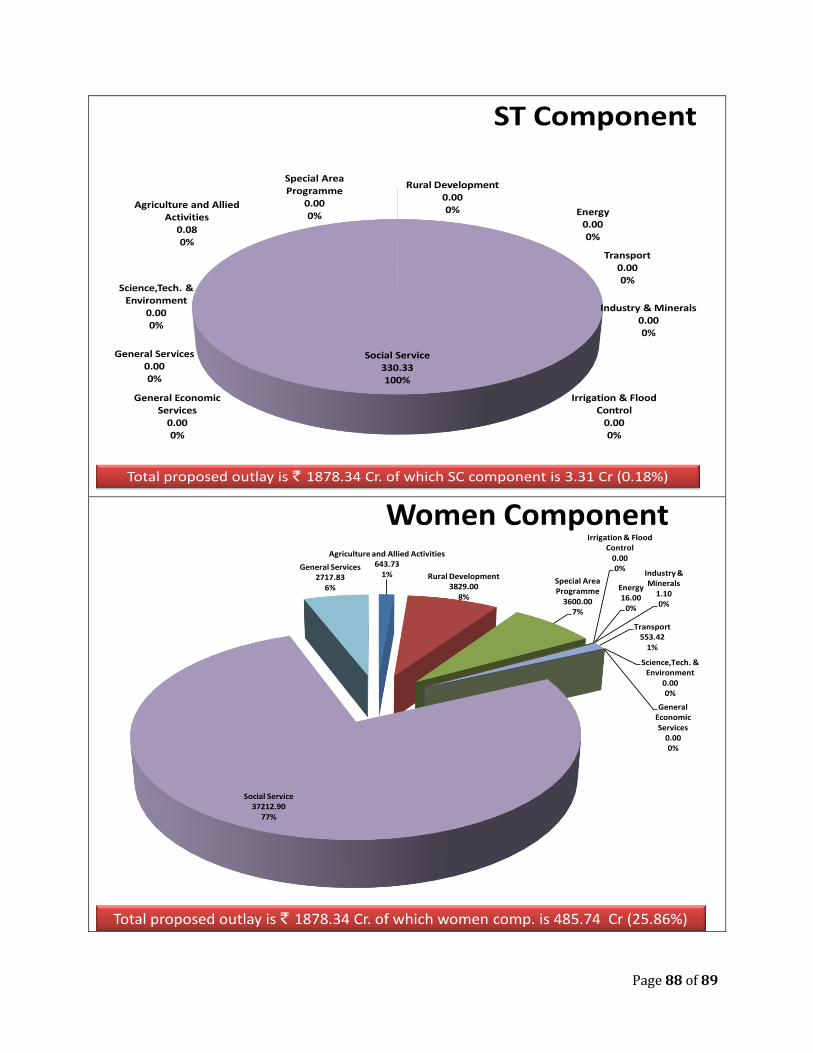
Page 88 of 89
Agriculture and Allied Activities
0.080%
Rural Development0.000%
Special Area Programme
0.000%
Irrigation & Flood Control
0.000%
Energy0.000%
Industry & Minerals0.000%
Transport 0.000%
Science,Tech. & Environment
0.000%
General Economic Services
0.000%
Social Service330.33100%
General Services0.000%
ST Component
Total proposed outlay is ` 1878.34 Cr. of which SC component is 3.31 Cr (0.18%)
Women ComponentAgriculture and Allied Activities
643.731% Rural Development
3829.008%
Special Area Programme
3600.007%
Irrigation & Flood Control
0.000%
Energy16.00
0%
Industry & Minerals
1.100%
Transport 553.42
1%
Science,Tech. & Environment
0.000%
General Economic Services
0.000%
Social Service37212.90
77%
General Services2717.83
6%
Total proposed outlay is ` 1878.34 Cr. of which women comp. is 485.74 Cr (25.86%)