Embed Size (px)
Citation preview

2017-2018 Administrator Survey Analysis ResultsPrepared For Mississippi Student Testing Task Force Committee Meeting
03/29/2019
Yan Li, Ph.D.Director of Research and [email protected]
To create a world-class educational system that gives students the knowledge and skills to be successful in college and the workforce, and to flourish as parents and citizens
VISION
To provide leadership through the development of policy and accountability systems so that all students are prepared to compete in the global community
MISSION
Mississippi Department of Education
2

Every Child Has Access
to a High-Quality Early
Childhood Program
3
All Students Proficient
and Showing Growth in All
AssessedAreas
1
Every School Has
Effective Teachers and
Leaders
4Every
Student Graduatesfrom High
School and is Ready for College and
Career
2
EverySchool and District is
Rated “C” or Higher
6Every
Community Effectively
Uses a World-Class Data System to Improve
Student Outcomes
5
MISSISSIPPI STATE BOARD OF EDUCATION
STRATEGIC PLAN GOALS
Survey Overview
4

Survey Overview
5
• Valid response rate to the administrator’s survey was 64 percent.
Overall, less than two-thirds districts validly responded to the survey.
Respondents Non-respondents
36%didn’t validly respond
85 percent of survey participants completed the questionnaire.
Non-completers Completers
15% didn't complete
Survey Overview
6
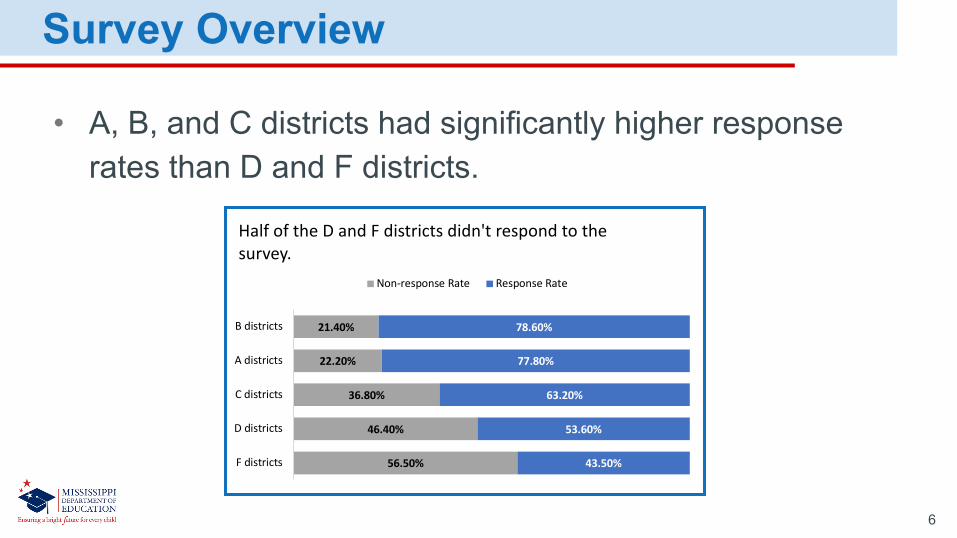
• A, B, and C districts had significantly higher response rates than D and F districts.
56.50%
46.40%
36.80%
22.20%
21.40%
43.50%
53.60%
63.20%
77.80%
78.60%
F districts
D districts
C districts
A districts
B districts
Half of the D and F districts didn't respond to the survey.
Non-response Rate Response Rate

Survey Overview
• Majority of the valid survey respondents used vendor-created assessments in their districts.
7
5%
95%
95 percent of valid respondents reported that their districts used vendor-created assessments in 2017-2018.
Not using vendor-created assessments Using vendor-created assessments

Analysis Results
8

Analysis Results• Reported data show that administrators on average have higher rate
of finding the surveyed vendor-created assessments “very helpful”, compared to teachers.
9
22%
33%
37%
47%
50%
53%
29%
40%
45%
51%
51%
51%
DIBELS
STAR Reading
NWEA MAP ELA
i-Ready ELA
CASE English II
CASE ELA
In general, higher percentage of administrators find the following reading assessment very helpful, compared to teachers. CASE ELA by TE21 is rated the most helpful Reading assessment by both administrators and teachers.
Very Helpful Rate by Teacher Very Helpful Rate by Administrator
30%
35%
44%
46%
47%
35%
42%
48%
44%
49%
STAR Math
NWEA MAP Math
CASE Algebra I
CASE Math
i-Ready Math
In general, higher percentage of administrators find the following math assessment very helpful, compared to teachers. I-Ready Math by Curriculum Associates is rated the most helpful Math assessment by both administrators and teachers.
Very Helpful Rate by Teacher Very Helpful Rate by Administrator

Analysis Results• Survey questions:
What is the length of one administration in minutes for a student
without time accommodations? “Student testing time for one administration of one assessment”Examples: STAR by Renaissance Learning [15, 180]
CASE by TE21 [50, 280]
How many school days does it take the district to test all students
for one administration?“District administration time for one administration of one assessment” *Examples: STAR by Renaissance Learning [1, 20]
CASE BY TE21 [1, 15]
10

Analysis Results• Technology issues with districts’ broadband and vendors’ software are
rated the top two factors that prolong the test administration for an individual student beyond the expected minutes of administration.
11
15%17%18%21%21%24%24%26%27%30%
29%28%
31%19%21%18%18%17%
24%27%
CASE MathCASE Algebra I
CASE ELASTAR Reading
STAR Mathi-Ready ELA
CASE English IIi-Ready Math
NWEA MAP MathNWEA MAP ELA
The top two factors prolong test administration time for an individual student are technology issues with district broadband and technology issues with vendor software.
Technology issues with distrit broadband/internet Technology issues with vendor software
Technology issues with district hardware Students forgetting logins or passwords
Students forgetting identification User error/trouble understanding how to use the testing platform
Collecting cellphones Others

Analysis Results• Lack of availability of test-capable devices contributed approximately 50%
to the cause of districts taking longer time to test all students.
12
39%
43%
44%
45%
46%
46%
47%
48%
49%
55%
46%
33%
20%
35%
19%
42%
29%
22%
28%
21%
NWEA MAP Math
i-Ready Math
CASE Algebra I
i-Ready ELA
CASE English II
NWEA MAP ELA
STAR Math
CASE ELA
STAR Reading
CASE Math
The most significant factor affecting the amount of time it takes the district
to test all students is the availability of test-capable devices.
Availability of test-capable devices District broadband/internet Availability of proctors
District-level test preparedness School-level test preparedness Others

Analysis Results
• Survey question:
How frequently does the district administer the test in terms of the number of times per year?“Frequency of test administration for one assessment in 2017-2018”
Examples: STAR by Renaissance Learning [1, 11]CASE by TE21 [1, 4]
13

Analysis ResultsStudent total testing time for all vendor-created assessments in 2017-2018
= student testing time for one administration of assessment 1* frequency of test administration for assessment 1 +… + student testing time for one administration of assessment N* frequency of test administration for assessment N
District total administration time for all vendor-created assessments in 2017-2018
= district administration time for one administration of assessment 1 * frequency of test administration for assessment 1 + … + district administration time for one administration of assessment N * frequency of test administration for assessment N
14

Analysis Results• Students from A and F districts on average spent relatively more
testing time on vendor-created assessments, compared to students from other districts.
15
1049
1255
1490
1623
2361
B districts
D districts
C districts
A districts
F districts
A districts and F districts are the top two districts where students had longer testing time in 2017-2018 school year.The correlation between the average of student's total testing time and district's performance is -0.14 (weak).

Analysis Results• C and D districts on average spent more time than other districts
administering vendor-created assessments.
16
80.2
88.5
88.7
117.9
128.8
B districts
A districts
F districts
D districts
C districts
C districts and D districts are the top two districts who spent more time in administering tests in 2017-2018 school year.The correlation between the average total test administration time and district's performance is -0.11 (weak).

Analysis Results• Neither student’s testing time nor district’s administration time spent
on ELA assessments has a strong correlation with district’s ELA proficiency level.
17
0
500
1000
1500
2000
2500
3000
3500
0 10 20 30 40 50 60 70
In 2017-2018, the longer testing time a student spent in total on ELA assessments at a district, the lower the district's ELA proficiency. The correlation was -0.13.
020406080
100120140160180
0 10 20 30 40 50 60 70
In 2017-2018, the longer administration time a district spent in total on ELA assessments, the lower the district's ELA proficiency. The correlation was -0.07.

Analysis Results• Neither student’s testing time nor district’s administration time in
Math assessments has a strong correlation with district’s Math proficiency level.
18
0
500
1000
1500
2000
2500
3000
3500
0 10 20 30 40 50 60 70 80
In 2017-2018, the longer testing time a student spent in total on Math assessments at a district, the lower the district's Math proficiency. The correlation was -0.14.
020406080
100120140160180
0 10 20 30 40 50 60 70 80
In 2017-2018, the longer administration time a district spent in total on Math assessments, the lower the district's Math proficiency. The correlation was -0.11.

Recommendation and Next Steps
19

Recommendation/Next Steps
• Survey design should allow respondents to go back and change answers for enhanced accuracy.
• More clear and rigorous definition for “testing effort” is indispensable.
• More qualitative data collection and analysis are needed for further investigation.
• More aggregate-level survey questions are required for a broader perspective.
20