Embed Size (px)
Citation preview
Ditch Design Section 3
2/15/2008 1 Final
In this tutorial you will learn about:
• The design criteria for ditches.
• How to model a conveyance ditch.
• An introduction to reaches and nodes.
• How to include infiltration in the ditch design.
• How to use the calculator to estimate a ditch size.
Ditch Design Section 3
2/15/2008 2 Final
Ditch Example
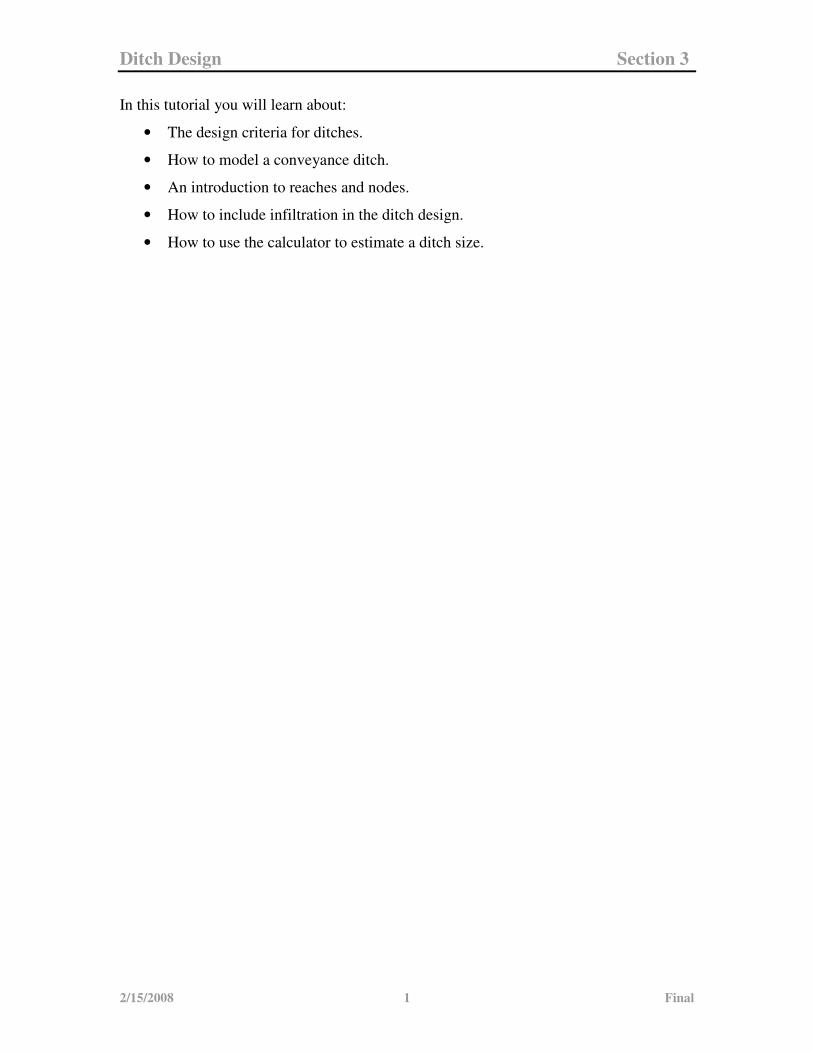
You have been asked to determine if the ‘V’ bottom ditch running parallel to the road is
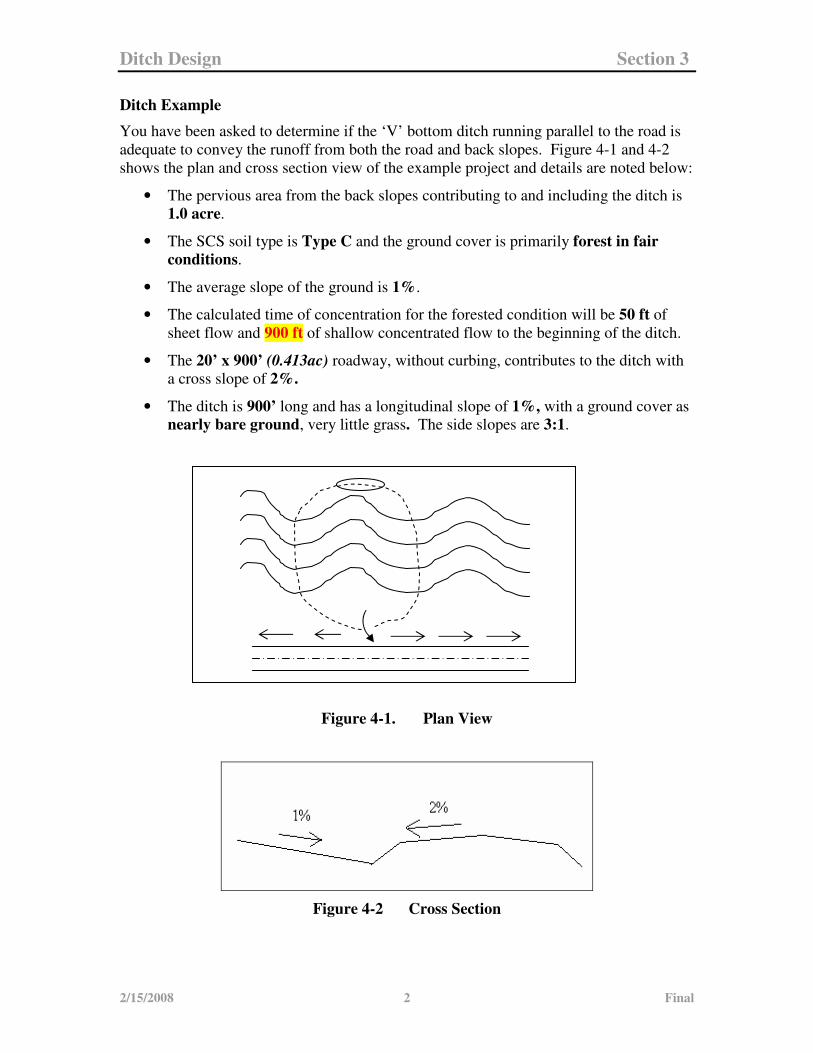
adequate to convey the runoff from both the road and back slopes. Figure 4-1 and 4-2
shows the plan and cross section view of the example project and details are noted below:
• The pervious area from the back slopes contributing to and including the ditch is
1.0 acre.
• The SCS soil type is Type C and the ground cover is primarily forest in fair
conditions.
• The average slope of the ground is 1%.
• The calculated time of concentration for the forested condition will be 50 ft of
sheet flow and 900 ft of shallow concentrated flow to the beginning of the ditch.
• The 20’ x 900’ (0.413ac) roadway, without curbing, contributes to the ditch with
a cross slope of 2%.
• The ditch is 900’ long and has a longitudinal slope of 1%, with a ground cover as
nearly bare ground, very little grass. The side slopes are 3:1.
Figure 4-1. Plan View
Figure 4-2 Cross Section
Ditch Design Section 3
2/15/2008 3 Final
Design Criteria
Roadside ditches are generally located alongside uncurbed roadways with the primary
purpose of conveying runoff away from the roadway. This is different than a
bioinfiltration or biofiltration swale (or bioswale), in that a ditch only conveys drainage
runoff where as a bioswale both conveys runoff and provides runoff treatment by filtering
the runoff through vegetation. Also the recommended shape of a bioswale is a trapezoid,
not a ‘V’ ditch.
The design criteria for ditches are in located in Section 4-3 of the Hydraulics Manual. In
short the following is required:
• The design storm is the 10 year recurrence interval.
• The maximum depth of water in the ditch is 0.5’ below the bottom of sub-grade.
• Velocities in the ditch should not exceed 5 ft/sec and the ditch slope should be
less than 6%.
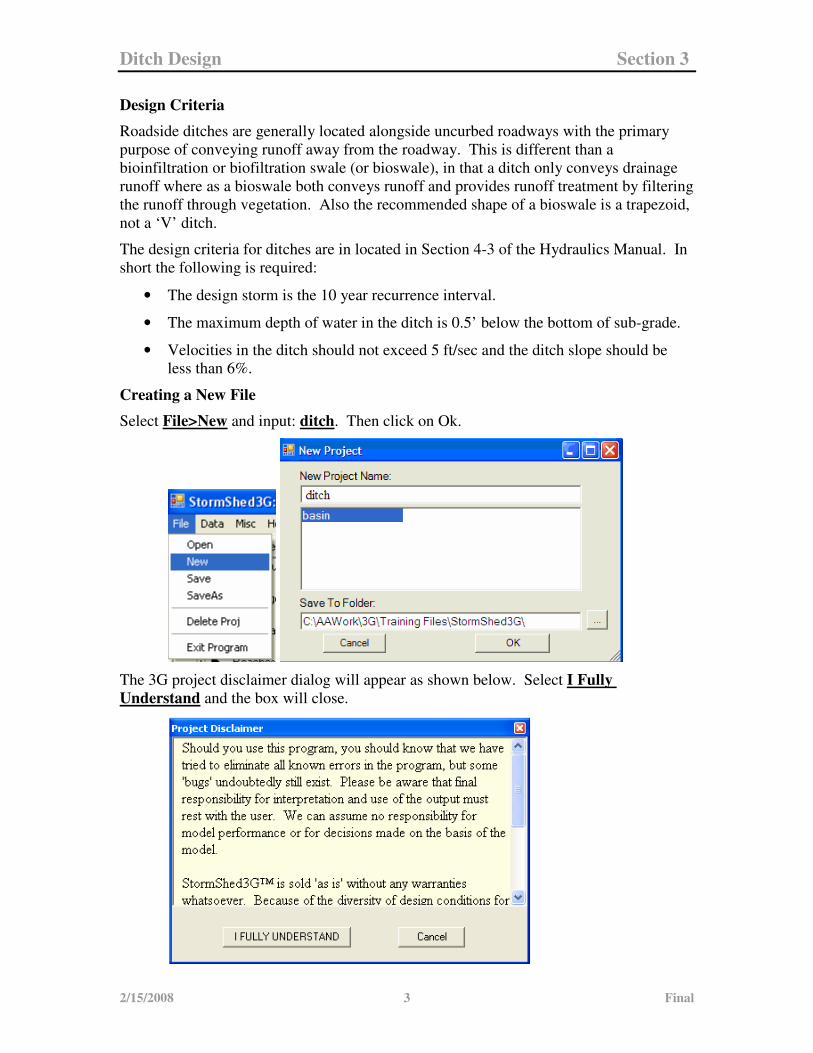
Creating a New File
Select File>New and input: ditch. Then click on Ok.
The 3G project disclaimer dialog will appear as shown below. Select I Fully
Understand and the box will close.
Ditch Design Section 3
2/15/2008 4 Final
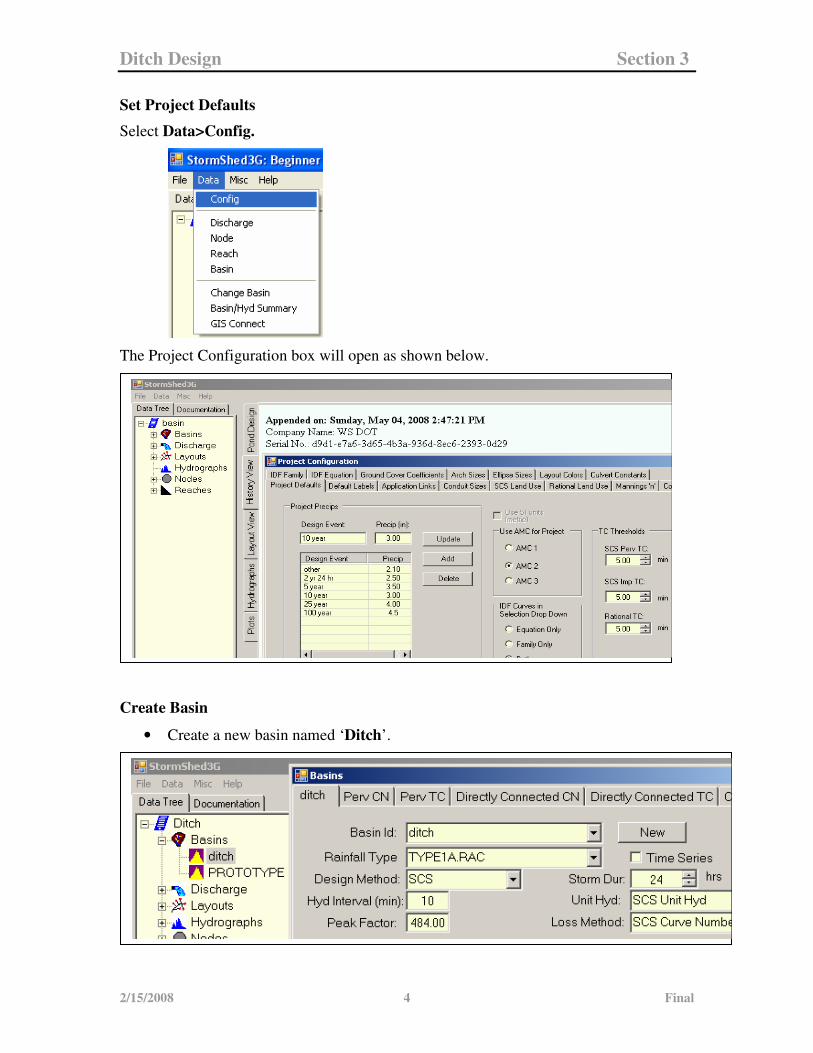
Set Project Defaults
Select Data>Config.
The Project Configuration box will open as shown below.
Create Basin
• Create a new basin named ‘Ditch’.
Ditch Design Section 3
2/15/2008 5 Final
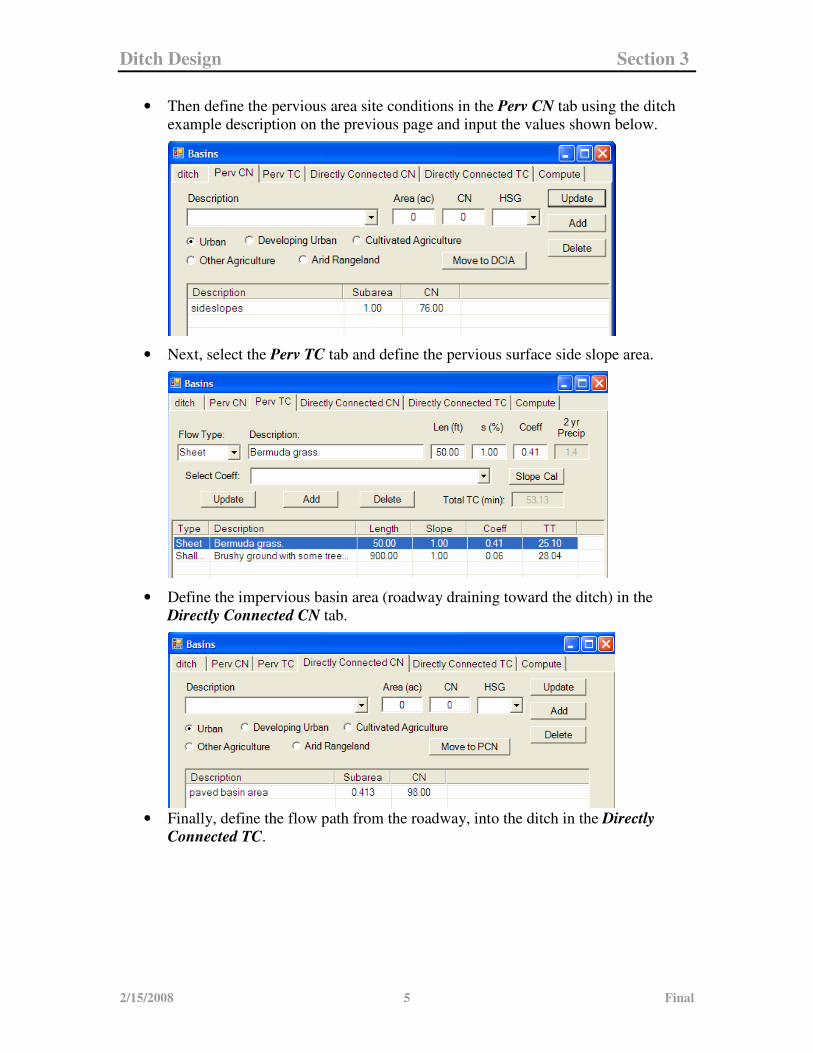
• Then define the pervious area site conditions in the Perv CN tab using the ditch
example description on the previous page and input the values shown below.
• Next, select the Perv TC tab and define the pervious surface side slope area.
• Define the impervious basin area (roadway draining toward the ditch) in the
Directly Connected CN tab.
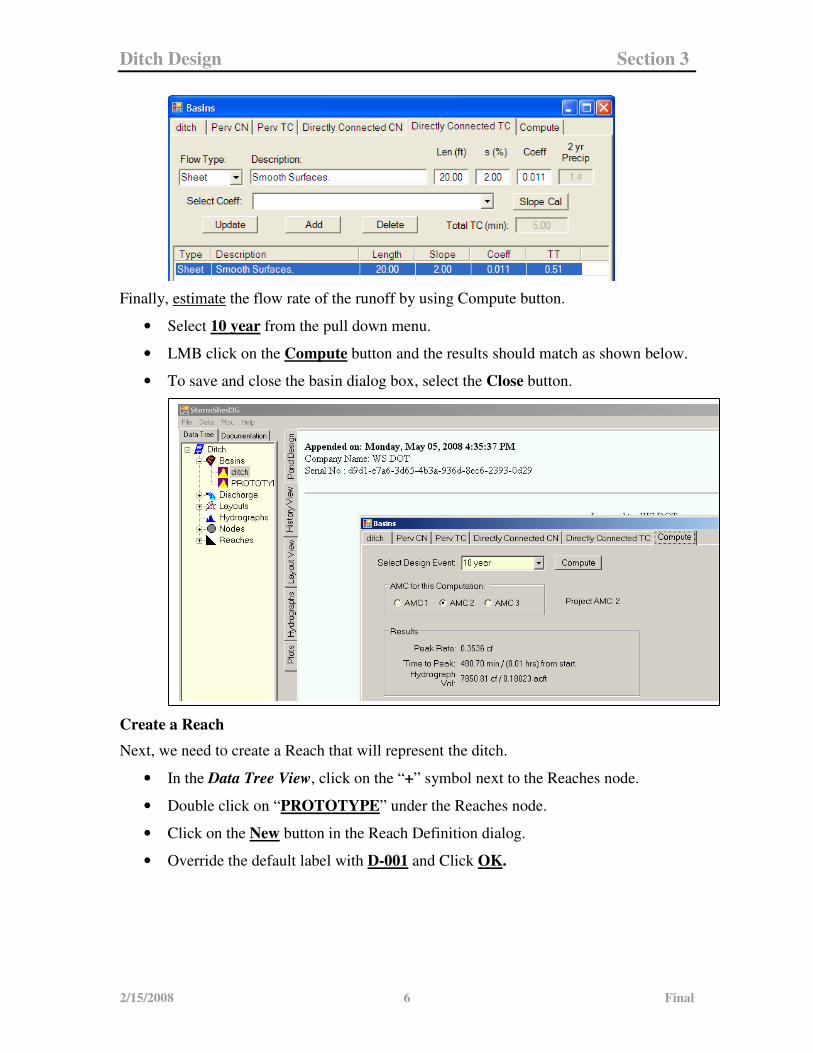
• Finally, define the flow path from the roadway, into the ditch in the Directly
Connected TC.
Ditch Design Section 3
2/15/2008 6 Final
Finally, estimate the flow rate of the runoff by using Compute button.
• Select 10 year from the pull down menu.
• LMB click on the Compute button and the results should match as shown below.
• To save and close the basin dialog box, select the Close button.
Create a Reach
Next, we need to create a Reach that will represent the ditch.
• In the Data Tree View, click on the “+” symbol next to the Reaches node.
• Double click on “PROTOTYPE” under the Reaches node.
• Click on the New button in the Reach Definition dialog.
• Override the default label with D-001 and Click OK.
Ditch Design Section 3
2/15/2008 7 Final
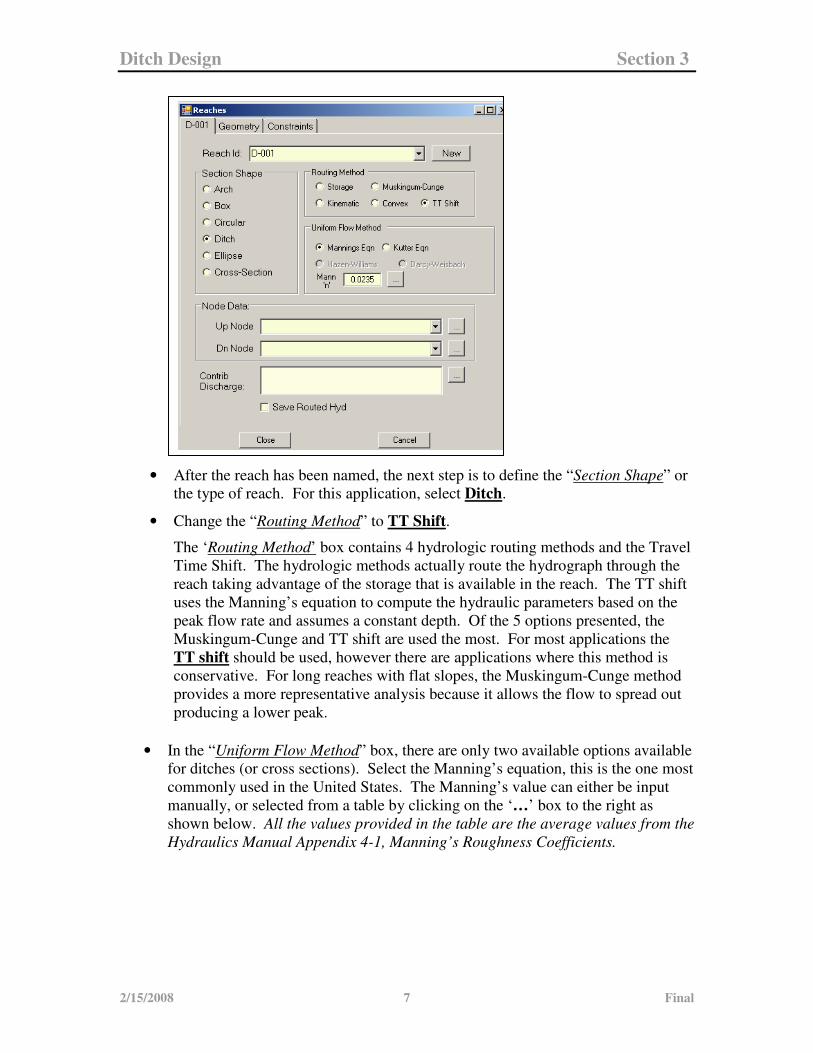
• After the reach has been named, the next step is to define the “Section Shape” or
the type of reach. For this application, select Ditch.
• Change the “Routing Method” to TT Shift.
The ‘Routing Method’ box contains 4 hydrologic routing methods and the Travel
Time Shift. The hydrologic methods actually route the hydrograph through the
reach taking advantage of the storage that is available in the reach. The TT shift
uses the Manning’s equation to compute the hydraulic parameters based on the
peak flow rate and assumes a constant depth. Of the 5 options presented, the
Muskingum-Cunge and TT shift are used the most. For most applications the
TT shift should be used, however there are applications where this method is
conservative. For long reaches with flat slopes, the Muskingum-Cunge method
provides a more representative analysis because it allows the flow to spread out
producing a lower peak.
• In the “Uniform Flow Method” box, there are only two available options available
for ditches (or cross sections). Select the Manning’s equation, this is the one most
commonly used in the United States. The Manning’s value can either be input
manually, or selected from a table by clicking on the ‘…’ box to the right as
shown below. All the values provided in the table are the average values from the
Hydraulics Manual Appendix 4-1, Manning’s Roughness Coefficients.
Ditch Design Section 3
2/15/2008 8 Final
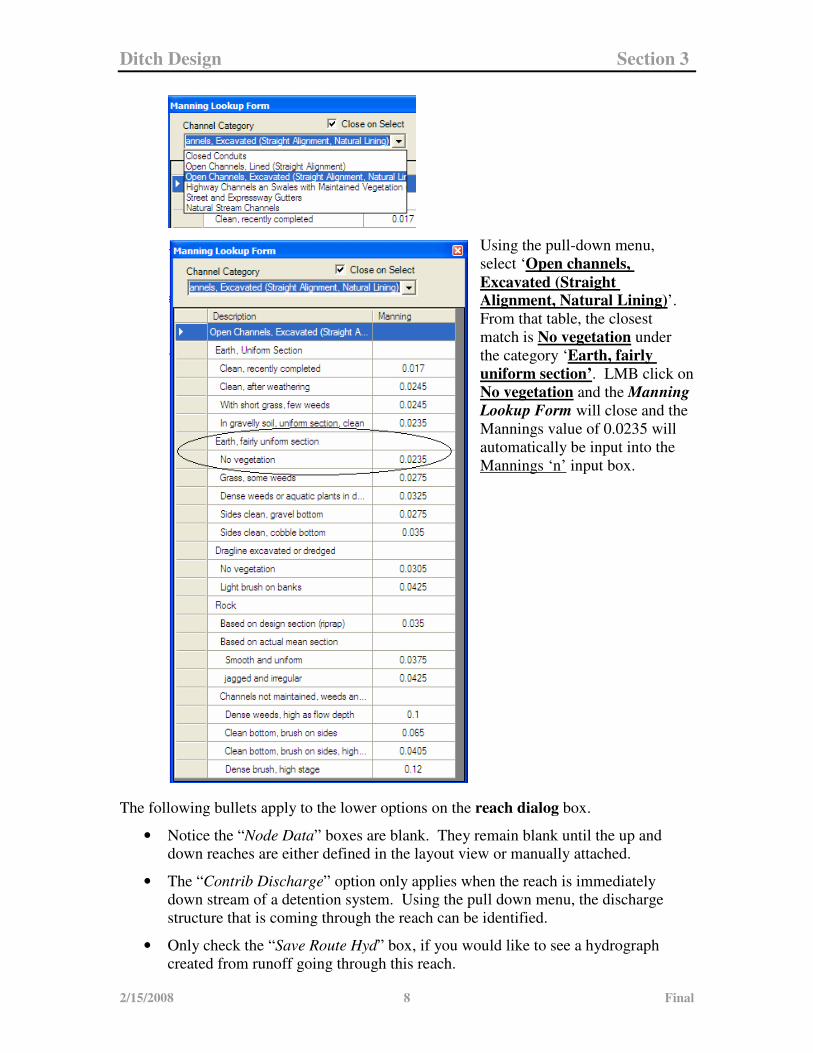
Using the pull-down menu,
select ‘Open channels,
Excavated (Straight
Alignment, Natural Lining)’.
From that table, the closest
match is No vegetation under
the category ‘Earth, fairly
uniform section’. LMB click on
No vegetation and the Manning
Lookup Form will close and the
Mannings value of 0.0235 will
automatically be input into the
Mannings ‘n’ input box.
The following bullets apply to the lower options on the reach dialog box.
• Notice the “Node Data” boxes are blank. They remain blank until the up and
down reaches are either defined in the layout view or manually attached.
• The “Contrib Discharge” option only applies when the reach is immediately
down stream of a detention system. Using the pull down menu, the discharge
structure that is coming through the reach can be identified.
• Only check the “Save Route Hyd” box, if you would like to see a hydrograph
created from runoff going through this reach.
Ditch Design Section 3
2/15/2008 9 Final
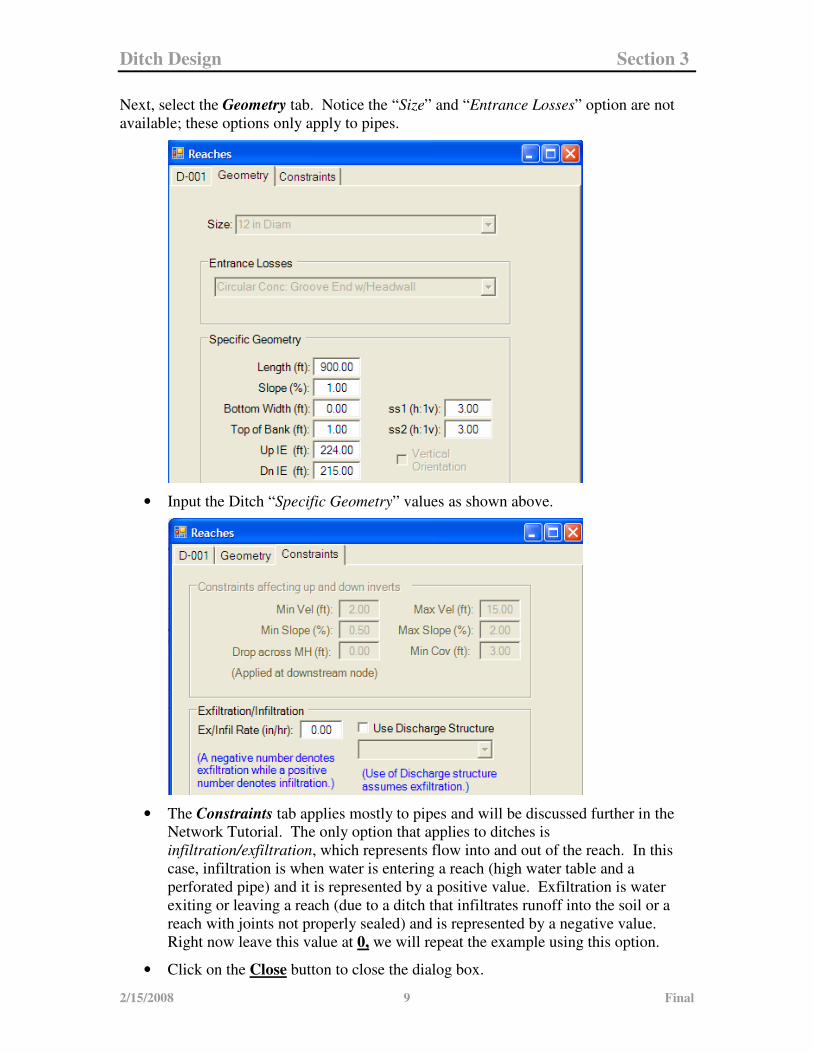
Next, select the Geometry tab. Notice the “Size” and “Entrance Losses” option are not
available; these options only apply to pipes.
• Input the Ditch “Specific Geometry” values as shown above.
• The Constraints tab applies mostly to pipes and will be discussed further in the
Network Tutorial. The only option that applies to ditches is
infiltration/exfiltration, which represents flow into and out of the reach. In this
case, infiltration is when water is entering a reach (high water table and a
perforated pipe) and it is represented by a positive value. Exfiltration is water
exiting or leaving a reach (due to a ditch that infiltrates runoff into the soil or a
reach with joints not properly sealed) and is represented by a negative value.
Right now leave this value at 0, we will repeat the example using this option.
• Click on the Close button to close the dialog box.
Ditch Design Section 3
2/15/2008 10 Final
Create Nodes
A node is required for every transition in a reach, even if there is no structure present. In
this tutorial, a Dummy Node must be defined to represent the ends of the reach so
StormSHED 3G can perform the calculations.
• Open the “PROTOTYPE” node in the Nodes section of the Data Tree View.
• Click on the New Node button.
• Rename the default node ID to dummy1.
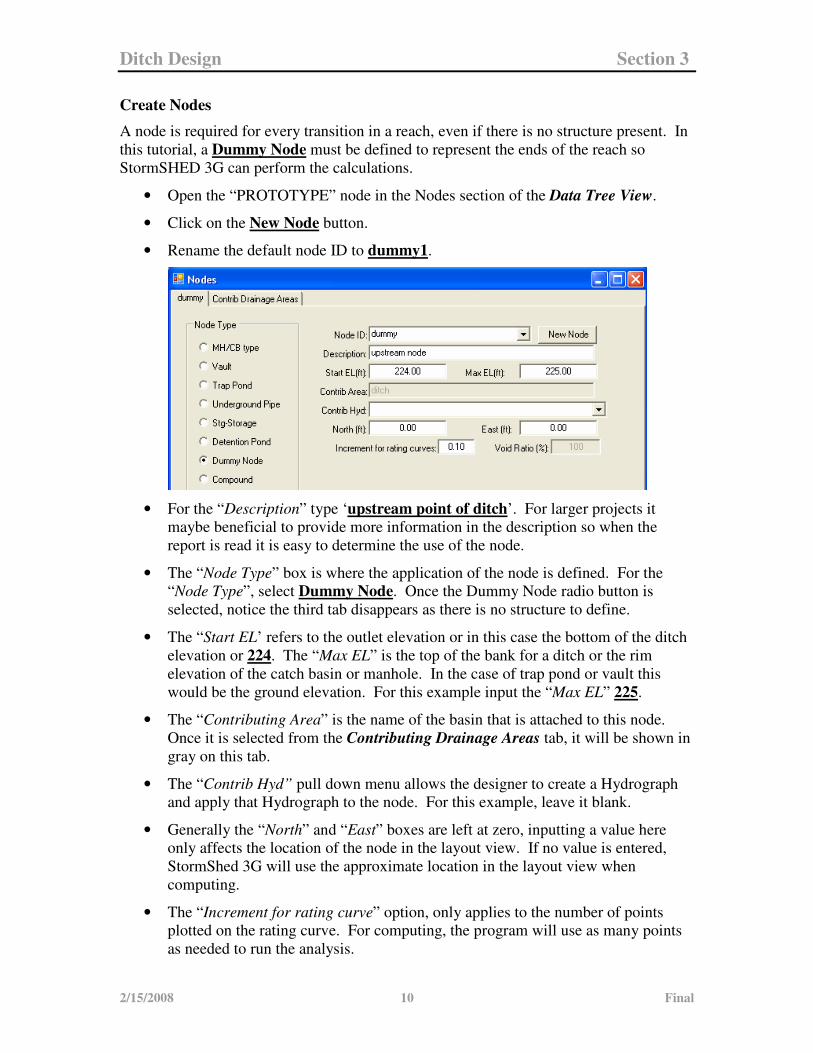
• For the “Description” type ‘upstream point of ditch’. For larger projects it
maybe beneficial to provide more information in the description so when the
report is read it is easy to determine the use of the node.
• The “Node Type” box is where the application of the node is defined. For the
“Node Type”, select Dummy Node. Once the Dummy Node radio button is
selected, notice the third tab disappears as there is no structure to define.
• The “Start EL’ refers to the outlet elevation or in this case the bottom of the ditch
elevation or 224. The “Max EL” is the top of the bank for a ditch or the rim
elevation of the catch basin or manhole. In the case of trap pond or vault this
would be the ground elevation. For this example input the “Max EL” 225.
• The “Contributing Area” is the name of the basin that is attached to this node.
Once it is selected from the Contributing Drainage Areas tab, it will be shown in
gray on this tab.
• The “Contrib Hyd” pull down menu allows the designer to create a Hydrograph
and apply that Hydrograph to the node. For this example, leave it blank.
• Generally the “North” and “East” boxes are left at zero, inputting a value here
only affects the location of the node in the layout view. If no value is entered,
StormShed 3G will use the approximate location in the layout view when
computing.
• The “Increment for rating curve” option, only applies to the number of points
plotted on the rating curve. For computing, the program will use as many points
as needed to run the analysis.
Ditch Design Section 3
2/15/2008 11 Final
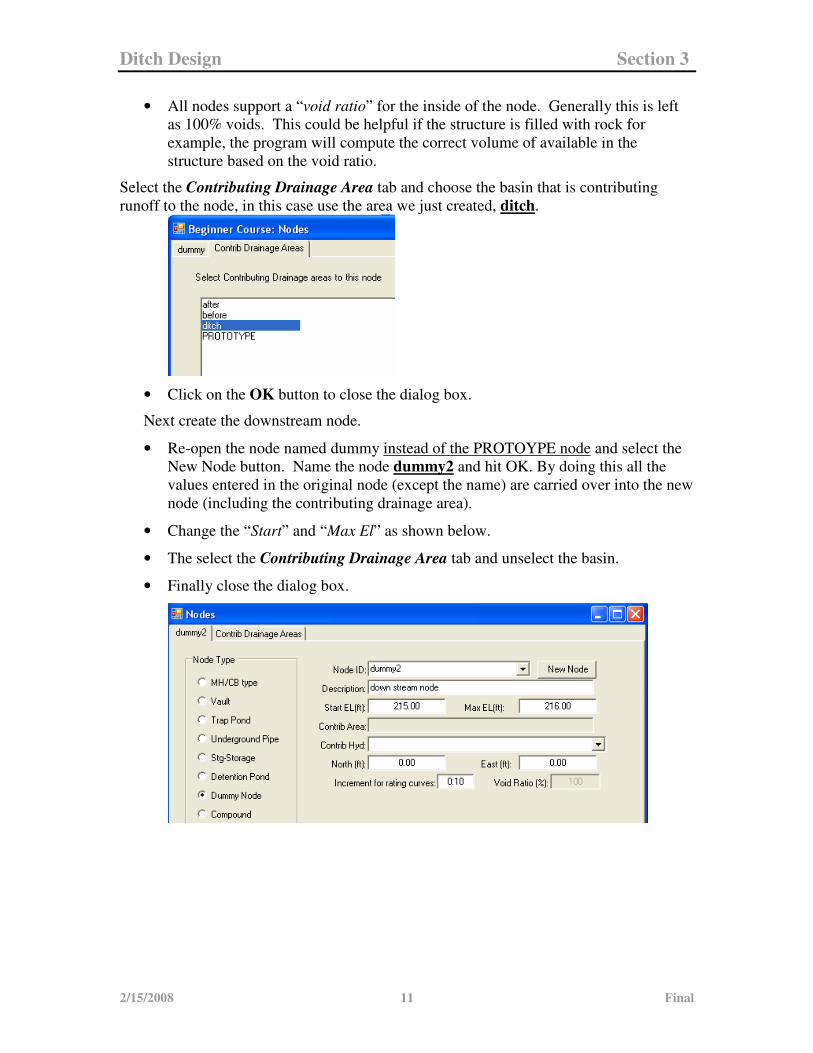
• All nodes support a “void ratio” for the inside of the node. Generally this is left
as 100% voids. This could be helpful if the structure is filled with rock for
example, the program will compute the correct volume of available in the
structure based on the void ratio.
Select the Contributing Drainage Area tab and choose the basin that is contributing
runoff to the node, in this case use the area we just created, ditch.
• Click on the OK button to close the dialog box.
Next create the downstream node.
• Re-open the node named dummy instead of the PROTOYPE node and select the
New Node button. Name the node dummy2 and hit OK. By doing this all the
values entered in the original node (except the name) are carried over into the new
node (including the contributing drainage area).
• Change the “Start” and “Max El” as shown below.
• The select the Contributing Drainage Area tab and unselect the basin.
• Finally close the dialog box.
Ditch Design Section 3
2/15/2008 12 Final
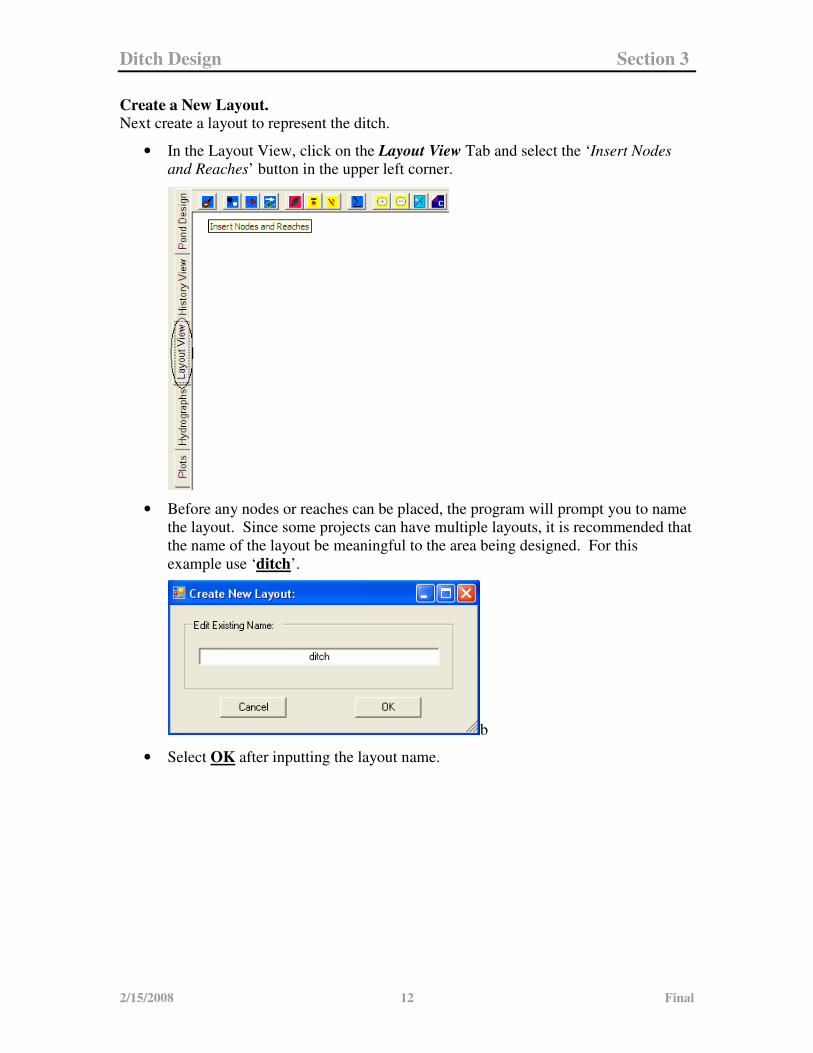
Create a New Layout.
Next create a layout to represent the ditch.
• In the Layout View, click on the Layout View Tab and select the ‘Insert Nodes
and Reaches’ button in the upper left corner.
• Before any nodes or reaches can be placed, the program will prompt you to name
the layout. Since some projects can have multiple layouts, it is recommended that
the name of the layout be meaningful to the area being designed. For this
example use ‘ditch’.
b
• Select OK after inputting the layout name.
Ditch Design Section 3
2/15/2008 13 Final
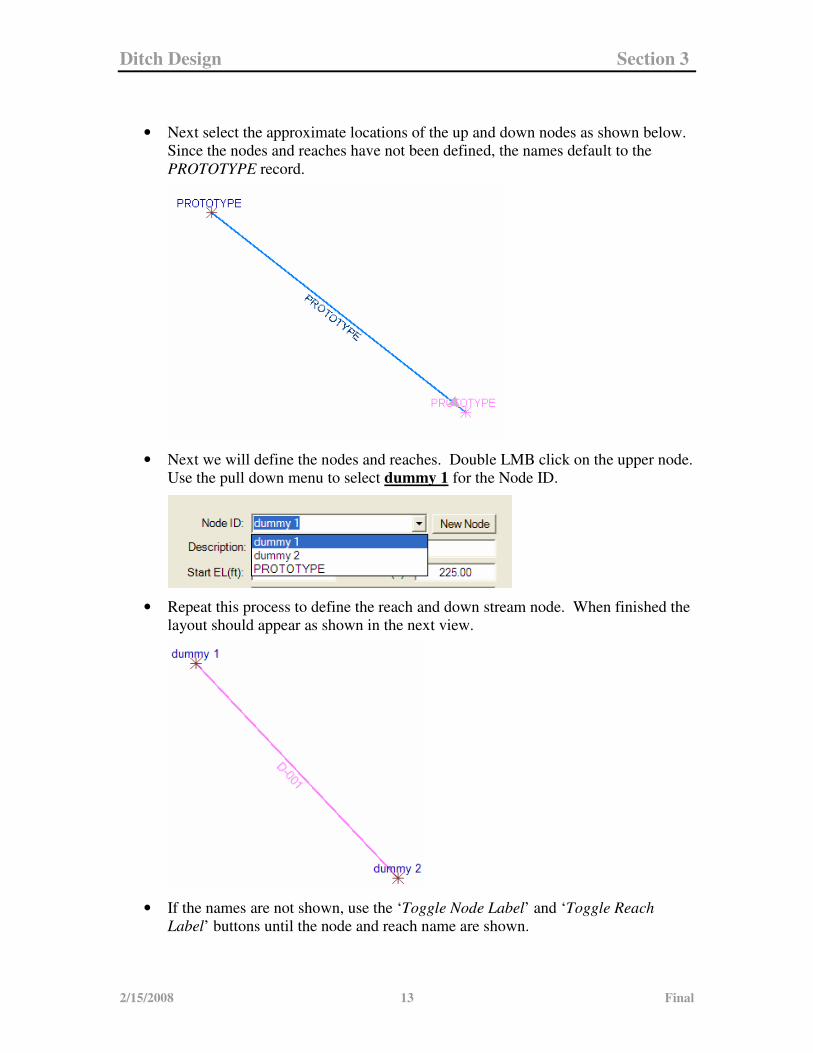
• Next select the approximate locations of the up and down nodes as shown below.
Since the nodes and reaches have not been defined, the names default to the
PROTOTYPE record.
• Next we will define the nodes and reaches. Double LMB click on the upper node.
Use the pull down menu to select dummy 1 for the Node ID.
• Repeat this process to define the reach and down stream node. When finished the
layout should appear as shown in the next view.
• If the names are not shown, use the ‘Toggle Node Label’ and ‘Toggle Reach
Label’ buttons until the node and reach name are shown.
Ditch Design Section 3
2/15/2008 14 Final
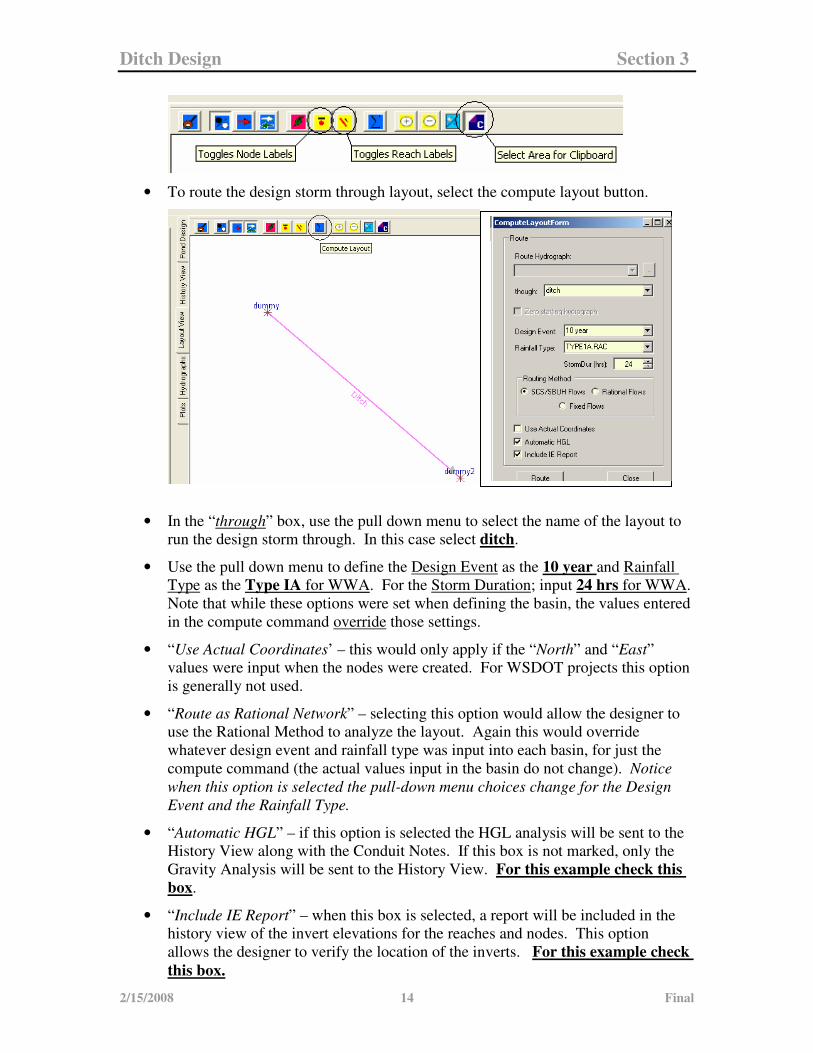
• To route the design storm through layout, select the compute layout button.
• In the “through” box, use the pull down menu to select the name of the layout to
run the design storm through. In this case select ditch.
• Use the pull down menu to define the Design Event as the 10 year and Rainfall
Type as the Type IA for WWA. For the Storm Duration; input 24 hrs for WWA.
Note that while these options were set when defining the basin, the values entered
in the compute command override those settings.
• “Use Actual Coordinates’ – this would only apply if the “North” and “East”
values were input when the nodes were created. For WSDOT projects this option
is generally not used.
• “Route as Rational Network” – selecting this option would allow the designer to
use the Rational Method to analyze the layout. Again this would override
whatever design event and rainfall type was input into each basin, for just the
compute command (the actual values input in the basin do not change). Notice
when this option is selected the pull-down menu choices change for the Design
Event and the Rainfall Type.
• “Automatic HGL” – if this option is selected the HGL analysis will be sent to the
History View along with the Conduit Notes. If this box is not marked, only the
Gravity Analysis will be sent to the History View. For this example check this
box.
• “Include IE Report” – when this box is selected, a report will be included in the
history view of the invert elevations for the reaches and nodes. This option
allows the designer to verify the location of the inverts. For this example check
this box.
Ditch Design Section 3
2/15/2008 15 Final
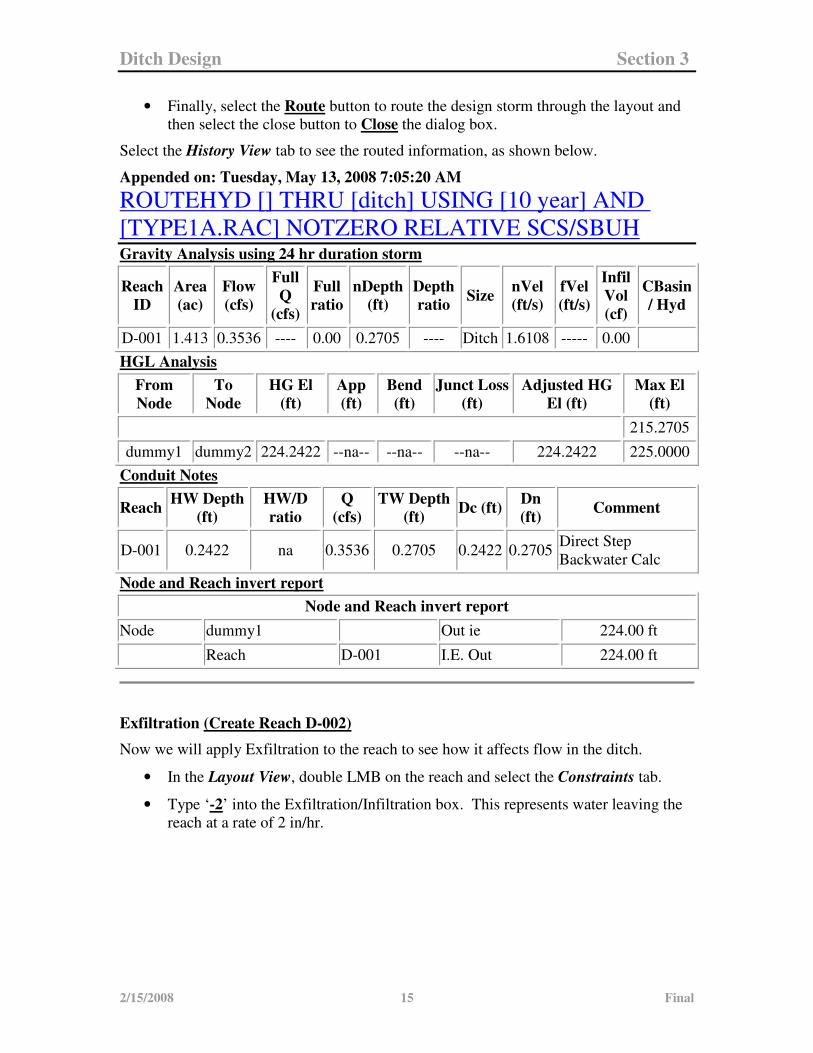
• Finally, select the Route button to route the design storm through the layout and
then select the close button to Close the dialog box.
Select the History View tab to see the routed information, as shown below.
Appended on: Tuesday, May 13, 2008 7:05:20 AM
ROUTEHYD [] THRU [ditch] USING [10 year] AND
[TYPE1A.RAC] NOTZERO RELATIVE SCS/SBUH Gravity Analysis using 24 hr duration storm
Reach
ID
Area
(ac)
Flow
(cfs)
Full
Q
(cfs)
Full
ratio
nDepth
(ft)
Depth
ratio Size
nVel
(ft/s)
fVel
(ft/s)
Infil
Vol
(cf)
CBasin
/ Hyd
D-001 1.413 0.3536 ---- 0.00 0.2705 ---- Ditch 1.6108 ----- 0.00
HGL Analysis
From
Node
To
Node
HG El
(ft)
App
(ft)
Bend
(ft)
Junct Loss
(ft)
Adjusted HG
El (ft)
Max El
(ft)
215.2705
dummy1 dummy2 224.2422 --na-- --na-- --na-- 224.2422 225.0000
Conduit Notes
Reach HW Depth
(ft)
HW/D
ratio
Q
(cfs)
TW Depth
(ft) Dc (ft)
Dn
(ft) Comment
D-001 0.2422 na 0.3536 0.2705 0.2422 0.2705 Direct Step
Backwater Calc
Node and Reach invert report
Node and Reach invert report
Node dummy1 Out ie 224.00 ft
Reach D-001 I.E. Out 224.00 ft
Exfiltration (Create Reach D-002)
Now we will apply Exfiltration to the reach to see how it affects flow in the ditch.
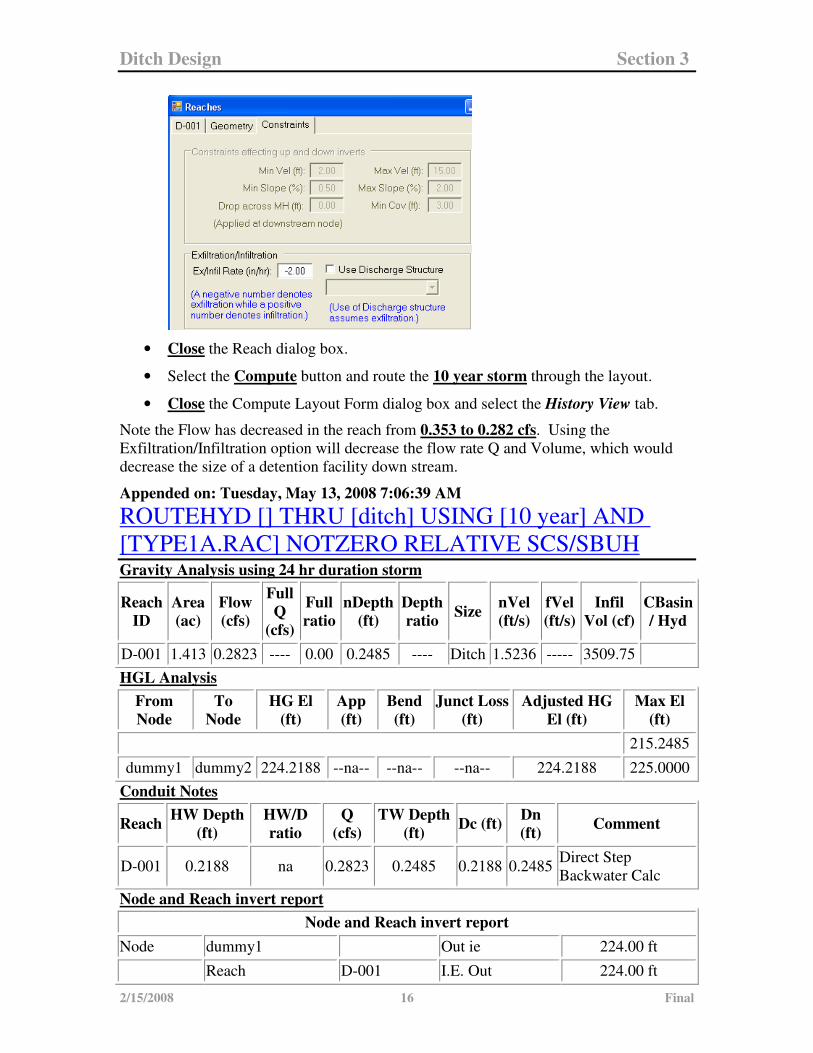
• In the Layout View, double LMB on the reach and select the Constraints tab.
• Type ‘-2’ into the Exfiltration/Infiltration box. This represents water leaving the
reach at a rate of 2 in/hr.
Ditch Design Section 3
2/15/2008 16 Final
• Close the Reach dialog box.
• Select the Compute button and route the 10 year storm through the layout.
• Close the Compute Layout Form dialog box and select the History View tab.
Note the Flow has decreased in the reach from 0.353 to 0.282 cfs. Using the
Exfiltration/Infiltration option will decrease the flow rate Q and Volume, which would
decrease the size of a detention facility down stream.
Appended on: Tuesday, May 13, 2008 7:06:39 AM
ROUTEHYD [] THRU [ditch] USING [10 year] AND
[TYPE1A.RAC] NOTZERO RELATIVE SCS/SBUH Gravity Analysis using 24 hr duration storm
Reach
ID
Area
(ac)
Flow
(cfs)
Full
Q
(cfs)
Full
ratio
nDepth
(ft)
Depth
ratio Size
nVel
(ft/s)
fVel
(ft/s)
Infil
Vol (cf)
CBasin
/ Hyd
D-001 1.413 0.2823 ---- 0.00 0.2485 ---- Ditch 1.5236 ----- 3509.75
HGL Analysis
From
Node
To
Node
HG El
(ft)
App
(ft)
Bend
(ft)
Junct Loss
(ft)
Adjusted HG
El (ft)
Max El
(ft)
215.2485
dummy1 dummy2 224.2188 --na-- --na-- --na-- 224.2188 225.0000
Conduit Notes
Reach HW Depth
(ft)
HW/D
ratio
Q
(cfs)
TW Depth
(ft) Dc (ft)
Dn
(ft) Comment
D-001 0.2188 na 0.2823 0.2485 0.2188 0.2485 Direct Step
Backwater Calc
Node and Reach invert report
Node and Reach invert report
Node dummy1 Out ie 224.00 ft
Reach D-001 I.E. Out 224.00 ft
Ditch Design Section 3
2/15/2008 17 Final
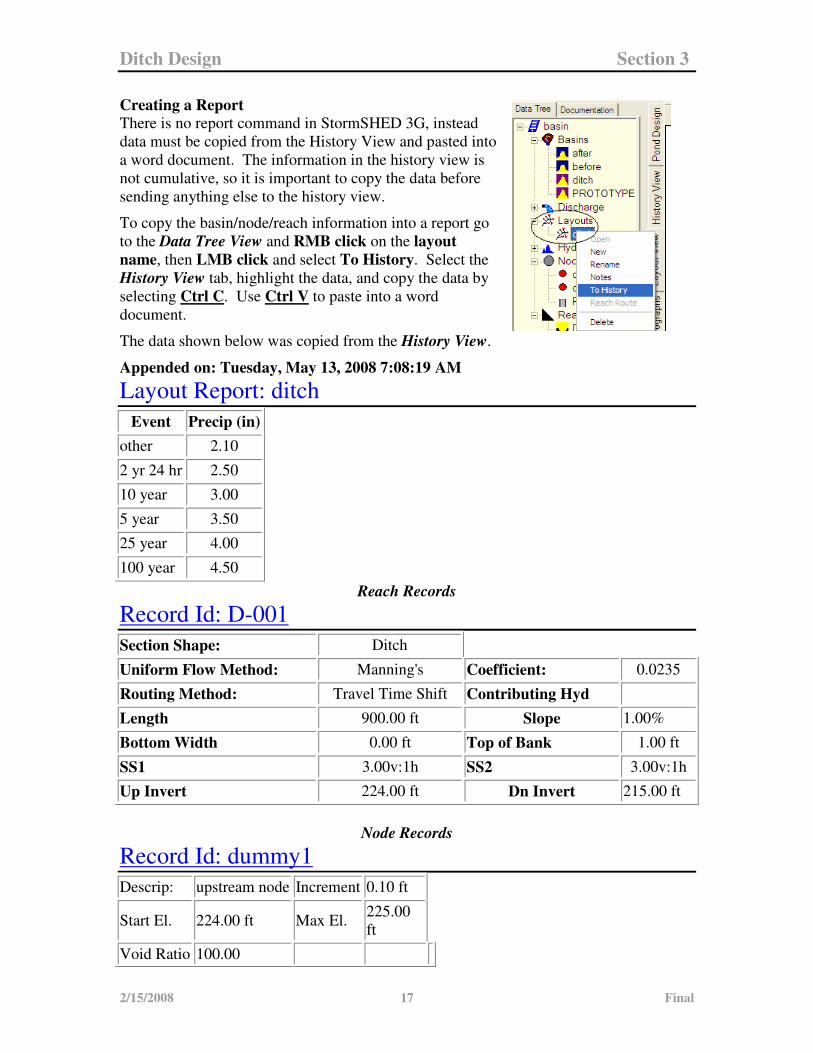
Creating a Report There is no report command in StormSHED 3G, instead
data must be copied from the History View and pasted into
a word document. The information in the history view is
not cumulative, so it is important to copy the data before
sending anything else to the history view.
To copy the basin/node/reach information into a report go
to the Data Tree View and RMB click on the layout
name, then LMB click and select To History. Select the
History View tab, highlight the data, and copy the data by
selecting Ctrl C. Use Ctrl V to paste into a word
document.
The data shown below was copied from the History View.
Appended on: Tuesday, May 13, 2008 7:08:19 AM
Layout Report: ditch
Event Precip (in)
other 2.10
2 yr 24 hr 2.50
10 year 3.00
5 year 3.50
25 year 4.00
100 year 4.50
Reach Records
Record Id: D-001
Section Shape: Ditch
Uniform Flow Method: Manning's Coefficient: 0.0235
Routing Method: Travel Time Shift Contributing Hyd
Length 900.00 ft Slope 1.00%
Bottom Width 0.00 ft Top of Bank 1.00 ft
SS1 3.00v:1h SS2 3.00v:1h
Up Invert 224.00 ft Dn Invert 215.00 ft
Node Records
Record Id: dummy1
Descrip: upstream node Increment 0.10 ft
Start El. 224.00 ft Max El. 225.00
ft
Void Ratio 100.00
Ditch Design Section 3
2/15/2008 18 Final
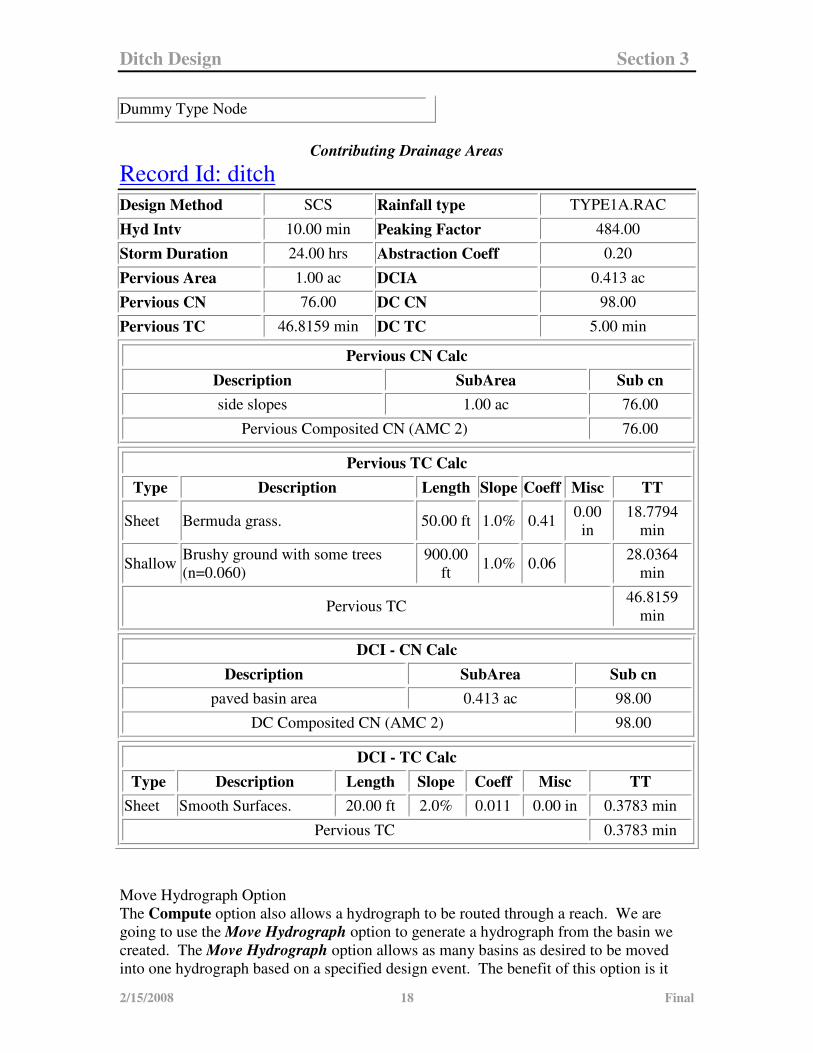
Dummy Type Node
Contributing Drainage Areas
Record Id: ditch
Design Method SCS Rainfall type TYPE1A.RAC
Hyd Intv 10.00 min Peaking Factor 484.00
Storm Duration 24.00 hrs Abstraction Coeff 0.20
Pervious Area 1.00 ac DCIA 0.413 ac
Pervious CN 76.00 DC CN 98.00
Pervious TC 46.8159 min DC TC 5.00 min
Pervious CN Calc
Description SubArea Sub cn
side slopes 1.00 ac 76.00
Pervious Composited CN (AMC 2) 76.00
Pervious TC Calc
Type Description Length Slope Coeff Misc TT
Sheet Bermuda grass. 50.00 ft 1.0% 0.41 0.00
in
18.7794
min
Shallow Brushy ground with some trees
(n=0.060)
900.00
ft 1.0% 0.06
28.0364
min
Pervious TC 46.8159
min
DCI - CN Calc
Description SubArea Sub cn
paved basin area 0.413 ac 98.00
DC Composited CN (AMC 2) 98.00
DCI - TC Calc
Type Description Length Slope Coeff Misc TT
Sheet Smooth Surfaces. 20.00 ft 2.0% 0.011 0.00 in 0.3783 min
Pervious TC 0.3783 min
Move Hydrograph Option
The Compute option also allows a hydrograph to be routed through a reach. We are
going to use the Move Hydrograph option to generate a hydrograph from the basin we
created. The Move Hydrograph option allows as many basins as desired to be moved
into one hydrograph based on a specified design event. The benefit of this option is it
Ditch Design Section 3
2/15/2008 19 Final
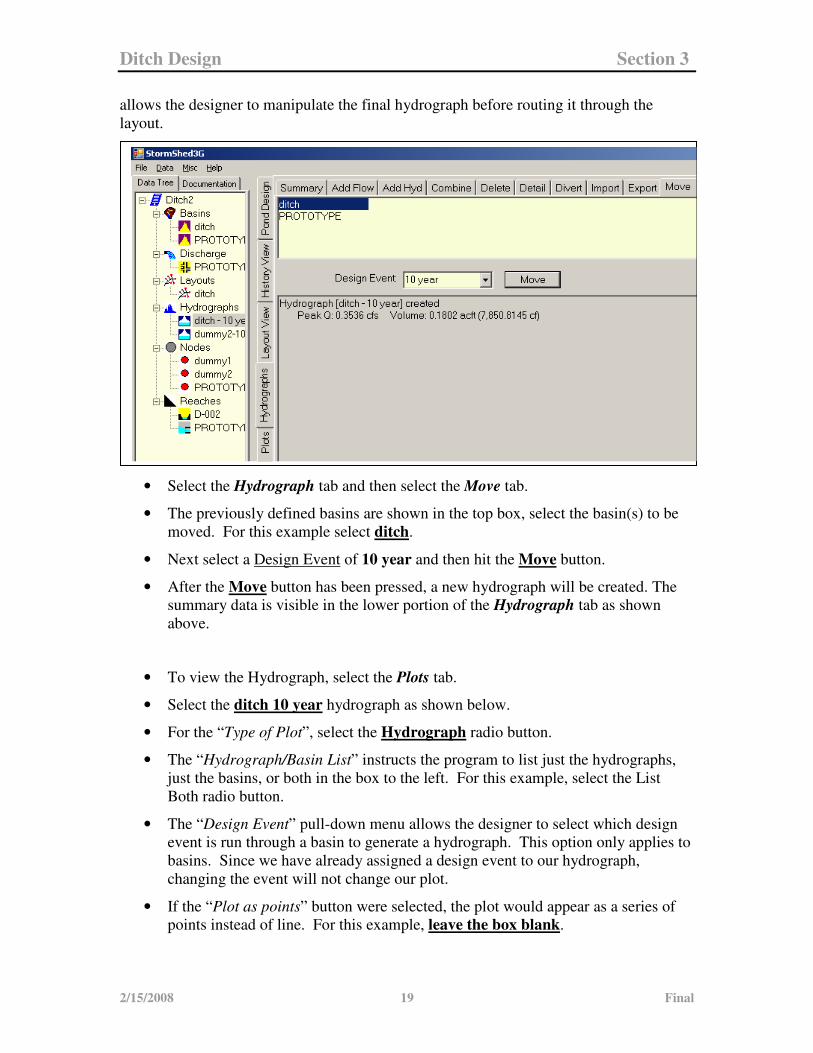
allows the designer to manipulate the final hydrograph before routing it through the
layout.
• Select the Hydrograph tab and then select the Move tab.
• The previously defined basins are shown in the top box, select the basin(s) to be
moved. For this example select ditch.
• Next select a Design Event of 10 year and then hit the Move button.
• After the Move button has been pressed, a new hydrograph will be created. The
summary data is visible in the lower portion of the Hydrograph tab as shown
above.
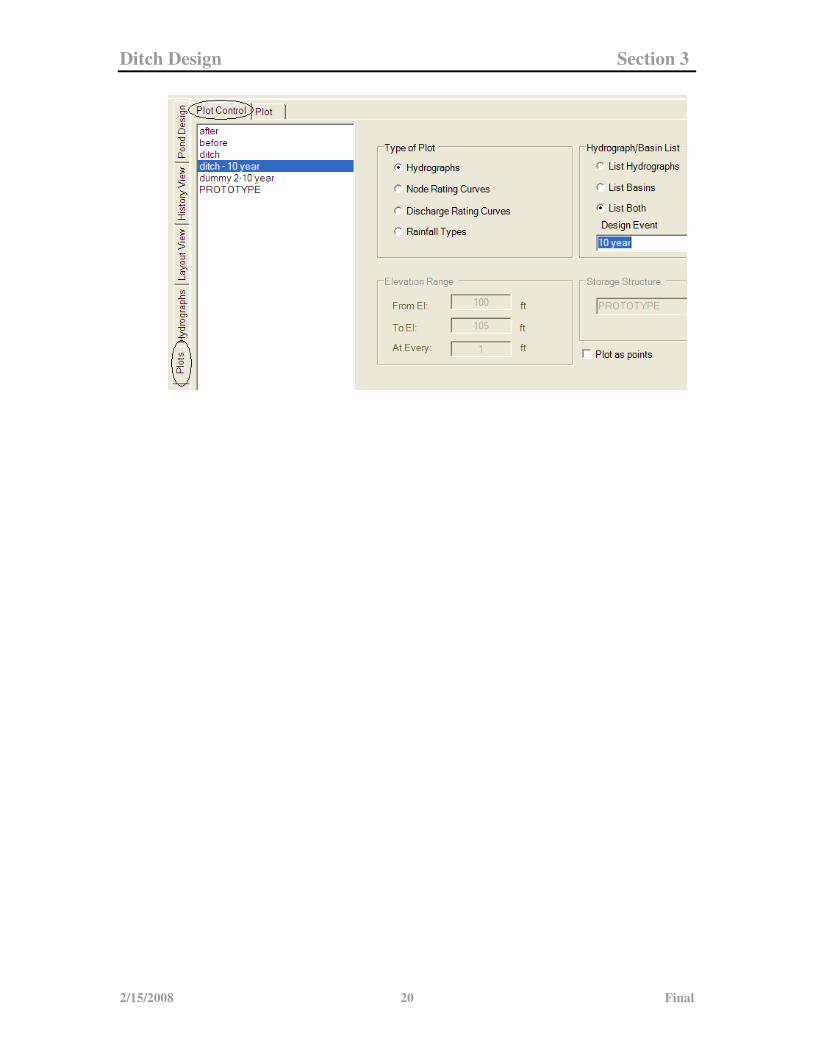
• To view the Hydrograph, select the Plots tab.
• Select the ditch 10 year hydrograph as shown below.
• For the “Type of Plot”, select the Hydrograph radio button.
• The “Hydrograph/Basin List” instructs the program to list just the hydrographs,
just the basins, or both in the box to the left. For this example, select the List
Both radio button.
• The “Design Event” pull-down menu allows the designer to select which design
event is run through a basin to generate a hydrograph. This option only applies to
basins. Since we have already assigned a design event to our hydrograph,
changing the event will not change our plot.
• If the “Plot as points” button were selected, the plot would appear as a series of
points instead of line. For this example, leave the box blank.
Ditch Design Section 3
2/15/2008 20 Final
Ditch Design Section 3
2/15/2008 21 Final
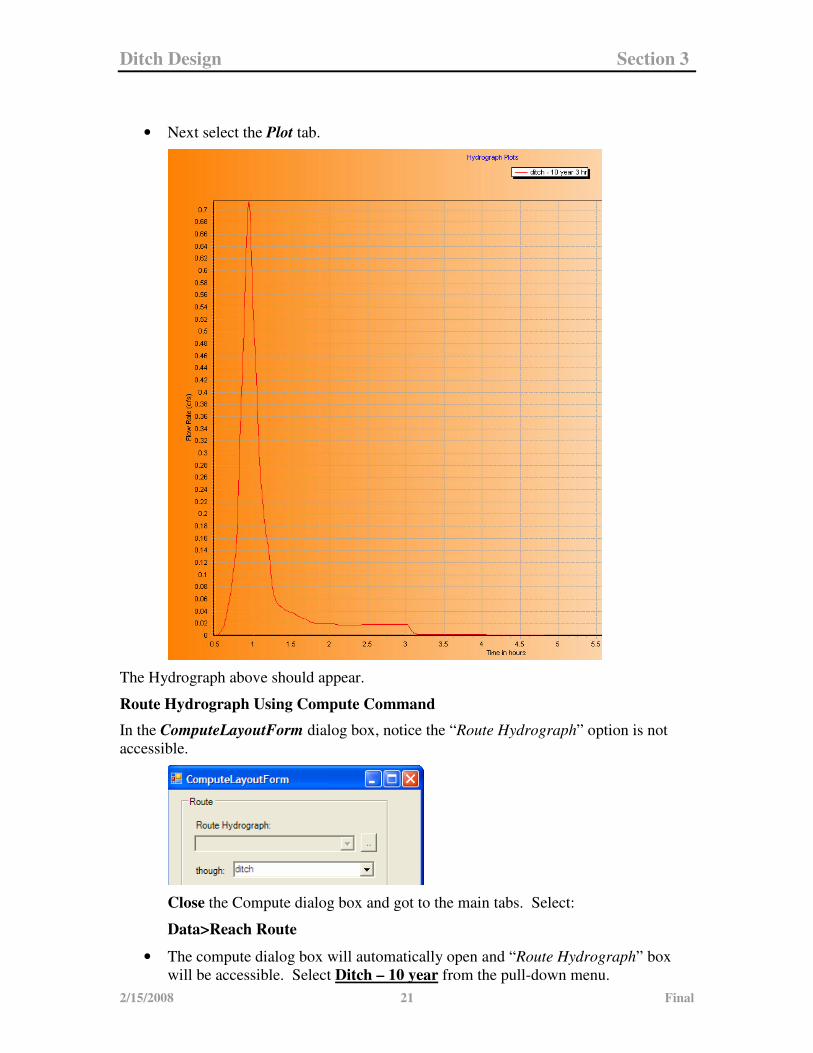
• Next select the Plot tab.
The Hydrograph above should appear.
Route Hydrograph Using Compute Command
In the ComputeLayoutForm dialog box, notice the “Route Hydrograph” option is not
accessible.
Close the Compute dialog box and got to the main tabs. Select:
Data>Reach Route
• The compute dialog box will automatically open and “Route Hydrograph” box
will be accessible. Select Ditch – 10 year from the pull-down menu.
Ditch Design Section 3
2/15/2008 22 Final
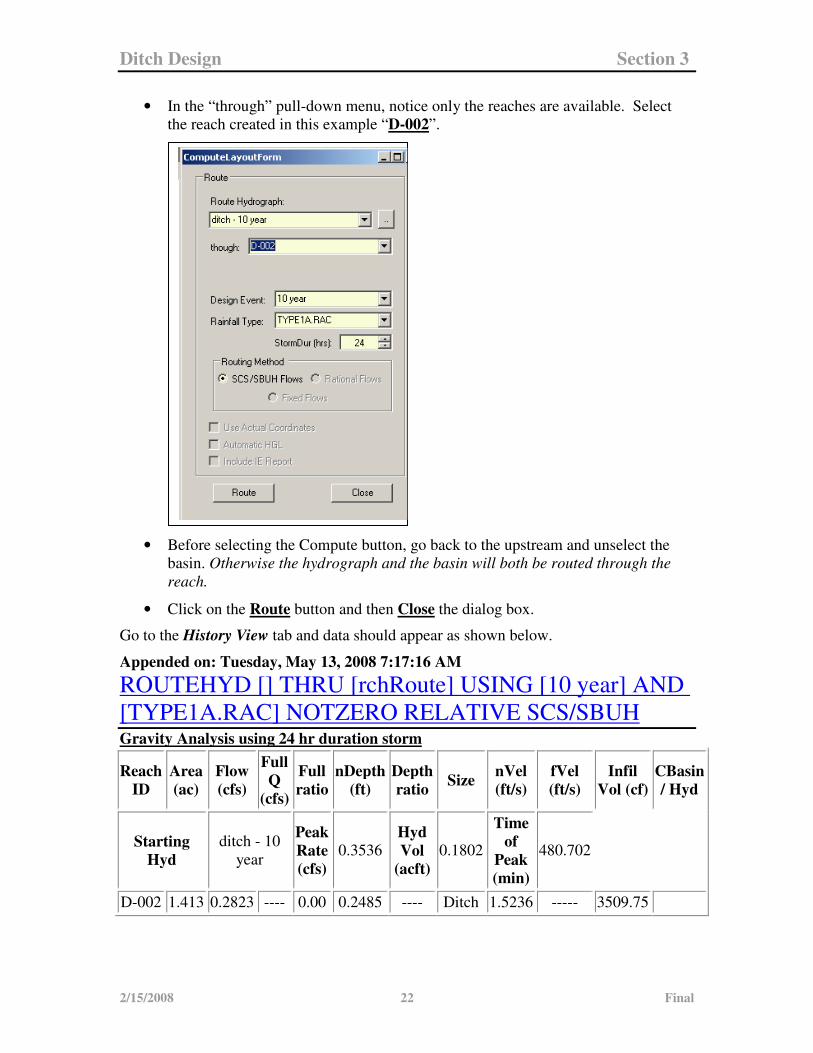
• In the “through” pull-down menu, notice only the reaches are available. Select
the reach created in this example “D-002”.
• Before selecting the Compute button, go back to the upstream and unselect the
basin. Otherwise the hydrograph and the basin will both be routed through the
reach.
• Click on the Route button and then Close the dialog box.
Go to the History View tab and data should appear as shown below.
Appended on: Tuesday, May 13, 2008 7:17:16 AM
ROUTEHYD [] THRU [rchRoute] USING [10 year] AND
[TYPE1A.RAC] NOTZERO RELATIVE SCS/SBUH Gravity Analysis using 24 hr duration storm
Reach
ID
Area
(ac)
Flow
(cfs)
Full
Q
(cfs)
Full
ratio
nDepth
(ft)
Depth
ratio Size
nVel
(ft/s)
fVel
(ft/s)
Infil
Vol (cf)
CBasin
/ Hyd
Starting
Hyd
ditch - 10
year
Peak
Rate
(cfs)
0.3536 Hyd
Vol
(acft)
0.1802
Time
of
Peak
(min)
480.702
D-002 1.413 0.2823 ---- 0.00 0.2485 ---- Ditch 1.5236 ----- 3509.75
Ditch Design Section 3
2/15/2008 23 Final
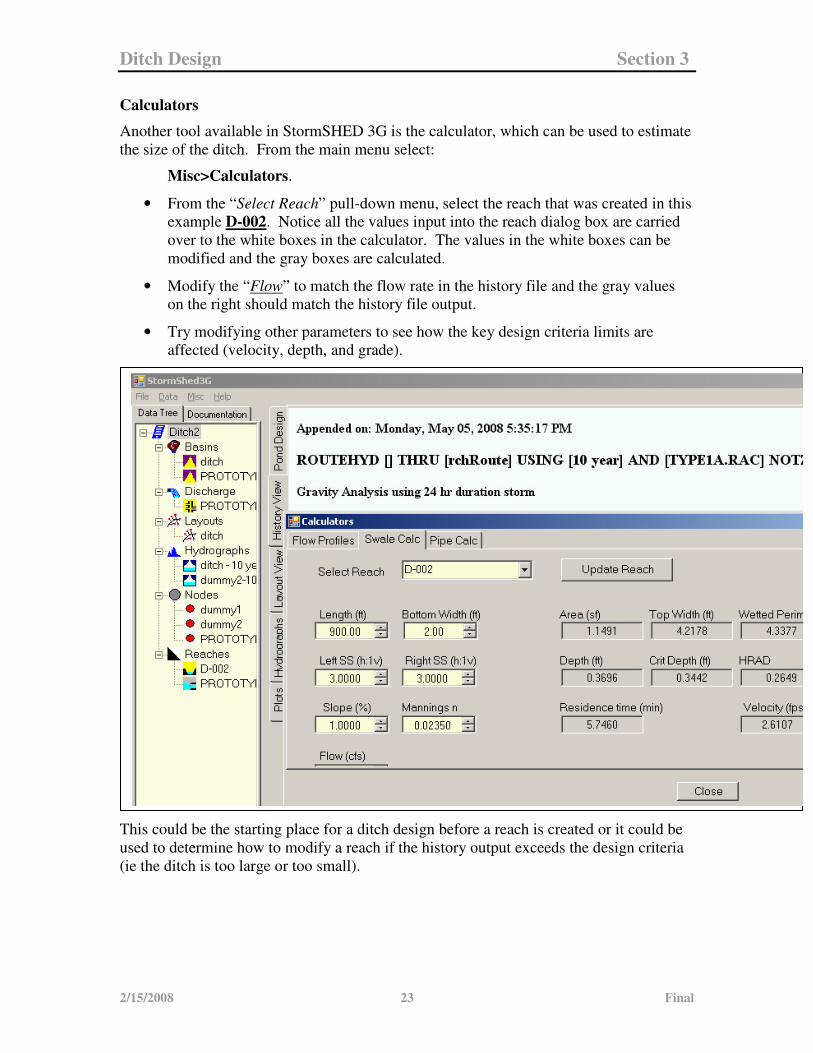
Calculators
Another tool available in StormSHED 3G is the calculator, which can be used to estimate
the size of the ditch. From the main menu select:
Misc>Calculators.
• From the “Select Reach” pull-down menu, select the reach that was created in this
example D-002. Notice all the values input into the reach dialog box are carried
over to the white boxes in the calculator. The values in the white boxes can be
modified and the gray boxes are calculated.
• Modify the “Flow” to match the flow rate in the history file and the gray values
on the right should match the history file output.
• Try modifying other parameters to see how the key design criteria limits are
affected (velocity, depth, and grade).
This could be the starting place for a ditch design before a reach is created or it could be
used to determine how to modify a reach if the history output exceeds the design criteria
(ie the ditch is too large or too small).