Embed Size (px)
Citation preview
Working Paper
2079-07
Diverse Engagement Profiles:
Demonstration and Implications of Test
Preparation for High-Stakes Exams
Abeer A. Alamri. PhD and Edgar Sanchez. PhD
ACT.org ooeco ACT®
The authors thank Jeff Allen, Scott Payne, and Ruitao Liu for their helpful comments and suggestions on earlier drafts of this research.
© 2019 by ACT, Inc. All rights reserved. R1732
ACT working papers document preliminary research. The papers are intended to promote discussion and feedback before formal publication. The research does not necessarily reflect the views of ACT.
Abeer A. Alamri earned her Ph.D. and Master's Degrees in Educational Measurement and Evaluation from the University of South Florida. She has a broad interest in structural equation modeling, multilevel modeling, Bayesian analysis, finite mixture modeling, and cross-cultural research.
Edgar SanchEdgar Sanchez, a senior research scientist in the Validity and Efficacy Research department at ACT, works on predictive modeling of student educational outcomes. He is currently focusing on the efficacy of test preparation programs.
1
Diverse Engagement Profiles: Demonstration and Implications of Test Preparation for
High-Stakes Exams
Abstract
Students from different demographic and academic backgrounds use many different types
of test preparation products. Understanding variations in test preparation usage can help inform
product improvement efforts and can also help guide how test preparation developers advise new
users to get the most from their preparation. In this study, we aim to characterize how students
enrolled in a test preparation product, ACT® Online Test Prep (AOP), use that product.
Following Geiser (2012), Masyn (2013), and Morin (2016), we use latent profile analysis (LPA)
to identify students’ engagement profiles using four engagement measures: activity, time,
practice ACT score, and percent correct. Data collected from 9,017 students between December
2015 and June 2018 identified five student engagement profiles as Low-Usage/Low-Performance
(24.1%), Low-Usage/High-Performance (7.2%), Low-Usage/Moderate-Performance (31.7%),
Moderate-Usage/Low-Performance (16.8%), and High-Usage/Moderate-Performance (20.2%).
We found that these engagement profiles were distinguished by activity, time, practice ACT
score, and percent correct; they were also differentially predicted by gender in one profile. The
heterogeneity of engagement profiles is discussed in relation to usage and performance as well as
potential future research directions.
Word count 183
Keywords: ACT Online Test Prep, AOP, latent profile analysis, LPA, mixture models
2
Introduction
High-stakes standardized testing (e.g., ACT® and SAT) can play an important role in
helping students attain their academic goals. As a result, students are motivated to improve their
test scores to improve their readiness for college, meet admissions requirements, maximize
scholarship opportunities, and avoid remediation. The use of these tests includes measuring
college and career readiness, college admissions, scholarships, and course placement. In 2017,
just over two million high school graduates, approximately 60% of high school graduates, took
the ACT with an average ACT Composite score of 21.0 (ACT, 2017a; ACT, 2017b). Of those
students, 27% met all four ACT College Readiness Benchmarks.
Students can use many different tools to prepare for the ACT test, including resources
from ACT, which provide different types of supports and content review. Within the test
preparation literature, research has demonstrated the positive impact of test preparation on test
scores (e.g., Briggs, 2009; Messick & Jungeblut, 1981; Moore, Sanchez, & San Pedro, 2018;
Sanchez & Harnisher, 2018). Some research has studied motivational factors that may affect
student preparation (e.g., Appelrouth, Zabrucky, & Moore, 2015), while other research has
investigated the causal evidence of the impact of test preparation on scores (Moore et al., 2018).
However, different usage patterns of test preparation products have not been studied.
Therefore, we seek to identify the emergent profiles of users of ACT Online Prep (AOP). In this
manuscript, we elaborate on key features of AOP, present the empirical data, discuss the results,
and summarize recommendations for future researchers.
3
ACT Online Prep (AOP)
ACT1 offers a variety of test preparation materials that feature real questions and sample
materials from previous tests including: the Real ACT Prep Workbook; ACT® Academy™; ACT
Online Prep (AOP); ACT Rapid Review; and a collaboration with Kaplan Test Prep to offer an
interactive virtual classroom called ACT® Kaplan® Online Prep Live (OPL). In this paper, we
limited our examination of test preparation to the AOP product.
AOP is a subscription-based online service with access to a dynamic, interactive test
preparation course designed by ACT. It consists of six components that target skills in the four
subjects (English, mathematics, reading, and science): practice sessions, instructional lessons,
ACT practice tests, discussion boards, educational games, and flashcards. The program offers a
personalized learning path, and students can choose from a variety of activities with
comprehensive content review. Predicted scores and feedback are provided, and users can reset
the activities, including tests.
Practice Sessions
Practice sessions consist of diagnostic and practice questions. This feature consists of
more than 2,400 practice questions (items) that cover the four ACT subjects. The practice items
facilitate learning through scaffolding with immediate feedback on student progress.
Instructional Lessons
Instructional lessons are extensive reviews of content covered within the four ACT
subject tests. For example, the math lessons prepare students for math topics such as statistics
and probability, Algebra, functions, number and quantity, and Geometry. At the end of each
lesson, students are asked to report their confidence level in that topic (low, medium, high).
1 For more information about all ACT Test Prep products, visit https://www.act.org/content/act/en/products-and-services/the-act/test-preparation.html
4
ACT Practice Tests
When students practice the ACT test, they may pick a short or long form. A timed short
ACT test is a limited number of retired ACT items in one of the four ACT subjects; once
completed, students are provided with a predicted ACT subject test score range. The long form
practice test consists of timed, retired ACT tests that mimic the official four-subject ACT test. At
the end, students receive estimated ACT scores for each of the four individual subject tests as
well as a Composite practice score. Students are able to reset and retake both forms of tests.
Discussion Boards, Educational Games, and Flashcards
These AOP components focus on peer/group interaction via a discussion board where
students discuss test preparation or ask questions in order to learn from each other. Individual
learning is also supported using educational games and flashcards, targeting specific concepts
covered on the ACT.
Background: Test Preparation Efficacy Research
Students taking high-stakes exams come from different backgrounds and are exposed to
different educational settings and instruction; therefore, personalized learning plans are an
effective way to provide individualized opportunities (NACAC, 2015). The same holds true for
test preparation strategies, which can provide students with individualized plans to navigate the
complex requirements of assessments. Instead of following a common strategy, students may use
many types of strategies to arrive at a final answer when taking standardized tests (Baleghizadeh
& Yousefian, 2012). Further, applying different strategies toward understanding the construction
of tests is a valid preparation approach (Baleghizadeh & Yousefian, 2012). Worthwhile
preparation activities could include practicing different types of questions under time constraints,
utilization of vocabulary knowledge, and ways to eliminate wrong answer choices.
5
Several factors that influence the effectiveness of test preparation, such as prior test
score, school attendance, and preparation participation have been examined, and the results
showed various contributions to improved test scores. For example, allotted time and type of test
preparation were found to have positive influences on test scores. Messick and Jungeblut (1981)
studied the impact of time and methods of test preparation on the improvement of students’ SAT
score by examining previously published studies. They emphasized that both amount of time and
duration of test preparation positively impacted students’ scores. They further noted that the
effect of time was confounded with other aspects of test preparation (i.e., increasing curriculum
emphases on content knowledge and skill development).
Appelrouth, Zabrucky, and Moore (2015) noted that factors such as gender, school type,
homework completion, time allotted, and tutoring type, (i.e., individual versus groups) could
impact the effect test preparation has on SAT scores. They collected data from 1,933 junior and
senior students who participated in SAT test preparation programs in three large metropolitan
areas. They also collected demographic information, prior SAT score, attendance, preparation
participation, and post SAT score. Time allotted on practice tests and type of preparation (e.g.,
individual versus group tutoring) were significant factors in predicting score gain. They stated
that each individual preparation hour contributed to a 2.34 point gain on the SAT (0.07 SD
units).2,3 Both time and type of test preparation were positively related to students’ test scores.
For the ACT test, several studies have been conducted which examine the effect of test
preparation. Sanchez and Harnisher (2018) investigated the effectiveness of test preparation on
2 In 2014, the standard error of measurement of the SAT was approximately 32 points (College Board, 2015). This means that if a student retook the SAT with no additional learning they have a 68% chance of scoring within 32 points of their original test score. 3 Effect size is based on the coefficient of 2.34, the standard deviation associated with individual tutoring hours (9.31), and the 2016 College Bound Seniors Report standard deviation of SAT total score (297.4).
6
ACT score gains for students that had taken the test more than once by comparing scores for a
treatment group who enrolled in test preparation and a control group who did not. Using a quasi-
experimental design, they found that the treatment group had higher retest scores (0.13 SD units)
than their control group counterparts. They also found that this increase was greatest for low-
income students.
Moore, Sanchez, and San Pedro (2018) examined the impact of 10 different ACT
preparation tools on ACT retest scores. The findings indicated that students who participated in
test preparation had higher ACT Composite scores compared to students who did not. The
adjusted ACT Composite mean was 24.33 for the test preparation group verses 23.63 for the
non-test preparation group (0.14 SD units). Moreover, the adjusted mean score varied based on
time spent on test preparation (e.g., adjusted mean score of 24.91 when a student studied 11
hours or more with a private tutor or consultant).
The Current Study
Purposes and Research Questions
This study is exploratory as it is the first investigation to identify distinct profiles of test
preparation usage and we were not able to find similar published research. This study examines
the frequently occurring combinations of four engagement factors among students who enrolled
in AOP. We apply latent profile analysis (LPA) techniques to identify profiles of AOP usage and
performance. Once specific profiles are defined, a secondary purpose is to test for gender
differences in profile frequency. While there are many variables of interest besides gender one
could examine, we use gender to examine a key demographic characteristic as well as to
illustrate the methodology. Specifically, we seek to answer these questions: Is there a profile
structure that adequately represents the heterogeneity of AOP usage (i.e., are there patterns of
7
engagement)? If so, what are they and what is their prevalence? Are male and female students
equally represented across different profiles?
Addressing these questions will provide insight into how test preparation strategies for
high-stakes exams can be refined to address the needs of different user profiles. We hypothesize
that two or more AOP student profiles will emerge. We also expect to observe profile differences
in usage of AOP components and levels of performance.
Methods
Study Population and Design
AOP data were collected from December 2015 to June 2018. We collected data from
activities, practice tests, lessons, and software resets.4 Sixteen different AOP variables were
available; however, not all of these variables were used due to redundancy. For example, there
was a variable for each category of ACT practice test, i.e., English, mathematics, reading, and
science, as well as a variable for the composite test score. We used the composite ACT practice
test: the mathematical mean of the English, mathematics, reading, and science practice tests.5 As
a result, we retained 10 variables from the AOP activities, practice tests, lesson, and reset data.6
We excluded cases when there were no records for the students (the student did not use that
particular AOP component), using ListWise deletion, (i.e., delete all observations from the
analysis that have missing values on one or more of the analysis variables; Peugh and Enders,
2004), as an attempt to have a full set of valid values across all 10 variables, leaving 9,017 AOP
students for the analysis. All data descriptive analyses are conducted using SAS Enterprise 7.1.
4 Software resets allow a student to clear responses for practice items and/or tests and take them again. 5 We used the Composite score rather than the subject tests both as an overall index of achievement on the subject tests and because it is typically the key marker of achievement for college admissions and scholarships. 6 The six omitted variables included the four subject scores used to create the Composite score as well as two duration items that were redundant with other duration variables.
8
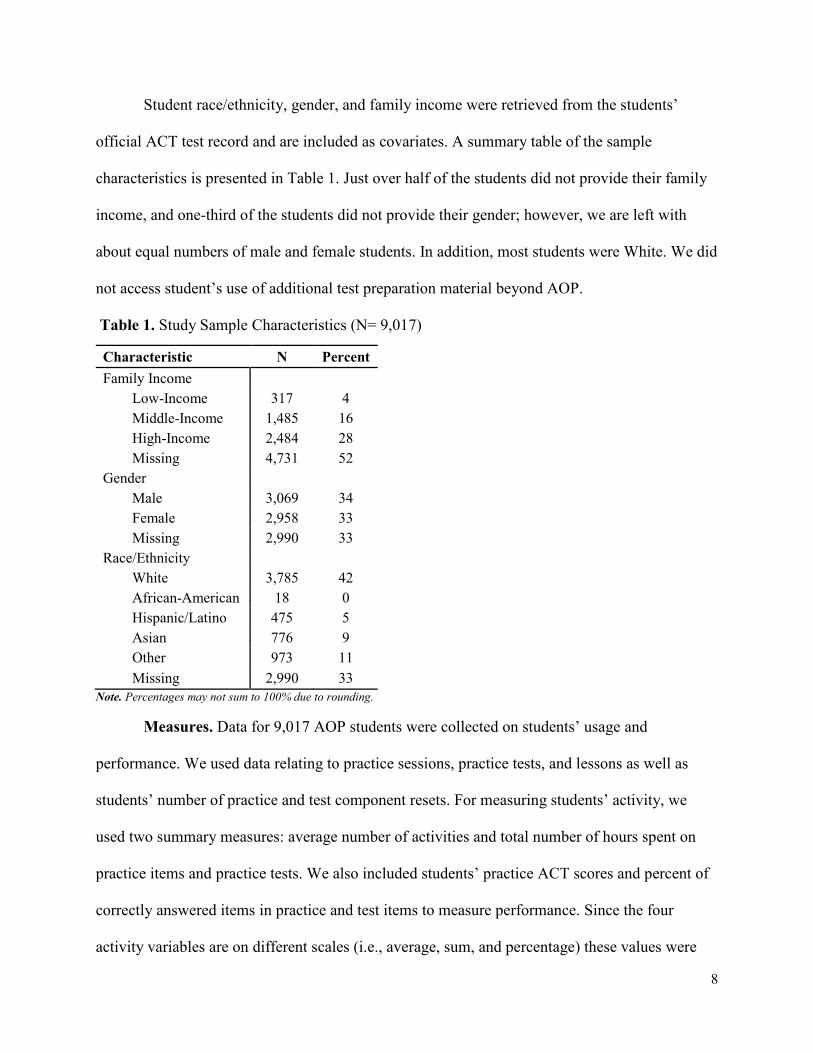
Student race/ethnicity, gender, and family income were retrieved from the students’
official ACT test record and are included as covariates. A summary table of the sample
characteristics is presented in Table 1. Just over half of the students did not provide their family
income, and one-third of the students did not provide their gender; however, we are left with
about equal numbers of male and female students. In addition, most students were White. We did
not access student’s use of additional test preparation material beyond AOP.
Table 1. Study Sample Characteristics (N= 9,017)
Characteristic N Percent Family Income
Low-Income 317 4 Middle-Income 1,485 16 High-Income 2,484 28 Missing 4,731 52
Gender Male 3,069 34 Female 2,958 33 Missing 2,990 33
Race/Ethnicity White 3,785 42 African-American 18 0 Hispanic/Latino 475 5 Asian 776 9 Other 973 11 Missing 2,990 33
Note. Percentages may not sum to 100% due to rounding.
Measures. Data for 9,017 AOP students were collected on students’ usage and
performance. We used data relating to practice sessions, practice tests, and lessons as well as
students’ number of practice and test component resets. For measuring students’ activity, we
used two summary measures: average number of activities and total number of hours spent on
practice items and practice tests. We also included students’ practice ACT scores and percent of
correctly answered items in practice and test items to measure performance. Since the four
activity variables are on different scales (i.e., average, sum, and percentage) these values were
9
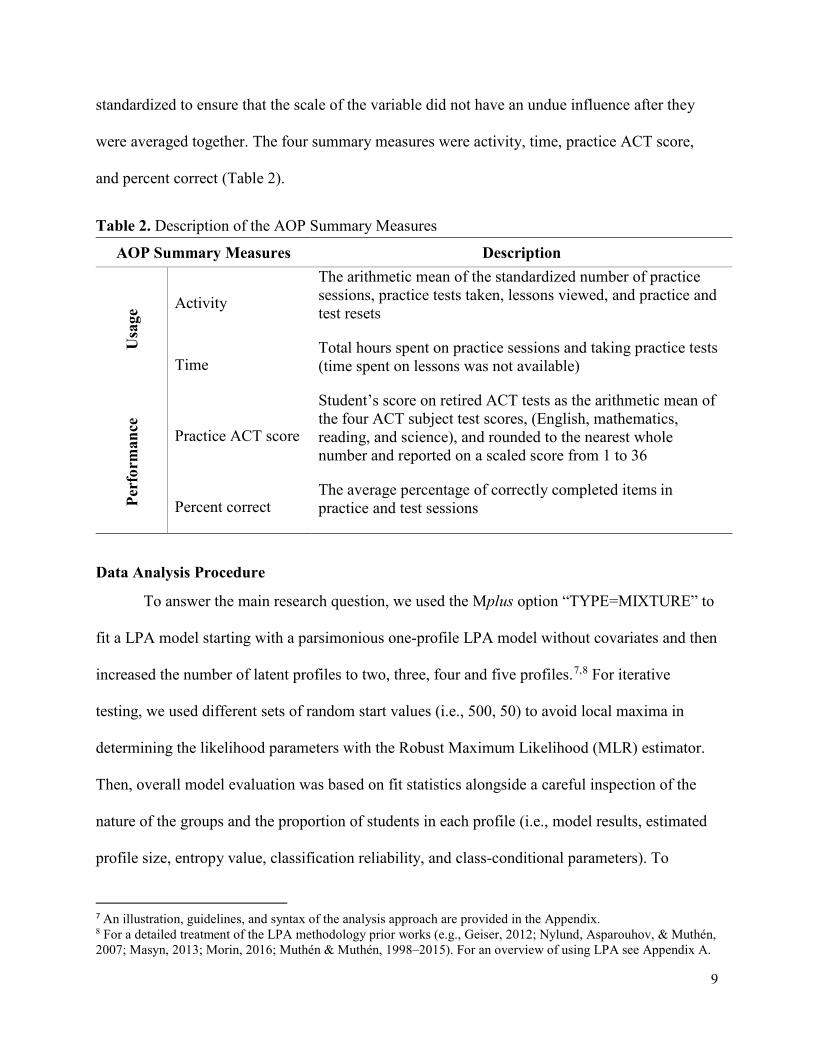
standardized to ensure that the scale of the variable did not have an undue influence after they
were averaged together. The four summary measures were activity, time, practice ACT score,
and percent correct (Table 2).
Table 2. Description of the AOP Summary Measures
AOP Summary Measures Description
Usa
ge Activity
The arithmetic mean of the standardized number of practice sessions, practice tests taken, lessons viewed, and practice and test resets
Time Total hours spent on practice sessions and taking practice tests (time spent on lessons was not available)
Perf
orm
ance
Practice ACT score
Student’s score on retired ACT tests as the arithmetic mean of the four ACT subject test scores, (English, mathematics, reading, and science), and rounded to the nearest whole number and reported on a scaled score from 1 to 36
Percent correct The average percentage of correctly completed items in practice and test sessions
Data Analysis Procedure
To answer the main research question, we used the Mplus option “TYPE=MIXTURE” to
fit a LPA model starting with a parsimonious one-profile LPA model without covariates and then
increased the number of latent profiles to two, three, four and five profiles.7,8 For iterative
testing, we used different sets of random start values (i.e., 500, 50) to avoid local maxima in
determining the likelihood parameters with the Robust Maximum Likelihood (MLR) estimator.
Then, overall model evaluation was based on fit statistics alongside a careful inspection of the
nature of the groups and the proportion of students in each profile (i.e., model results, estimated
profile size, entropy value, classification reliability, and class-conditional parameters). To
7 An illustration, guidelines, and syntax of the analysis approach are provided in the Appendix. 8 For a detailed treatment of the LPA methodology prior works (e.g., Geiser, 2012; Nylund, Asparouhov, & Muthén, 2007; Masyn, 2013; Morin, 2016; Muthén & Muthén, 1998–2015). For an overview of using LPA see Appendix A.
10
compare across all profile models, the Log likelihood (LogL) and the Information Criteria (IC),
Akaike Information Criterion (AIC; Akaike, 1973), Bayesian Information Criterion (BIC;
Schwarz, 1978), and Sample-Size Adjusted BIC (SSABIC; Sclove, 1987) were used.
For comparisons of neighboring profile models (e.g., two-profile versus three-profile), we
used both the Lo-Mendell-Rubin LMR (LRT) and Bootstrap LR Difference Test (BLRT) with
500 replications with p < .05 as indications of model significance. Based on the model selection
process and class interpretability, we selected a suitable number of profiles. We named and
interpreted the profiles based on the four engagement variables (activity, time, practice ACT
score, and percent correct).
Finally, to test whether males and females were equally represented within profiles we
assigned each individual to the latent profile for which her or his assignment probability was
greatest, and then we used the “R3STEP” option in Mplus and added gender (female=1 and
male=0) as an auxiliary latent class predictor to the LPA model. Of note, only AOP users with
known gender are included (N=6,027, missing=2,999). Using one of the profiles as a reference
group, positive values indicate that female students are more likely to be in the corresponding
latent profile relative to male students. All statistical tests were two-tailed, and significance was
determined at the 0.05 level using the Mplus statistical package version 7.4 (Muthén & Muthén,
1998–2015).
11
Results
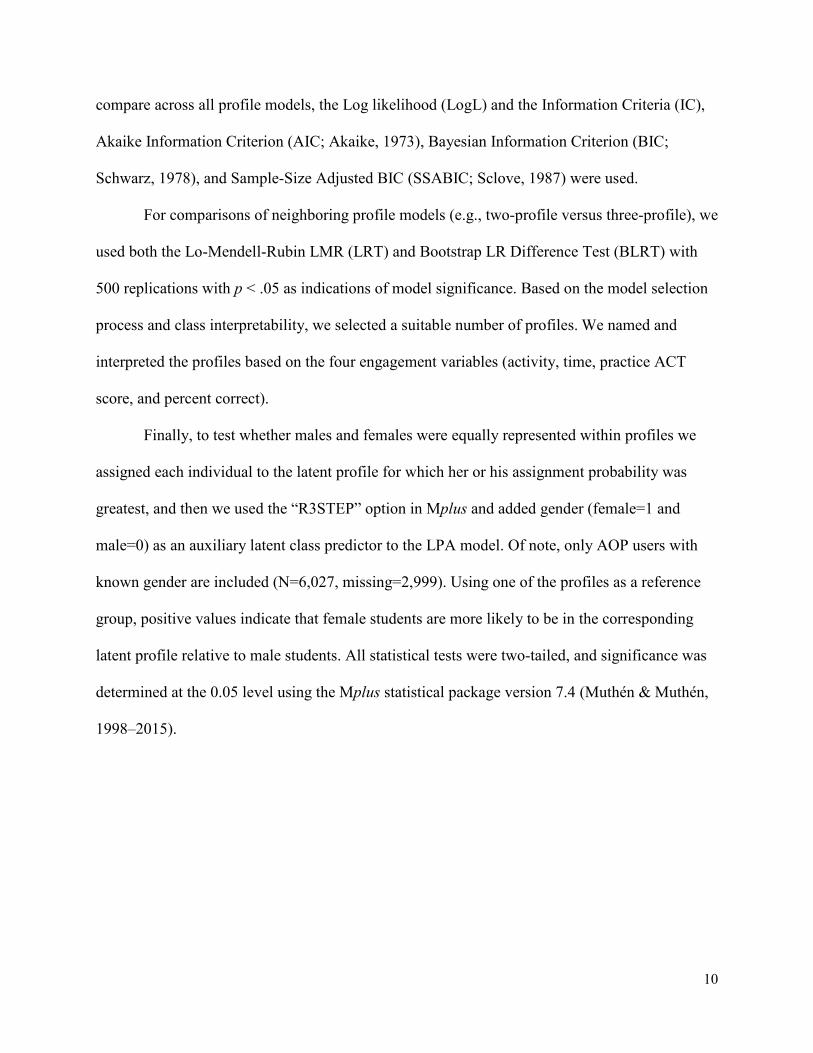
We aimed to identify subpopulations of students based on their engagement with AOP.
Data were screened for outliers,9 and the distribution for each measure was observed. Table 3
presents the descriptive statistics for each measure to help contextualize sample characteristics.
We used normal probability plots and histograms to check for normality. Practice ACT score and
percent correct were approximately normally distributed, whereas the activity data had a slight
departure from normality. The probability plot visually shows a linear relationship with minor
deviations. Skewness of the four measures ranged from -.60 to 1.64, with kurtosis ranging from -
.21 to 2.50.
Table 3. Descriptive Statistics of AOP Engagement Summary Measures (N= 9,017)
Finally, correlations between the four AOP measures were positive: activity and time (r =
.56); activity and practice ACT score (r =.11); activity and percent correct (r =.15); time and
practice ACT score (r =.12); time and percent correct (r =.11); and practice ACT score and
percent correct (r =.67).
9 Outliers were identified by running SAS “Outlier Macro” to calculate the interquartile range (IQR) to set up a “fence” outside of Q1 and Q3. Then, any values that fall outside of this fence are deleted since they considered outliers.
AOP Engagement Measure Mean Standard
Deviation Skewness Kurtosis
Activity 0.269 0.75 0.97 .45
Time 7.99 2.45 1.64 2.50
Practice ACT score 23.44 6.88 -0.60 -0.21
Percent correct 48.52 17.79 .43 -.10

12
AOP Latent Profile Analysis
The validity of inferences made from LPA is dependent upon having good model fit and
meaningful interpretation of profiles. In this study, we found that the five-profile model was
most appropriate. Relative to the one- through four-profile models, the five-profile model
exhibited lowest LogL, AIC, BIC, and SSABIC values, high reliability and entropy, as well as
non-significant LMR and BLRT values. In the five-profile model, the entropy is .81 suggesting
clear profile separation as well as high values of precision (>.86) of correct profile assignment
probabilities (.88, .91, .86, .89, and .92) for each profile. Table 4 provides a summary of the fit
statistics for possible latent profile structures to each of the five extracted profiles.
13
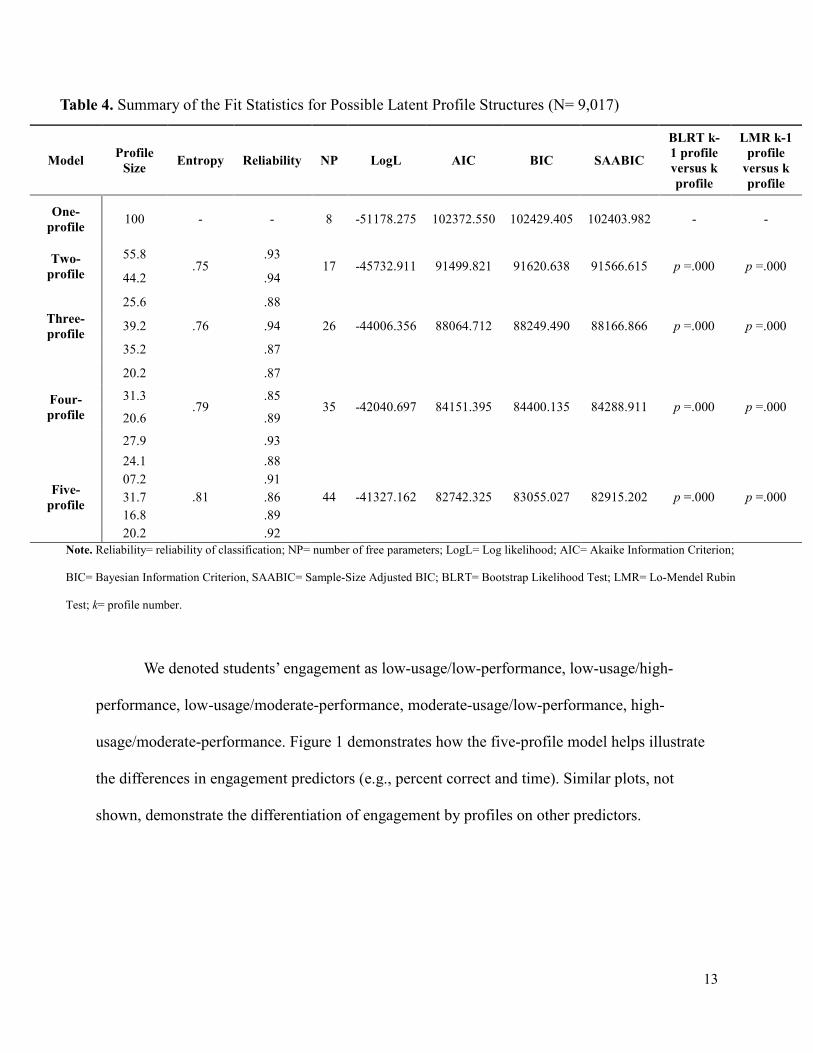
Table 4. Summary of the Fit Statistics for Possible Latent Profile Structures (N= 9,017)
Model Profile Size Entropy Reliability NP LogL AIC BIC SAABIC
BLRT k-1 profile versus k profile
LMR k-1 profile
versus k profile
One-profile 100 - - 8 -51178.275 102372.550 102429.405 102403.982 - -
Two-profile
55.8 .75
.93 17 -45732.911 91499.821 91620.638 91566.615 p =.000 p =.000
44.2 .94
Three-profile
25.6
.76
.88
26 -44006.356 88064.712 88249.490 88166.866 p =.000 p =.000 39.2 .94
35.2 .87
Four-profile
20.2
.79
.87
35 -42040.697 84151.395 84400.135 84288.911 p =.000 p =.000 31.3 .85
20.6 .89
27.9 .93
Five-profile
24.1
.81
.88
44 -41327.162 82742.325 83055.027 82915.202 p =.000 p =.000 07.2 .91 31.7 .86 16.8 .89 20.2 .92
Note. Reliability= reliability of classification; NP= number of free parameters; LogL= Log likelihood; AIC= Akaike Information Criterion;
BIC= Bayesian Information Criterion, SAABIC= Sample-Size Adjusted BIC; BLRT= Bootstrap Likelihood Test; LMR= Lo-Mendel Rubin
Test; k= profile number.
We denoted students’ engagement as low-usage/low-performance, low-usage/high-
performance, low-usage/moderate-performance, moderate-usage/low-performance, high-
usage/moderate-performance. Figure 1 demonstrates how the five-profile model helps illustrate
the differences in engagement predictors (e.g., percent correct and time). Similar plots, not
shown, demonstrate the differentiation of engagement by profiles on other predictors.
14
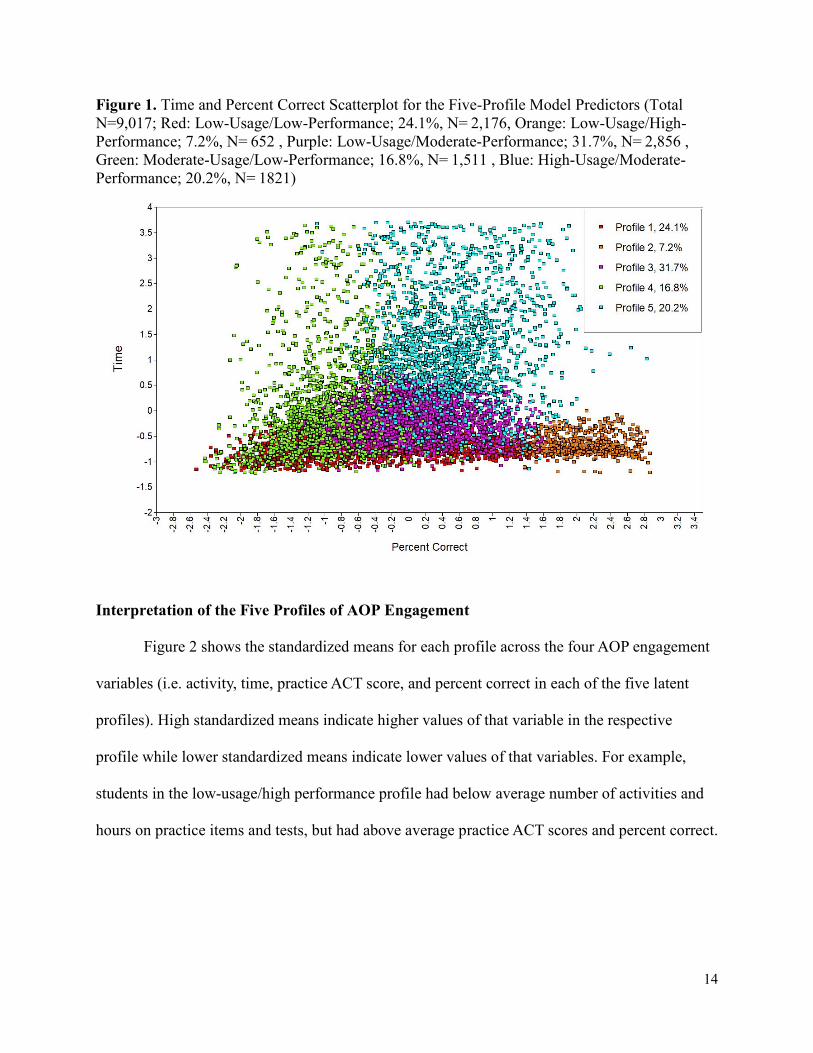
Figure 1. Time and Percent Correct Scatterplot for the Five-Profile Model Predictors (Total N=9,017; Red: Low-Usage/Low-Performance; 24.1%, N= 2,176, Orange: Low-Usage/High-Performance; 7.2%, N= 652 , Purple: Low-Usage/Moderate-Performance; 31.7%, N= 2,856 , Green: Moderate-Usage/Low-Performance; 16.8%, N= 1,511 , Blue: High-Usage/Moderate-Performance; 20.2%, N= 1821)
Interpretation of the Five Profiles of AOP Engagement
Figure 2 shows the standardized means for each profile across the four AOP engagement
variables (i.e. activity, time, practice ACT score, and percent correct in each of the five latent
profiles). High standardized means indicate higher values of that variable in the respective
profile while lower standardized means indicate lower values of that variables. For example,
students in the low-usage/high performance profile had below average number of activities and
hours on practice items and tests, but had above average practice ACT scores and percent correct.
15
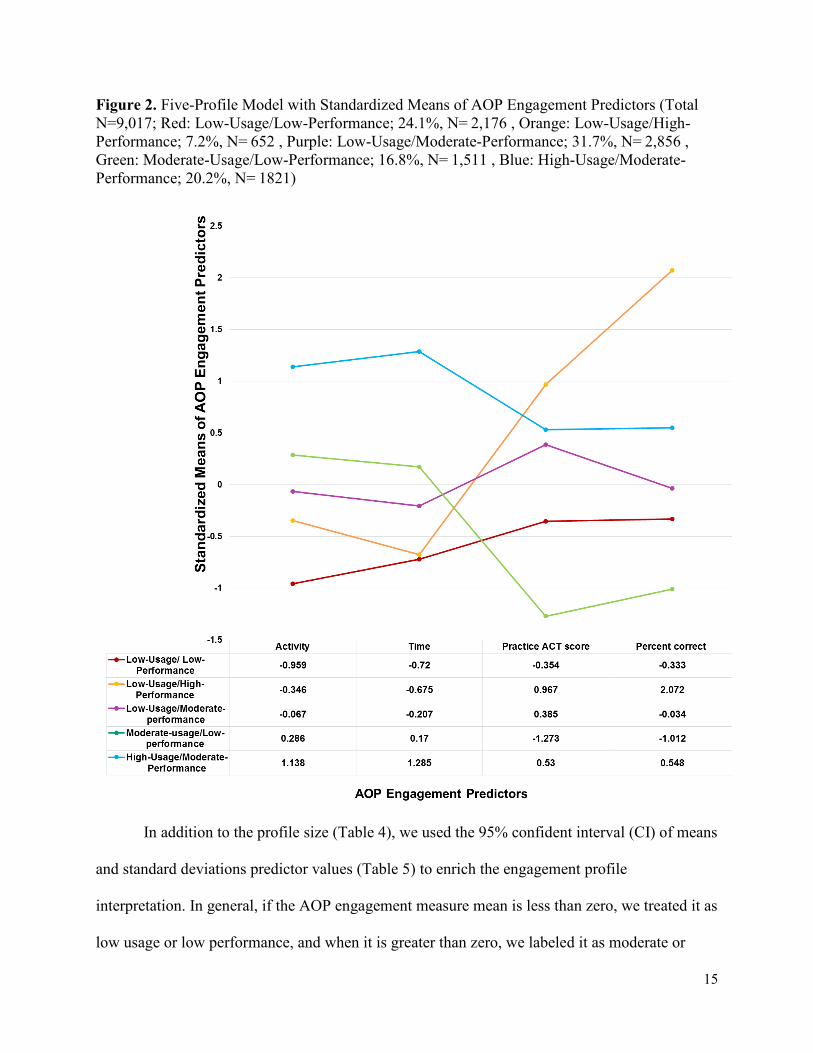
Figure 2. Five-Profile Model with Standardized Means of AOP Engagement Predictors (Total N=9,017; Red: Low-Usage/Low-Performance; 24.1%, N= 2,176 , Orange: Low-Usage/High-Performance; 7.2%, N= 652 , Purple: Low-Usage/Moderate-Performance; 31.7%, N= 2,856 , Green: Moderate-Usage/Low-Performance; 16.8%, N= 1,511 , Blue: High-Usage/Moderate-Performance; 20.2%, N= 1821)
In addition to the profile size (Table 4), we used the 95% confident interval (CI) of means
and standard deviations predictor values (Table 5) to enrich the engagement profile
interpretation. In general, if the AOP engagement measure mean is less than zero, we treated it as
low usage or low performance, and when it is greater than zero, we labeled it as moderate or
16
high. Low-usage/low-performance students (N= 2,176) had a low number of activities, invested
little time using AOP, and had the lowest ACT practice test score as well as the lowest percent
correct on test and practice items. Low-usage/high-performance students (N=625) had a low
number of activities and invested little time using AOP, but had the highest practice ACT scores
and percent correct on test and practice items. In contrast, low-usage/moderate-performance
students (N=2,856), the profile with the largest number of students, had a low number of
activities and invested little time using AOP, but had moderate practice ACT scores and percent
correct on test and practice items. Moderate-usage/low-performance (N=1,511) students had a
good number of AOP activities and hours using practice items and tests but low practice ACT
scores and percent correct on test and practice items. Finally, high-usage/moderate-performance
students (N=1,821) had the highest number of AOP activities and hours using practice items and
tests, but had moderate practice ACT scores and percent correct on test and practice items.
17
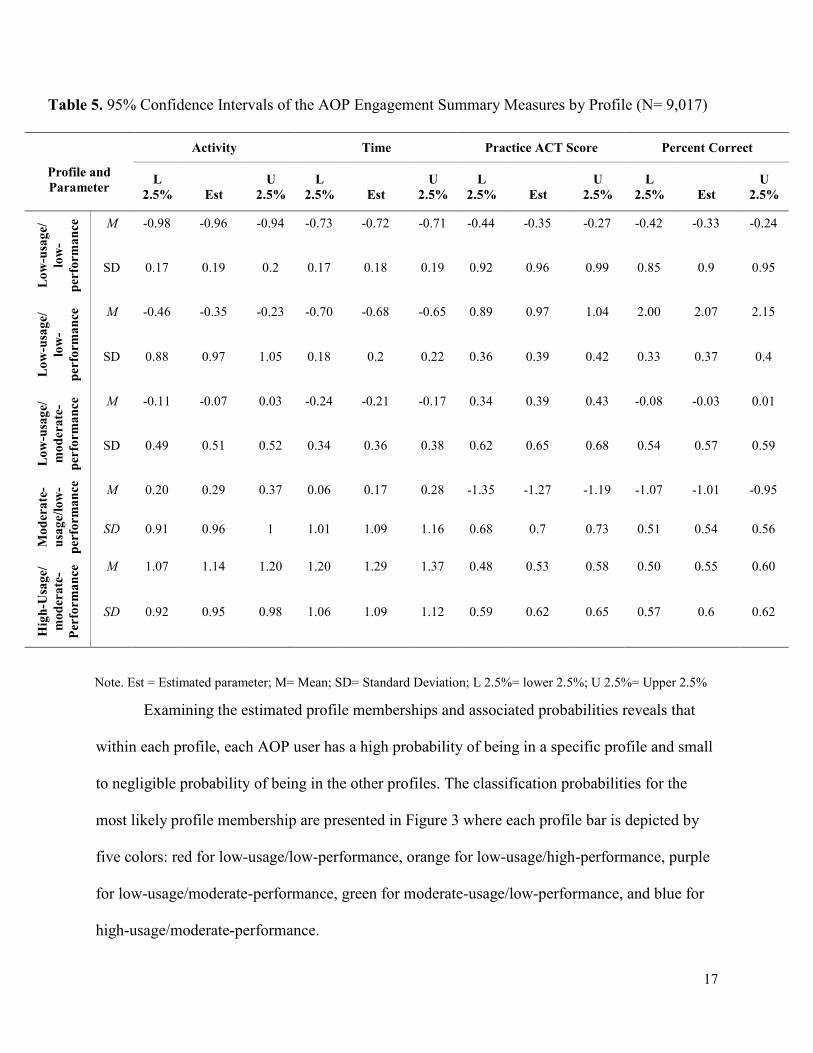
Table 5. 95% Confidence Intervals of the AOP Engagement Summary Measures by Profile (N= 9,017)
Note. Est = Estimated parameter; M= Mean; SD= Standard Deviation; L 2.5%= lower 2.5%; U 2.5%= Upper 2.5%
Examining the estimated profile memberships and associated probabilities reveals that
within each profile, each AOP user has a high probability of being in a specific profile and small
to negligible probability of being in the other profiles. The classification probabilities for the
most likely profile membership are presented in Figure 3 where each profile bar is depicted by
five colors: red for low-usage/low-performance, orange for low-usage/high-performance, purple
for low-usage/moderate-performance, green for moderate-usage/low-performance, and blue for
high-usage/moderate-performance.
Profile and Parameter
Activity Time Practice ACT Score Percent Correct
L 2.5%
Est
U 2.5%
L 2.5%
Est
U 2.5%
L 2.5%
Est
U 2.5%
L 2.5%
Est
U 2.5%
Low
-usa
ge/
low
-pe
rfor
man
ce M -0.98 -0.96 -0.94 -0.73 -0.72 -0.71 -0.44 -0.35 -0.27 -0.42 -0.33 -0.24
SD 0.17 0.19 0.2 0.17 0.18 0.19 0.92 0.96 0.99 0.85 0.9 0.95
Low
-usa
ge/
low
-pe
rfor
man
ce M -0.46 -0.35 -0.23 -0.70 -0.68 -0.65 0.89 0.97 1.04 2.00 2.07 2.15
SD 0.88 0.97 1.05 0.18 0.2 0.22 0.36 0.39 0.42 0.33 0.37 0.4
Low
-usa
ge/
mod
erat
e-pe
rfor
man
ce M -0.11 -0.07 0.03 -0.24 -0.21 -0.17 0.34 0.39 0.43 -0.08 -0.03 0.01
SD 0.49 0.51 0.52 0.34 0.36 0.38 0.62 0.65 0.68 0.54 0.57 0.59
Mod
erat
e-us
age/
low
-pe
rfor
man
ce
M 0.20 0.29 0.37 0.06 0.17 0.28 -1.35 -1.27 -1.19 -1.07 -1.01 -0.95
SD 0.91 0.96 1 1.01 1.09 1.16 0.68 0.7 0.73 0.51 0.54 0.56
Hig
h-U
sage
/ m
oder
ate-
Perf
orm
ance
M 1.07 1.14 1.20 1.20 1.29 1.37 0.48 0.53 0.58 0.50 0.55 0.60
SD 0.92 0.95 0.98 1.06 1.09 1.12 0.59 0.62 0.65 0.57 0.6 0.62
18
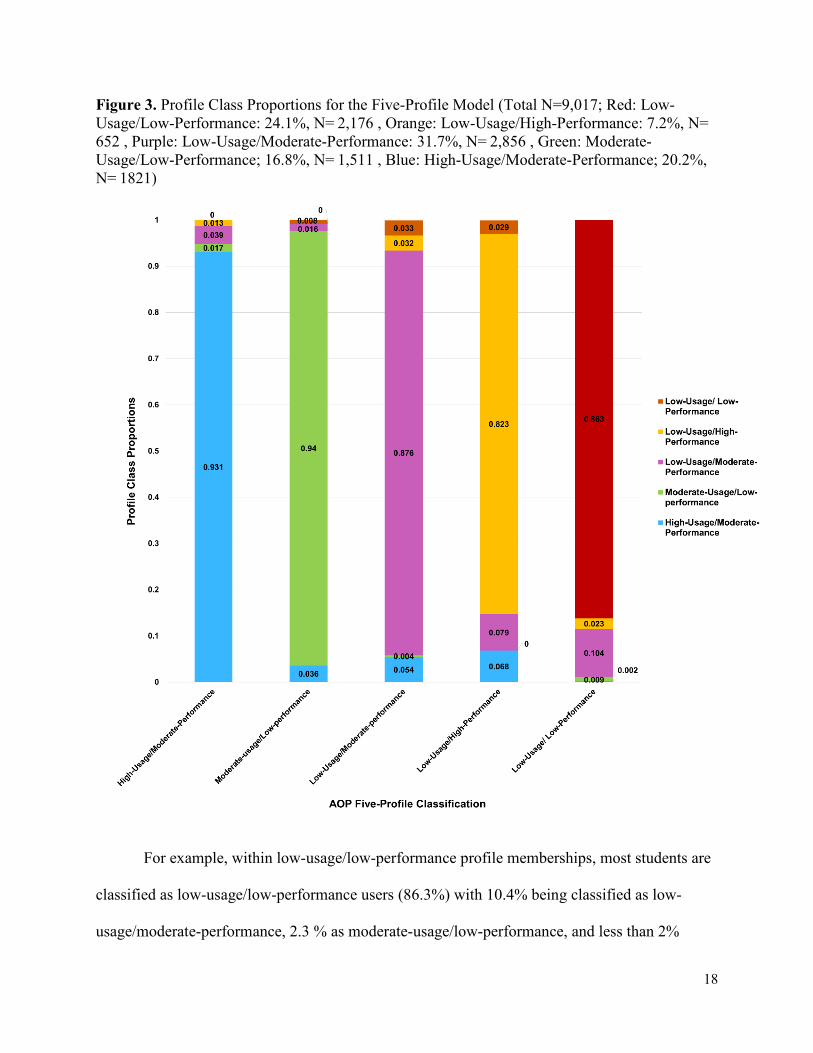
Figure 3. Profile Class Proportions for the Five-Profile Model (Total N=9,017; Red: Low-Usage/Low-Performance: 24.1%, N= 2,176 , Orange: Low-Usage/High-Performance: 7.2%, N= 652 , Purple: Low-Usage/Moderate-Performance: 31.7%, N= 2,856 , Green: Moderate-Usage/Low-Performance; 16.8%, N= 1,511 , Blue: High-Usage/Moderate-Performance; 20.2%, N= 1821)
For example, within low-usage/low-performance profile memberships, most students are
classified as low-usage/low-performance users (86.3%) with 10.4% being classified as low-
usage/moderate-performance, 2.3 % as moderate-usage/low-performance, and less than 2%
19
being moderate-usage/low-performance and high-usage/moderate-performance. Within low-
usage/high-performance profile memberships, most students are classified as being low-
usage/high-performance users (82.3 %) with 2.3% being classifying as low-
usage/low/performance, 7.9 % as low-usage/ moderate-performance, and 6.8 % as high-
usage/moderate-performance users. The classes do not have perfect membership because the
model does not fit the data perfectly.
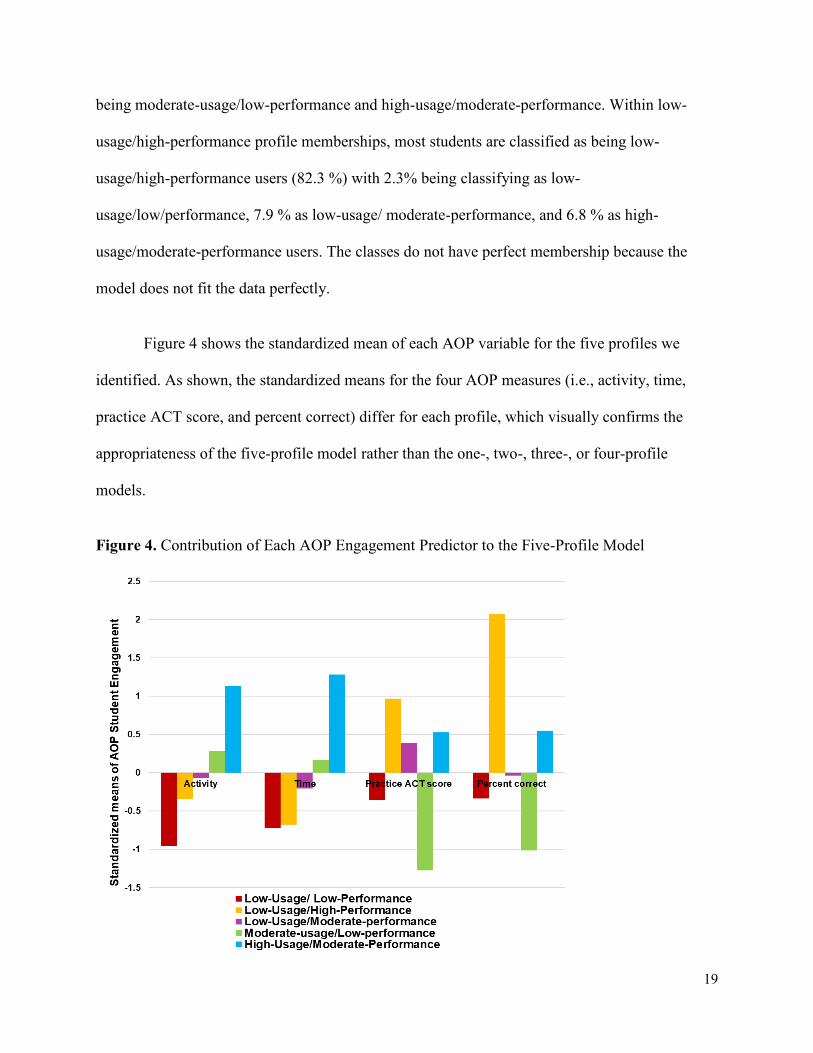
Figure 4 shows the standardized mean of each AOP variable for the five profiles we
identified. As shown, the standardized means for the four AOP measures (i.e., activity, time,
practice ACT score, and percent correct) differ for each profile, which visually confirms the
appropriateness of the five-profile model rather than the one-, two-, three-, or four-profile
models.
Figure 4. Contribution of Each AOP Engagement Predictor to the Five-Profile Model
20
Each of the five profiles represents a distinct AOP profile. The correlation between
practice ACT score and percent correct for the overall sample was high (.67). However, the
correlation between the same two variables for low-usage/low-performance, low-usage/high-
performance, low-usage/moderate-performance, moderate-usage/low-performance, and high-
usage/moderate-performance profiles were .54, .81, .32, .28, and .51, respectively. Similarly, the
correlation between the AOP time and practice ACT score variables across the five profiles
varied. Overall, the correlation between activity and time was .56; however, only low-user/high-
performance profile has a high correlation (.51) while other profiles correlations ranged between
.02 and .13. This variation provides further demonstration of how the profiles help to
differentiate users of AOP.
Gender as a predictor of profile. We investigated the relationship between the students’
AOP engagement profiles and gender. Since we have about 33% of the AOP users with no
gender data, the Mplus default for listwise deletion is applied to the auxiliary variable, gender, in
the analysis. Of the 9,017 AOP users, 2,999 were excluded, and a total of 6,027 AOP users are
used in the gender analysis. The gender analysis provides the statistics to compare each profile
against a reference profile. The results showed that the AOP female users are underrepresented
in the low-usage/high-performance profile only. Using any profile other than low-usage/high-
performance profile as a reference group, the significant effect of gender (female) for the low-
usage/high-performance profile ranged between - .49 and - .69 -, p =.000 (odds ratio ranged
between .61 and .50) and was not statistically significant for other profiles. The other four
profiles showed female overrepresentation against the low-usage/high-performance profile only
if the low-usage/high-performance profile is used as a reference group. In other words, when
compared to low-usage/high-performance profile, the probability of females being in one of the
21
other four profiles significantly increases. Although females are less likely to be in the low-
usage/high-performance profile, the gender analysis results demonstrate that females were a
heterogeneous group of AOP users that were broadly distributed across the other four profiles.
Discussion
AOP is a learning tool designed to improve the knowledge and skills assessed on the
ACT that ultimately will help students succeed in college and in their careers. Understanding the
patterns of engagement in test preparation resources is necessary for developing and improving
test preparation tools and interventions. Within the context of test preparation for high-stake
exams, prior studies have not examined patterns of engagement. Results of our study revealed
five profiles that exemplify AOP students’ engagement behaviors as low-usage/low-
performance, low-usage/high-performance, low-usage/moderate-performance, moderate-
usage/low-performance, and high-usage/moderate-performance. We found greater numbers of
students in the low-usage/moderate-performance, the low-usage/low-performance, and the high-
usage/moderate performance profiles. Moreover, female students were underrepresented in the
low-usage/high-performance profile.
These student profiles may help developers target specific interventions and inform the
degree to which interventions may be effective. This information is particularly salient in the
context of test preparation for high-stakes exams since students’ engagement patterns with test
preparation products has not been studied. The results revealed three noteworthy findings.
1. The identification of five engagement profiles of AOP engagement. The results provide
greater clarity about factors that characterize student experiences. It allows further
understanding of test preparation users and how their engagement behaviors, including usage
and performance, could be associated with gender.
22
Sanchez and Harnisher propose two types of students who may use test preparation:
high achievers seeking exceptional scores and lower achievers seeking supplementary
instruction. In our study, we identified low-usage/high-performance students who may be
aligned with the type of students proposed by Sanchez and Harnisher (2018) while adding
two additional types: high-usage/moderate-performance students who are highly engaged
with test preparation materials in terms of activity and time while they have a moderate
performance level based on their practice ACT score and percent correct and low-usage/low-
performance students who make little use of test preparation and have lower achievement.
While these results cannot provide insights into the motivations of and preparation strategies
employed by students, it does raise questions about why students used AOP in the manner
illustrated by their profile.
2. Although females were less likely to be in one of the AOP profiles, namely low-usage/high-
performance profile, results demonstrated that female students were a heterogeneous group
of test preparation users that were broadly distributed across the other four profiles.
3. It is important to consider students’ strategies of how to utilize the features of the program. It
is of particular note that while low-usage/high-performance students had limited usage of
AOP, they are among the highest achievers in terms of their practice ACT test scores and in
having the highest average of correctly completed practice and test items. It is possible that
these students use their preparation time for practice items and tests rather than reviewing
content because they feel they have mastery of the content. Alternatively, they may be higher
achieving students who do not see an advantage to using AOP.
On the other hand, high-usage/moderate-performance students performed a high
number of AOP activities, spent higher numbers of hours using practice items and tests, and
23
had practice ACT score and percent correct around the average. Since these students are
moderate achievers based on their practice test scores and percent correct, they need to be
more efficient with their AOP time and engage in different types of activities that fulfil their
academic needs.
There are a few limitations to this research worth discussing. First, while we made use of
the AOP data we had available, there is a wealth of additional usage data that could be attained
from the AOP platform. Future research will need to examine this more detailed data to better
understand how students are using AOP. Second, this exploratory study did not make use of
students’ demographic information such as race/ethnicity, family income, coursework taken,
high school GPA, or parent’s education. Each of these may serve to illuminate our understanding
of why test preparation products are being used.
Additionally, because our analysis approach requires a complete data set for each student,
we used ListWise deletion for missing data (i.e. not using an AOP section). This mean that in
this analysis we are focusing on students who are very active in the system. The focus on high
usage students reduces our generalizability to students who purchase but make poor use of the
product but allows us to learn about students who purchase and make good use of the product.
This decision is supported by the fact that the vast majority of AOP users make relatively little
use of the product as a whole and of its components individually. While this study looks at
students who are using the product in a model consistent with intended use, it does not include
other models of use. Finally, in this study we did not collect data on other forms of test
preparation students may be using, and future studies should explicitly control for this effect.
24
Practical Implications of the Study and Recommendations for Future Research
The objective of this study was to better understand the different usage profiles of AOP
users. Understanding how users engage with test preparation helps inform improvement efforts
and can help guide how we advise new users to get the most from their preparation. If test
preparatory intervention was implemented at a community level, for example at a school, this
study suggests that more than 31.7% of the students, on average, may have high usage coupled
with moderate performance. However, to support this claim, students’ usage information and
factors driving their preparation are needed, which can be gained through direct observation or
think-aloud interviews.
This study demonstrates the use of LPA and may serve as a useful approach for examining
learning behavior patterns with other programs. To our knowledge, no research has systematically
investigated test preparation usage profiles by gender. Showing how this can be accomplished
makes this process more transparent. In addition, tools like the Mplus mixture analysis that
simplify this process are beneficial for researchers seeking to investigate latent profile properties
associated with test preparation.
Future research could expand on the current study in a number of ways. First, researchers
may include additional measures of engagement when estimating user profiles. For example,
more research is needed to investigate the AOP discussion board activity regarding peer
influence on student engagement. Second, a study could investigate patterns of test preparation
for only females or males and determine the most beneficial activities. In addition to gender,
there are many other covariates that may be of interest in regards to test preparation. Third,
regarding statistical models, since there is usually a general or second-order factor that affects
25
the identification of individuals’ pattern (e.g., computer literacy or Internet reliability), using a
bi-factor model or second-order model may enrich the profile results.
Also, a multilevel LPA model may detect different patterns based on student, school, or
community characteristics. Additionally, a propensity score analysis could be conducted to
match AOP students with students who use other test preparation products, such as OPL (ACT
Kaplan Online Prep Live) in order to compare test preparation product users’ profiles on other
factors such as achievement. Finally, examining a combination of different test preparation
products for the same student could provide in-depth identification of student profiles and their
test preparation behaviors. Furthermore, qualitative studies could target some of the AOP profile
members to recognize students’ response processes using probes, think-aloud, or focus group
procedures.
26
References ACT. (2017a). ACT profile report- National: Graduating class 2017. Retrieved from
https://www.act.org/content/dam/act/unsecured/documents/cccr2017/P_99_999999_N_S
_N00 ACT-GCPR_National.pdf
ACT. (2017b). The condition of college and career readiness 2017. Retrieved from
http://www.act.org/content/dam/act/unsecured/documents/cccr2017/CCCR_National_201
7.pdf
Akaike, H. (1973). Information theory and an extension of the maximum likelihood principle.
In B. N. Petrov & F. Caski (Eds.), Proceedings of the Second International Symposium
on Information Theory (pp. 267–281). Budapest: Akademiai Kiado.
Appelrouth, J. I., Zabrucky, K. M., & Moore, D. (2015). Preparing students for college
admissions tests. Assessment in Education: Principles, Policy & Practice, 24(1), 1-18.
Baleghizadeh, S., & Yousefian, M. (2012). The relationship between test-takers’ rate of strategy
use and their reading comprehension performance. New England Reading Association
Journal, 48(1), 73–77.
Briggs, D. C. (2009). Preparation for college admission exams (2009 NACAC Discussion Paper).
Alexandria, VA: National Association for College Admission Counseling.
College Board. (2015). Test characteristics of the SAT®: Reliability, difficulty levels, completion
rates. New York, NY: The College Board.
Masyn, K. (2013). Latent class analysis and finite mixture modeling. In T. D. Little (Ed.), The
Oxford handbook of quantitative methods in psychology, (Vol. 2, 551-611). New York,
NY: Oxford University Press.
27
Messick, S., & Jungeblut, A. (1981). Time and method in coaching for the SAT. Psychological
Bulletin, 89(2), 191.
Morin, A. J. S. (2016). Person-centered research strategies in commitment research. In J. P.
Meyer (Ed.), Handbook of Employee Commitment (pp. 490-508). Cheltenham, UK:
Edward Elgar.
Moore, R., Sanchez, E., & San Pedro, M. O. (2018). Investigating test preparation impact on
score gains using quasi-experimental propensity score matching. Iowa City, IA: ACT.
Muthén, L. K., & Muthén, B. O. (1998–2015). Mplus user’s guide (7th ed.). Los Angeles, CA:
Muthén & Muthén.
National Association for College Admission Counseling [NACAC]. (2015). Individualized
learning plans for college and career readiness: State policies and school-based
practices, a national study. Retrieved from
https://www.nacacnet.org/globalassets/documents/publications/research/nacacilpreport.p
df
Nylund, K. L., Asparouhov, T., & Muthén, B. O. (2007). Deciding on the number of classes in
latent class analysis and growth mixture modeling: A Monte Carlo simulation study.
Structural Equation Modeling: A Multidisciplinary Journal, 14(4), 535–569. doi:
10.1080/ 10705510701575396.
Peugh, J. L., & Enders, C. K. (2004). Missing data in educational research: A review of reporting
practices and suggestions for improvement. Review of Educational Research, 74(4), 525-
556. doi: /10.3102/00346543074004525.
Sanchez, E., & Harnisher, J. (2018). The impact of ACT Kaplan Online Prep Live on ACT score
gains. Iowa City, IA: ACT.

28
Sclove, L. S. (1987). Application of model-selection criteria to some problems in multivariate
analysis. Psychometrika, 52(3), 333-343.