Embed Size (px)
Citation preview
1
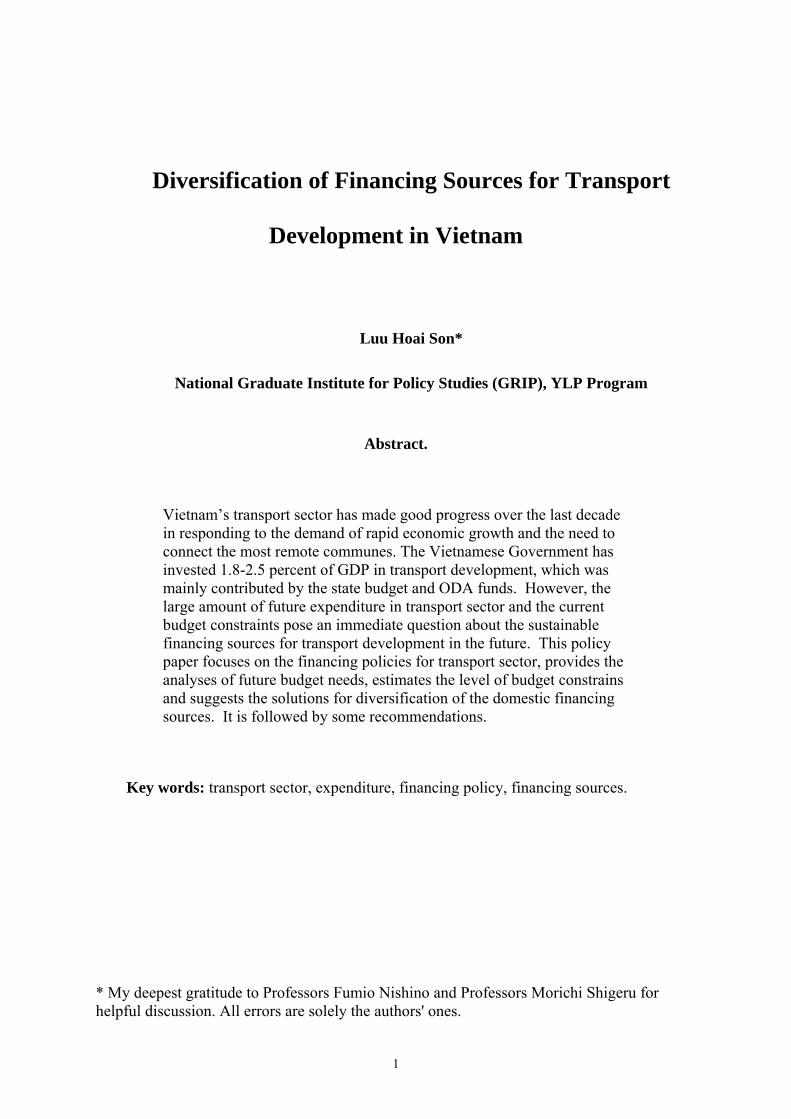
Diversification of Financing Sources for Transport
Development in Vietnam
Luu Hoai Son*
National Graduate Institute for Policy Studies (GRIP), YLP Program
Abstract.
Vietnam’s transport sector has made good progress over the last decade in responding to the demand of rapid economic growth and the need to connect the most remote communes. The Vietnamese Government has invested 1.8-2.5 percent of GDP in transport development, which was mainly contributed by the state budget and ODA funds. However, the large amount of future expenditure in transport sector and the current budget constraints pose an immediate question about the sustainable financing sources for transport development in the future. This policy paper focuses on the financing policies for transport sector, provides the analyses of future budget needs, estimates the level of budget constrains and suggests the solutions for diversification of the domestic financing sources. It is followed by some recommendations.
Key words: transport sector, expenditure, financing policy, financing sources.
* My deepest gratitude to Professors Fumio Nishino and Professors Morichi Shigeru for helpful discussion. All errors are solely the authors' ones.

2
Abstract. .....................................................................................................................................1
I. Introduction........................................................................................................................3
II. Overviews. .........................................................................................................................4
II.1. The Current Conditions..........................................................................................4 II.2 The Expenditure Plan up to 2020 of the Ministry of Transport (MOT) ................5
III. The Future Expenditure Requirements in Transport Sectors.........................................6
III.1 Overview of the expenditure in transport sector of the East Asian countries............6 III.2 The Future Expenditure in Transport Sector. ............................................................7
III.2.1 The Budget Constraint for Transport Development. .........................................7 III.2.2 The Possible Expenditure Requirement in the Future .......................................8
IV. The Diversification of the Financial Resources for Transport Sector. ..........................9
IV.1 Current issues...........................................................................................................10 V.1.1 Public Bonds ....................................................................................................10 V.1.2 Private Participation in Infrastructure (PPI) ....................................................11
IV.2 The Financing Policies for Transport: The Japan’s Experiences.............................12 IV.2.1 The Diversification of Funding Sources. .........................................................12 IV.2.2 Special Accounts for Transport Sector. ...........................................................14 IV.2.3 The Public Corporations. .................................................................................15 IV.2.4 The Public-Private Financing Partnerships......................................................16
V. Conclusions......................................................................................................................18
Bibliography ............................................................................................................................20
Appendix A: Tables .................................................................................................................21

3
I. Introduction.
Vietnam’s transport sector has made good progress over the last decade in responding to
the demand of rapid economic growth which is mainly due to the increasingly export
orientated, and the need to connect the most remote communes.
Over the last decade, the Vietnamese government has invested around 9-10 percent of
GDP for infrastructure development and one fourth of that amount was spent on transport
sector. During this period, the GDP growth was 7.2 percent per annum, and hunger and
poverty were reduced from 58 percent to 29 percent1. These successes were partly
contributed by the development of the transport infrastructure system, which is played in role
of a basis service for other economic sectors and helped the poor people from access to the
health care services, schools, and other social services.
The expenditure in transport was mainly funded by ODA sources and state budget.
However, these financing sources are likely inadequate in comparison with the actual future
demand. According to the Ministry of Finance, the state budget and ODA covered for 70
percent of investment needs only in 1999-2005 period, while the remaining 30 percent was
on outstanding commitment. In the next decade, it is estimated that the Vietnam’s investment
in infrastructure should need 11-12 percent of GDP, in order to meet the increasing transport
demand in the future and to avoid the bottleneck to economic growth2. Currently, one of the
most concern of the Vietnamese government is the future budget constraint may create the
obstacles to transport development. Therefore, the care needs to be taken by the policy-maker
in the transport sector is to design the appropriate policy, that ensured to create the
1 The Government of the Social Republic of Vietnam, The Vietnam Socio-Economic Development Plan 2006-2010, Ministry of Planning and Investment, 2005. 2 Ibid.

4
sustainable financing sources to meet the huge expenditure requirements in transport sector in
the future.
This paper focuses on the financing policies for transport development with aiming to
suggest the measures for diversifying the financing sources and to enhance the efficiency in
utilizing the budget for transport development. The first section provides an overview of the
public expenditure in transport sector in the last few years. The second section estimates the
future financing requirements based on the domestic transport demand, and compares with
average expenditure for transport of other East Asian countries. The third section presents the
current obstacles in financing scheme for transport development of Vietnam, analyses the
financing policies for transport development in Japan, and identifies the appropriate
experiences of Japan in order to get useful implication for Vietnam’s financing policies for
transport. The final section provides the summary of recommendations.
II. Overviews.
II.1. The Current Conditions. Between 1999 and 2004, the demand for freight transport increased about 11 percent per
annum in term of ton-km while the demand for passenger transport growth was 9.4 percent
per annum. Comparing the freight transport mode among sub-sectors, road is dominant mode
which accounts for nearly 70 percent of tons moved but coastal shipping accounts for 72
percent of ton-km due to its dominance in long-distance transportation mode and remaining
28 percent was shared by railways, aviation and other modes (Table 1).
Table 1. Domestic Volume 1999 – 2004 (Inserted here) According to the Ministry of Finance (MOF), total nominal public expenditure in
transport increased at almost 21 percent per annum between 1999 and 2002 reaching 3.5
percent of GDP in 2002 versus an average of 2 percent in the late 1990s. Table 2 shows the
proportion of the state budget directly allocated to the local governments which has increased
5
significantly from 44 percent in 1999 to 56 percent in 2002 but the recurrent expenditure
while having a large increase in 2000 has dropped back close to its 1999 level.
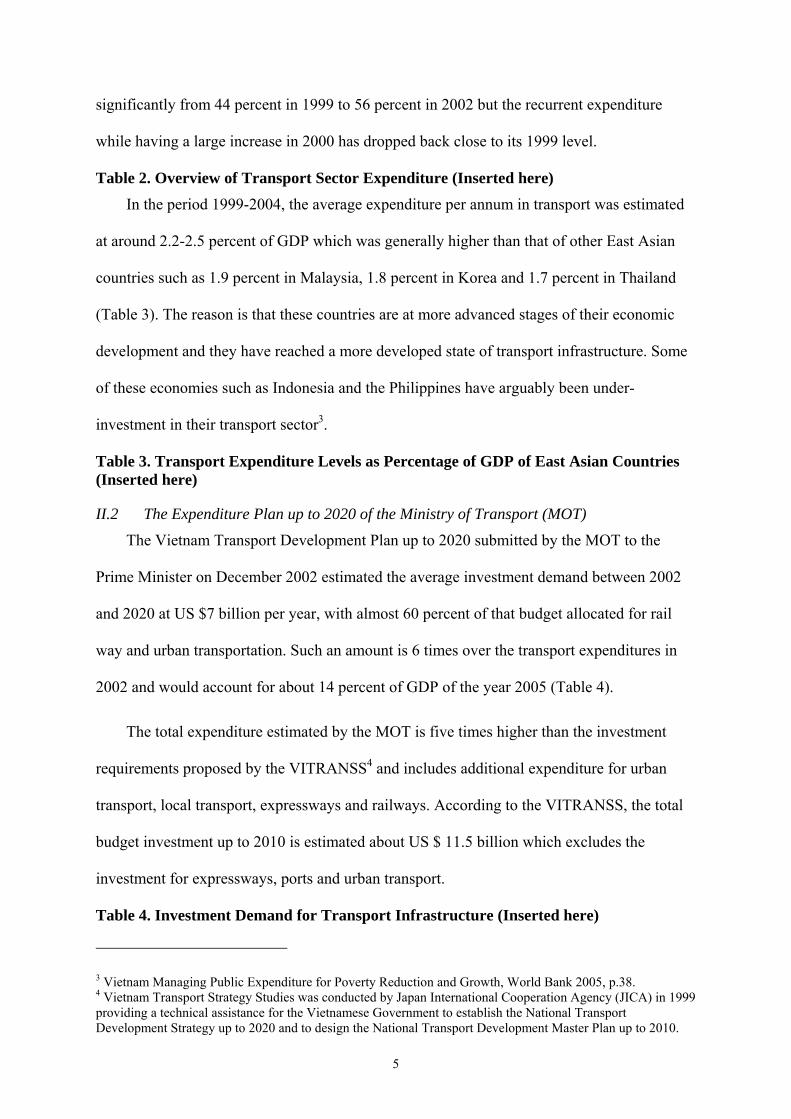
Table 2. Overview of Transport Sector Expenditure (Inserted here) In the period 1999-2004, the average expenditure per annum in transport was estimated
at around 2.2-2.5 percent of GDP which was generally higher than that of other East Asian
countries such as 1.9 percent in Malaysia, 1.8 percent in Korea and 1.7 percent in Thailand
(Table 3). The reason is that these countries are at more advanced stages of their economic
development and they have reached a more developed state of transport infrastructure. Some
of these economies such as Indonesia and the Philippines have arguably been under-
investment in their transport sector3.
Table 3. Transport Expenditure Levels as Percentage of GDP of East Asian Countries (Inserted here)
II.2 The Expenditure Plan up to 2020 of the Ministry of Transport (MOT)
The Vietnam Transport Development Plan up to 2020 submitted by the MOT to the
Prime Minister on December 2002 estimated the average investment demand between 2002
and 2020 at US $7 billion per year, with almost 60 percent of that budget allocated for rail
way and urban transportation. Such an amount is 6 times over the transport expenditures in
2002 and would account for about 14 percent of GDP of the year 2005 (Table 4).
The total expenditure estimated by the MOT is five times higher than the investment
requirements proposed by the VITRANSS4 and includes additional expenditure for urban
transport, local transport, expressways and railways. According to the VITRANSS, the total
budget investment up to 2010 is estimated about US $ 11.5 billion which excludes the
investment for expressways, ports and urban transport.
Table 4. Investment Demand for Transport Infrastructure (Inserted here)
3 Vietnam Managing Public Expenditure for Poverty Reduction and Growth, World Bank 2005, p.38. 4 Vietnam Transport Strategy Studies was conducted by Japan International Cooperation Agency (JICA) in 1999 providing a technical assistance for the Vietnamese Government to establish the National Transport Development Strategy up to 2020 and to design the National Transport Development Master Plan up to 2010.

6
The MOT’s plan seems to be unrealistic and should be reviewed with taking account for
the availability of the budget resources. In 5 years from 1997 to 2002, the actual investment
amount in transport sector accumulated only Vnd 47,488 billion (US $ 3.013 billion) or
equals to 1.8 percent of GDP5. In addition, the MOT’s annual report of the 2005 shows the
total investment in 2005 accounted for Vnd 16,701 billion (US $ 1.057 billion) or equivalent
to 2.2 percent of GDP only, although this is the highest level of the public expenditure in
transport sector over the whole period in term of absolute amount6. The actual expenditure
was spent for transport in the past decade, in term of percentage of GDP, shows that it was
much lower than that of expenditure proposed by the MOT.
III. The Future Expenditure Requirements in Transport Sectors.
As the foresaid, the annual expenditure in the transport sector was accounted for 1.8-2.5
percent of GDP in the last decade. Although the Ministry of Transport suggests that the future
investment need is to be increased to 3.5 percent of GDP but it seems to be unrealistic
regarding to the availability of the state budget. This section suggests the possible level of the
expenditure in transport with reference to the experiences of other Southeast Asian countries
and the current condition of Vietnam.
III.1 Overview of the expenditure in transport sector of the East Asian countries
The experience of the East Asian countries shows that in general the total amount of
public investment for infrastructure was 7 or 8 percent of GDP, where the large part of public
investment was usually allocated in transport sector. For example, in between 1957 and 1973,
the Japanese government accelerated investment in transport infrastructure, quickly
exceeding 2 percent of GDP and remaining between 2.0 and 2.5 percent ever since then7.
5 World Bank, Vietnam Managing Public Expenditure for Poverty Reduction and Growth, World Bank and Ministry of Finance, 2005. 6 Ministry of Transport, Annual Report 2005. 7 Ashoka Mody, Infrastructure Strategy in East Asia: The Untold Story, World Bank 1997, p.xiii

7
Korea and Taipei China have also made large investments in infrastructure. Korean’s
investment in infrastructure rates have been at or above 8 percent in many years in the past
few decades while expenditure in transport shared about 2-3 percent of GDP. In Taipei China,
the investment rates have been around 3-4 percent, which combines investment in
telecommunication and transport8. Hong Kong, Malaysia, and Singapore had investment rates
in transport at the same scale, which was around 1.5-3 percent of GDP9.
In period 1999-2005, Vietnam investment rate in transport has been at 1.8-2.5 percent of
GDP, which is much similar to Japan’s investment rates between 1957 and 1973. Table 5
shows an overall pattern of the expenditure in transport development in East Asian countries.
For convenience of comparison, the different periods cross over time were selected in order
to ensure that these countries are similar patterns in term of economic development. For
example, in the selected period these countries are the same level of growth rates at 6-8
percent per annum and the rates of GDP per capita at US $ 600-1000. In general, Table 5
shows the average investment rates in transport have been at 2-2.5 percent of GDP.
Table 5. Comparison of Transport Expenditure Levels in East Asian Countries
III.2 The Future Expenditure in Transport Sector.
III.2.1 The Budget Constraint for Transport Development.
Investment in transport sector in the last five years was massively contributed by the
ODA source. Especially, nearly 70 percent of the expenditure in road sub-sector was funded
by ODA10. In the future, the financing sources for transport may face to budget constraints
because of declining ODA inflows. On one hand, the statistical data show the global trend of
ODA has continuously declined over the few decades and that may also influence the
Vietnam in the future. On the other hand, it is most likely the case that the donors could not
8 Ibid, pp.3-11 9 Thomas R. Leinbach and Chia Lin Sien, Southeast Asian Transport: Issue in Development, Oxford University Press 1998, p.22. 10 UNDP, Vietnam Development Cooperation Report, UNDP 2005, p.24

8
provide more ODA to Vietnam in the future because the country shall attain the GDP per
capita at US $ 1000 in 2010 and it could not be seen as the underdeveloped country to get the
preferential treatment of the donors.
Moreover, the Vietnamese government may not be able to increase the budget on
transport because of increasing investment needs in the other sectors. In the period 2006-2010,
the average expenditure needs per annum for the electricity, telecommunication and urban
infrastructure are required about US $ 3 billion, US $ 2.4 billion and US $ 3 billion,
respectively, or equivalent to 12% of GDP11.
Table 6 shows the availability of ODA sources for infrastructure based on the data from
various ministries. The data show that the ODA sources for transport and telecommunication
could be attained US $ 4 billion in next five years. If it materializes, the portion of ODA for
transport could be US $ 3 billion, thus ODA to be allocated for transport sector is about US
$ 700 million per annum or equivalents to 1.2 percent of GDP. So far, ODA’s source could
fund a haft of transport investment needs only.
As foresaid, the total expenditure was suggested by the MOT12 seems to be ambitious
since it estimated the expenditure per annum at US $ 7 billion or equivalent to 14 percent of
GDP of 2005. Though the MOT’s plan has listed out all the project needs under the
investment program, it needs to consider the availability of financing sources.
Table 6. The Prediction of ODA mobilizing in between 2006-2010 (inserted here)
III.2.2 The Possible Expenditure Requirement in the Future
In this paper, I attempt to suggest three possible scenarios of the expenditure in transport
sector up to 2010 for comparison. Suppose that the total investment in transport sector could
vary from 1.8 percent to 3 percent of GDP, then three possible scenarios of the expenditure
11 World Bank, Vietnam’s Infrastructure Challenges, World Bank 2006; and The Vietnam Socio-economic Development Plan 2006 – 2010, Ministry of Planning and Investment. 12 The Vietnam Transport Development Plan up to 2020, Ministry of Transport, 2002.
9
plan which possibly estimate the annual expenditures at 1.8 percent, 2.5 percent and 3 percent
of GDP, respectively, from lowest to highest scenarios. Regarding to the economic growth
rate average at 7.2 percent over the decade, it is realistic to assume that, in the next five years,
the GDP growth rate should move from 6.5 percent to 8.5 percent, respectively, from low
case to high case. Table 7 shows the details.
Table 7. Estimate of the Total Investment for Transport Sectors (inserted here) Having considered the expenditure trend in transport sector over the last decade, I
suggest that the future expenditure should possibly be scenario II, which suggests the annual
expenditure at 2.5 percent of GDP. In that case, the total expenditure in the period 2006-2010
equals to US $ 8 billion that is much lower than the amount proposed by the MOT as present
in Table 4.
The statistical data indicated that the sate budget allocated for transport sector remains at
0.7~ 1 percent of GDP over the last decade. If state budget could not be increased in the
future thus total state budget and ODA account for about 70 percent of investment
requirement only (Table 8). In that circumstance, there is about 33 percent of expenditure
need is outstanding commitment. Obviously, the Vietnamese government needs to introduce
the new financing sources to bridge the budgetary shortage, otherwise budget constraint
clearly occurs.
Table 8. The Future Expenditure Requirement in Transport (inserted here)
IV. The Diversification of the Financial Resources for Transport Sector.
The rapid economic growth has generated high rate of traffic demands, urbanization, and
the large increase in maintenance cost due to the fast expansion of transport’s infrastructure
assets. As foresaid, although the expenditure in transport sector was mainly funded by the
state budget and ODA in the past, the future investment needs may be an obstacle because of
budget constraint. Thus, in order to ensure the sustainable financing sources for transport, the
diversification of financing sources is considered as the only countermeasure.

10
IV.1 Current issues In order to meet the huge investment needs in the future, the government must make full
use of not only the domestic budget but also other funding sources. In addition to ODA
sources, mobilization of private financing sources from both overseas and domestic is
necessary. There are two remaining issues need to be improved. First is the rigidity of the
financing scheme, which prevents the government from expanding its financing sources for
transport development. The expenditure in transport infrastructure was mainly funded by the
state budget and ODA, which accounted for more than 90 percent of investment requirement,
while the remaining fund was provided from other sources such as government bonds and
private sector. There is no other financing modality than these ones in transport sector.
The second is the current financing policies in transport sector, which are unfriendly
toward the private participation in infrastructure (PPI), particularly in transport sector. There
are only two foreign investors operating in port services and four State-owned Enterprises
(SOEs) participated in toll roads as Build-Operate-Transfer (BOT) projects. In order to
encourage the private sector’s capital to participate in transport sector, the incentive policies
should be introduced. The next section provides further information related to these issues.
V.1.1 Public Bonds
The government has been issuing bonds with 5 – 10 year maturity to partly finance
shortage of budget expenditure. The bonds are part of government’s plan aiming to
accumulate US $ 4 billion by 2010, mainly funding for infrastructure projects including
transport sector. This is the third major financing source following two main sources of state
budget and ODA.
These bonds are considered as the off-budget sources to comply with the State Budget
Law which set strict limit on the budget deficit including amortization less than 5 percent
GDP. Although these bonds are off-budget, the interest payment of these bonds is on-budget.
11
Bonds of five year maturity have around 8.4 percent of interest. In 2004, the bonds are to sell
about VND 8.2 trillion, which is equivalent to US $ 600 billion. The main buyers of
government bonds are state-owned commercial banks and Vietnam insurance company.
Although the interest rate has been marginally higher than the deposit rates offered by the
banks for similar maturities, the government bond was still not appreciated by the private
sector and the public. The main reason may stem from its long-term frozen capital and it was
viewed as the low liquid asset in capital market.
V.1.2 Private Participation in Infrastructure (PPI)
The government has emphasized the mobilization of the private finance for a number of
years. However, there are very few projects funded by the private sector and majority of them
were BOT’s contracts. Since BOT regulations were enacted, currently referred to Decree 77
of 1997 for domestic investments, and Decree 62 of 1998, as amended by Decree 2 of 1999,
for foreign investments, the Ministry of Transport has entered in a few domestic BOTs,
contracted out to SOEs under the Ministry. Despite of these projects in the form of BOT, the
project costs were mainly funded by the state budget through providing loans for the SOEs.
The PPI has been more proactive in other infrastructure sectors such as electricity,
energy and telecommunication than in the transport sector. The low incentives of PPI was
mainly stemmed from the projects completed, which have been undertaken on an ad hoc
basis, without any clear evidence of a policy designed to encourage the private participation
in infrastructure. As such, there are still no replaceable models for PPI projects in Vietnam,
which can provide investors the assurances that future transactions can be completed in a
transparent and timely manner. The reasons for this are complexity, which varies from sector
to sector, but three general points are worth noting.
First, some sectors such as airports, strategic ports, and railways were not encouraged
the private sector from participation in investment, operation and management.
12
Second, there are a number of other restrictions on the ability of non-nationals to invest
in the infrastructure sectors. The time consuming tendering procedures for selecting
contractors for a BOT project have long been criticized by many foreign investors. As such,
with extremely limited financial and technical capacity in the purely domestic private sector,
little or no development has taken place.
Third, the general business environment, while slowly improving the infrastructure
projects usually required the investment in long-term and the capital investment in
infrastructure are highly risky for both private sponsors and lenders. For example, foreign
investors often complain about the difficulty of negotiating projects with multiple layers of
Vietnamese bureaucracy and the unnecessary expenditure of time and money dealing with
different authority Departments.
IV.2 The Financing Policies for Transport: The Japan’s Experiences. Infrastructure development in East Asia has critically contributed to economic growth,
which is, obviously, led by the crucial role of the government. Reflecting their heavy
involvement in infrastructure development, the governments of the East Asian countries have
promoted many creative plan centres on its financing issues. Direct funding from government
budgets has played a determinant role but the governments have also established mechanisms
for bringing commercial discipline to the financing and operations of infrastructure. There are
many different measures to diversify of the financing sources have also been introduced such
as establishing the special accounts, charging service fees, introducing taxes for the restricted
overused. This section focuses on the Japan’s experiences of diversification financing sources
in transport sector, in order to get useful implication for Vietnam.
IV.2.1 The Diversification of Funding Sources.
In order to fully mobilize domestic sources for infrastructure, Japanese government has
diversified configuration of financing sources of the central government, the local

13
governments and public corporations. To alleviate the burden on general tax revenues, the
Japanese government has introduced several measures such as public bonds issued by both
central and local governments, created public corporations that charged user fees and issued
corporate bonds, and established several special accounts for major infrastructure projects
that were financed by user fees and earmarked taxes. The diversification of financing allowed
the Japanese government to play a pivotal role in infrastructure development to support
Japan’s economic growth at higher rates from the 1950s through the 1980s.
The Fiscal Investment and Loan Program (FLIP) has been a major role device for
financing Japanese infrastructure development. The program takes fund from the postal
saving and social security pensions, and funnels them to public corporations and private
sector investment as interest bearing loan. By introducing this program, the Japanese
government has been able to stimulate investment in infrastructure without directly
increasing taxes and to provide the incentives to private sector to expand its capital
investment through government financial institutions.
The Japanese government’s bonds were also one of the important financing sources in
early development stage of 1950s. The fiscal discipline is expressed in the public finance law,
which was set limits on the issuance of government bonds in order to ensure without
hyperinflation and the rapid accumulation of government debt13. For decades after the start of
economic expansion in 1955, the government was able to avoid issuing deficit financing
bonds. However, under the pressure of public investment needs in 1960s, the Japanese
government has urged the Japanese Diet enacted Exceptional Law on bond issue each year.
By doing so, the government was permitted to promote the issuance of deficit financing
bonds. Although such kind of law was meant to be temporary, financing by this method
become an important channel to finance for infrastructure, which reached Yen 14,170 billion
13 Ashoka Mody, Infrastructure Strategy in East Asia: the Untold Story, World Bank 1997, p.85

14
per annum by 198014. The Japanese experiences showed that the issuance of deficit financing
bonds has not caused serious economic problem if there is high level of saving in the private
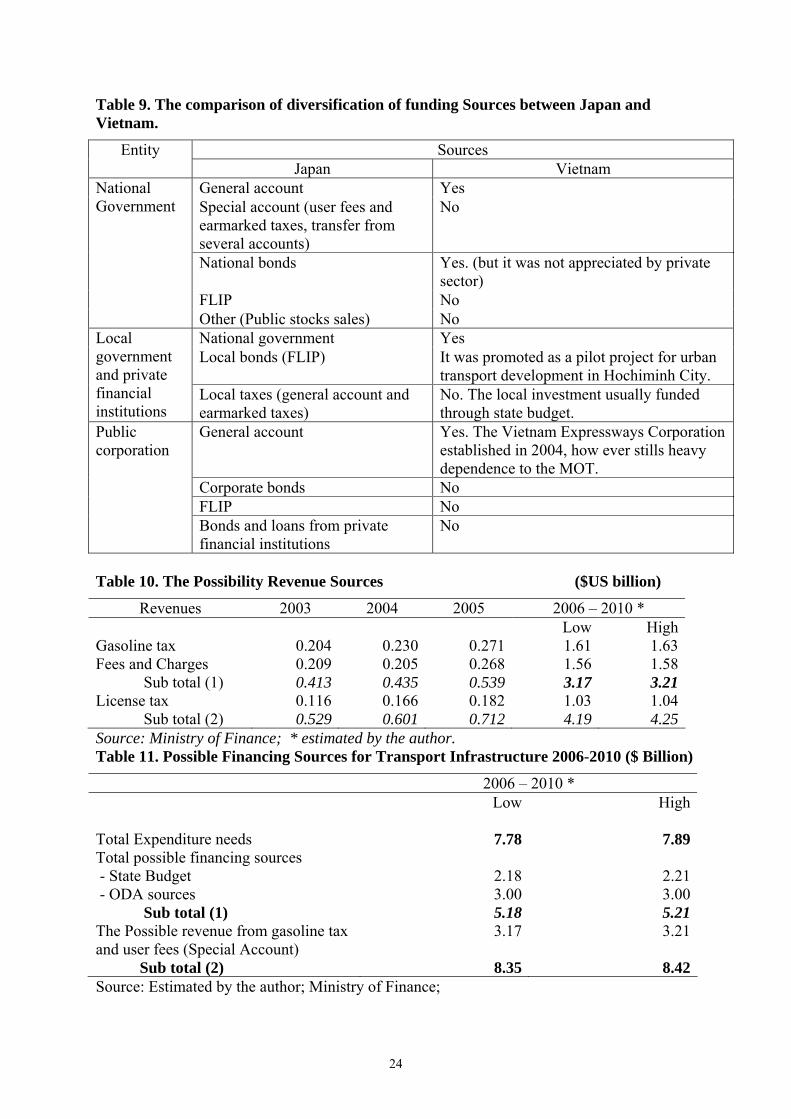
sectors. Table 9 shows the mechanism of Japanese financing sources in comparison with
those of the Vietnam.
Table 9. The comparison of diversification of funding Sources between Japan and Vietnam (inserted here)
IV.2.2 Special Accounts for Transport Sector.
The Japanese government established the special accounts for infrastructure from 1950s
including special accounts for transport development such as road improvement in 1958, and
harbor improvement in 196115. These special accounts effectively enabled the government to
set fees and taxes at major projects. For example, the major sources of revenue earmarked for
road expenditures include gasoline tax for road improvement and three-quarters share of an
automobile weight tax for road construction, these two categories make up more than 90
percent of national budget for the road sector16. User fees are also used for the construction
and maintenance of certain infrastructure facilities. Moreover, imposing fees on consumer is
an important measure of deterring over use.
Japan has successfully used the special accounts for infrastructure investment, using the
public corporations, financed in the early stage by the government bonds and later on by the
revenues from fuel tax and user fees from the early projects. It would be worth for Vietnam to
consider similar models, which would be the most appropriate to the country’s conditions.
In context of Vietnam, the special account could be introduced for the roads as the first
priority. The reason is that, firstly, expenditure in road would be accounted for the largest
portion of the total expenditure in the transport sector and, secondly, road sector is able to
14 Ashoka Mody, Infrastructure Strategies in East Asian: the Untold Story, World Bank 1997, pp.85-86 15 Yuzo Akatsuka and Tsuneaki Yoshida, System for Infrastructure Development: Japan’s Experiences, Japan International Cooperation Publishing, 1999. pp.106-10, website of Ministry of Land, Infrastructure and Transport http://www.mlit.go.jp 16 Ashoka Mody, Infrastructure Strategies in East Asia: The Untold Story, World Bank 1997, p.85

15
create the pay back through collecting user fees and gasoline tax. Since the Vietnam Road
Administration, an official agency, is responsible for operation and maintenance of the
national highway network, it could be the most appropriate agency for management of the
road special account.
The user fees and gasoline tax could be the possible financing sources to bridge the
inadequate financing sources. According to the Ministry of Finance of Vietnam, the state
revenue from gasoline taxes and user fees in 2003-2005 is stable at one percent of the
national GDP. If the license tax is included, the total of this revenue could be reached 1.3-1.5
percent of GDP. Table 10 shows that there are US $ 3.2 billion could be mobilized from
gasoline tax and user fees.
Table 10. The Possibility Revenue Sources (inserted here) Obviously, if the revenue from gasoline and user fees could be specifically allocated in a
special account for transport, then total revenue from the state budget, ODA funds and the
special account can meet the demand of expenditure (Table 11). The second best case is that
the government should review the priority list of projects and the second priority projects
should be eliminated from the public investment plan. Doing so, these revenues can be
shifted to invest in the other infrastructure sectors such as electricity, telecommunication and
urban infrastructure.
Table 11. Suggestion of Financing Sources for Transport Infrastructure 2006-2010 (inserted here)
IV.2.3 The Public Corporations.
To alleviate the burden on state budget facing to the central and local governments,
Japan established public corporations to assume some of the burden for financing and
constructing infrastructure. The early public corporations included The Japan Highway
Public Corporation (nihon dōro kōdan) established in 1956 and Tokyo Expressway Public
Corporation in 1959. Public corporations could issue their own bonds and borrow from the
private sector. Under the guidance and supervision of the state, these special corporations
16
implement activities in pursuit of the policy objectives set down by the central government.
As needed, they receive the financial support and loans under preferential conditions.
In order to enhance the efficiency of utilizing budget in transport, the Japanese
government has introduced incentives to the public corporations. Because the Japanese public
corporations could attain loans from the government and have to repay the loan with interest,
they are forced to pursue profitability. In contra, the Vietnamese SOEs are tightly managed
by the Ministry of Transport. They have rarely taken their own autonomous responsibilities
and accountabilities because they are fully sponsored by the MOT. Hence, the SOEs have
low incentives in promoting their own business and pursuing profit. Some Japanese public
corporations have failed to meet their accountabilities because of unprofitable projects,
however, by introducing public corporations scheme, the Japanese government can improve
the efficiency of budget usage.
It is suggested that the MOT should establish some public corporations, initially, in road
sector. In 2006, the Vietnamese government launched the National Expressways
Development Program, which includes many potential profitable projects. These projects
should be considered to convert to the public corporations as the pilot projects.
IV.2.4 The Public-Private Financing Partnerships.
There are two infrastructure projects, the Trans-Tokyo Bay highway and the Kansai
International Airport, which are the examples of the willingness of Japanese government to
combine the public and private resources in financing for the huge infrastructure projects.
The construction of the Trans-Tokyo Bay Highway is a prime example of how private and
public entities can together develop social capital for development of the huge infrastructure.
In 1986 the Trans-Tokyo Bay Highway Corporation (TTB) was established as a joint stock
company consisting of government capital (from Japan Highway Corporation), local
government and private corporations. In order to collect the extremely huge construction cost

17
of about Yen 1,428.4 billion, more than 80 percent of the financing source has been
mobilized through bonds, loans from the central government, and a part from private
financial institutions. Upon completion, the TTB will turn over the asset to the Japan
Highway Corporation, which is responsible for managing major toll road in Japan, while the
TTB will engage in maintenance activity. Despite of the project failure because of financial
debt, the project’s financing scheme should be viewed as the lesson learned in introducing the
form of the Public-Private Financing Partnerships.
There are some key points, which are worth noting as follow.
First, the huge financing source requirements for transport sector could not be satisfied
with budget from the public sector only. In order to create the sustainable financing sources
for transport infrastructure, attracting the private capital to co-sponsor the large expenditure’s
projects is necessary. Despite Japan’s economy had very high saving ratio, the expenditure in
transport could not be funded by the public budget itself.
Second, introducing the friendly business climate is a necessary measure to attract
private sector to invest in transport sector. There is also need to develop other funding
modalities and/or concession of public infrastructure assets. It is recommended that the MOT
and related agencies take action to address some key issues of legal and regulatory
framework, which may inhibit the private sector from participating in the transport sector.
For example, the Decree 77 of 1997 for domestic investments in the public infrastructure
requires that the private partner must provide at least 30 percent of a project cost as the
qualification for bidding the BOT contract. As a huge cost is required in many transport
projects, this regulation seems to become a barrier to prevent the private sector from
participating in the sector. In that case, it is suggested that the flexible financing scheme
could be an appropriate solution, where the financing shares bearing by the private sector
should be considered case by case through the negotiation process.
18
Last but not the least, the Public-Private risk sharing is one of the most serious concerns
of both foreign and domestic private partners since the experience showed that the risk
normally rests with the private sector. The MOT is under process to amend the Decree 77 and
it is recommended that the risk-sharing principles need for serious attention.
V. Conclusions
The investment needs in the transport sector will require a large amount in the future,
which is estimated about 2.5 percent of GDP. The expenditure needs could be even larger
than that amount if the maintenance cost for the existing assets, investment in transport
means and services and expenditure for urban transportation are fully accumulated.
The existing estimation of the future expenditure needs in transport sector could be met
only by a combination of public and private finance. The previous estimation of future
expenditure requirements in the National Transport Development Plan produced by the MOT
in 2002 should be re-assessed due to its ambitious expenditure requirements. The MOT’s
plan should be based on a stronger forward realistic planning framework, which addresses
budget and recurrent expenditure requirement in line with the Vietnam Socio-economic
Development Plan and consistent with a sustainable budget constraint.
The diversification of financing sources for transport sector should be considered as an
only possible solution to fill a gap between the state budget constraint and the large
expenditure requirements.
It is necessary to establish the special account for transport sector. Particularly, the MOT
should implement a pilot project in road sector. The budget for the highway special account
could be made as loans from state budget and government bonds. The future revenue from
user fees and facilities charges could be used as pay back sources to highway special account.
19
Enhancement of the effectiveness of using investment sources in transport is necessary
as an immediate measure. It is suggested that the MOT should establish a public corporation
that is responsible for each special sub-sector such as expressways, highways, railways,
shipping and ports and so forth. The public corporation should borrow a loan from special
account or private sector and it will pay back with interest. Under the pressure of profit
driving forces, the public corporation has a vehicle for monitoring the quality and efficiency
of using budget.
As foresaid, it is clear that the transport sector needs to attract financing from private
sector to expand the existing budget constraint. The Vietnamese government should consider
opening up the barrier that inhibited private sector investment such as airports, railways and
ports. It is also important to provide government support measures to private sector such as to
ease the administration procedures in concession process and to establish clear risk-sharing
principles.
Considering the limitation of financing sources of the domestic capital market, the
government should repeal the clause that required private has to share at least 30 percent of
total investment cost in BOT contract. Moreover, the government should encourage foreign
investor participation by creating transparent and consistent PPI policy.
20
Bibliography
The Vietnam Socio-economic Development Plan 2006-2010, Ministry of Planning and
Investment, 2005.
World Bank, Vietnam Managing Expenditure for Poverty Reduction and Growth, World
Bank 2005.
JICA, Vietnam Transport Strategy Studies, Japan International Cooperation Agency, 2000
Annual Report 2005, Ministry of Transport, Vietnam 2005.
Asoka Mody, Infrastructure Strategy in East Asian: the Untold Story, World Bank 1997.
Thomas R. Leinbach ans Chia Lin Sien, South East Asian Transport: Issue in Development,
Oxford University Press, 1998.
UNDP Vietnam, Vietnam Development Cooperation Report, UNDP, 2005.
World Bank, Vietnam’s Infrastructure Challenges, World Bank, 2006.
The Vietnam’s Transport Development Plan up to 2020, the Ministry of Transport, Vietnam,
2002.
Yuzo Akatsuka and Tsuneaki Yoshida, System for Infrastructure Development: Japan’s
Experiences, Japan International Cooperation Publishing Co., Ltd, 1999.
Vietnam Statistic Yearbooks: 1994, 1995, 1996, 1997, 1998, 1999, 2000, 2001, 2002, 2003,
2004, Government Statistical Office of Vietnam, http://www.gso.gov.vn

21
Appendix A: Tables
Table 1. Domestic Volume 1999 – 2004 Mode 1999 2004
Freight Transport 1000 ton %
mil ton-Km %
1000 tons %
mil ton-Km %
Annual increase
ton-km %
Railways 5,146.0 2.7 1,445.5 3.6 8,829.4 3.1 2,790.8 4.1 14.1Roads 132,137.3 69.4 7,159.8 17.8 192,562.5 67.6 10,305.5 15.3 7.6Inland-water
ways 39,887.2 21.0 3,967.8 9.8 59,071.4 20.7 5,591.8 8.3 7.1Maritime 13,006.1 6.8 27,619.6 68.5 24,363.6 8.6 48,335.9 71.9 11.8Aviation 42.5 0.02 105.5 0.3 102.5 0.0 237.9 0.4 17.7
Total 190,219.1 100.0 40,298.2 100.0 284,929.4 100.0 67,261.9 100.0 10.8
Passenger Transport
mil. Pass %
mil pass-km %
mil pass %
mil pass-km %
Annual increase
pass-km %
Railways 9.3 1.3 2,722.0 8.8 12.8 1.1 4,378.0 9.0 10.0Roads 588.4 81.0 22,053.3 71.3 999.7 84.4 31,730.7 65.4 7.5Inland-water
ways 125.7 17.3 2,109.7 6.8 166.2 14.0 3,440.0 7.1 10.3Aviation 2.7 0.4 4,042.0 13.1 5.6 0.5 8,948.0 18.5 17.2
Total 726.1 100.0 30,927.0 100.0 1,184.3 100.0 48,496.7 100.0 9.4Source: Government Statistical Office (www.gso.gov.vn)
Table 2. Overview of Transport Sector Expenditure (Nominal Figure) (Billion VND unless otherwise indicated)
1999 2000 2001 2002 Growth per
annum % Total Transport Expenditure 10,616 11,375 14,985 18,721 20.8- Total Exp. by Central Gov. 5,901 6,391 6,582 8,305 12.1- Total Exp. by Local Gov. 4,715 4,984 8,403 10,416 30.2 Transport Exp. as % of GDP 2.7 2.6 3.1 3.5 Transport Exp. as % of Total Public Exp. 12.5 11 12.5 13.8 Local Exp. as % of Total Transport Exp. 44.4 43.8 56.1 55.6 Total Recurrent Expenditures 723 1,319 1,404 1,331 22.6- Total Central Recurrent Exp. 331 792 799 580 20.6- Total Local Recurrent Exp. 392 527 605 751 24.2Recurrent Exp. As % of Total Exp. 6.8 11.6 9.4 7.1 Source: Ministry of Finance

22
Table 3. Transport Expenditure Levels as Percentage of GDP of East Asian Countries
Country Transport Investment at % of GDP
Annual Economic Growth Rate % (2000-2005)
Malaysia 1.9 4.3Korea 1.8 6.3Thailand 1.7 4.1Singapore 1.3 3.1Vietnam 2.2 7.5Source: Ministry of Transport, IMF statistics
Table 4. Investment Demand for Transport Infrastructure ($US Million)
2002 - 2010 period 2011 - 2020 period Total period 2002-2020
Annual average
Total 50,125 100.00% 84,352 100.00% 134,477 100.00% 7,078 Road (in which:) 15,609 31.14% 20,846 24.71% 36,454 27.11% 1,919
Expressway 3,589 7.16% 10,059 11.93% 13,648 10.15% 718National
Highways 8,846 17.65% 7,931 9.40% 16,778 12.48% 883Provicial Road 3,173 6.33% 2,855 3.39% 6,028 4.48% 317
Rural Transport 5,489 10.95% 4,940 5.86% 10,428 7.75% 549Railway (in which:) 13,874 27.68% 24,973 29.61% 38,848 28.89% 2,045
Express Railway 12,944 25.82% 22,938 27.19% 35,882 26.68% 1,889Normal Railway 930 1.86% 2,035 2.41% 2,966 2.21% 156
Maritime 1,294 2.58% 4,124 4.89% 5,418 4.03% 285Inland Waterways 297 0.59% 286 0.34% 582 0.43% 31Civil Aviation 1,135 2.26% 2,305 2.73% 3,440 2.56% 181Urban Transport (Hanoi & Hochiminh City) 12,429 24.80% 26,878 31.86% 39,307 29.23% 2,069 Source: Vietnam Transport Development Strategy up to 2020 (Ministry of Transport, 2002)
Table 5. Comparison of Transport Expenditure Levels in East Asian Countries. Country (period) Transport Investment as % of
GDP Total Public Investment in
Infrastructure (% GDP) Japan (1957-1973) 2.0-2.5 6.0-8.0Korea (1983-1991) 2.1-3.0 5.3-8.2Taipei China (1970-1992)* 2.1-4.0* 8.1-13Malaysia (1973-1983)* 6* 7.3Thailand (1973-1983)* 6-7* 6.9Vietnam 1.8-2.5 7.5Source: World Bank 1994a, World Bank 1996, MoF Vietnam. * Investment in both Transportation and Telecommunication

23
Table 6. The Prediction of ODA mobilizing in between 2006-2010
Sectors Amount of ODA as the agreements (2001-2005)
Estimate the total amount of ODA will be signed under
agreements
Estimate the ODA committed
(2005-2010)
$US billions % allocation $US billions % allocation $US billions
Agriculture and Poverty reduction 1,6 14,6% 2,2-2,5 18% 2,9-3,3
Industry and Energy 2,1 18,7% 1,9-2,2 16% 2,6-2,9
Transport, Telecommunication and Urban Infrastructure 2,9 26,3% 3,6-4,1 30% 4,8-5,5
Health, Education and Social infrastructure 4,5 40,4% 4,3-4,9 36% 5,8-6,6
Total 11,1 100% 12,0-13,6 100% 16,0-18,2Source: The data summarized by author based on resources from Ministry of Agriculture and Rural Development, Ministry of Energy, Ministry of Transport and Ministry of Planning and Investment.
Table 7. Estimate of the Total Investment for Transport Sectors
Total Investment in Transport Sector
($US billion) in 2006-10 Average Investment per Annum
($US billion) Low High Low High
Total GDP 2006-10 311.36 315.72 Scenario I (1.8% GDP) 5.60 5.68 1.12 1.14Scenario II (2.5% GDP) 7.78 7.89 1.56 1.58Scenario III (3% GDP) 9.34 9.47 1.87 1.89
Source: Estimated by author - GDP in 2005 is about $US 50.6 billion - Low (GDP growth at 7%); High (GDP growth at 8.5%)
Table 8. The Future Expenditure Requirement in Transport ($US billion)
1999 2000 2001 2002 2003 2004 2005
Total 1999-2005
% of total exp. 2006-2010*
Low HighTotal GDP 25.38 28.02 30.54 34.00 38.92 45.25 51.72 253.82 311.36 315.72Total exp. 0.51 0.53 0.74 0.86 0.92 0.97 1.08 5.60 100.0 7.78 7.89- State budget 0.15 0.18 0.15 0.29 0.33 0.30 0.37 1.76 31.4 2.18 2.21- ODA 0.22 0.23 0.27 0.24 0.35 0.39 0.42 2.12 37.8 3.00 3.00Outstanding commitment 0.14 0.13 0.32 0.33 0.25 0.28 0.29 1.73 30.8 2.60 2.68
Source: Ministry of Finance, Government Statistical Office * Estimated by the author
24
Table 9. The comparison of diversification of funding Sources between Japan and Vietnam.
Sources Entity Japan Vietnam
General account Yes Special account (user fees and earmarked taxes, transfer from several accounts)
No
National bonds Yes. (but it was not appreciated by private sector)
FLIP No
National Government
Other (Public stocks sales) No National government Yes Local bonds (FLIP) It was promoted as a pilot project for urban
transport development in Hochiminh City.
Local government and private financial institutions
Local taxes (general account and earmarked taxes)
No. The local investment usually funded through state budget.
General account Yes. The Vietnam Expressways Corporation established in 2004, how ever stills heavy dependence to the MOT.
Corporate bonds No FLIP No
Public corporation
Bonds and loans from private financial institutions
No
Table 10. The Possibility Revenue Sources ($US billion)
Revenues 2003 2004 2005 2006 – 2010 * Low HighGasoline tax 0.204 0.230 0.271 1.61 1.63Fees and Charges 0.209 0.205 0.268 1.56 1.58
Sub total (1) 0.413 0.435 0.539 3.17 3.21License tax 0.116 0.166 0.182 1.03 1.04
Sub total (2) 0.529 0.601 0.712 4.19 4.25Source: Ministry of Finance; * estimated by the author. Table 11. Possible Financing Sources for Transport Infrastructure 2006-2010 ($ Billion)
2006 – 2010 * Low High
Total Expenditure needs 7.78 7.89Total possible financing sources - State Budget 2.18 2.21 - ODA sources 3.00 3.00
Sub total (1) 5.18 5.21The Possible revenue from gasoline tax and user fees (Special Account)
3.17 3.21
Sub total (2) 8.35 8.42Source: Estimated by the author; Ministry of Finance;