Embed Size (px)
Citation preview

Revenue Diversification and the Financing of Large American Central Cities
Howard Chernick, Adam Langley, and Andrew Reschovsky
© 2010 Lincoln Institute of Land Policy
Lincoln Institute of Land Policy Working Paper
The findings and conclusions of this Working Paper reflect the views of the author(s) and have not been subject to a detailed review by the staff of the
Lincoln Institute of Land Policy.
Contact the Lincoln Institute with questions or requests for permission to reprint this paper. [email protected]
Lincoln Institute Product Code: WP10HC1

Abstract The housing crisis and the recession have placed tremendous fiscal pressure on the nation’s cen-tral cities. Cuts in state government fiscal assistance to their local governments, plus shrinking property tax bases are challenging the ability of local governments to continue providing their current levels of public services. Although the property tax remains the main source of revenue for local governments in the U.S., a number of governments, especially those in large cities, have diversified their revenues by adding other revenue sources, particularly local sales and income taxes. This paper analyzes the financing of the nation’s largest central cities from 1997 to 2008. Be-cause expenditure responsibilities vary among city governments and because overlying govern-ments play different roles, we develop the concept of constructed governments in order to allow us to compare the revenue-raising policies of large central cities. The authors utilize these data to explore whether revenue diversification supports higher levels of government spending. States that allow their local governments to diversify their tax instruments are implicitly inviting more direct competition with their own fiscal powers. Using central city fiscal data and information of state sales tax rates, the authors also explore vertical tax competition between states and their large cities.

About the Authors Howard Chernick Department of Economics Hunter College and the Graduate Center, City University of New York [email protected] Adam Langley Lincoln Institute of Land Policy [email protected] Andrew Reschovsky Robert M. La Follette School of Public Affairs University of Wisconsin-Madison [email protected]
Acknowledgements Paper prepared for the 32nd Annual Research Conference of the Association for Public Policy Analysis and Management, Boston, MA, November 4-6, 2010. The authors would like to thank Christian King for her very able research assistance, and the Lincoln Institute of Land Policy and the City University of New York for financial support. We thank Christopher Pece, Assistant Chief for Recurrent Programs of the Governments Division of the U.S. Census Bureau, for his assistance in helping us obtain and understand the Census Bureau’s individual unit of govern-ment files.

Table of Contents Introduction 1 Fiscal Relationships between State and Local Governments 3 The Financing of Large Central Cities 4
Central City Finances in 2007 6 Changes in Constructed City Revenues between 1997 and 2008 7 Annual Fluctuations in Revenue 8 Revenue Diversification and the Financing of Central Cities 9
Regression Model and Variables 9 Data and Estimation 12
Vertical Tax Competition between States and Cities 14 Estimates of Vertical Tax Relationships for the Sales Tax 15
Conclusion 16 Appendix 1 19 Appendix 2 31 References 32

1
Revenue Diversification and the Financing of Large American Central Cities Introduction One-fifth of the total U.S. population lives in the nation’s 100 largest cities. The growth and prosperity of these cities is key to the economic prosperity of the nation. Because cities generally enable a higher than average density of economic activity, they often result in lower costs for both customers and suppliers. Dense urban environments allow business firms to more easily adapt to changes in demand, to increase the quality of the matching process between the needs of businesses and the skills of workers, and to facilitate spillovers of knowledge from one industry to another. In many cases, these economies of agglomeration are more than sufficient to offset the greater congestion costs in dense urban areas (Ciconne and Hall, 1996). Cities facilitate spe-cialized consumption, such as art and culture, and cities that specialize in these types of activities tend to have relatively high rates of growth (Haughwout and Inman, 2002). The prosperity of cities is not preordained. A necessary condition for the economic prosperity of cities is the existence of an effective local government that provides a wide array of public serv-ices at competitive tax rates. The economic recession, the depressed housing market, and the fis-cal crises facing many states, all raise concerns about the continued ability of large U.S. city governments to function effectively. In a recent survey of city government chief financial offi-cers conducted by the National League of Cities, nearly 90 percent of respondents reported that their cities are “less able to meet fiscal needs in 2010 than in the previous year” (Hoene and Pa-gano, 2010). Furthermore, in the majority of surveyed cities, spending has been reduced and pub-lic service delivery reduced. To date, most of the public debate about the fiscal condition of central cities has focused on spending by city governments, including the appropriateness of public sector wages, health in-surance, and pension costs, and on mechanisms to reduce spending without cutting essential pub-lic services. In this paper, however, we focus on the revenue side of city budgets. Historically, the funding of local governments in the United States has relied heavily on the property tax. However, the combination of high visibility, large periodic payments, and the weak link between annual liabilities and taxpayer ability to pay have all contributed to making the property tax a very unpopular tax. Its unpopularity has undoubtedly encouraged state legislatures to allow local governments to raise revenues from alternative sources. Although the property tax remains the single most important source of municipal government revenues, there is a longstanding trend among municipal governments to move away from the property tax towards alternative revenue sources. The property tax accounted for 58.5 percent of the tax revenue and 36.8 percent of own-source general revenue of all municipal governments in 1992.1 These property tax shares had fallen to 53.3 and 33.6 percent, respectively, by 2007 (U.S. Census Bureau, 2009).
1 These percentage calculations are based on revenues from all governments classified as municipalities and town-ships by the Census Bureau.

2
The impact of local government revenue diversification away from the property tax has attracted relatively limited interest among economists. During the 1970s, several papers focused on local government revenue diversification by analyzing the benefits and shortcomings of the property tax relative to the merits of alternative sources of revenue. Gabler (1975) made the case for in-creasing the use of local sales and income taxes in the financing of local governments. Re-ischauer (1975) defended the reliance on the property tax as the mainstay of local government finance by arguing that while the property tax is hardly an ideal tax, it is preferable to alternative sources of local tax revenue. Based on a study of four metropolitan areas, Bowman and Mikesell (1978) find that while the utilization of non-property taxes increases fiscal disparities within the four metropolitan areas, it tends to benefit the central cities relative to their suburbs. Several more recent papers also address various issue related to local government revenue diver-sification. Oates and Schwab (2004) ask whether local governments should rely on an income tax or a property tax. They assess the strengths and weaknesses of each tax and conclude that neither tax is unambiguously superior to the other. They do not, however, address the situation where local governments rely on both taxes simultaneously. Sjoquist, Walker, and Wallace (2005) ask whether local governments that diversify their revenue base away from full reliance on the property tax end up with lower levels of property taxation or higher levels of spending. They find evidence for both effects. Property taxes are lower, but overall spending is higher. In a recent paper, Carroll (2009) addresses the question of whether increased local government revenue diversification leads to greater instability in city government revenues over time. In this paper, we focus on revenue diversification in the nation’s largest central cities. As we will explain in detail below, simply determining what share of the own-raised revenues of central cit-ies comes from sources other than the property tax is by no means straightforward. The meas-urement problems arise because the governmental structures within American metropolitan areas are both complex and varied. While in a few metropolitan areas, municipal governments finance and provide a full array of public services, including elementary and secondary education, in most metropolitan areas, residents of central cities are served by an array of overlying independ-ent governments, generally with boundaries that are not coterminous with the geographic boundaries of the central city. After describing the varied sources of government revenue in the nation’s largest central cities, we will use a panel of data covering the years from 1997 through 2008 to explain differences in city general revenues per capita across time and space and to explore the role of revenue diversi-fication in determining the level of general revenues. In a general sense, states and their localities compete for the same fiscal resources. If the two levels of government use different taxing instruments, then the competition is less direct than if they share the same fiscal base. This basic point is reflected in the existing division of tax reli-ance, with the property tax as the primary local tax, and state income and sales taxes as the pri-mary state taxes. However, if property tax revenues are insufficient to finance the local share of cities’ expenditure needs, cities may try to diversify their revenue sources increasing their reli-ance on user fees and by turning to local-option general sales taxes, excise taxes, and income or wage taxes. These alternative local taxes may then become direct competitors to the state for fis-

3
cal resources. In the last section of this paper we explore the nature of this competition for reve-nue among state and local governments. Specifically, we explore whether the rate of state sales taxation influences per capita sales tax revenues in cities that levy local sales taxes. Fiscal Relationships between State and Local Governments Through direct grants, control over local taxation, and influence on governmental organization, state governments play a crucial role in the financing of cities. Most state legislatures retain con-trol over the sources of revenue, especially the taxing authority, available to their local govern-ments. In many states, even when local governments are authorized to use a tax, the state gov-ernment retains control over the definition of the tax base, e.g. allowable sales tax exemptions, and the rates that can be utilized. State constitutions or statutes determine the basic governmen-tal structure within each state and the expenditure assignments of each type of government. For example, whether spending and revenue decisions related to elementary and secondary education are the responsibility of municipal governments or of independent school districts is determined by state statute. Recently, in a number of states, the question of whether the mayors of large cen-tral cities should be granted control over the financing and management of schools has become a highly contested issue (Wong, et al., 2007). In addition to granting revenue authority and expenditure responsibilities to local governments, states maintain a major influence on city government finances through the amount of intergov-ernmental assistance they provide. A state that assigns more expenditure responsibilities to its local government reduces its own direct expenditure obligations, and may choose to substitute higher level of state intergovernmental grants to its local governments. Alternatively, a state that grants its local governments authority to utilize a broader range of revenue sources may choose to provide its local governments with less financial assistance in the form of direct grants. Yinger and Ladd (1989) in their study of 70 major American central cities find that there is a sys-tematic trade-off between grants and a measure of what they refer to as institutional assistance. The latter includes both taxing authority and expenditure assignments. Using data from 1982, they estimate a two-equation model of grants and institutional assistance. They find that a $1 increase in institutional assistance is associated with a 40 cent decrease in state grants. However, the trade-off is not symmetric: a $1 increase in grants is offset by almost a full dollar of decrease in institutional assistance. The implication of this finding is that state governments place a higher value on direct grants than on allowing cities to have more taxing authority or relieving cities of expenditure responsibility. The financing of local governments is also influenced directly by state actions that place limits on either the spending or revenues of those governments. These tax and expenditure limitations can apply to broad categories of spending or revenue, such as Colorado’s Taxpayer Bill of Rights (TABOR), or can be limited to restrictions on property taxes, such as California’s Proposition 13. While there has been little research on the impact of these limitations on the financing of large central cities, there exists a large literature on the impacts of tax and expenditures limita-tions on public education. Downes and Figlio (2008) provide an excellent review this literature.

4
The paper is organized as follows. The first section describes our data sample and the methodol-ogy we use to take account of the role of counties and non-overlapping school districts in city finance. The descriptive section is followed by a multivariate analysis of the role of revenue di-versification in explaining city revenues. The third section addresses the issue of vertical tax competition between cities and states, and presents a model of the relationship between state and local sales taxation. The last section summarizes results and discusses policy implications. The Financing of Large Central Cities In this section, we present summary data on the financing of large central cities in the U.S. The source of the data is the quinquennial Census of Governments for 1997, 2002, and 2007, and the Annual Surveys of State and Local Government Finances for all non-census years between 1997 and 2008. As our goal is to include in our analysis large central cities that both gained and lost population over the past few decades, we have defined our sample of cities as all cities with populations in 2007 over 200,000 except those cities whose 1980 populations were below 100,000, and all cities with populations in 1980 over 150,000 even if their 2007 populations were below 200,000. Although 115 cities meet these criteria, we were forced to drop Honolulu, Jersey City, Louisville, Newark, New Orleans, and Washington, DC because of various data is-sues.2 This leaves us with a sample of 109 cities. One reason that comparative fiscal analysis of large American cities has not been very illuminat-ing is the large variation across cities in expenditure responsibilities. For a handful of large American cities including Boston, New York City, Baltimore, and Nashville, there are no inde-pendent school districts or county governments serving local residents, and thus the municipal government is responsible for core municipal services plus elementary and secondary education and public health and welfare services usually provided by overlapping county governments. In other cities, for example, El Paso, Las Vegas, Miami, and Wichita, only about one-quarter of public spending on local government public services is done by the municipal government. Spending on other services that provide direct benefits to city residents is done by independent governments, either school districts or counties, which often serve geographical areas that stretch way beyond city government boundaries. Given the large variation in expenditure responsibilities among the nation’s largest cities, com-parisons of per capita spending levels across cities are meaningless. Likewise, comparisons across cities of revenue from various sources make no sense unless account is taken of the range of public services for which each municipal government is responsible. For example, municipal government data indicate that in 2008, Tucson, Arizona, which relies heavily on a local sales tax, collected just 13 percent of its total tax revenue from the property tax. However, when we take account of the revenues paid by city residents to the overlying school district and county gov-ernment, property taxes account for 64 percent of the total local tax revenue paid by the residents
2 We dropped Honolulu, Jersey City and Newark because they all have state-administered public schools. This orga-nizational structure makes it difficult to allocate revenues to city schools. Washington, DC was dropped because it fulfills many functions that are normally carried out by state governments. Louisville was excluded because the city and county merged at the end of 2002, in the middle of our analysis period, and we dropped New Orleans because of its dramatic decline in population following Hurricane Katrina.

5
of Tucson. Conversely, in Buffalo, New York, 88 percent of city government tax revenues come from the property tax, but because county governments in New York rely heavily on sales taxes, only about half of the total tax revenue paid by Buffalo residents to the local governments that provide them with public services comes from the property tax. As a means of dealing with heterogeneity in municipal government expenditure assignments and the variation in the organizational structure of local governments across the country, we have utilized a concept we call constructed city governments. The basic idea is to compile a measure of the total taxes and other revenues paid by the taxpayers of each large city in our sample by including all revenues collected by the municipal government and by the overlapping portion of independent school districts and county governments. This is not a new idea. In a report entitled Composite Finances in Selected City Areas, the U.S. Census Bureau (1974) compared fiscal and debt burdens for the central city and a single suburban municipality in five large metropolitan areas by compiling fiscal data from all overlapping local governments that served the residents of each of their sample municipalities. We follow a similar, although somewhat simplified method-ology, but apply it to all large U.S. cities. For a few cities, for example Boston, which has a dependent school district and no county gov-ernment, it was not necessary to adjust the municipal government revenue and expenditure data from the Census of Governments’ individual unit files. For cities with independent school dis-tricts that are coterminous to city boundaries, we combined the school district and municipal val-ues of all revenues and expenditure variables. For school districts that cover a geographical area larger than the city, and for cities served by multiple school districts, we use data on the spatial distribution of enrollment to allocate a portion of total school revenues and spending to the “con-structed” city. For each school district serving a portion of the central city, we employed geo-graphical information system (GIS) analysis of Census block group level data from the 2000 de-cennial census to determine the number of students in each school district that live in the central city. The final step in determining revenues and expenditures in constructed cities is to add data rep-resenting the county government serving city residents. In cases where county governments cover an area larger than the central city, expenditures and revenues are allocated to the con-structed city on the basis of the city’s share of county population.3 Appendix 1 provides a break-down of the number of cities in ten different categories of fiscal relationships with counties and school districts, and a comparison for each category of average per capita general revenues for each city and each constructed city in FY2008. Some previous empirical studies focusing on the financing of municipal governments have failed to take full account of the impact of overlapping jurisdictions in their analysis. For example, Carroll (2009) utilizes census data to study revenue diversification among all municipal govern-ments with populations above 25,000. She, however, makes no adjustments for variations in ex-penditure responsibilities despite the fact that her measure of revenue diversification, a Herfin-dahl index, is quite sensitive to the inclusion of revenue from overlapping, independent govern-
3 Contact the authors for a more detailed description of the methodology used to create our constructed city data set.

6
ments.4 Other studies, for example, Inman (1979), Sjoquist, Walker, Wallace (2009), have used dummy variables to partially adjust for overlapping jurisdictions. In their well-known study of the fiscal condition of large central cities, Ladd and Yinger (1989) focus explicitly on municipal governments. Their focus however is not on comparing the revenue of city governments, but rather on their revenue capacity. In developing their revenue-capacity measures they adjust for the capacity “used up” by county governments and independent school districts that overly city governments. Central City Finances in 2007 We start our analysis by presenting data on the financing of local governments for fiscal year 2007.5 Tables 1 and 2 display combined data for municipalities, townships, counties, and school districts—all local governments except for special districts. The left-hand panel includes data for these governments nationwide; the central panel contains data for revenues allocated to our sam-ple of 109 large constructed governments; and the right panel presents data for revenues not al-located to the 109 constructed governments. Table 1 shows major sources of general revenue and Table 2 focuses on tax revenues by source. Although there were 52,095 local governments in the U.S. in 2007 once special districts are excluded, the group of 109 large constructed governments accounted for 25 percent of the $1.2 trillion of general revenue of all of these local governments. Table 1 shows that on average these local governments raise 60 percent of their general revenues from their own sources and rely on other governments for the remaining 40 percent. The table demonstrates that while the 109 constructed governments receive only a slightly smaller share of their general revenues from intergovernmental sources as local governments serving smaller cit-ies, they receive a much larger share in the form of federal aid and a smaller share from state government aid. Of the own-source revenue of local governments, about two-thirds come from taxes, with user fees and charges and miscellaneous revenues making up the rest. Fiscal competition between city and state governments will be strongest when states and cities utilize the same taxes. Table 2 presents a picture of the sources of tax revenue for local govern-ments in the U.S. Constructed governments serving the nation’s largest cities rely much less heavily on the property tax than do local governments serving less populated municipalities. The property tax accounts for 56 percent of tax revenue in our sample of large constructed cities compared to 77 percent of tax revenue in smaller cities. In lieu of revenue from the property tax, the large constructed governments rely more heavily on the general sales tax, the individual in-come tax, selective sales taxes, and the corporate income tax compared with local governments serving smaller municipalities.
4 When we calculate Herfindahl indices for the cities in our sample using revenue data for the municipal govern-ments only and using revenue data for our constructed cities, we find the relative degree of revenue diversification changes dramatically for many cities.
5 We are unable to use data for 2008 for these tables because aggregate U.S. data on revenue by type of local gov-ernment is only available for quinquennial census years.

7
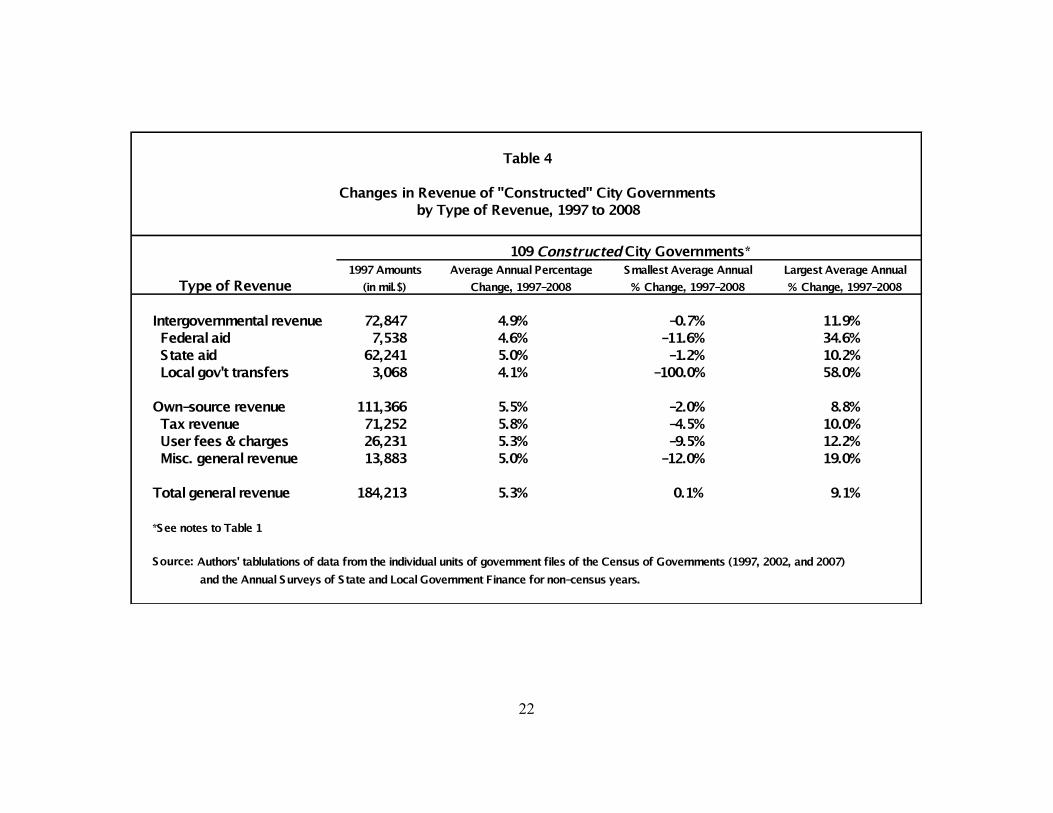
Because a few of the largest city governments, most notably New York City, place relatively heavy reliance on non-property tax sources of tax revenue, the data in Table 2 provides an over-estimate of degree of revenue diversification that exists in the average large central city. A more accurate picture is given in Table 3, which provides a count of the number of large constructed cities that use each tax and among those cities using the tax, the importance of the tax in total tax revenue. The data show that the vast majority of large central cities do not rely on revenue from either the individual or corporate income taxes. In contrast, all but 3 cities—Birmingham, Ala-bama; Warren, Michigan; and Milwaukee, Wisconsin—raise tax revenue from selective sales taxes, although in the majority of cities, excise taxes account for less than 10 percent of total tax revenue. All but 18 of the 109 constructed cities raise revenue from the general sales tax, how-ever in only 12 do sales tax revenues generate more than one-thirds of total tax revenue. Changes in Constructed City Revenues between 1997 and 2008 The beginning of the 11-year period between 1997 and 2008 was one of robust economic growth, with real GDP growth in excess of 4 percent per year through 2000. The economy suf-fered a mild recession in 2001 from which it began to emerge in 2002. After a sharp decline in 2001, the real GDP growth rate accelerated through 2004, although it remained below 4 percent. Thereafter growth slowed until the economy slipped into recession in late 2007. As the recession intensified, there was zero economic growth in 2008. Despite the mildness of the 2001 recession, the fiscal condition of most state governments weakened dramatically during 2002, 2003, and 2004, with many states facing large budget gaps (Johnson, 2003). One way in which states closed their budget deficits during this period was to cut state aid to local government (Dye and Reschovsky, 2008). As is well known, during most of this period, until 2006, housing prices and municipal government property tax bases were growing rapidly. The data in Tables 4 and 5 focuses on our sample of 109 constructed cities, and provide an over-view of their growth in revenues by source between 1997 and 2008. The tables list the average annual growth rate of revenue by source during this period, and the range of average revenue growth rates among the constructed cities in our sample. Total general revenue in our con-structed cities grew at an average annual rate of 5.3 percent, with own-source revenues growing faster than intergovernmental revenues, 5.5 compared to 4.9 percent. On average, tax revenue growth exceeded growth from user fees and charges and miscellaneous sources. Among inter-governmental sources, state aid grew faster than grants from the federal government. The large range of growth rates demonstrate the considerable variation among constructed cities in revenue growth over the period. Table 5 shows that revenue from the property tax grew faster than revenue from general and se-lective sales taxes. The rapid percentage growth of the individual and corporate income taxes primarily reflects the growth of revenue from these sources in New York City.6
6 New York City accounts for 79 percent of the 109 constructed cities’ total individual income tax revenue growth and 97 percent of total corporate income tax revenue growth.
8
Annual Fluctuations in Revenue Figure 1 displays the annual average percentage changes in real revenues in the 109 constructed cities included in our sample. Real general revenue grew in every year from 1997 through 2007, although growth was markedly reduced in the couple years after the 2001 recession. Reflecting the early impact of the most recent recession, real revenues were flat between 2007 and 2008. The well-documented declines in state aid to municipal governments and school districts is illus-trated by the very small growth of intergovernmental revenues in 2003, followed by a decline in real revenues in 2004 (Reschovsky, 2004). The figure also demonstrates clearly the stabilizing role played by taxes, and the offsetting roles played by own-source revenue and intergovernmen-tal aid. In 2004 sharp cuts in grants were offset by a big increase in local taxes. In other years, slowdown in the growth rate of tax revenues was matched by an increase in the growth rate of intergovernmental aid. Though we are accustomed to modeling state aid as an exogenous factor influencing the level of locally- raised revenue and taxes, the figure is suggestive of a simultane-ous process in which revenues at each level of government influence revenues at the other level. Although we are unable to distinguish between the impact of economic conditions and tax rate changes on total tax revenues, it appears likely that in 2004 cities increased local taxes and other forms of own-raised revenues in order to compensate for sharp cuts in intergovernmental grants. In figure 2, we illustrate the average annual changes in real tax revenues by type of tax. The clear lesson is that the property tax plays an important role in creating tax revenue stability and in mut-ing to some degree the strong pro-cyclical impacts of the individual and corporate income, and sales and excise taxes. We should note, however, that the large negative and positive percentage changes, especially in revenue from the corporate income tax, have an impact on only a rela-tively small number of cities that utilize the tax (see Table 3). As a measure of the degree of reliance constructed cities place on the property tax, we define a diversity index as one minus the share of own-source revenues coming from the property tax. In Figure 3, we illustrate changes in the (population-weighted) average diversity index over the 1997 to 2008 period. Interestingly, after peaking in 2001, average revenue diversity declined dur-ing the several years following the 2001 recession, reflecting the decline in revenue from non-property tax revenue sources and the relative stability of the property tax. While the scale in Fig-ure 2 makes the tax changes appear to be rather large, our diversity index, which provides a summary measure of the reliance on own source revenue sources other than the property tax, was relatively stable over the 1997-2008 period. The average value of the index was 0.596 in 1997 and declined to 0.573 in 2008. The dotted line in Figure 3 shows the weighted average value of the ratio of own-source revenue to total general revenue. The ratio fell until 2002 and rose after 2003. The decline in the impor-tance of own-source revenues in the earlier period reflects the slower rate of growth of own-source revenues relative to intergovernmental revenues. The growth in the importance of own-source revenues after 2003 reflects both the faster growth of tax revenue and the markedly slower growth in intergovernmental revenues to constructed city governments that started in 2003 and continued through 2008.

9
Revenue Diversification and the Financing of Central Cities In this section of the paper, we explore the question of whether central cities that utilize a more diversified mix of revenue sources have higher levels of per capita revenue. Although it is possi-ble that every dollar raised from non-property tax sources could be used to reduce property tax revenues, for several reasons discussed below, we expect per capita general revenues to be higher in central cities that rely on a more highly diversified set of revenue sources. To raise any given level of revenue, the reliance on multiple sources implies that a city can util-ize lower rates of taxation (or fees) on any single revenue base. Because the excess burdens as-sociated with the imposition of taxes rise exponentially as tax rates increase, a more diversified tax system should yield any given amount of revenue at a lower overall excess burden. The po-litical analogue to the excess burden argument is that a more diversified tax system reduces voter resistance to higher levels of taxation. Cities with high expenditure needs, due to factors such as higher costs of living, poverty or crime rates, are likely to diversify their revenue sources more than cities with average or below average needs. Because of the long-standing unpopularity of the property tax, both state and local governments have pursued policies designed to reduce property tax payments by various groups of taxpayers defined by income level, demographic characteristics (e.g., the elderly), type of business, or even geographic areas within cities. In many states, circuit breakers or other forms of property tax abatements, deductions, or credits provide targeted property tax relief to the elderly and to low-income households (Bowman et al. 2009). Within cities, geographically targeted property tax relief may reflect deliberate economic devel-opment policies, for example tax abatements for new construction in “enterprise” or other tar-geted parts of the city. Alternatively, spatially differentiated property tax burdens may arise from property tax assessment procedures that implicitly or explicitly favor particular groups or neigh-borhoods (Engle, 1975; Edelstein, 1981). In New York City, for example, owners of single-family homes receive property tax breaks not available to residents of multi-family dwellings (New York City Independent Budget Office, 2006). A consequence of these tax relief policies is that local governments raise less revenue from the property tax at any given tax rate. The reve-nue yield of the property tax is further diminished because property owned by non-profit organi-zations and governments are exempt from property taxation. This is especially the case in central cities, which generally have large concentrations of these tax-exempt properties (Kenyon and Langley, 2010). One mechanism for city governments to address erosion in the property tax base is to add sales and/or income taxes and user fees or licenses to its portfolio of revenue in-struments. Regression Model and Variables In order to explain the relationship between revenue diversity and the revenues of central cities, we estimate a regression model for our sample of constructed cities for each year over the 1997-2008 period. In those cities with coterminous dependent school districts and no overlapping county (e.g., New York City and Boston), revenue levels reflect the fiscal choices of a single po-

10
litical unit, albeit constrained by state rules. In those cases where school districts are independ-ent, or where counties play a role in providing services to city residents, decisions about reve-nues and tax levels reflect the fiscal choices of multiple units of government, each drawing on the same tax base within city boundaries. The general form of the regression model we estimate is displayed in equation (1).7 The depend-ent variable (REV) is defined as per capita general revenues for each constructed city. The inde-pendent variables are defined below. All dollar variables are in nominal prices, with year dum-mies used to account for inflation in government revenues over the 12 year period. REV = a0 + a1(REV DIVER) + a2(STATE AID) a3(HHINC) + a4(SHR EMPLOY) + a5(POVERTY) + a6(REV SHR) + a7(INC DISTR) + a8(PCT DEM) + a9(ST FISC CHAR) + a10(REGION) + error term (1)
REV DIVER: We define revenue diversification as the percentage share of own-source revenue which comes from sources other than the property tax. A value of zero for REV DIVER would imply that a city’s sole source of own-source revenue was the property tax. Conversely, a city that raised no revenue from the property tax would have a REV DIVER value of 100 per-cent. Revenue diversification can arise because of tax diversification or because of a heavy reli-ance on non-tax revenue sources such as user fees, licenses, and miscellaneous revenues. As shown in Table 6, average revenue diversification was 59 percent. In 2008, Springfield, Massachusetts was more reliant on the property tax than any other constructed city, with a REV DIVER value of 17 percent. The city least reliant on the property tax was Mobile Alabama, with a REV DIVER value of 86 percent. Diversity is lowest in the northeast region of the country, with an average of REV DIVER value of 50 percent, and highest in the west, with an average value of 64 percent. These differences reflect an historical pattern of greater reliance on the property tax in the northeast. Larger cities also tend to be more diversified in terms of revenue than smaller cities.
STATE AID: State aid (measured in per capita terms) includes both aid to education and
aid in support of municipal and county functions. There is a large empirical literature that finds evidence of positive grant elasticities. Thus we expect STATE AID to have a positive effect on per capita general revenues.
HHINC: This variable measures average household income and provides a measure of city fiscal capacity. It is expected to have a positive effect on per capita revenues.
SHR EMPLOY: This variable is calculated as employment divided by population. It pro-vides another measure of city fiscal capacity and is also expected to have a positive effect on per capita revenues.
POVERTY: This variable is the official poverty rate for individuals. Higher poverty rates are expected to result in higher costs of providing public services, and thus we expect a positive sign on the POVERTY variable (Ladd and Yinger, 1989; Pack, 1998)
REV SHR: This variable provides a measure of the extent to which revenues used to pro-vide services to city residents are raised by counties and non-overlapping school districts (e.g., districts serving parts of the central city and parts of adjacent municipalities). It is defined as the 7 Year and city subscripts are suppressed.

11
as the share of total constructed city general revenues which are provided by the overlying county or school district(s).8 The values of REV SHR range from zero in 22 cities that do not have any revenues from overlapping governments, to 83 percent in Hialeah, Florida. The revenue sharing variable is a measure of jurisdictional assignment, rather than an indication of the ability of a city to obtain fiscal resources from non-residents. If there is no fiscal illusion, and the effective tax price is accurately perceived by all residents, regardless of the jurisdiction providing the service, then REV SHR would have a positive effect on revenues only if it lowered the tax price for city residents. This would be the case if the overlapping jurisdiction(s) had a greater per resident fiscal capacity capita than the city. If fiscal illusion is important, then dividing fiscal responsibility among multiple governmental units may lead taxpayers to understate the real tax price of a given bundle of services. This bias could lead to higher revenues, even in the absence of implicit fiscal transfers from counties or school districts. Measures of the spatial flow of taxes and benefits across jurisdictional lines are not available. While city residents may benefit more from county hospitals, for example, than non city resi-dents, such flows cannot be incorporated in any systematic manner into the revenue sharing data. Instead, revenues from overlapping jurisdictions were allocated to city residents on a simple per capita basis. Thus if a city comprises one-third of the population of its county, it is assigned one-third of the revenues of the county.
INC DISTR: As a measure of income distribution, we calculate the ratio of the mean to the median household income. Using the standard median voter model, the higher this ratio, the lower the tax price facing the median voter, and the higher the level of public services demanded. Corcoran and Evans (2010) find some evidence supporting this proposition for school districts, as do Boustan et al. (2010) for all local governments. PCT DEM: This variable measures the percentage point difference between each county’s vote for the Democratic presidential candidate minus the national average in 1996, 2000, 2004, and 2008. It is included as a measure of preference for public expenditures. ST FISCAL CHAR: Constructed city revenues may also be affected by statewide fiscal characteristics. We include three variables. The first is LOCAL SHR, which is calculated as to-tal local government general revenues in the state as a percent of state plus local general reve-nues. The greater the extent to which a state relies on local versus state finance, the higher are expected local revenues for all jurisdictions in the state. The second is PTAX LIM, a dummy variable for the presence of a statewide property tax limit, which may act as a constraint on prop-erty tax revenues (Anderson 2006). The third is SPEC DISTR REV SHR, which is used to take account for differences across states in the importance of special districts, whose revenues are not included in our analysis. It is defined as the statewide total of revenues from special districts as a share of local government general revenue. While special districts are growing in overall importance in local government finance, they remain heavily concentrated in only a few states. (Mullin, 2009) Hence, the statewide measure used should be an adequate control. It is expected
8 See appendix for a breakdown of the number of cities served by different types of school districts.

12
that in states that rely more heavily on special districts, constructed cities will have lower general revenues. Data and Estimation Table 6 provides descriptive statistics for the variables used in the estimation of equation (1), and appendix 2 lists data sources. The model is estimated using ordinary least squares, with a pooled cross section of 109 constructed cities over 12 years, from 1997 to 2008. For all years not end-ing in “2” or “7” the Census Bureau only surveys local governments, but fortunately almost all cities, counties, and school districts in our sample have data for all years. However, there are eight constructed cities with data missing for at least one year, for a total of eleven missing ob-servations. Thus the sample has 1297 observations. While the models include year and region indicators, they do not include city fixed effects. The models are able to explain a very high pro-portion of the variance in city revenues, implying that unobserved factors associated with indi-vidual cities are relatively unimportant. Results
Table 7 shows the results for the estimation of equation (1). We report five different specifications, all of which include revenue diversification, state aid, revenue sharing, the state-wide local government share, and regional dummies. Each of the first four specifications adds additional variables. We focus on the fourth specification because it includes the fullest set of explanatory variables. For comparison, in column (5) we present a specification that includes city fixed effects. Revenue diversification has a positive and significant effect in all regressions, with a coefficient centered around 24 in the first four specifications. At the mean, this coefficient implies that a one standard deviation increase in revenue diversification (13 percentage points) is associated with a 7.2 percent increase in general revenue ($312). From the 25th percentile of revenue diversifica-tion to the 75th percentile (51% to 69%), the difference in revenue is about 10 percent. Under the fixed effect specification, the effect remains significant, but the magnitude is much smaller. This decrease reflects the fact that the within-city variation in revenue diversification over time is small, and therefore likely to be highly correlated with city fixed effect. Our results support the proposition that a more diversified revenue system allows city areas to raise more revenue. However, while revenue diversification matters, the magnitude of the estimated effect indicates that a large change in revenue structure would be required to have an economically significant impact on the level of revenue. The coefficient on state aid is close to one, implying that for large cities, a dollar of state aid leads to almost an additional dollar of revenue. This result is robust to a wide variety of specifi-cations. The result implies that an additional dollar of greater state aid is additive to local spend-ing, and does not significantly reduce own-source local revenues. In our sample, about 62 percent of state aid is for education. Our estimate of the revenue effect of grants is higher than most estimates of the stimulative effect of education aid. Fisher and Papke (2000) report on a number of older studies which found that the increase in spending per addi-tional dollar of education aid is substantially less than a dollar, for example 30 to 70 cents in one

13
study. More recent studies find that in states subject to court-ordered education finance reform, a higher proportion of the increase in education aid to low-wealth school districts goes for in-creased spending. However, none of the studies find stimulative coefficients as high as the esti-mates in this study. Spending estimates well below one imply that a substantial proportion of the marginal dollar of education aid goes either for tax reduction or leaks out into other parts of the budget. The em-phasis in the school finance literature has been on the tax reduction effects. Because ours is the first national study to create a comprehensive measure of revenue raised by all overlapping juris-dictions, we are better able to capture potential leakages than previous studies. Our larger stimu-lative estimate suggests that, while education aid may stimulate education spending at a rate less than dollar for dollar, at least in big cities the local school district resources that are released by state aid are used mainly to support increased spending in other functions and/or other govern-mental units, rather than for tax cuts. This is an important finding. In our discussion of the remaining variables, we will focus on specification (4). EMPLOY SHR has a significant positive effect on revenue raised. A one standard deviation increase in EMPLOY SHR, the employment to population ratio, would be equal to a five percentage point increase in the employment share. Such an increase would raise revenues by five percent. HHINC, while significant in some of the regressions, is not as robust as the EMPLOY SHR vari-able. Overall, the results are suggestive of the magnitude of fiscal pressure faced by cities during the 2008 to 2010 period, as the national average employment ratio has declined about 4 percent-age points and household median income has remained stagnant or declined REV SHR was not statistically significant. This suggests that constructed cities whose overlap-ping jurisdictions played a greater role in financing services did not generate greater revenues than cities that relied more on their municipal government. INC DISTR, a measure of inequality defined as the ratio of average to median household in-come, has a robust positive effect on revenues. Evaluated at the mean, a one standard deviation increase in income inequality raises revenue by between five and ten percent. This result could reflect local tax systems which are structured to capture proportionally more revenue from high income households.9 Our data suggest, however, little or no correlation between income inequal-ity and reliance on particular types of taxes. Hence, we interpret the inequality result as reflecting a lower tax price faced by the median voter in more unequal cities raising demand for public spending and increasing revenue. Finally, we briefly mention some other results. LOCAL SHR is consistently positive and statisti-cally significant. A one standard deviation increase in the local share of total state and local revenues increases city revenues by at most about five percent. PCT DEM is also positive and statistically significant. Both statewide property tax limits (PTAX LIM) and special districts (SPEC DISTR) have the expected negative signs.
9 For example, New York City has a high degree of income inequality – the mean to median ratio is in the 80th per-centile of inequality – and a local income tax with some modest degree of progressivity. An increase in the income of top-income households would therefore generate proportionally more revenue.

14
Under the fixed effect specification a number of the explanatory variables have the same sign, but are smaller in magnitude, while others change sign. For example, EMPLOY SHR and INC DISTR are about one-sixth of their magnitudes in the specifications without city fixed effects. Both POVERTY and HHINC go from positive to negative. These changes under the fixed effect specification are primarily a reflection of the limited intra-city variation in the data. Many of these variables were available for only two years within our sample period, and therefore we were forced to interpolate for missing years. Vertical Tax Competition between States and Cities When two levels of government share the same tax base, they are in implicit competition for the same fiscal resource base. Vertical competition exists when tax rates at one level affect tax reve-nues at the other level. Vertical tax competition is typically viewed in a downward direction, with the more encompassing government enacting a set of tax rates (e.g., states), and subordinate governments reacting to those tax rates (e.g., cities). However, lower level governments may also affect the higher level base and rates, particularly if the lower level government is large relative to the higher level. The negative consequences of vertical tax base sharing result from the interdependence of the shared tax base. If the external effect on the tax base at other levels is not taken into account by voters in deciding on tax rates, the cumulative rate of taxation in the federation may be greater than optimal (Boadway and Tremblay, 2005; Dahlby, 1996). However, the sharing of tax bases – referred to as vertical tax harmonization – may also offer advantages in tax administration and compliance costs. The higher level of government can serve as an efficient tax collector, remit-ting the local share to the lower level government. Vertical harmonization of taxes through shared bases also provides a politically feasible way for multi-level fiscal systems to adjust the relative roles of national and sub-national financing as circumstances change. For example, Can-ada has at several points implemented an explicit exchange in taxing capacity between the na-tional government and the provinces. Revenue diversification at the local level is constrained by the potential for vertical tax competi-tion. The main source of local finance is the property tax, which is almost exclusively a local tax. The more cities diversify tax revenue sources away from the property tax, the greater the poten-tial for vertical tax competition. As cities add income, sales and excise taxes, competition with state taxes on these bases becomes more important. To limit this competition, state constitutions grant states substantial power over local revenue options. In most states, a majority vote in both houses of the state legislature is needed before local governments are allowed to adopt new taxes or increase local tax rates (with the exception of the property tax). Over the past thirty years, even the ability of local jurisdictions to control the property tax has been increasingly restricted by tax and expenditure limitations.10
10 As of 2006, 43 states had such restrictions, though they vary substantially in the effective constraints imposed on local property taxation (Anderson, 2006).

15
The empirical literature on vertical tax competition has looked primarily at fiscal relationships between national and provincial (state) levels of government. Studies for Canada and the U.S. have tended to find complementary relationships between effective national and provincial tax rates (Hiyashi and Boadway, 2001; Esteller-Moré and Solé-Ollé, 2001, 2002). By contrast, Chernick and Tennant (2010) find that for the income tax, the average rate at the state level is independent of the average federal rate, while higher federal tax rates on high income taxpayers are offset by lower state income tax rates on the same income group. There has been little or no work on fiscal competition between states and their cities. In the next section, we present esti-mates of vertical tax relationships for state and local sales taxation. Estimates of Vertical Tax Relationships for the Sales Tax To study vertical tax competition, we focus on the sales tax, which is the tax most commonly shared between states and local governments. Following the convention in the literature, we es-timate a model which makes local sales tax revenues a function of state sales tax rates. The re-gression model is presented in equation (2): REV SALES = a0 + a1(SLSTX RATE) + a2(STATE AID) + a3(REV PROP) + a4CONTROLS + error term (2) REV SALES is per capita sales tax revenues for constructed cities. Independent variables in-clude SLSTX RATE, the state general sales tax rate, STATE AID, as defined in equation (1), and REV PROP, defined as per capita property tax revenues for constructed cities. A negative coefficient on the state sales tax rate would imply substitution between states and cities use of the sales tax, while a positive coefficient would imply complementarity. The control variables are the same as in equation (1). Equation (2) is estimated for the 1,067 observations in our sample with constructed city sales tax revenues of $10 or more. Of 109 constructed cities, 86 collected sales taxes in all years, 18 had $0 sales taxes in all years, and 5 had sales tax revenue exceeding $10 in some years.11 Results for the sales tax model are presented in Table 8. The state sales tax rate has a significant negative effect on local sales tax revenues, implying an implicit exchange of tax burdens be-tween a state and its cities. Constructed city sales tax collections rise with a lower state sales tax rate primarily because the state allows cities to impose a higher local rate. In 2008, the average state sales tax rate for states with a sales tax was 5.4 percent. The coefficient estimate for the state rate centers on a value of -$90. Thus a percentage point increase in the state rate decreases local collections by approximately $90 per capita. A one percentage point increase in the state sales tax rate represents approximately a standard deviation change from the national average. With local sales tax revenues equal to $258 per capita, the decline from a one percentage point increase in the state rate would equal 31 percent of local sales tax revenues.
11 Only one observation has sales tax revenue between $0 and $10 (Columbus, GA in FY2004). Five have sales tax revenue exceeding $10 in some years: Pittsburgh, PA (Sales tax revenue for 1998-2008); Des Moines, IA (2001-2008); Minneapolis, MN (2004-2008); Nashville, TN (1997-2001 and 2005-2008); Columbus, GA (1997-2003 and 2005-2008).

16
In 2008, state sales taxes were equal to $793 per capita, or $162 for each percentage point of sales tax rate. Thus, a decline of one sales tax point would equal roughly $147 per capita.12 Put another way, on average a $1 increase in constructed government sales tax revenues is asso-ciated with a $1.63 decrease in state sales tax revenues. The loss in state sales tax revenues ex-ceeds the gain in local revenue because the state tax applies to all residents of the state, while the local tax is authorized and used only in selected local jurisdictions. While 91 of 109 constructed governments in our sample collected local sales taxes during the 1997-2008 period, many smaller jurisdictions are not permitted to use the local sales tax. While in principle a state could authorize local sales taxation in selected jurisdictions without reducing its own tax rate, the re-gression result indicates that states are in fact constrained in total state plus local sales tax rates. Hence, the revenue loss to the state from a decrease in its own sales tax rate will be only partially compensated for by an increase in local revenues. Other results from Table 8 may be briefly mentioned. Cities appear to trade off other sources of revenue against the local sales tax. This result may reflect the fact that states that give higher lev-els of state aid may force cities to reduce, or not raise, their rates of sales taxation. An additional $100 of state aid leads to a $5 to $10 reduction in sales tax revenue, while $100 more in property tax revenue is associated with $6 to $12 loss in sales tax revenue. The magnitude of the sales tax adjustments is consistent with the strong state aid effect identified in the level analysis. While more state aid is associated with a small reduction in local sales tax revenues, this reduction is offset by an increase in property taxes. Finally, it is notable that the income distribution variable, average income divided by median in-come, has a negative effect on sales tax revenues. This stands in contrast to the strong positive effect of the income distribution on total revenue, as discussed above. Whereas a one standard deviation increase in income inequality raises total revenues by 7 percent, such an increase low-ers revenue from the sales tax by about 17 percent. Conclusion The financing of American cities is characterized by a wide variety of institutional arrangements. Such variation is perhaps not surprising, given the size of the country and the differences in size, history, age, physical geography and economic functions of cities in different regions of the country. While a few cities are responsible for the financing of most or all public services pro-vided to city residents, in most cities fiscal responsibility is divided between cities, counties, and school districts. Because of these differences, revenues and expenditures of city governments alone cannot provide the basis for meaningful fiscal comparisons. In this paper, we take explicit account of this institutional and fiscal diversity, by assigning to cities a share of revenues from overlying counties and independent school districts, based on population and student enrollment shares. Thus, we are in effect measuring total revenues raised per city resident. To our knowl-edge, no other study has made such systematic adjustments for a national sample of large cities.
12 The calculation is as follows: Per capita Average Sales Tax Base = Sales tax revenue/sales tax rate = $793/.054 = $14,685. Hence, a one percentage point change in the sales tax rate implies a change in revenues equal to .01 X $14,685 = $147. The ratio of lost state revenue to increased local revenue is 147/90 = 1.63.

17
An analysis of “constructed” government revenues for 109 central cities shows that there is sub-stantially greater uniformity in revenues, and presumably in service levels, than would be sug-gested by a comparison of municipal central city governments only. Nonetheless, even after standardizing for the role of counties and school districts, we find that central cities in the north-east have substantially higher revenues per capita than cities in the rest of the country. In almost all cities, the most important local revenue source is the property tax. However, cities and their overlapping counties and school districts vary substantially in their use of other taxes and fees and charges. The principle hypothesis investigated in this paper is that a more diverse revenue structure, i.e. one that is less reliant on the property tax, allows a city to raise more reve-nue. Our empirical results provide strong support for the hypothesis that a more diversified reve-nue structure generates more revenues than one which relies primarily on the property tax. Over a twelve year period, and controlling for other variables which are likely to influence revenue levels, revenues in a relatively diversified city (at the 75th percentile of diversity) are about 10 percent higher than in a city at the 25th percentile. A fundamental constraint on revenue diversification (away from the property tax) is that in-creased reliance on sales, income, and excise taxes is likely to bring cities into greater competi-tion with their states for tax revenues from shared tax bases. To explore vertical tax competition, we examine the relationship between state and local revenues for the most important shared tax for U.S. cities, the general sales tax. We find that state and local sales taxes substitute for each other, with higher state tax rates associated with lower local sales tax revenues. On average, a $1 increase in constructed government sales tax revenues is associated with a $1.63 decrease in state sales tax revenues. This suggests a potentially high cost to states of encouraging local revenue sufficiency for their cities through revenue diversification. By contrast, another result from our research is that state aid to constructed governments is highly stimulative, with a dollar of state aid leading to an increase in total revenue of almost a dollar. The Great Recession poses stark fiscal challenges for local government in the United States. Be-tween September 2009 and September 2010, there has been a 1½ percent decrease in local gov-ernment employment, with a drop of 76,000 local government jobs between August and Septem-ber 2010 alone (Bureau of Labor Statistics, 2010). This employment decline is consistent with the strong contemporaneous relationship between economic capacity and city revenues shown by our statistical analysis. While our results demonstrate that a more diversified revenue structure supports higher revenues over the long run, an important policy question is whether diversification will help cities to main-tain revenues and service levels in the current recession. To address this issue, we have examined the stability over the 1997-2008 period in the various components of constructed city general revenues, and the relationship between city-specific variation in revenues and their revenue di-versification. The aggregate analysis, shown in Figure 2, indicates that the property tax is by far the most stable of taxes used by cities. This fact suggests that revenues would be more stable over time in less diversified cities. However, we were unable to uncover any difference in reve-nue stability as a function of revenue diversity. The absence of an observable relationship be-tween revenue stability and revenue diversity among our sample of constructed central cities

18
may reflect the fact that our sample period includes only a single economic downturn, namely the mild recession in 2001. While that recession led to declines in income and sales tax revenues, it was coincident with a strong sustained boom in real estate values. By contrast, the current recession, marked by a sharp drop in housing values, is likely to put in-creasing pressure on local property tax revenues over the near term. Even as state and local in-come and sales taxes exhibit some rebound in 2010 (Rockefeller Institute, 2010), property tax revenues are likely to fall as assessed values gradually adjust to reflect changes in market value. Hence, though in the past property taxes have been the most stable source of tax revenues for local governments, we expect that in the aftermath of the Great Recession, cities that have expe-rienced significant declines in property values are likely to face greater revenue pressure if they have a heavier reliance on the property tax than if they have a more balanced portfolio of taxes and fees. Because of lags in the availability of Census of Government data, it will be at least two years un-til it is possible to test this stability proposition using contemporaneous data. Rather than waiting several years, we intend to go backward in time, compiling constructed revenue data for our sample of cities for the years back to the late 1970s. By including several economic downturns in our analysis, we should deepen our understanding of the relationship between revenue diversity and revenue stability. The ultimate goal is to enable us to provide policy guidance to cities and states as they consider the most effective ways to maintain vital city services over time.

19

20

21
22

23

24

25

26
Note: The diversity index is defines as 1 – (property tax revenue/own-source revenue). Average values are weighted by population.

27
Note: See appendix for information about data sources.

28

29

30
Appendix 1: Background Information about 109 Constructed Governments (FY2008) Number of Cities by Fiscal Arrangements Has Overlying County No Overlying County Total City-dependent school district 6 12 18 1 Independent school district whose boundary is coterminous with city boundaries
10 8 18
1+ Independent school districts whose boundaries extend beyond city boundaries
54 2 56
County-wide independent school district 11 0 11 County-dependent school district 6 0 6
Total 87 22 109 Unweighted Average of City Per Capita General Revenues (Top) and Constructed Gov-ernment Per Capita General Revenues (Bottom) Has Overlying County No Overlying County Total City-dependent school district 4,225
6,215 4,783 4,783
4,597 5,260
1 Independent school district whose boundary is coterminous with city boundaries
2,194 4,964
3,606 5,120
2,821 5,033
1+ Independent school districts whose boundaries extend beyond city boundaries
1,729 4,415
2,895 4,671
1,770 4,424
County-wide independent school district 1,792 5,061
1,792 5,061
County-dependent school district 1,760 4,457
1,760 4,457
Total 1,964 4,687
4,184 4,895
2,412 4,729

31
Appendix 2: Data Sources The Census of Governments and the Annual Surveys of State and Local Government Finances provides data for cities, counties, and independent school districts for the following variables:
• General revenues, property taxes, sales taxes, own source revenues, state aid, statewide special district revenues, statewide local government revenues, state government general revenues, and population.
Census data compiled in the City and County Data Book (2000 and 2007) and from American Fact Finder on the following variables:
• Average household income (city), poverty rate (city), employment, median household in-come (city and county)
Dave Leip’s Atlas of Presidential Elections was used for data on county vote for President. http://www.uselectionatlas.org/ Anderson (2006) was used for data on state property tax limitations. A state is considered to have a binding property tax limit if it limits tax levies, or tax rates and assessments. John Mikesell provided data on state sales tax rates for all years. Data for economic and demographic variables were interpolated, because data were not available in all years. Data on city and county population were available for 1996, 1998, 2000, 2002, 2005, 2007, and 2008. Data on counties’ vote for President was collected for 1996, 2000, 2004, and 2008. A simple linear line was used to interpolate population and Presidential vote estimates for the other years in the sample. Data for all other economic and demographic variables was only collected for two years, gener-ally 1999/2000 and 2005, and the interpolation was done in two steps. First, a linear line was fitted for each city using the two years of available data. Second, this linear line was adjusted to reflect national trends. This was done by calculating a weighted average of the variable for the cities in the sample, using national data to calculate the ratio of the variable in the given year and the year when data is available for all cities, and then calculating a target weighted average for the cities in the sample by assuming all cities in the sample have the same ratio as that calculated with national data. Then an adjustment factor was calculated for each year equal to the target weighted average divided by the weighted average from the initial linear interpolation. Finally, this adjustment factor was multiplied by the initial linear estimate for each city, which results in interpolated data that allows for city-by-city variation but also reflects national trends. Sources for national data: Household Income (U.S. Census Historical Income Tables H-6) http://www.census.gov/hhes/www/income/data/historical/household/index.html Poverty Rate [Poverty in the United States (1997, 1998, 1999, 2000, 2001) and Income, Poverty,
and Health Insurance Coverage in the United States (2003, 2004, 2006, 2008)] 2008: http://www.census.gov/prod/2009pubs/p60-236.pdf
Nonfarm Employment (Bureau of Labor Statistics’ Current Employment Statistics Survey Annual data calculated using simple average of monthly data. http://data.bls.gov/cgi-bin/surveymost?ce

32
References Anderson, Nathan B. 2006. ‘‘Property Tax Limitations: An Interpretive Review,’’ National Tax Journal 59, no. 3 (September): 685-694. Boadway, Robin, and Jean-François Tremblay. 2005. “A Theory of Fiscal Imbalance.” Working paper, Queen’s University, Kingston, Ont. Boustan, Leah, Fernando Ferreira, Hernan Winkler, and Eric Zolt. 2010. “Income Inequality and Local Government in the U.S., 1970-2000.” National Bureau of Economic Research Working Paper # 16299, August. Bowman, John H. and John L. Mikesell. 1978. “Revenue Diversification Within Metropolitan Areas: Effects on Disparities an Central City-Suburban Fiscal Relationships,” The Review of Economic Studies 8, No. 3, (Winter): 66-77. Bowman, John H., Daphne A. Kenyon, Adam Langley, and Bethany P. Paquin. 2009. Property Tax Circuit Breakers; Fair and Cost-Effective Relief for Taxpayers, Policy Focus Report, Cam-bridge, MA: Lincoln Institute of Land Policy. Bureau of Labor Statistics. 2010. “Employment, Seasonally Adjusted.” Table B-3. Available at ftp://ftp.bls.gov/pub/suppl/empsit.ceseeb3.txt Carroll, Deborah A. 2009. “Diversifying Municipal Government Revenue Structures: Fiscal Illu-sion or Instability?”, Public Budgeting & Finance 29, No. 1 (Spring): 27-48. Chernick, Howard and Jennifer Tennant. 2010. “Federal-State Tax Interactions in the U.S. and Canada.” Publius: The Journal of Federalism 40, No. 3, (Summer): 508-533. Ciconne, Antonio and Robert E. Hall. 1996. “Productivity and the Density of Economic Activ-ity,” American Economic Review 86, no. 1, (March): 54-70. Corcoran, Sean and William N Evans. 2010. “Income Inequality, the Median Voter, and the Support for Public Education,” NBER Working Paper Series, Working Paper 16097, Cambridge, MA: National Bureau of Economic Research, June. Dahlby, Bev. 1996. “Distortionary Taxation and the Design of Intergovernmental Grants,” Inter-national Tax and Public Finance 3, 397-412. Downes, Thomas A. and David N. Figlio. 2008. “Tax and Expenditure Limits, School Finance and School Quality,” in Handboook of Research in Education Finance and Policy, edited by Helen F. Ladd and Edward B. Fiske, New York: Routledge. Dye, Richard F. and Andrew Reschovsky. 2008. “Property Tax Responses to State Aid Cuts in the Recent Fiscal Crisis,” Public Budgeting & Finance (Summer): 213-237.

33
Edelstein, Robert H. 1981. “Regressivity and the Inequity of the Residential Property Tax: The Philadelphia Story,” in Research in Urban Economics, volume 1, edited by Mark Allen Hugh and Therese J. McGuire, Greenwich, CN, JAI Press: 219-247. Engle Robert F. 1975. “De Facto Discrimination in Residential Assessments: Boston,” National Tax Journal 28, no. 4, (December): 445-451. Esteller-Moré, Alex and Albert Solé-Ollé. 2001. “Vertical Income Tax Externalities and Fiscal Interdependence: Evidence from the U.S.,” Regional Science and Urban Economics 31(April): 247-272. Esteller-Moré, Alex and Albert Solé-Ollé. 2002. “Tax Setting in a Federal System: The Case of Personal Income Taxation in Canada,” International Tax and Public Finance 9:235–257. Fisher, Ronald C. and Leslie E. Papke. 2000. “Local Government Responses to Education Grants,” National Tax Journal 53, No. 1 (March): 153-168. Gabler, L.R. 1975. “A Recondisertion of Local Sales and Income Taxes,” Proceedings of the Sixty-Seventh Annual Conference on Taxation, National Tax Association-Tax Institute of Amer-ica, Columbus, Ohio: 281-288. Haughwout, Andrew and Robert P. Inman. 2002. “Should Suburbs Help Their Central City?” Brookings Wharton Papers on Urban Affairs : 45-94. Hiyashi, Masayoshi and Robin Boadway. 2001. “An Empirical Analysis of Intergovernmental Tax Interactions: The Case of Business Income Taxes in Canada.” Canadian Journal of Econom-ics 34 (May): 481-503. Hoene, Christopher W. and Michael A. Pagano. 2010. City Fiscal Conditions in 2010, Research Brief on America’s Cities, Washington, DC: The National League of Cities, October. Inman, Robert. 1979. “Subsidies, Regulation, and Taxation of Property in Large U.S. Cities.” National Tax Journal. June. Johnson, Nicholas. 2003. “Despite Major Spending Cuts and Tax Increases, States are Likely to Face Large Deficits for Next Year,” Washington, DC: Center on Budget and Policy Priorities, October. Available at www.cbpp.org/10-22-03sfp.htm. Kenyon, Daphne and Adam Langley. 2010. Payments in Lieu of Taxes: Balancing Municipal and Nonprofit Interests. Cambridge, MA: Lincoln Institute of Land Policy. Ladd, Helen F. and John Yinger. 1989. America’s Ailing Cities: Fiscal Health and the Design of Urban Policy, Baltimore: The Johns Hopkins University Press.

34
Mullin, Megan. 2009. Governing the Tap: Special District Governance and the New Local Poli-tics of Water. Cambridge, MA: MIT Press. New York City Independent Budget Office. 2006. “Twenty Five Years After S7000A: How Property Tax Burdens Have Shifted in NYC.” August. Available at www.ibo.nyc.ny.us/iboreports/propertytax120506.pdf, Oates, Wallace E. and Robert M. Schwab. 2004. “What Should Local Governments Tax: Income or Property?’" in City Taxes, City Spending: Essays in Honor of Dick Netzer, edited by Amy El-len Schwartz, Northampton, MA: Edward Elgar Publishing, 2004: 7-29. Pack, Janet R. 1998. "Poverty and Urban Public Expenditures." Urban Studies 35. Reischauer, Robert D. 1975. “In Defense of the Property Tax: The Case Against an Increased Reliance on Local Non-Property Taxes,” Proceedings of the Sixty-Seventh Annual Conference on Taxation, National Tax Association-Tax Institute of America, Columbus, Ohio: 288-306. Reschovsky, Andrew. 2004. “The Impact of State Government Fiscal Crises on Local Govern-ments and Schools,” State and Local Government Review 36, No. 2, (Spring): 86-102. Rockefeller Institute. 2010. State Revenue Flash Report. August. Available at http://www.rockinst.org/pdf/government_finance/state_revenue_report/2010-08-30-State_Revenue_Flash.pdf Sjoquist, David L., Mary Beth Walker, and Sally Wallace. 2005. “Estimating Differential Re-sponses to Local Fiscal Conditions: A Mixture Model Analysis,” Public Finance Review 33, No. 1, (January): 36-61. U.S. Census Bureau. 1974. Composite Finances in Selected City Areas, A Special Survey Spon-sored by the U.S. Department of Housing and Urban Development, Washington, DC: Govern-ments Division, Bureau of the Census, August. U.S. Census Bureau. 2009. Census of Governments,[selected years], “State and Local Govern-ment Finances by Level of Government and State,” Washington, DC: Census Bureau. Wong, Kenneth K., Francis X. Shen, Dorothea Anagnostopoulos, and Stacey Rutledge. 2007. The Education Mayor; Improving America’s Schools, Washington, DC: Georgetown University Press. Yinger, John, and Helen F. Ladd. 1989. “The Determinants of State Assistance to Central Cities,” National Tax Journal 42 (December): 413-28.