Embed Size (px)
Citation preview

New York StateOil, Gas
and
Mineral Resources1995
Department of Environmental Conservation
Division of Mineral Resources
Annual Report
New York State Department of Environmental ConservationGeorge E. Pataki, Governor Michael D. Zagata, Commissioner

This report was produced by the NYS Department of Environmental ConservationDivision of Mineral Resources50 Wolf RoadAlbany, NY 12233-6500(518) 457-7480
Gregory H. Sovas, Director
Eric B. Shyer, Editor, Graphics, Charts and Maps
Sandra T. Geddes, Production data entryStatistics provided by staff from the Bureau of Oil and Gas Regulation,the Bureau of Resource Management and Development, and the Regional Offices.

New York StateOil, Gas
andMineral Resources
Division Mission Statement
The Division of Mineral Resources is responsible for ensuring theenvironmentally sound, economic development of New York’s non-
renewable energy and mineral resources for the benefit of current andfuture generations.
STATE OF NEW YORKGEORGE E. PATAKI, GOVERNOR
DEPARTMENT OF ENVIRONMENTAL CONSERVATIONMICHAEL D. ZAGATA, COMMISSIONER

New York State Oil, Gas and Mineral Resources, 1995
iiNYSDEC - Division of Mineral Resources Twelfth Annual Report
DIRECTOR’S CORNER Gregory H. Sovas
As I write, the Division is in the midst ofsetting goals and developing workplans for fiscalyear 1997-98. During 1995, Commissioner Zagatabegan introducing changes to the Department’sworkplanning process. We are required todemonstrate progress in our mission, stated on thetitle page, by measuring and reporting monthly to theCommissioner such things as number of wellsplugged and number of mined acres reclaimed. Wewill be expected to increase these measured outputseach year, and our workplans for forthcoming yearswill reflect this expectation. We hope that theregulated community and other stakeholders willsoon see tangible results of the Commissioner’s 1995workplanning initiatives as we strive to deliverfocused, efficient and effective regulatory programs.
Last year I described the effect on ourDivision of the collapse and flooding of Akzo’sRetsof salt mine in March 1994. The consequencesof this event continued to demand attention andresources throughout 1995, as we concentrated notonly on closure and remediation of the Retsof mine,but on permitting of a proposed replacement minenearby. In fact, most of the wells permitted anddrilled in Region 8 during 1995 were stratigraphic ormonitoring wells associated with these two projects.Our Avon manager includes a synopsis of theseactivities in his review on page 12 of this report.
Although oil and gas well completionsdecreased in 1995, the report from our Oleanmanager on pages 13 and 14 reflects recent optimismabout the possibility of successful deep explorationin western New York. Division staff are hopeful thatpotential deep reserves will bring increased activityand economic opportunity, and are ready to helpensure development of any newly discoveredreserves in accordance with good environmentalpractice.
Underground gas storage projects continueto consume great amounts of staff time as we dealwith a number of expansions as well as new projects.Existing projects are summarized on pages 16 and17, and two of the new projects are described in theRegion 8 Review on page 12. Clearly undergroundgas storage will continue to be more important to thesecure and safe distribution of natural gas in NewYork and New England.
One of the biggest challenges facing the oiland gas regulatory program is the growing liability ofidle and abandoned wells. In most cases financialsecurity, even for operators in compliance withcurrent regulations, does not provide sufficientfunding to plug the covered wells. When operators
default on their tax bills and counties foreclose onproperties that contain unplugged wells, those wellsbecome a liability for local taxpayers. This is not ahypothetical worst-case scenario, but reflect currentevents already happening in the counties. We needa creative approach to develop new solutions to thisproblem, and hope to productively work togetherwith all stakeholders in this effort.
Annual well reports are the primary toolused by the Division for tracking compliance. Todate, only 76% of operators required to report for1995 have done so; the statutory deadline forreporting was March 31, 1996. We have strivedduring recent years to make reporting easier, yet thelack of full compliance forces us to continue todevote resources to enforcement. In our smallDivision, these resources could be better spent onother projects. I strongly urge all operators to allowus to redeploy these resources by submitting timely,accurate reports for all unplugged active and inactivewells.
Beginning in late 1995, the Division hasbenefitted from the Commissioner’s emphasis onimproving computerized information managementand communication capabilities within theDepartment. A major Department-wide computerpurchase has allowed us to increase employee accessto the wide array of electonic tools available,including Internet e-mail and a local area networkwithin the Department. In fact, some Division e-mailaddresses are listed on page 21. We hope to postinformation from our Division’s database on a WorldWide Web page now being developed by theDepartment. Permitting and other information fromour database is currently available at the InterstateOil and Gas Compact Commission’s web page(http://www.iogcc.oklaosf.state.ok.us). We continueto improve both the amount and quality ofinformation in our database, which now includesover 32,000 wells. Most of this information isavailable to the public; simply contact or visit any ofour offices.
We hope that you have seen tangible resultsfrom the Commissioner’s initiatives in making theDepartment more customer friendly. We at theDivision of Mineral Resources are always willingand ready to help any operator, local government, orlandowner deal with the issues facing the industryand our partners, local governments.

New York State Oil, Gas and Mineral Resources, 1995
NYSDEC - Division of Mineral Resources Twelfth Annual Reportiii
EXECUTIVE SUMMARY
New York State Oil, Gas and Mineral Resources - 1995 is the twelfth annual report published by theDepartment of Environmental Conservation’s Division of Mineral Resources. The report is expanded togive a more comprehensive summary of New York's oil and gas production and extractive mineral resources.
Other topics covered in this year's report are solution salt mining, brine disposal, liquefied petroleumgas, underground gas storage and surficial mining. Also included are tables of wells permitted in 1995 andproduction data. At the time of publication 76 percent of the registered operators, or 680 of 887, had filedrequired Annual Well Reports.
Oil and Gas Highlights
L Reported production of natural gasdeclined approximately 8 percent to18.7 BCF compared with 1994's reportedproduction of 20.4 BCF.
L Production of oil was 303,780 barrels, anincrease of 1.6 percent from 1994.
L Weighted average wellhead pricespaid in 1995 were $2.30 per thousandcubic feet of gas and $16.29 per barrelof oil.
L Twenty-two stratigraphic wells werecompleted in conjunction with theinvestigation of a mine collapse inLivingston County.
L New York operators spudded 111wells during 1995, a decrease of 22wells from 1994.
L Reported oil and gas productiongenerated an estimated $1.44 million inreal property tax revenues.
L Total State revenues from permits andleasing of State lands were $236,710in 1995.
L Oil and Gas staff performed 2,221inspections and traveled 62,890 milesduring 1995.
L The Division collected $11,500 inassessed fines and penalties under theOil, Gas and Solution Mining Law.
L Gas well completions decreased 66percent to 31 wells completed while oilwell completions decreased 41 percentto 20 wells completed.
L Market value of reported oil and gas wasan estimated $48 million. Land ownersreceived approximately $6 million inroyalties.
L Tioga County ranked fourth in gasproduction in the state with only 9 gaswells.
.Mineral Highlights
L In 1995 the Division regulated 2,560surface mines encompassing 39,150acres.
L Mined Land staff issued 342 permits, 130new and 212 renewals during 1995.
L Estimated value of the minerals mined inNew York State during 1995 was $1.5billion.
L Mined Land staff in 1995 approved thereclamation of 2,095 acres of affectedland.

New York State Oil, Gas and Mineral Resources, 1995
NYSDEC - Division of Mineral Resources Twelfth Annual Reportiv
New York State Oil, Gas and Mineral Resources, 1995
NYSDEC - Division of Mineral Resources Twelfth Annual Reportv
TABLE OF CONTENTS
Articles
Director's Corner . . . . . . . . . . . . . . . . . . . . . . . . . . . . . . . . . . . . . . . . . . . . . . . . . . . . . . . . . . . . . . . . . . iiExecutive Summary . . . . . . . . . . . . . . . . . . . . . . . . . . . . . . . . . . . . . . . . . . . . . . . . . . . . . . . . . . . . . . . . iiiPermits and Completions . . . . . . . . . . . . . . . . . . . . . . . . . . . . . . . . . . . . . . . . . . . . . . . . . . . . . . . . . . . . 1Production of Oil and Natural Gas . . . . . . . . . . . . . . . . . . . . . . . . . . . . . . . . . . . . . . . . . . . . . . . . . . . . 2Enforcement Options . . . . . . . . . . . . . . . . . . . . . . . . . . . . . . . . . . . . . . . . . . . . . . . . . . . . . . . . . . . . . . . 6Market Value . . . . . . . . . . . . . . . . . . . . . . . . . . . . . . . . . . . . . . . . . . . . . . . . . . . . . . . . . . . . . . . . . . . . 7Oil and Gas Revenues . . . . . . . . . . . . . . . . . . . . . . . . . . . . . . . . . . . . . . . . . . . . . . . . . . . . . . . . . . . . . . 8Solution Salt Mining and Brine Disposal . . . . . . . . . . . . . . . . . . . . . . . . . . . . . . . . . . . . . . . . . . . . . . 10Region 8 Review . . . . . . . . . . . . . . . . . . . . . . . . . . . . . . . . . . . . . . . . . . . . . . . . . . . . . . . . . . . . . . . . . 12Deep Well Drilling in Region 9 . . . . . . . . . . . . . . . . . . . . . . . . . . . . . . . . . . . . . . . . . . . . . . . . . . . . . . 13Underground Gas Storage and Liquefied Petroleum Gas . . . . . . . . . . . . . . . . . . . . . . . . . . . . . . . . . . 16Mined Land Reclamation . . . . . . . . . . . . . . . . . . . . . . . . . . . . . . . . . . . . . . . . . . . . . . . . . . . . . . . . . . . 18E-Mail Addresses . . . . . . . . . . . . . . . . . . . . . . . . . . . . . . . . . . . . . . . . . . . . . . . . . . . . . . . . . . . . . . . . . 21Oil and Gas Tables and Statistics . . . . . . . . . . . . . . . . . . . . . . . . . . . . . . . . . . . . . . . . . . . . . . . . . . . . 22Comments & Opinions . . . . . . . . . . . . . . . . . . . . . . . . . . . . . . . . . . . . . . . . . . . . . . . . . . . . . . . . . . . . . 44
Charts
Drilling Permits Issued vs Completions, 1986 - 1995 . . . . . . . . . . . . . . . . . . . . . . . . . . . . . . . . . . . . . . 1Annual Production of Natural Gas, 1986 - 1995 . . . . . . . . . . . . . . . . . . . . . . . . . . . . . . . . . . . . . . . . . . 3Annual Production of Crude Oil, 1986 - 1995 . . . . . . . . . . . . . . . . . . . . . . . . . . . . . . . . . . . . . . . . . . . . 3Market Value of Oil & Gas Production, 1986 - 1995 . . . . . . . . . . . . . . . . . . . . . . . . . . . . . . . . . . . . . . 7Oil & Gas Property Tax Revenues, 1986 - 1995 . . . . . . . . . . . . . . . . . . . . . . . . . . . . . . . . . . . . . . . . . . 9Stratigraphic Section Southwestern New York . . . . . . . . . . . . . . . . . . . . . . . . . . . . . . . . . . . . . . . . . . 15
Maps
Regional Service Areas . . . . . . . . . . . . . . . . . . . . . . . . . . . . . . . . . . . . . . . . . . . . . . . . . . . . . . . . . . . . . viGas Production by Town . . . . . . . . . . . . . . . . . . . . . . . . . . . . . . . . . . . . . . . . . . . . . . . . . . . . . . . . . . . . 4Oil Production by Town . . . . . . . . . . . . . . . . . . . . . . . . . . . . . . . . . . . . . . . . . . . . . . . . . . . . . . . . . . . . 5Deep Well Location . . . . . . . . . . . . . . . . . . . . . . . . . . . . . . . . . . . . . . . . . . . . . . . . . . . . . . . . . . . . . . . 14Gas Storage, LPG & Brine Fields . . . . . . . . . . . . . . . . . . . . . . . . . . . . . . . . . . . . . . . . . . . . . . . . . . . . 17NYSDEC Regulated Mines . . . . . . . . . . . . . . . . . . . . . . . . . . . . . . . . . . . . . . . . . . . . . . . . . . . . . . . . . 19
Tables
Top Ten Gas Producing Counties, 1995 . . . . . . . . . . . . . . . . . . . . . . . . . . . . . . . . . . . . . . . . . . . . . . . . 2Top Ten Oil and Gas Producing Companies, 1995 . . . . . . . . . . . . . . . . . . . . . . . . . . . . . . . . . . . . . . . . 2Average Wellhead Price of Oil and Gas, 1986 - 1995 . . . . . . . . . . . . . . . . . . . . . . . . . . . . . . . . . . . . . . 7County Leasing Statistics . . . . . . . . . . . . . . . . . . . . . . . . . . . . . . . . . . . . . . . . . . . . . . . . . . . . . . . . . . . . 8Status of Solution Salt Mining in New York, 1995 . . . . . . . . . . . . . . . . . . . . . . . . . . . . . . . . . . . . . . . 10Underground Gas Storage Field Statistics . . . . . . . . . . . . . . . . . . . . . . . . . . . . . . . . . . . . . . . . . . . . . . 16LPG Facilities Summary . . . . . . . . . . . . . . . . . . . . . . . . . . . . . . . . . . . . . . . . . . . . . . . . . . . . . . . . . . . 16Division of Mineral Resources Oil and Gas Statistics, 1986-1995 . . . . . . . . . . . . . . . . . . . . . . . . . . . 23Wildcats, Field Extensions & Stratigraphic Tests, New York, 1995 . . . . . . . . . . . . . . . . . . . . . . . . . 24Permits Issued During 1995 . . . . . . . . . . . . . . . . . . . . . . . . . . . . . . . . . . . . . . . . . . . . . . . . . . . . . . . . 25Oil and Gas Production by Town . . . . . . . . . . . . . . . . . . . . . . . . . . . . . . . . . . . . . . . . . . . . . . . . . . . . 28Oil and Gas Production by Field . . . . . . . . . . . . . . . . . . . . . . . . . . . . . . . . . . . . . . . . . . . . . . . . . . . . . 34Oil and Gas Production by Formation . . . . . . . . . . . . . . . . . . . . . . . . . . . . . . . . . . . . . . . . . . . . . . . . 40


New York State Oil, Gas and Mineral Resources, 1995
NYSDEC - Division of Mineral Resources Twelfth Annual Report1
PERMITS & COMPLETIONS Eric B. Shyer
86 87 88 89 90 91 92 93 94 95100
150
200
250
300
350 Number of PermitsNumber of Completions
Year
Drilling permits issued vs completions in New York State,1986 - 1995.
Permitting
Division staff issued 125 drilling permitsin 1995: 38 gas well permits, 35 oil well permits,19 stratigraphic well permits, 12 brine well permits,12 reissued well permits, 7 gas storage, 1 waterinjection and 1 brine disposal well permit. Permitswere issued in ten counties: Chautauqua Countyhad the most with 34 permits (20 gas, 9 oil and 5reissued); Steuben County followed with 26 permits(15 oil, 6 gas storage, 3 gas, 1 stratigraphic and 1reissued permit); Livingston County had 18stratigraphic wells and 2 reissued permits; WyomingCounty had 12 brine wells and 1 gas well permitted;Allegany had 11 permits (7 oil, 1 injection, 1disposal and 2 reissued); Cattaraugus had 9 permits(5 gas and 4 oil); Erie County had 5 gas wellspermitted followed by Genesee County with 4 gaswell permits; Schuyler County had 2 gas storagepermits and Broome County had one gas wellpermitted.
Completions
There were 110 wells completed in NewYork during 1995. For a complete listing see theoil and gas statistics table on page 22. Twenty oilwells were completed during 1995, a decrease of14 wells from 1994. Allegany County had the mostoil completions
with 4 each in the Beech Hill - Independence andthe Fulmer Valley Fields. Chautauqua County had6 oil completions, 4 in the Busti Field and one eachin the Gerry-Charlotte and the North HarmonyFields. Steuben County had 2 oil completions inthe Beech Hill - Independence Field. Twelve waterinjection wells were completed in the SteubenCounty portion of the Beech Hill-IndependenceField. One water injection well was completed inAllegany County’s Richburg Field and Cattaraugus’Bradford Field.
Thirty-one gas wells were completed during1995; this is a decrease of 20 wells from 1994.Chautauqua County had the most completions with11 in the Lakeshore Field and 3 in the Gerry-Charlotte Field. Erie County followed with 4 in theEast Aurora Field and one each in the Concord andGlenwood Fields. Cattaraugus County had 5completions, two each in the Lakeshore and Chaffee- Arcade Fields and one in the Chipmunk Field.Genesee County had 3 completions, 2 in the EllicottCreek Pool (a new Onondaga formation pool), andone in the Danley Corners Field. Steuben Countyhad 2 wildcat completions, one in the Big CreekField and the other in the Waldo Creek Field.Wyoming County had one gas completion in theAlden-Lancaster Field.

New York State Oil, Gas and Mineral Resources, 1995
2NYSDEC - Division of Mineral Resources Twelfth Annual Report
PRODUCTION OF OIL & NATURAL GAS Eric B. Shyer
Top Ten Oil & Gas Producing Companies, 1995
Oil GasProduction Production
Company (BBLS) Company (MCF)
East Resources, Inc. 30,163 Belden & Blake Corporation 3,846,732Richardson Petroleum Corp. 21,143 Lomak Operating Company 1,387,140Pennsylvania General Energy 19,665 Meridian Exploration Corp. 1,280,080Oil, Gas & Land Services, Inc. 14,688 Seneca Resources Corp. 1,107,058R & C Oil Co. 13,833 United States Gypsum Co. 902,310Chautauqua Energy, Inc. 12,359 Cabot Oil & Gas Corp. 741,032Pefley Oil & Gas, Inc. 10,813 Ivan Hall & Associates, Inc. 661,623Belden & Blake Corporation 8,839 Lenape Resources, Inc. 590,122Hemlock Oil & Gas Co., Inc. 7,707 Ardent Resources, Inc. 382,953Ebenezer Oil Co, Inc. 6,452 Resource America, Inc. 382,257
Top Ten Gas Producing Counties, 1995
No. ofGas Active Average
County MCF Wells MCF/WellChautauqua 8,696,772 3,208 2,711Cattaraugus 2,050,758 551 3,722Erie 1,907,194 840 2,270Tioga 1,832,608 9 203,623Cayuga 1,351,593 293 4,613Genesee 1,084,583 497 2,182Seneca 616,391 138 4,467Wyoming 479,136 260 1,843Allegany 243,660 134 1,818Livingston 199,221 140 1,423
As of June 18, 1996, approximately 76percent, or 680 out of 887, of the registered NewYork oil and gas operators had filed their 1995Annual Well Reports. Due to several largeoperators not filing their Annual Well Reports, theDivision does not have the current status orproduction of approximately 900 wells.Unreported wells and production adversely affectlocal property tax evaluations.
The Division is actively re-notifying thoseoperators of their legal responsibility to file theirannual well reports.
New York’s production of oil increasedto 303,780 barrels, a rise of 1.6 percent from1994. The map on page 5 shows oil production inNew York State by town. Allegany andCattaraugus Counties, which contain the State’shistoric oil fields, produced 45,772 and 158,625barrels of oil (bblo) respectively. This representsa five percent increase for Allegany County and adecrease of 7 percent for Cattaraugus County from1994 production. Chautauqua County produced86,343 bblo, an increase of twenty-four percentover 1994's production. Erie and Steubencounties’ oil production decreased twenty-eightand twelve percent to 317 and 12,723 bblorespectively, from 1994's production figures. Theoil production figures are based on the oil buyers’reports.
New York's 1995 preliminary gasproduction was 18.7 billion cubic feet (BCF) andis mapped by town on page 4. Initial estimates ofthe remaining unfiled production reports shouldplace total 1995 gas production at about 20 BCF.Tioga County placed fourth in gas productionwith an average per-well production of 203,623MCF. This is noteworthy as Tioga County onlyhas nine active gas wells.

New York State Oil, Gas and Mineral Resources, 1995
3NYSDEC - Division of Mineral Resources Twelfth Annual Report
1986 1987 1988 1989 1990 1991 1992 1993 1994 19950
0.15
0.3
0.45
0.6
0.75
0.9
MMBO
Annual production of crude oil in New York State, 1986 - 1995.
1986 1987 1988 1989 1990 1991 1992 1993 1994 19950
5
10
15
20
25
30
35
BCF
Annual production of natural gas in New York State, 1986 - 1995.


New York State Oil, Gas and Mineral Resources, 1995
NYSDEC - Division of Mineral Resources 6 Twelfth Annual Report
ENFORCEMENT OPTIONS Donald Drazan & Joe Kowalczyk
The Department is charged with theregulation of oil, gas and solution mining activi-ties under Article 23 of the Environmental Con-servation Law. Our goal has been to supportproduction of the State’s non-renewable resourcesin a responsible manner that provides adequateprotection of public health and the environment.When efforts to cooperatively resolve complianceproblems fail, the enforcement process is utilizedto obtain compliance, deter violators and level theplaying field.
The Department’s objectives in regulatingthe oil and gas industry include preventing pollu-tion of natural resources, including groundwater,and ensuring that adequate financial security toguarantee well plugging and reclamation is main-tained. Article 23 of the ECL expressly providesthat the Department can require the plugging ofwells to prevent the pollution of fresh watersupplies by oil, gas, salt water or other contami-nants. Requiring the plugging of abandoned wellsis one of the Department’s principal strategies forprotecting the State’s groundwater.
The Department’s oil and gas regulatoryprogram is administered out of the Central Officein Albany, Region 8 in Avon and Region 9 inOlean. Regional Division of Mineral Resourcesstaff review permit applications, perform inspec-tions, work with well owners to correct deficien-cies and support enforcement actions when at-tempts at voluntary compliance fail. Centraloffice staff are primarily responsible for compli-ance with financial security, annual well reportingand owner registration requirements, as well asoversight of regional activities.
Over the past ten years the Departmenthas initiated several hundred enforcement actionsagainst oil, gas and solution mining operators whohave failed to comply with regulatory require-ments. By in large the majority of enforcementactions are administrative in nature. However, inappropriate circumstances the Department referscompliance problems to the Attorney General’sOffice for civil or criminal prosecution. In crimi-nal actions Department staff coordinate with locallaw enforcement officials and district attorneys
or the Department of Law. The State has beensuccessful in this venue and has obtained severalfavorable court decisions which support the De-partment’s implementation of the statute andregulations.
Short Form Orders on Consent are per-haps the most frequently utilized administrativetool for achieving compliance. Provisions of suchorders typically include assessment of a smallpenalty and a relatively simple schedule forobtaining compliance. Cases involving recalci-trant parties, significant noncompliance, or enti-ties with a past record of serious violations arereferred to Counsel’s Office for enforcement. Insuch cases, staff may use an Order on Consent,Cease and Desist Directive, Notice of Hearing andComplaint, Shut-in Order, Plugging Order, Mo-tion for Order Without Hearing, or Motion forSummary Abatement. Enforcement attorneysgenerally attempt to negotiate an Order on Con-sent executed by both the Department and therespondent. Penalties are larger than those foundin Short Form Orders and compliance schedulesmay be more burdensome.
If efforts to settle compliance problems donot produce an Order on Consent, Departmentstaff will commence an administrative hearingbefore an Administrative Law Judge (ALJ). Afterthe hearing an ALJ submits a hearing report to theCommissioner that includes findings of fact andrecommendations on all issues. The Commis-sioner has the power to direct the violator tocorrect all noncompliance within a reasonabletime period and pay a penalty up to $5,000 perviolation plus $1,000 for each day during whichthe violation continues.
This overview is designed to show theenforcement tools that are available to the De-partment in obtaining compliance with the Envi-ronmental Conservation Law. The Department iscommitted to ensuring that the laws and regula-tions are followed and that all unplugged wells areeventually plugged to protect the citizens of thestate. Department staff prefer working coopera-tively with well owners to avoid enforcementactions and are always ready to discuss possible
New York State Oil, Gas and Mineral Resources, 1995
NYSDEC - Division of Mineral Resources Twelfth Annual Report7
MARKET VALUE Eric B. Shyer
1986 1987 1988 1989 1990 1991 1992 1993 1994 1995$0
$22
$44
$66
$88
$110
M i l l i o n s
Oil
Gas
Total
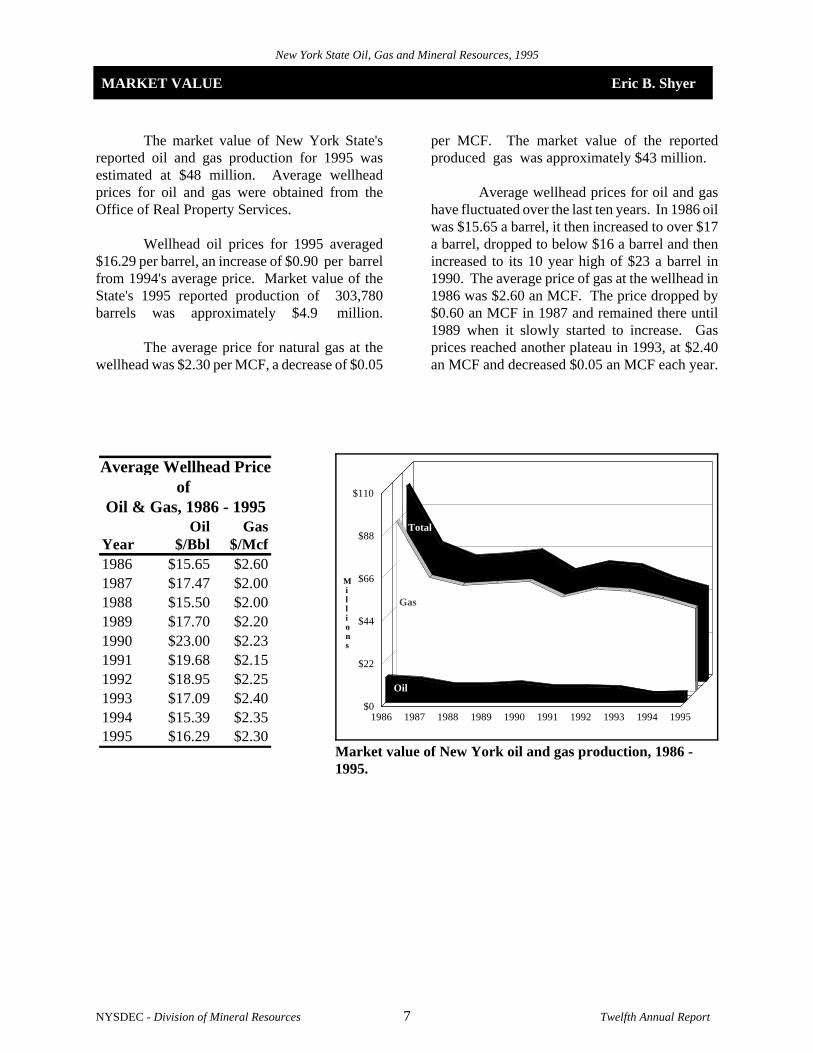
Market value of New York oil and gas production, 1986 -1995.
Average Wellhead Priceof
Oil & Gas, 1986 - 1995Oil Gas
Year $/Bbl $/Mcf1986 $15.65 $2.601987 $17.47 $2.001988 $15.50 $2.001989 $17.70 $2.201990 $23.00 $2.231991 $19.68 $2.151992 $18.95 $2.251993 $17.09 $2.401994 $15.39 $2.351995 $16.29 $2.30
The market value of New York State'sreported oil and gas production for 1995 wasestimated at $48 million. Average wellheadprices for oil and gas were obtained from theOffice of Real Property Services.
Wellhead oil prices for 1995 averaged$16.29 per barrel, an increase of $0.90 per barrelfrom 1994's average price. Market value of theState's 1995 reported production of 303,780barrels was approximately $4.9 million.
The average price for natural gas at thewellhead was $2.30 per MCF, a decrease of $0.05
per MCF. The market value of the reportedproduced gas was approximately $43 million.
Average wellhead prices for oil and gashave fluctuated over the last ten years. In 1986 oilwas $15.65 a barrel, it then increased to over $17a barrel, dropped to below $16 a barrel and thenincreased to its 10 year high of $23 a barrel in1990. The average price of gas at the wellhead in1986 was $2.60 an MCF. The price dropped by$0.60 an MCF in 1987 and remained there until1989 when it slowly started to increase. Gasprices reached another plateau in 1993, at $2.40an MCF and decreased $0.05 an MCF each year.
New York State Oil, Gas and Mineral Resources, 1995
NYSDEC - Division of Mineral Resources Twelfth Annual Report8
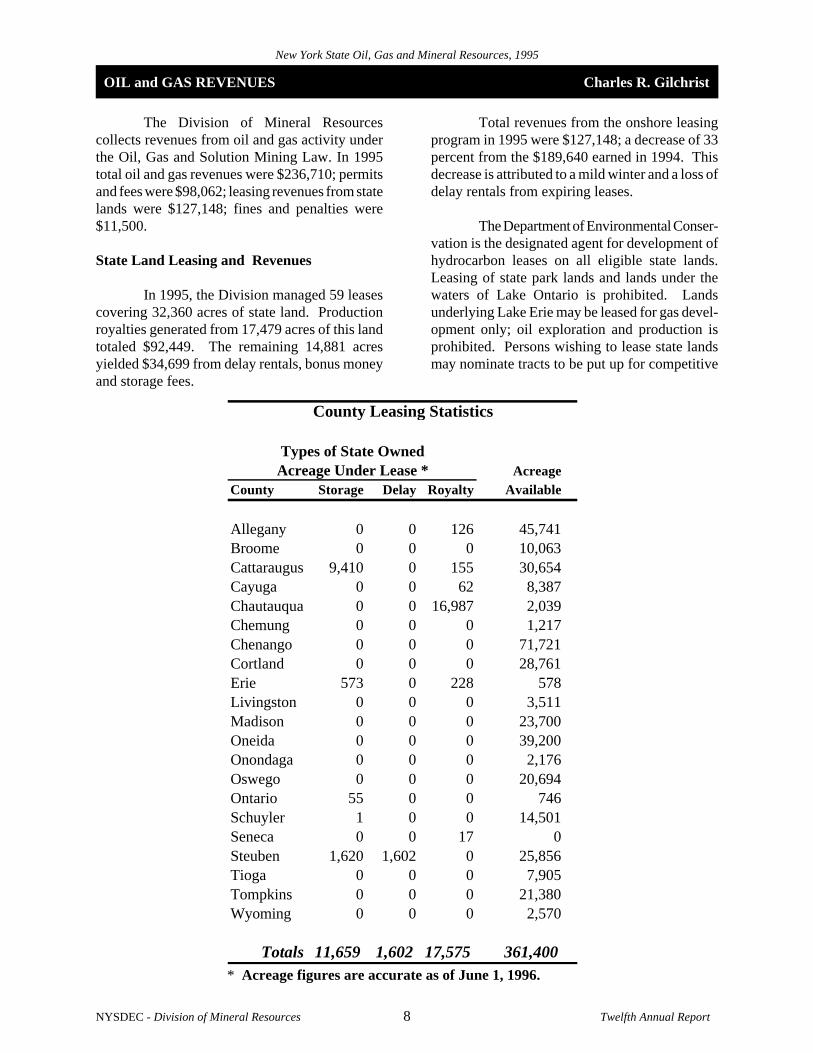
OIL and GAS REVENUES Charles R. Gilchrist
County Leasing Statistics
Types of State OwnedAcreage Under Lease * Acreage
County Storage Delay Royalty Available
Allegany 0 0 126 45,741Broome 0 0 0 10,063Cattaraugus 9,410 0 155 30,654Cayuga 0 0 62 8,387Chautauqua 0 0 16,987 2,039Chemung 0 0 0 1,217Chenango 0 0 0 71,721Cortland 0 0 0 28,761Erie 573 0 228 578Livingston 0 0 0 3,511Madison 0 0 0 23,700Oneida 0 0 0 39,200Onondaga 0 0 0 2,176Oswego 0 0 0 20,694Ontario 55 0 0 746Schuyler 1 0 0 14,501Seneca 0 0 17 0Steuben 1,620 1,602 0 25,856Tioga 0 0 0 7,905Tompkins 0 0 0 21,380Wyoming 0 0 0 2,570
Totals 11,659 1,602 17,575 361,400* Acreage figures are accurate as of June 1, 1996.
The Division of Mineral Resourcescollects revenues from oil and gas activity underthe Oil, Gas and Solution Mining Law. In 1995total oil and gas revenues were $236,710; permitsand fees were $98,062; leasing revenues from statelands were $127,148; fines and penalties were$11,500.
State Land Leasing and Revenues
In 1995, the Division managed 59 leasescovering 32,360 acres of state land. Productionroyalties generated from 17,479 acres of this landtotaled $92,449. The remaining 14,881 acresyielded $34,699 from delay rentals, bonus moneyand storage fees.
Total revenues from the onshore leasingprogram in 1995 were $127,148; a decrease of 33percent from the $189,640 earned in 1994. Thisdecrease is attributed to a mild winter and a loss ofdelay rentals from expiring leases.
The Department of Environmental Conser-vation is the designated agent for development ofhydrocarbon leases on all eligible state lands.Leasing of state park lands and lands under thewaters of Lake Ontario is prohibited. Landsunderlying Lake Erie may be leased for gas devel-opment only; oil exploration and production isprohibited. Persons wishing to lease state landsmay nominate tracts to be put up for competitive

New York State Oil, Gas and Mineral Resources, 1995
NYSDEC - Division of Mineral Resources Twelfth Annual Report9
1986 1987 1988 1989 1990 1991 1992 1993 1994 1995$0.0
$0.5
$1.0
$1.5
$2.0
$2.5
$3.0
M i l l i o n s
Oil
Total
Gas
Oil and gas property tax revenues, 1986 - 1995.
public bid. The minimum bid is five dollars peracre and each parcel nominated must be accom-panied by a bid guarantee deposit. Noncompeti-tive leases may be granted for small parcels ofstate owned land in order to consolidate drilling orproduction units controlled by a single entity. Allhydrocarbon leases, in order to be valid, must havethe approval of the agency with jurisdiction overthe land in question.
Onshore state lands encompassing approx-imately 360,000 acres in central and western NewYork are available for competitive leasing on arequest basis. Approximately half of the currentstate leases are in Chautauqua County, many ofthem in production status for 20 years or more.New wells continue to be drilled on these leases.Over 2,000 acres of state land are still available forleasing in Chautauqua County. Other active oiland gas producing counties are Allegany andSteuben which respectively have 45,741 and25,856 acres of state land available for leasing.Much of this acreage has been leased in the pastbut was never explored; virtually all of it has thepotential for gas development.
Located in south central New York is theprolific Stagecoach Field recently developed in
Tioga County. The state manages thousands ofacres of land in Tioga and the surrounding coun-ties which have yet to be tested for gas. Most ofthis acreage may be available through the competi-tive leasing program.
Obtaining Leasing Information
Information on county maps showing thelocation of acreage within a county and printoutsof available acreage can be obtained by contactingthe Division’s leasing staff in Albany.
Property Tax Revenues
Estimated real property tax revenuesattributable to reported 1995 oil and gas produc-tion were approximately $1.44 million. Taxes fromnatural gas and oil production were calculated tobe $1.29 million and $148,457, respectively.
Leasing Royalties
Statewide, all landowners who had pro-ducing oil and gas leases during 1995 receivedapproximately one-eighth of the market value of$48 million, or approximately $6 million inroyalties.

New York State Oil, Gas and Mineral Resources, 1995
NYSDEC - Division of Mineral Resources Twelfth Annual Report10
SOLUTION SALT MINING and BRINE DISPOSAL Bradley Field
Status of Solution Salt Mining in New York, 1995
Plugged Unplugged YearOperator County Town Wells Wells Started
Akzo Nobel Schuyler Reading 51 20 1893
Cargill Schuyler Dix 12 9 1898
Morton Wyoming Castile & Gainesville 23 16 1884
Texas Brine Wyoming Middlebury 74 41 1970(Dale field)
Texas Brine Wyoming Middlebury 5 36 1984(Wyoming Village field)
Total 165 122
SOLUTION SALT MINING
Five solution mining facilities in NewYork produced 2.1 billion gallons of saturatedbrine, or about 2.4 million metric tons of salt, in1995. Operators of these facilities injected 2.15billion gallons of fresh and recycled plant processwater into bedded salt zones of the Upper SilurianSalina Group to recover the brine. Brinewithdrawals for 1995 represent a decrease of ninepercent compared to 1994's figure of 2.3 billiongallons. The value of New York’s 1995 solutionsalt mining production is estimated at $75 million.
The 122 unplugged wells reported for1995 include injection wells, withdrawal wellsand wells equipped for both injection andwithdrawal. Solution miners in New Yorkwithdraw brine from both single-well and multi-well caverns. Operators of multi-well cavernssometimes alternate wells between injection and
withdrawal in order to balance dissolution (whichoccurs mostly at the injection well), therebycontrolling the size and shape of the caverns.Other techniques used to maximize saltproduction while enhancing cavern stabilityinclude hydrofracturing, horizontal drilling, androof padding. Current operators plug their wellsin accordance with industry standards and stateand federal regulations.
Akzo Nobel, Cargill, and Morton producebrine to supply on-site evaporation plants whichmanufacture and package table salt, waterconditioning salt, and salt for other uses. TexasBrine’s fields supply two chemical manufacturingplants in Niagara Falls via 60-mile-long brinepipelines. In 1995, solution miners produced 45percent of New York’s total mined saltproduction, with the remainder extracted byconventional underground mining. According tostatistics compiled by the U.S. Geological Survey,New York typically ranks third among the statesin total annual salt production.
The solution mining industry hasprospered in New York since 1878, whencommercial quantities of subsurface rock saltwere discovered in Wyoming County at a welldrilled to explore for oil or gas. Between 1878
and 1985, operators drilled 267 wells in additionto those at the current facilities. The Tully Valleybrine field in Onondaga County, started by SolvayProcess Company in 1888 to supply its Syracusesoda ash plant, was the site of 162 of these wells.Operational techniques led to sinkholes andwidespread subsidence in Tully Valley, where no

New York State Oil, Gas and Mineral Resources, 1995
NYSDEC - Division of Mineral Resources Twelfth Annual Report11
Tully Valley Well Plugging Statistics
Total wells drilled 172Wells lost/inaccessible 5
Wells plugged pre - 1989 0Wells plugged 1989 - 1991 31Wells plugged 1993 -1995 136
plugging program was in place until ordered bythe State in the late 1980s.
Between 1988 and 1995, AlliedSignalCorporation, Solvay Process Company’s ultimatesuccessor, plugged 167 wells in Tully Valley.This total includes 158 solution mining wells, ahundred-year-old exploratory well, sevencoreholes, and a well drilled but never used forfluid disposal. During 1995, the company alsodrained and decommissioned a 20-mile-long,century-old pipeline that once conveyed brinefrom the well field in Tully Valley to the soda ashplant in Syracuse. Both the well pluggings andpipeline closure in Tully Valley were initiated bythe Division of Mineral Resources.
BRINE DISPOSAL
Produced Water Volume
Produced water volume for 1995 was 686million barrels, a 68 percent decrease from 1994.Oil-associated water production of 574 millionbarrels was down 71 percent and gas-associatedbrine production of 111,000 barrels was down 23percent when compared to 1994. These figures donot include brine produced with underground gasstorage withdrawals.
Disposal Wells
In 1995, New York State had five UICClass IID wells authorized for the disposal ofbrine associated with oil and gas production. Twoof the five wells were shut-in all year. TheUSEPA and the state issued permits for sixadditional wells for disposal of brine associatedwith salt cavern leaching at the Avoca NaturalGas storage project.
The 1995 injection volume was 87,668barrels, 98% of which was produced andreinjected at two underground gas storagefacilities.
New York State Oil, Gas and Mineral Resources, 1995
NYSDEC - Division of Mineral Resources Twelfth Annual Report12
REGION 8 REVIEW Randy Nemecek - Region 8 Minerals Manager
Over the last two years, most of Region 8'soil, gas and mining activities were directed towarddealing with the impacts associated with the March1994 collapse of Akzo Nobel Salt, Inc.’s (Akzo)underground salt mine in Retsof, LivingstonCounty. In fact, last year’s Region 8 report wasdedicated entirely to this event. However, over thecourse of the last year, the Akzo project took on adifferent character and several exciting projectswere initiated that were overshadowed by the minecollapse.
Akzo had originally proposed to constructa new underground salt mine in Livingston Countyto replace its Retsof operation. However, aftercompleting the public hearing process and receiv-ing its permit, Akzo decided to cancel its plans toconstruct a new mine.
The Department did a remarkable job
reviewing and processing this complex project inan efficient and timesaving manner. Two Depart-ment staff members dedicated 100 percent of theirtime to evaluate and process Akzo’s permit appli-cation. In addition, the Department committedresources from several other offices including butnot limited to the Divisions of Mineral Resourcesand its consultant, John T. Boyd Co., Legal Af-fairs, Water Quality, Fish and Wildlife, Air andRegulatory Services. Outside agencies includedthe Governor’s Office of Regulatory Reform, theDepartments of Transportation, Agriculture andMarkets and Economic Development, the Officeof Parks, Recreation and Historic Preservation, theAttorney General’s Office, Livingston County, andthe Towns of Groveland, Geneseo and MountMorris.
In spite of its decision not to construct anew mine, Akzo remained a top priority. Since thecollapse, Akzo received 73 permits and drilled 64wells of which 39 have been plugged and aban-doned. The only remaining wells are those usedfor groundwater monitoring. There are currently22 wells used for this effort. Over the last twoyears, over 1,000 inspections have been conducted.
During 1995, the construction of the under-ground gas storage facilities in salt cavities began.The first project was New York State Electric and
Gas Corp.’s (NYSEG) proposal to useabandoned solutioned salt caverns in the Town ofReading, Schuyler County. These caverns werecreated by Akzo as part of their solution miningoperations for food-grade salt. NYSEG drilled/re-entered three wells to access an abandoned galleryand conducted integrity tests to ensure that thecavern could store gas at pressures exceeding 1300pounds per square inch of gas (psig). In addition,NYSEG conducted several rock mechanics testsduring drilling operations to ensure competency ofthe cap-rock. The tests demonstrated sufficientintegrity for gas storage and NYSEG is currentlyconstructing surface facilities to support this newfacility.
Avoca Gas Storage Inc. (Avoca) alsoreceived an underground gas storage permit andcommenced drilling operations in 1995. Avocabegan testing operations with deep stratigraphicwells in 1992. The first project well began in thefall of 1995. Since then, full time drilling opera-tions have been underway. As many as sevendrilling and/or workover rigs have been in opera-tion. An exciting aspect of this operation has beenthe use of two "triple" drilling rigs. One rig uti-lizes a 28-foot substructure and ranks as one of thebiggest drilling rigs ever to conduct operations inNew York State.
Avoca received approval to develop sixgallery-type caverns using 12 wells for the explicitpurpose of storing approximately 5 BCF of naturalgas. In addition, Avoca will drill six deep disposalwells to depths between 10-12 thousand feet.Brine generated from the solutioning operationswill be injected into these wells.
The above operations contributed to oneof Region 8's most active years. Other operationsincluded wildcat activity in Steuben and BroomeCounties, the finalization of plugging and abandon-ment operations of AlliedSignal’s abandoned solu-tion salt field in Tully Valley, Onondaga County,the drilling of seven wells to support the expansionof a liquefied petroleum gas (LPG) facility in Steu-ben County and continued drilling operations inGenesee and Schuyler Counties. Most of theseactivities will carry over and supplement plansscheduled for 1996.

New York State Oil, Gas and Mineral Resources, 1995
NYSDEC - Division of Mineral Resources Twelfth Annual Report13
DEEP WELL DRILLING in REGION 9 Jack Dahl - Region 9 Mineral Manager
Is it possible that deep well drilling inRegion 9 has occurred over the past 100 years? Itmay surprise you but the answer is yes! Let’sdefine the term “deep” as any well drilled toformations deeper than the Queenston (Strati-graphic Chart pg. 15 ). Using this definition notonly has deep drilling occurred in Region 9, it hasoccurred in all six counties comprising Region 9:Allegany, Cattaraugus, Chautauqua, Erie, Niagaraand Wyoming. Many of these deep wells encoun-tered gas shows that indicate an excellent poten-tial for commercial gas accumulations in theformations underlying the Upper OrdovicianQueenston.
Early exploration of Region 9's deepstratigraphic section began in Niagara Countyduring the 1880's - 1890's. Several wells weredrilled to the Precambrian at approximately 2,000- 3,000 feet. The Bradshaw #1, API # 063-01039,drilled in 1891, reached a total depth (TD) in thePrecambrian of 2,134 feet. No hydrocarbonshows were reported; however, one year later in1892, the Bradshaw #2, API # 063-01335, didreport gas shows in the Upper Cambrian Theresaand Potsdam Formations. The early explorationof sub-Queenston strata probably began in Niag-ara County due to the relatively shallow depthsof the target horizons.
Exploration of Erie County’s deep sectionfollowed the initial attempts in Niagara County.Records for the Elma Deep #1 Well, API # 029-00988, drilled in 1903, did report gas in the UpperOrdovician Queenston Formation on its way to aTD of 3,986 feet in the Upper Cambrian PotsdamFormation. A very significant show of gas wasreported in the City Hospital Grounds #1, API #029-00840, drilled in 1924. According to therecords, gas flowed from the Middle OrdovicianTrenton Formation (3,420 feet) at the rate of 700thousand cubic feet of gas per day (MCFGD). Itis very possible the City Hospital Grounds #1drilled a deep structure or a fractured reservoir.The “deep” formations continued to show thepromise for a commercial discovery.
Deep gas exploration in western NewYork was severely curtailed during the years ofthe Depression and World War II. Technologywas advancing and the rotary drilling rigs wererapidly replacing cable tool rigs. Post war drillingwould soon begin using the improved technology.
Chautauqua County’s deep gas explora-tion began in the late 1940's and continued throu-gh the 1960's. Heintz Oil drilled the Niehaus Wellin 1949, API # 013-01464, to the Lower Ordovi-cian Tribes Hill Formation and reported a gasshow of 80 mcfgd. Records show it had an initialflow of 2.2 million cubic feet of gas per day(MMCFGD), was completed, and subsequentlyproduced more than 300 mmcfg. The Niehauswell is the first reported commercial deep gasdiscovery in western New York. Other Chautau-qua County wells have also encountered deep gas.The Morse Well, API # 013-03200, drilled in1956 to 7,100 feet in the Upper Cambrian LittleFalls Formation, had gas shows in the MiddleOrdovician Trenton and the Upper CambrianTribes Hill and Little Falls Formations. TheHarrington #1, API # 013-04437, drilled in 1963to 7,691 feet as an Upper Cambrian Potsdam test,reported gas in the Middle Ordovician Trentonand the Upper Cambrian Little Falls and TheresaFormations. Significant shows and a commercialgas discovery further encouraged operators toexplore the deep formations.
Drilling, completion and explorationtechnology improved from the 1960's through the1990's. Operators began using seismic, air/landsatphoto analysis and gravity/magnetic surveys toexplore for gas and oil. Structures and faultscould be delineated with a much higher degree ofaccuracy. As the technology improved and theprice of oil and gas rose, increased drillingsoon followed.
Deep wells continued to report gas shows.Allegany County had two wells drilled to theUpper Cambrian Theresa Formation (approx.7,400 feet) in the early 1960's. The Cook Well,API # 003-03956, reported 100 MCFGD from theUpper Cambrian Little Falls Formation. TheWolfer Well, API # 003-04248, found gas in theMiddle Ordovician Trenton and the Lower Ordo-vician Tribes Hill Formations. Although gas wasencountered, the depth to the target zones resultedin high drilling costs that may have limited furtherdeep well drilling and development in AlleganyCounty.
Cattaraugus County also had its share ofdeep wells. The Enterprise-Transit Well, API #009-09235, drilled in 1972 to a TD of 11,680 feetin the Precambrian, had gas shows in the Middle

New York State Oil, Gas and Mineral Resources, 1995
NYSDEC - Division of Mineral Resources Twelfth Annual Report14
AlleganyCattaraugus
Wyoming
Niagara
Chautauqua
Erie
09235
22520
0413300988
04248
13278
2186921860
00840
01335
01039
0146403956
03200
04437
Deep well location map.
Ordovician Black River Formation, the CambrianRose Run Formation and the Precambrian marble.The Precambrian gas shows, if valid, most likelyoriginate from their proximity to faults or naturalfractures. Additional drilling in this county(1990) resulted in deep shows of gas (greater than6,000 feet) in the Schweikert-Scharf, API # 009-21860, and the Worden wells, API # 009-21869.Both wells recorded shows in the Upper CambrianTheresa and Little Falls Formations. Commercialdiscoveries were still elusive but the presence ofgas showed the real possibility of large gas accu-mulations below the Upper Ordovician QueenstonFormation.
T h e1990's produceda drilling boomfor deep gas inWyoming Co-unty. A total offifteen wellswere drilledwith Cambro-Ordovician for-mations as theprimary objec-tive. One rea-son contributingto increasedWyoming Co-unty exploratorydrilling was thetwelve deepwells previouslydrilled in the co-unty between1946 and 1985;a 250 MCFGDUpper Cam-brian TheresaFormation showin the Strathern Well, API # 121-04133, a re-ported Middle Ordovician Trenton Formationoil/gas show in the Romain Well, API # 121-13278, and reports of other deep gas shows en-couraged Power Gas to commence their UpperCambrian Theresa Formation exploration drillingprogram. A new field, Cascade Brook, wasdiscovered and commercial production com-menced in 1991 from the Upper CambrianTheresa Formation.
The Titus Bros. #1, API # 121 - 21920, produced97.6 mmcfgd in 1992 from the Upper CambrianTheresa Formation. Another significant Wyo-ming County well is Ardent/Belden’s Matusik #1,API # 121-22520. Although information on theMatusik remains confidential, 15 mmcfg wasreported from the Theresa Formation as yearlyproduction on the 1995 well production report.
Advanced technology will continue toplay a vital role in the exploration of New York’sdeep structures. A 3-D seismic survey funded byNew York State Energy Research and Develop-ment Authority (NYSERDA), exploration compa-nies Ardent Resources and Belden and Blake and
others was com-pleted in the fallof 1995. Ardentand Belden andBlake used 3-Dseismic data andairborne magneticsurvey informa-tion to locate an-other deep test insouthwestern Wy-oming County.An August 1996spud date wasanticipated.
Deep dril-ling in Region 9over the past 100years has discov-ered commercialgas fields, showsof oil and gas,and the potentialfor billion cubicfoot (BCFGD)gas accumula-
tions. The New York State Department of Envi-ronmental Conservation’s Division of Mineral Re-sources and NYSERDA have taken active roles toencourage the development of New York’s deepgas potential. I look forward to the next severalyears and the commercial discoveries to come. Ibelieve we will see the saying “drill low fordough” come to fruition in western New York.


New York State Oil, Gas and Mineral Resources, 1995
NYSDEC - Division of Mineral Resources Twelfth Annual Report16
UNDERGROUND GAS STORAGE & LIQUEFIED PETROLEUM GAS Clemsford Pollydore
1995 Underground Gas Storage
TotalInj/ Mon/ Storage Gas To Gas From Designed
Storage Storage Wdr Obs Total Capacity Storage Storage Max. Del.Operator Field Wells Wells Wells (MMCF) (MMCF) (MMCF) (MCF/DAY)
CNG Transmission Corp. Woodhull 50 1 51 35,904 15,156 23,932 357,000Columbia Gas Trans Corp. Dundee 115 19 134 11,000 3,562 4,653 80,000Columbia Gas Trans Corp. Gilbert 1 0 1 230 0 0 0Columbia Gas Trans Corp. Greenwoood 4 3 7 3,600 351 255 3,000Columbia Gas Trans Corp. N.Greenwood 2 0 2 3,200 618 513 4,000Honeoye Storage Corp. Honeoye 28 12 40 8,714 3,438 4,018 40,000National Fuel Gas Supply Beech Hill 32 9 41 23,000 3,134 4,230 66,000National Fuel Gas Supply Bennington 63 1 64 5,000 2,588 2,468 75,300National Fuel Gas Supply Colden 159 7 166 16,220 2,341 2,764 110,000National Fuel Gas Supply Collins 45 2 47 5,880 2,110 2,480 50,000National Fuel Gas Supply Derby 12 2 14 250 130 126 5,000National Fuel Gas Supply East Independence 7 4 11 6,400 2,205 1,900 14,700National Fuel Gas Supply Holland 24 1 25 2,600 826 708 25,000National Fuel Gas Supply Lawtons 29 2 31 2,470 923 1,141 21,000National Fuel Gas Supply Limestone 10 4 14 19,800 547 870 37,000National Fuel Gas Supply Nashville 70 1 71 8,530 2,623 3,854 110,000National Fuel Gas Supply Perrysburg 39 1 40 3,850 1,297 1,395 35,000National Fuel Gas Supply Sheridan 25 1 26 3,700 788 981 25,000National Fuel Gas Supply Tuscarora 7 1 8 6,300 2,949 3,583 57,000National Fuel Gas Supply West Independence 23 8 31 11,800 4,939 3,908 48,700National Fuel Gas Supply Zoar 30 1 31 2,200 1,764 1,976 40,000Steuben Gas Storage Co. Adrian Reef 10 1 11 8,200 3,098 4,592 60,000
Totals 785 81 866 188,848 55,387 70,347 1,263,700
Underground Gas Storage
At year end 1995, there were 159.5 billioncubic feet (BCF) of gas in storage, of which 61.1BCF were working gas. New York's storage fields(see map on page 17) can deliver approximately1.26 BCF/day during peak periods. The totalavailable gas capacity in the State isapproximately 188.8 BCF with a potentialworking gas capacity of 90.4 BCF.
In March 1995, Avoca Natural GasStorage (Avoca) was granted a permit for theunderground storage of approximately 6.72 BCF
of natural gas, of which 5 BCF will be workinggas. The gas will be stored in six caverns to beconstructed by solutioning salt from bedded strataat a depth of about 3,900 feet. The project area islocated in the town of Avoca, New York. Thecaverns will be leached using two wells in eachcavern. Fresh water will be injected into one welland brine will be withdrawn from the other well.The two wells in each cavern will be
initially connected at the base of the salt usinghorizontal drilling techniques. The brineproduced during the solutioning process will bedisposed of by injection into a number of deepdisposal wells. Construction has already begunand the first phase consisting of two caverns isexpected to be completed by October 1997.
In August 1995, New York State Electricand Gas Corporation (NYSEG) was granted apermit for the underground storage ofapproximately 2.34 BCF of natural gas, of which
1.69 BCF will be working gas. The gas will bestored in an existing underground salt cavityknown as Gallery No. 1, located at a depth ofapproximately 2,000 feet below the surface. Theproject area is located in the Town of Reading,Schuyler County, New York. Two wells will beused for the injection and withdrawal of gas andone well will be used for the withdrawal of brine.The produced brine will be piped to a nearby


New York State Oil, Gas and Mineral Resources, 1995
NYSDEC - Division of Mineral Resources Twelfth Annual Report18
1995 Liquefied Petroleum Gas Facilities Summary
Capacity BalanceOperator County # Wells (Mgals) (Mgals)
Bath Petroleum Storage Steuben 7 43,221 20,592Texas Eastern Product Pipeline Schuyler 1 53,294 9,294Western Energy and Storage Cortland 3 20,000 10,305
Totals 11 116,515 40,191
AKZO plant for processing. NYSEG hascompleted all major construction and hascommenced debrining operations.
In June 1996, Arlington ExplorationCompany (Arlington) was granted a permit for theunderground storage of approximately 7.7 BCF ofnatural gas in a nearby depleted natural gas fieldknown as the Thomas Corners Reef. Working gascapacity will be approximately 5.3 BCF. TheThomas Corners Reef is located in the Towns ofBath and Cameron, Steuben County, New York,and the storage reservoir is at a depth of about
3,600 feet below the surface. This project issimilar to the Adrian Reef Storage approved bythe Department in July 1990. When completed,the storage facility will consist of 13 or morewells and will be known as Thomas CornersStorage.
Liquefied Petroleum Gas
The three liquefied petroleum gas (LPG)facilities in New York State have a total storagecapacity of 116.5 million gallons. At the close of1995, there were 40.2 million gallons of LPG instorage occupying 34 percent of total capacity.
New York State Oil, Gas and Mineral Resources, 1995
NYSDEC - Division of Mineral Resources Twelfth Annual Report19
MINED LAND RECLAMATION Steven Potter
Mining is an important element in theeconomy of the State of New York. In 1995, morethan 4,000 workers were employed in the extractivemineral industry in New York State. CurrentlyNew York State is ranked 15th in the nation in thevalue of non-fuel minerals produced. The estimatedvalue for these minerals is $1.5 billion. The Stateaccounted for a little less than three percent of theU.S. total. More than 90 percent of the State's non-fuel mineral value was derived from industrialminerals and mineral products, primarily salt,construction sand and gravel, crushed stone, portlandcement, and wollastonite.
Most of the metal production was from zinc.In estimated mineral production for 1995, New Yorkremained the only major producer of wollastonitein the United States, second of two garnet producingstates, third in salt and zinc, fourth in talc andpyrophyllite, and sixth in lead.
One of the major mining related incidentsin 1995 was the closure of the Akzo Nobel salt minein Retsof, New York. This mine was the largestproducer of rock salt in the western hemisphere.Throughout 1995 the Department had worked closelywith Akzo-Nobel on the processing of a new permitapplication for a salt mine at Hampton Corners, NewYork. After seventeen months of technical review,a new permit was issued in the spring of 1996.However, shortly after, Akzo-Nobel announced thatthe new mine would not be built at HamptonCorners.
New York has regulated mining since theMined Land Reclamation Law (MLRL) was first
enacted in 1974 and amended in 1991. The Division'sprimary role is to ensure that the economicdevelopment of New York's mineral resources iscompatible with sound environmental managementprinciples and the land is returned to a productiveuse after mining.
The Mined Land Reclamation Law statesthat any person proposing to mine more than 1,000tons or 750 cubic yards of minerals from the earthin 12 successive calendar months must obtain apermit. Permit applicants must submit a mining andreclamation plan and other required environmentalinformation. The plans must explain the proposedmethods of mining and reclamation. Mined Landstaff issued a total of 342 permits in 1995; of thattotal, 130 were new and 212 were renewals. Twothousand five hundred sixty (2,560) mines, 1,826industry-owned and 734 government owned, wereactive in the state at the end of 1995. The numberof acres currently disturbed by mining at the endof 1995 was 39,150 acres. A total of 13,428 acreshave been reclaimed since 1974.
The map on page 20 shows the distributionand number of mines regulated by the Divisionas of July 23, 1996.
There are eight Mined Land ReclamationSpecialists (MLRS) to oversee and inspect the 2,560mines in New York State. That’s about 320 minesfor each MLRS. One MLRS is located in eachregion (excluding Region 2, New York City). Foradditional information on the MLRS in your areacontact the Central Office in Albany (see map onpg. vi).

New York State Oil, Gas and Mineral Resources, 1995
NYSDEC - Division of Mineral Resources Twelfth Annual Report21
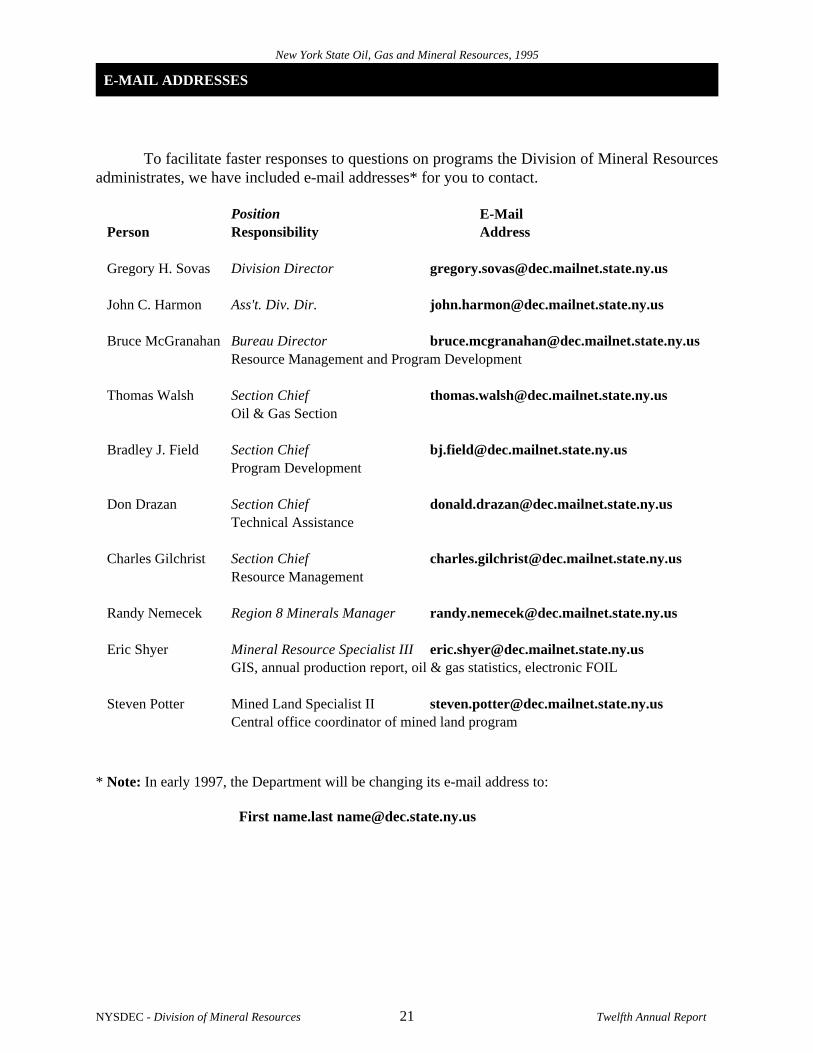
E-MAIL ADDRESSES
Position E-MailPerson Responsibility Address
Gregory H. Sovas Division Director [email protected]
John C. Harmon Ass't. Div. Dir. [email protected]
Bruce McGranahan Bureau Director [email protected] Management and Program Development
Thomas Walsh Section Chief [email protected] & Gas Section
Bradley J. Field Section Chief [email protected] Development
Don Drazan Section Chief [email protected] Assistance
Charles Gilchrist Section Chief [email protected] Management
Randy Nemecek Region 8 Minerals Manager [email protected]
Eric Shyer Mineral Resource Specialist III [email protected], annual production report, oil & gas statistics, electronic FOIL
Steven Potter Mined Land Specialist II [email protected] office coordinator of mined land program
To facilitate faster responses to questions on programs the Division of Mineral Resourcesadministrates, we have included e-mail addresses* for you to contact.
* Note: In early 1997, the Department will be changing its e-mail address to:
First name.last [email protected]

New York State Oil, Gas and Mineral Resources, 1995
NYSDEC - Division of Mineral Resources Twelfth Annual Report22
OIL and GAS TABLES and STATISTICS
Oil and Gas Statistics . . . . . . . . . . . . . . . . . . . . . . . . . . . . . . . . . . . . . . . . . . . . . . . . . . . . . . . . . . . . . . 23
Wildcats, Field Extensions & Stratigraphic Tests . . . . . . . . . . . . . . . . . . . . . . . . . . . . . . . . . . . . . . . . 24
Permits Issued During 1995 ^ . . . . . . . . . . . . . . . . . . . . . . . . . . . . . . . . . . . . . . . . . . . . . . . . . . . . . . . 25
Oil & Gas Production by Town in Each County * . . . . . . . . . . . . . . . . . . . . . . . . . . . . . . . . . . . . . . . 28
Oil & Gas Production by Field in Each County * . . . . . . . . . . . . . . . . . . . . . . . . . . . . . . . . . . . . . . . . 34
Oil & Gas Production by Formation in Each County * . . . . . . . . . . . . . . . . . . . . . . . . . . . . . . . . . . . 40
^ The following codes describe the well type:
BR = Brine GD = Gas Development RI = ReissuedCN = Completion Report Not Received GE = Gas Extension SG = StratigraphicDH = Dry Hole GW = Gas Wildcat SI = ShutinDW = Dry Wildcat IW = Water Injection ST = StorageEX = Expired xxL = Horizontally Drilled TA = Temporilly Abandoned - by Application
OD = Oil Development TR = Transfer
* The statistics for these tables have been derived from information supplied by the producers in their annualproduction report to the Division of Mineral Resources. Closing date for compilation of statistics was June18, 1996.
New York State Oil, Gas and Mineral Resources, 1995
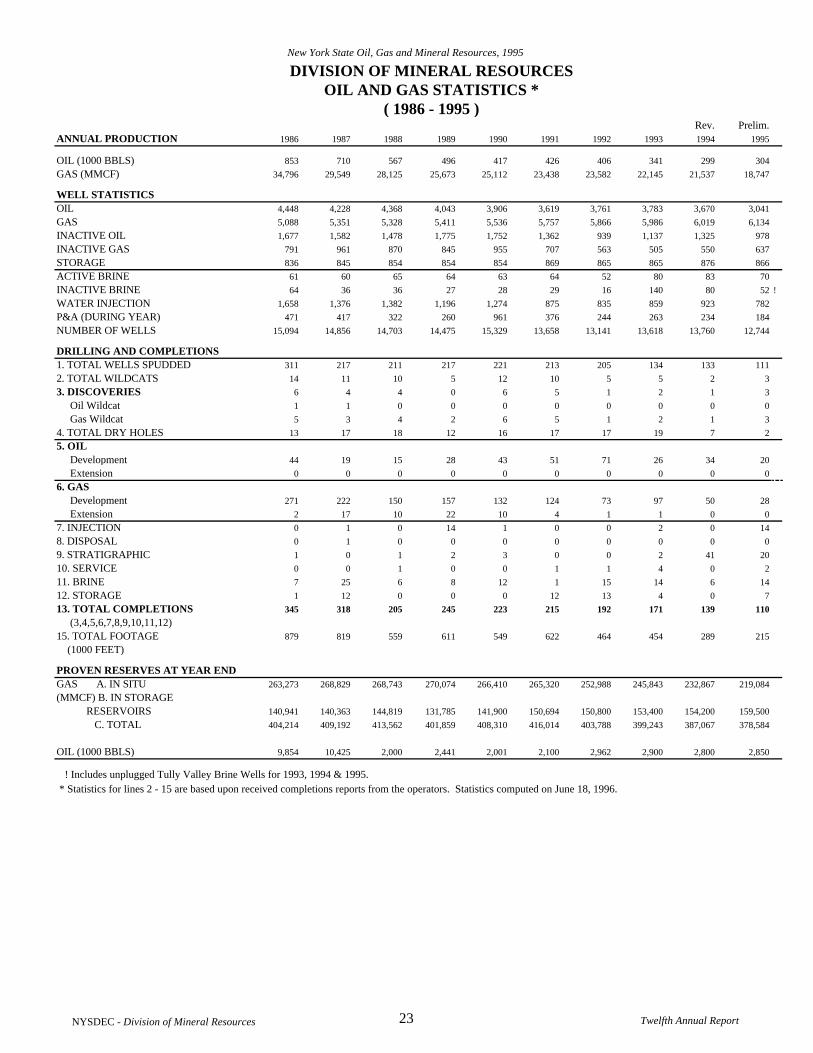
DIVISION OF MINERAL RESOURCES OIL AND GAS STATISTICS * ( 1986 - 1995 )
Rev. Prelim.ANNUAL PRODUCTION 1986 1987 1988 1989 1990 1991 1992 1993 1994 1995
OIL (1000 BBLS) 853 710 567 496 417 426 406 341 299 304
GAS (MMCF) 34,796 29,549 28,125 25,673 25,112 23,438 23,582 22,145 21,537 18,747
WELL STATISTICSOIL 4,448 4,228 4,368 4,043 3,906 3,619 3,761 3,783 3,670 3,041
GAS 5,088 5,351 5,328 5,411 5,536 5,757 5,866 5,986 6,019 6,134
INACTIVE OIL 1,677 1,582 1,478 1,775 1,752 1,362 939 1,137 1,325 978
INACTIVE GAS 791 961 870 845 955 707 563 505 550 637
STORAGE 836 845 854 854 854 869 865 865 876 866
ACTIVE BRINE 61 60 65 64 63 64 52 80 83 70
INACTIVE BRINE 64 36 36 27 28 29 16 140 80 52 !
WATER INJECTION 1,658 1,376 1,382 1,196 1,274 875 835 859 923 782
P&A (DURING YEAR) 471 417 322 260 961 376 244 263 234 184
NUMBER OF WELLS 15,094 14,856 14,703 14,475 15,329 13,658 13,141 13,618 13,760 12,744
DRILLING AND COMPLETIONS1. TOTAL WELLS SPUDDED 311 217 211 217 221 213 205 134 133 111
2. TOTAL WILDCATS 14 11 10 5 12 10 5 5 2 3
3. DISCOVERIES 6 4 4 0 6 5 1 2 1 3
Oil Wildcat 1 1 0 0 0 0 0 0 0 0
Gas Wildcat 5 3 4 2 6 5 1 2 1 3
4. TOTAL DRY HOLES 13 17 18 12 16 17 17 19 7 2
5. OIL Development 44 19 15 28 43 51 71 26 34 20
Extension 0 0 0 0 0 0 0 0 0 0
6. GAS Development 271 222 150 157 132 124 73 97 50 28
Extension 2 17 10 22 10 4 1 1 0 0
7. INJECTION 0 1 0 14 1 0 0 2 0 14
8. DISPOSAL 0 1 0 0 0 0 0 0 0 0
9. STRATIGRAPHIC 1 0 1 2 3 0 0 2 41 20
10. SERVICE 0 0 1 0 0 1 1 4 0 2
11. BRINE 7 25 6 8 12 1 15 14 6 14
12. STORAGE 1 12 0 0 0 12 13 4 0 7
13. TOTAL COMPLETIONS 345 318 205 245 223 215 192 171 139 110
(3,4,5,6,7,8,9,10,11,12) 15. TOTAL FOOTAGE 879 819 559 611 549 622 464 454 289 215
(1000 FEET)
PROVEN RESERVES AT YEAR ENDGAS A. IN SITU 263,273 268,829 268,743 270,074 266,410 265,320 252,988 245,843 232,867 219,084
(MMCF) B. IN STORAGE RESERVOIRS 140,941 140,363 144,819 131,785 141,900 150,694 150,800 153,400 154,200 159,500
C. TOTAL 404,214 409,192 413,562 401,859 408,310 416,014 403,788 399,243 387,067 378,584
OIL (1000 BBLS) 9,854 10,425 2,000 2,441 2,001 2,100 2,962 2,900 2,800 2,850
! Includes unplugged Tully Valley Brine Wells for 1993, 1994 & 1995. * Statistics for lines 2 - 15 are based upon received completions reports from the operators. Statistics computed on June 18, 1996.
NYSDEC - Division of Mineral Resources 23 Twelfth Annual Report
New York State Oil, Gas and Mineral Resources
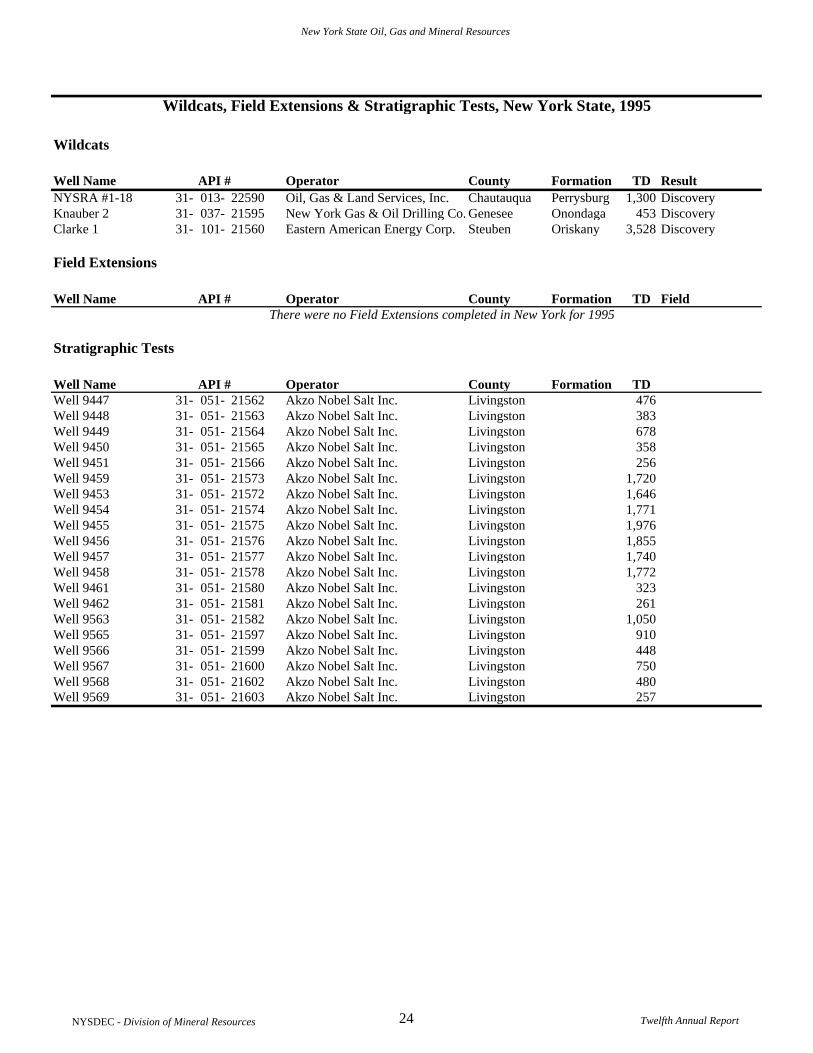
Wildcats, Field Extensions & Stratigraphic Tests, New York State, 1995
Wildcats
Well Name API # Operator County Formation TD ResultNYSRA #1-18 31- 013- 22590 Oil, Gas & Land Services, Inc. Chautauqua Perrysburg 1,300 DiscoveryKnauber 2 31- 037- 21595 New York Gas & Oil Drilling Co. Genesee Onondaga 453 DiscoveryClarke 1 31- 101- 21560 Eastern American Energy Corp. Steuben Oriskany 3,528 Discovery
Field Extensions
Well Name API # Operator County Formation TD FieldThere were no Field Extensions completed in New York for 1995
Stratigraphic Tests
Well Name API # Operator County Formation TDWell 9447 31- 051- 21562 Akzo Nobel Salt Inc. Livingston 476Well 9448 31- 051- 21563 Akzo Nobel Salt Inc. Livingston 383Well 9449 31- 051- 21564 Akzo Nobel Salt Inc. Livingston 678Well 9450 31- 051- 21565 Akzo Nobel Salt Inc. Livingston 358Well 9451 31- 051- 21566 Akzo Nobel Salt Inc. Livingston 256Well 9459 31- 051- 21573 Akzo Nobel Salt Inc. Livingston 1,720Well 9453 31- 051- 21572 Akzo Nobel Salt Inc. Livingston 1,646Well 9454 31- 051- 21574 Akzo Nobel Salt Inc. Livingston 1,771Well 9455 31- 051- 21575 Akzo Nobel Salt Inc. Livingston 1,976Well 9456 31- 051- 21576 Akzo Nobel Salt Inc. Livingston 1,855Well 9457 31- 051- 21577 Akzo Nobel Salt Inc. Livingston 1,740Well 9458 31- 051- 21578 Akzo Nobel Salt Inc. Livingston 1,772Well 9461 31- 051- 21580 Akzo Nobel Salt Inc. Livingston 323Well 9462 31- 051- 21581 Akzo Nobel Salt Inc. Livingston 261Well 9563 31- 051- 21582 Akzo Nobel Salt Inc. Livingston 1,050Well 9565 31- 051- 21597 Akzo Nobel Salt Inc. Livingston 910Well 9566 31- 051- 21599 Akzo Nobel Salt Inc. Livingston 448Well 9567 31- 051- 21600 Akzo Nobel Salt Inc. Livingston 750Well 9568 31- 051- 21602 Akzo Nobel Salt Inc. Livingston 480Well 9569 31- 051- 21603 Akzo Nobel Salt Inc. Livingston 257
NYSDEC - Division of Mineral Resources 24 Twelfth Annual Report

New York State Oil, Gas and Mineral Resources, 1995
Permits Issued During 1995
API Spud WellCounty Town Owner Number Well Name TD Date Type FormationAllegany Andover Otis Eastern Service Inc 003 - 22577 D. Duke #1-D 1,405 6/27/95 OD Fulmer Valley Allegany Andover Otis Eastern Service Inc 003 - 22578 H. Ford #2-F 1,525 6/23/95 OD Fulmer Valley Allegany Andover Otis Eastern Service Inc 003 - 22579 J. Dean #2 1,525 6/15/95 OD Fulmer Valley Allegany Andover Otis Eastern Service Inc 003 - 22580 B. Clark #1-C 1,225 6/20/95 OD Fulmer Valley Allegany Andover Otis Eastern Service Inc 003 - 22581 Lot 47 #3A 4,906 8/15/95 RI Fulmer Valley Allegany Bolivar J. J. Bucher Producing Corp. 003 - 22552 Wheeler #88 1,548 3/14/95 IW Richburg Allegany Genesee Smith, Ronald L. 003 - 22589 Bliss #27 0 **/**/** EX Allegany Independence National Fuel Gas Supply Corp. 003 - 14571 Whitesell, A #SC546 4775 12/5/79 RI Oriskany Allegany Independence Richardson Petroleum Corp 003 - 22595 Mattison #1 1,999 9/27/95 OD Fulmer Valley Allegany Independence Richardson Petroleum Corp 003 - 22602 Mattison #3 0 **/**/** CN Allegany Willing Seneca Resources Corp. 003 - 20116 NFG (Cunningham) #SC490 4935 11/11/85 RI Oriskany Broome Kirkwood Belden & Blake Corporation 007 - 21568 Beagell 01 5,289 10/21/95 DH Cattaraugus Allegany Hydro-Carbon Generation Inc. 009 - 22548 Sherwin-Benson #7 0 **/**/** CN Cattaraugus Allegany Hydro-Carbon Generation Inc. 009 - 22551 Zink-Benson #1 3,695 4/6/95 GD Oriskany Cattaraugus Allegany Putt, Floyd J. 009 - 22576 Fee #1A 1,283 5/19/95 OD Bradford Cattaraugus Ashford A. J. Lease Account 009 - 22597 Ford #1 0 10/20/95 CN Cattaraugus Ashford A. J. Lease Account 009 - 22593 Nagel Unit #1 3,938 8/16/95 OD Medina Cattaraugus New Albion Matrix Energy Development 009 - 22563 Reid M. #1 4,135 3/31/95 GD Medina Cattaraugus Olean East Resources, Inc. 009 - 22572 Coast #101 2,025 5/15/95 OD Bradford Cattaraugus Yorkshire A. J. Lease Account 009 - 22566 Medina Power Co MPC #3 3,459 4/13/95 GD Medina Cattaraugus Yorkshire A. J. Lease Account 009 - 22545 Medina Power Co.#2 3,432 2/22/95 GD Medina Chautauqua Busti Curtis & Son Oil, Inc. 013 - 22573 Anderson #13 770 8/11/95 OD Glade Chautauqua Busti Decker, Lucille B. 013 - 22550 Tellinghusion/Potter D-1 655 3/2/95 OD Glade Chautauqua Busti Libra Petroleum Co 013 - 22598 Crandall, L #33 0 10/31/95 CN Chautauqua Busti Libra Petroleum Co 013 - 22599 Crandall, L #35 0 4/17/96 CN Chautauqua Busti Libra Petroleum Co 013 - 22600 Crandall, L #34 0 11/6/95 CN Chautauqua Busti Libra Petroleum Co 013 - 22601 Crandall, L #39 0 4/19/96 CN Chautauqua Busti Pefley Oil & Gas Inc. 013 15263 Babyak #2 4476 7/7/80 RI MedinaChautauqua Busti Pefley Oil & Gas Inc. 013 22506 Nelson, M #8G 539 3/30/95 RI GladeChautauqua Busti Pefley Oil & Gas Inc. 013 22508 Nelson, M #6GA 0 9/6/95 RI Chautauqua Busti Pefley Oil & Gas Inc. 013 22512 Drayer #8GA 0 9/12/95 RI Chautauqua Charlotte Belden & Blake Corporation 013 - 22586 Healy #2 #8471 3,375 8/7/95 GD Medina Chautauqua Charlotte Matrix Energy Development 013 - 22542 Hadley, G. #1A 3,630 2/21/95 GD Medina Chautauqua Charlotte Oil, Gas & Land Services, Inc. 013 - 22582 NYSRA #1-13 0 7/12/95 CN Medina Chautauqua Charlotte Oil, Gas & Land Services, Inc. 013 - 22590 NYSRA #1-18 1,300 8/3/95 OW PerrysburgChautauqua Chautauqua Schreiner Oil & Gas Inc. 013 - 22547 Laporte #2 3,151 3/30/95 GD Medina Chautauqua Chautauqua Schreiner Oil & Gas Inc. 013 - 22565 Reynolds #1 3,120 6/27/95 GD Medina Chautauqua Ellery Matrix Energy Development 013 - 22539 Parker, D #1 4,200 1/24/95 GD Medina Chautauqua Ellery New York Gas & Oil Drilling Co 013 - 22588 Gorczyca #1 7,136 7/12/95 CN Chautauqua Ellicott Nornew,Inc 013 - 22567 Mt Olivet Cemetery #1 4,188 4/21/95 GD Medina Chautauqua Gerry Oil, Gas & Land Services, Inc. 013 - 22540 Winton-Oag 1 2,481 1/18/95 GD Onondaga Chautauqua Gerry Oil, Gas & Land Services, Inc. 013 - 22541 OAG 9 2,448 1/27/95 GD Onondaga Chautauqua Gerry Oil, Gas & Land Services, Inc. 013 - 22549 Gross #8 3,628 2/21/95 GD Onondaga Chautauqua Gerry Oil, Gas & Land Services, Inc. 013 - 22553 Boy's Club #1 3,788 3/20/95 GD Medina Chautauqua Gerry Oil, Gas & Land Services, Inc. 013 - 22560 Lindstrom #2 3,712 3/24/95 OD Bass Island Chautauqua Gerry Oil, Gas & Land Services, Inc. 013 - 22561 VFD #1 3,764 3/28/95 GD Medina Chautauqua Gerry Oil, Gas & Land Services, Inc. 013 - 22564 Boy's Club #2 3,790 4/1/95 GD Medina Chautauqua Gerry Oil, Gas & Land Services, Inc. 013 - 22583 Picard #1 3,766 6/29/95 GD Medina Chautauqua North Harmony Chautauqua Energy Inc. 013 20393 Butts #1A 4091 **/**/**** RI OnondagaChautauqua North Harmony Resource America, Inc. 013 - 22592 Carlson #2B 2,913 11/29/95 OD Onondaga Chautauqua Portland Belden & Blake Corporation 013 - 22587 Morrison #2 #8472 2,708 7/31/95 GD Medina Chautauqua Portland Schreiner Oil & Gas Inc. 013 - 22546 Wiseman #1 3,052 3/30/95 GD Medina Chautauqua Stockton Belden & Blake Corporation 013 - 22584 Barber #2 #8470 3,575 7/12/95 GD Medina Chautauqua Stockton Belden & Blake Corporation 013 - 22585 Buseck #2 #8469 3,505 7/20/95 GD Medina Chautauqua Westfield Schreiner Oil & Gas Inc. 013 - 22596 Schofield S.P. 127 #1 5,935 12/13/95 DW Erie Cheektowaga Saint Barnabas R.C. Church 029 - 22591 Fee #2 1,102 2/1/96 GD Medina
NYSDEC - Division of Mineral Resources 25 Twelfth Annual Report

New York State Oil, Gas and Mineral Resources, 1995
Permits Issued During 1995
API Spud WellCounty Town Owner Number Well Name TD Date Type FormationErie Colden Matrix Energy Development 029 - 22562 Walek E. #1 2,825 3/31/95 GD Medina Erie Concord U S Energy Development Corp 029 - 22603 Dzara Unit #1 0 5/28/96 CN Erie Orchard Park Schreiner Oil & Gas Inc. 029 - 22543 DPS #1 1,876 3/14/95 GD Medina Erie Orchard Park Schreiner Oil & Gas Inc. 029 - 22544 DPS #2 1,800 3/7/95 GD Medina Genesee Darien New York Gas & Oil Drilling Co 037 - 21596 Grant 1 465 5/19/95 GD Onondaga Genesee Darien New York Gas & Oil Drilling Co 037 - 21594 Knauber 1 452 5/23/95 GD Medina Genesee Darien New York Gas & Oil Drilling Co 037 - 21595 Knauber 2 453 5/12/95 GW Onondaga Genesee Darien New York Gas & Oil Drilling Co 037 - 21619 Knauber 3 0 **/**/** TR Livingston Avon Akzo Nobel Salt Inc 051 - 21603 Well 9569 257 9/26/95 SG Livingston Avon Akzo Nobel Salt Inc 051 - 21604 Well 9570 207 10/23/95 SG Livingston Avon Akzo Nobel Salt Inc 051 - 21605 Well 9571 0 **/**/** SG Livingston Geneseo Akzo Nobel Salt Inc 051 - 21574 Well 9454 1,771 3/4/95 SG Livingston Groveland Akzo Nobel Salt Inc 051 - 21575 Well 9455 1,976 1/25/95 SG Livingston Groveland Akzo Nobel Salt Inc 051 - 21576 Well 9456 1,855 1/9/95 SG Livingston Groveland Akzo Nobel Salt Inc 051 - 21577 Well 9457 1,740 3/1/95 SG Livingston Groveland Akzo Nobel Salt Inc 051 - 21578 Well 9458 1,772 2/3/95 SG Livingston Groveland Akzo Nobel Salt Inc 051 - 21582 Well 9563 1,050 2/7/95 SG Livingston Groveland Akzo Nobel Salt Inc 051 - 21583 Well 9564 0 **/**/** EX Livingston Groveland Akzo Nobel Salt Inc 051 - 21597 Well 9565 910 5/4/95 SG Livingston Groveland Akzo Nobel Salt Inc 051 - 21599 Well 9566 448 8/28/95 SG Livingston Groveland Akzo Nobel Salt Inc 051 - 21600 Well 9567 750 12/5/95 SG Livingston Leicester Akzo Nobel Salt Inc 051 - 21562 Well 9447 476 5/9/95 RI Livingston Leicester Akzo Nobel Salt Inc 051 - 21563 Well 9448 383 5/1/95 RI Livingston Leicester Akzo Nobel Salt Inc 051 - 21579 Well 9460 571 3/21/95 OB Livingston Leicester Akzo Nobel Salt Inc 051 - 21580 Well 9461 323 8/8/95 SG Livingston Leicester Akzo Nobel Salt Inc 051 - 21581 Well 9462 261 7/25/95 SG Livingston Leicester Akzo Nobel Salt Inc 051 - 21602 Well 9568 480 8/14/95 SG Livingston Leicester Akzo Nobel Salt Inc 051 - 21620 Well 9572 1,085 11/18/95 SE Schuyler Reading New York State Electric & Gas 097 - 03892 Watkins Glen 28 2,649 11/8/95 RI Syracuse Schuyler Reading New York State Electric & Gas 097 - 21618 Watkins Glen 59 2,042 9/23/95 ST Syracuse Steuben Avoca Avoca Natural Gas Storage Inc 101 - 21601 Mitchell 2 0 9/11/95 CN Steuben Bath Bath Petroleum Storage Inc. 101 - 21584 BPS 10 3,596 6/20/95 ST Syracuse Steuben Bath Bath Petroleum Storage Inc. 101 - 21588 BPS Well 11 3,777 6/2/95 ST Syracuse Steuben Bath Bath Petroleum Storage Inc. 101 - 21589 BPS Well 12 3,601 7/24/95 ST Syracuse Steuben Bath Bath Petroleum Storage Inc. 101 - 21590 BPS Well 13 3,616 8/27/95 ST Syracuse Steuben Bath Bath Petroleum Storage Inc. 101 - 21598 BPS Well 2A 0 7/12/95 DH Steuben Bath Bath Petroleum Storage Inc. 101 - 21587 BPS Well 9 3,766 5/8/95 ST Syracuse Steuben Erwin Vandermark Exploration Inc 101 - 21591 Erwin Game Management 1 3,768 1/4/96 GW Oriskany Steuben Hornellsville Eastern American Energy Corp. 101 - 21593 Hollands 1 0 **/**/** EX Steuben Pulteney Columbia Natural Resources 101 - 21592 Gray 21625 7,493 6/30/95 GWL Black River Steuben West Union Richardson Petroleum Corp 101 - 21585 Neuenschwander 21 1,850 4/13/95 OD Fulmer Valley Steuben West Union Richardson Petroleum Corp 101 - 21586 Neuenschwander 22 1,849 4/18/95 OD Fulmer Valley Steuben West Union Richardson Petroleum Corp 101 - 21606 Neuenschwander 23 1,226 8/28/95 IW Fulmer Valley Steuben West Union Richardson Petroleum Corp 101 - 21607 Neuenschwander 24 1,223 8/30/95 IW Fulmer Valley Steuben West Union Richardson Petroleum Corp 101 - 21608 Neuenschwander 25 1,215 9/2/95 IW Fulmer Valley Steuben West Union Richardson Petroleum Corp 101 - 21609 Neuenschwander 26 1,211 9/4/95 IW Fulmer Valley Steuben West Union Richardson Petroleum Corp 101 - 21610 Neuenschwander 27 1,202 9/3/95 IW Fulmer Valley Steuben West Union Richardson Petroleum Corp 101 - 21611 Neuenschwander 28 1,215 9/22/95 IW Fulmer Valley Steuben West Union Richardson Petroleum Corp 101 - 21612 Neuenschwander 29 1,234 9/7/95 IW Fulmer Valley Steuben West Union Richardson Petroleum Corp 101 - 21613 Neuenschwander 30 1,231 9/11/95 IW Fulmer Valley Steuben West Union Richardson Petroleum Corp 101 - 21614 Neuenschwander 31 1,176 9/20/95 IW Fulmer Valley Steuben West Union Richardson Petroleum Corp 101 - 21615 Neuenschwander 32 1,263 9/17/95 IW Fulmer Valley Steuben West Union Richardson Petroleum Corp 101 - 21616 Neuenschwander 33 1,231 9/14/95 IW Fulmer Valley Steuben West Union Richardson Petroleum Corp 101 - 21617 Neuenschwander 34 1,206 9/12/95 IW Fulmer Valley Steuben Woodhull CNG Transmission Corp. 101 - 03924 Olin [N650S] 13,500 5/14/96 RI Oriskany Wyoming Bennington United States Gypsum Co. 121 - 22594 Schlossin R #1 1,745 9/5/95 GD Medina
NYSDEC - Division of Mineral Resources 26 Twelfth Annual Report

New York State Oil, Gas and Mineral Resources, 1995
Permits Issued During 1995
API Spud WellCounty Town Owner Number Well Name TD Date Type FormationWyoming Middlebury Texas Brine Corp 121 - 22569 Hooker #119 1,534 6/15/95 BR Salina Wyoming Middlebury Texas Brine Corp 121 - 22570 Hooker #120 1,515 7/10/95 BR Salina Wyoming Middlebury Texas Brine Corp 121 - 22568 Hooker #121 1,523 6/26/95 BR Salina Wyoming Middlebury Texas Brine Corp 121 - 22571 Hooker #122 1,491 7/3/95 BR Salina Wyoming Middlebury Texas Brine Corp 121 - 22575 Hooker #96 1,702 7/31/95 BR Salina Wyoming Middlebury Texas Brine Corp 121 - 22574 Hooker #97 1,601 7/24/95 BR Salina Wyoming Middlebury Texas Brine Corp 121 - 22554 Texas Brine #62 1,402 5/30/95 BR Salina Wyoming Middlebury Texas Brine Corp 121 - 22555 Texas Brine #63 1,428 6/5/95 BR Salina Wyoming Middlebury Texas Brine Corp 121 - 22556 Texas Brine #67 1,395 5/15/95 BR Salina Wyoming Middlebury Texas Brine Corp 121 - 22557 Texas Brine #68 1,400 5/22/95 BR Salina Wyoming Middlebury Texas Brine Corp 121 - 22558 Texas Brine #69 0 6/27/96 BR Wyoming Middlebury Texas Brine Corp 121 - 22559 Texas Brine #70 0 6/13/96 BR
NYSDEC - Division of Mineral Resources 27 Twelfth Annual Report

New York State Oil, Gas and Mineral Resources, 1995
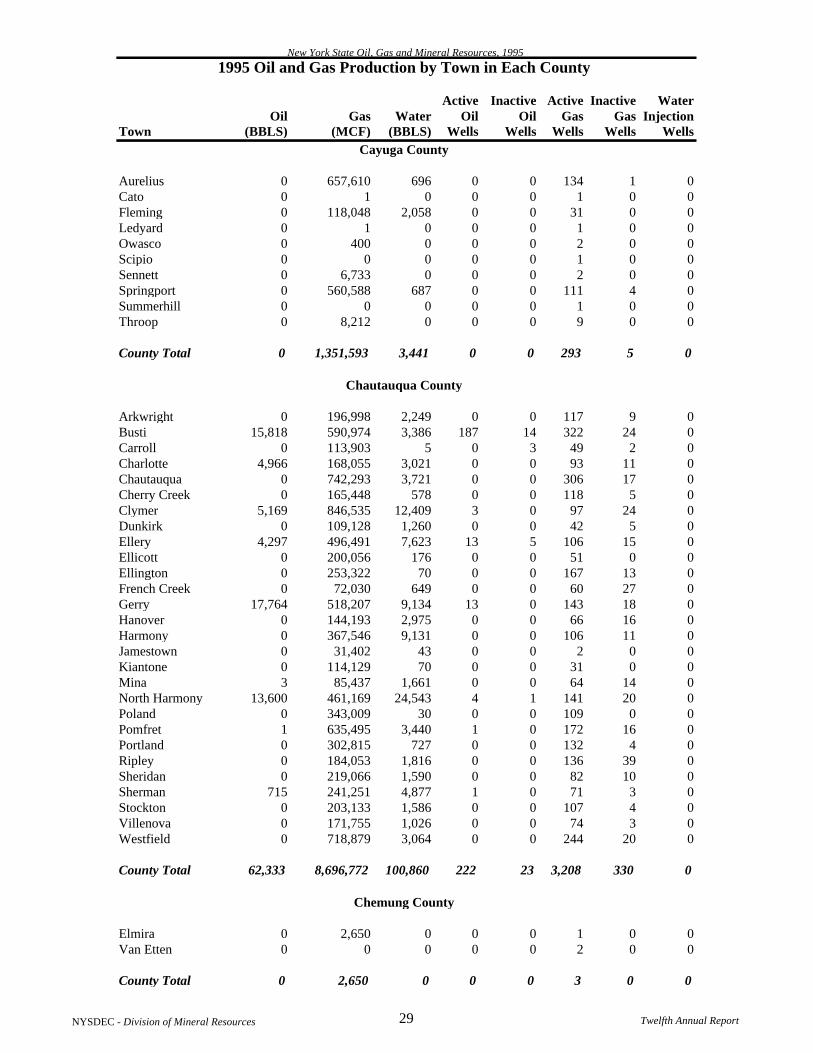
1995 Oil and Gas Production by Town in Each County
Active Inactive Active Inactive WaterOil Gas Water Oil Oil Gas Gas Injection
Town (BBLS) (MCF) (BBLS) Wells Wells Wells Wells Wells
Allegany County
Alfred 0 0 0 0 0 0 1 0Alma 4,612 18,768 5,078 240 85 32 3 48Almond 0 0 0 0 0 0 1 0Amity 170 43,078 929 4 0 20 1 0Andover 4,251 331 2,095 84 18 21 0 0Bolivar 8,046 2,228 29,836 388 283 5 0 180Caneadea 0 0 0 0 0 0 1 0Centerville 0 0 0 0 0 0 1 0Clarksville 554 40 60 10 9 0 0 0Friendship 123 634 219 1 0 1 0 0Genesee 1,274 5,975 755 43 116 27 4 70Independence 19,546 49,698 80,371 233 1 4 2 28Scio 262 27,172 1,874 99 90 6 1 21Ward 2 210 0 0 0 14 14 8Wellsville 3,231 50 120 83 25 2 0 7Willing 0 95,476 1 0 30 2 9 0Wirt 1,222 0 1,740 100 59 0 2 0
County Total 43,293 243,660 123,078 1,285 716 134 40 362
Cattaraugus County
Allegany 51,840 4,698 416,346 745 67 44 3 237Ashford 0 22,373 5 1 0 11 7 0Carrollton 60,420 112,781 10,726 554 110 7 4 28Cold Spring 0 0 0 1 0 4 0 0Conewango 0 260,222 23 0 0 76 2 0Dayton 0 78,297 66 0 0 46 0 0East Otto 0 5,923 72 0 0 7 2 0Ellicottville 0 11,579 3 0 0 12 1 0Farmersville 213 0 0 3 1 0 2 0Freedom 0 6,857 1 0 0 8 2 0Great Valley 0 1,458 0 0 0 1 0 0Hinsdale 25 0 2 4 0 0 0 0Leon 0 826,842 148 0 0 75 5 0Little Valley 0 200 0 0 0 1 0 0Machias 0 6,592 0 0 0 3 3 0Mansfield 0 0 0 0 0 1 0 0Napoli 0 3,770 0 0 0 3 1 0New Albion 0 9,989 0 0 0 11 1 0Olean 5,750 188,385 341 105 61 1 0 142Otto 0 94,964 448 0 0 50 8 0Perrysburg 0 588 0 0 0 8 0 0Persia 0 177,329 0 0 0 78 1 0Portville 57 0 0 5 0 0 0 0Randolph 631 173,248 6 0 0 86 0 0South Valley 0 2,388 0 0 0 2 0 0Yorkshire 0 62,275 12 0 0 16 1 0
County Total 118,936 2,050,758 428,199 1,418 239 551 43 407
NYSDEC - Division of Mineral Resources 28 Twelfth Annual Report
New York State Oil, Gas and Mineral Resources, 1995
1995 Oil and Gas Production by Town in Each County
Active Inactive Active Inactive WaterOil Gas Water Oil Oil Gas Gas Injection
Town (BBLS) (MCF) (BBLS) Wells Wells Wells Wells WellsCayuga County
Aurelius 0 657,610 696 0 0 134 1 0Cato 0 1 0 0 0 1 0 0Fleming 0 118,048 2,058 0 0 31 0 0Ledyard 0 1 0 0 0 1 0 0Owasco 0 400 0 0 0 2 0 0Scipio 0 0 0 0 0 1 0 0Sennett 0 6,733 0 0 0 2 0 0Springport 0 560,588 687 0 0 111 4 0Summerhill 0 0 0 0 0 1 0 0Throop 0 8,212 0 0 0 9 0 0
County Total 0 1,351,593 3,441 0 0 293 5 0
Chautauqua County
Arkwright 0 196,998 2,249 0 0 117 9 0Busti 15,818 590,974 3,386 187 14 322 24 0Carroll 0 113,903 5 0 3 49 2 0Charlotte 4,966 168,055 3,021 0 0 93 11 0Chautauqua 0 742,293 3,721 0 0 306 17 0Cherry Creek 0 165,448 578 0 0 118 5 0Clymer 5,169 846,535 12,409 3 0 97 24 0Dunkirk 0 109,128 1,260 0 0 42 5 0Ellery 4,297 496,491 7,623 13 5 106 15 0Ellicott 0 200,056 176 0 0 51 0 0Ellington 0 253,322 70 0 0 167 13 0French Creek 0 72,030 649 0 0 60 27 0Gerry 17,764 518,207 9,134 13 0 143 18 0Hanover 0 144,193 2,975 0 0 66 16 0Harmony 0 367,546 9,131 0 0 106 11 0Jamestown 0 31,402 43 0 0 2 0 0Kiantone 0 114,129 70 0 0 31 0 0Mina 3 85,437 1,661 0 0 64 14 0North Harmony 13,600 461,169 24,543 4 1 141 20 0Poland 0 343,009 30 0 0 109 0 0Pomfret 1 635,495 3,440 1 0 172 16 0Portland 0 302,815 727 0 0 132 4 0Ripley 0 184,053 1,816 0 0 136 39 0Sheridan 0 219,066 1,590 0 0 82 10 0Sherman 715 241,251 4,877 1 0 71 3 0Stockton 0 203,133 1,586 0 0 107 4 0Villenova 0 171,755 1,026 0 0 74 3 0Westfield 0 718,879 3,064 0 0 244 20 0
County Total 62,333 8,696,772 100,860 222 23 3,208 330 0
Chemung County
Elmira 0 2,650 0 0 0 1 0 0Van Etten 0 0 0 0 0 2 0 0
County Total 0 2,650 0 0 0 3 0 0
NYSDEC - Division of Mineral Resources 29 Twelfth Annual Report

New York State Oil, Gas and Mineral Resources, 1995
1995 Oil and Gas Production by Town in Each County
Active Inactive Active Inactive WaterOil Gas Water Oil Oil Gas Gas Injection
Town (BBLS) (MCF) (BBLS) Wells Wells Wells Wells Wells
Erie County
Alden 0 80,657 711 0 0 54 9 0Amherst 0 0 0 0 0 0 1 0Aurora 0 97,181 1,095 0 0 42 9 0Boston 0 55,637 610 0 0 34 0 0Brant 0 224,729 3,637 0 0 106 7 0Buffalo 0 610 0 0 0 1 0 0Cheektowaga 0 4,547 0 0 0 9 0 0Clarence 0 2,134 1 0 0 4 1 0Colden 0 4,849 0 0 0 9 1 0Collins 0 1,410 0 0 0 4 0 0Concord 0 207,775 472 0 0 58 0 0Eden 0 177,935 2,736 0 0 131 13 0Elma 0 173,508 784 0 0 40 12 0Evans 0 209,366 3,171 0 0 87 15 0Hamburg 0 119,699 160 0 0 41 6 0Holland 0 0 0 0 0 1 2 0Lackawanna 0 1,154 0 0 0 2 1 0Lancaster 0 78,150 5 0 0 25 4 0Marilla 0 42,382 76 0 0 27 9 0Newstead 0 245,150 190 0 0 49 11 0North Collins 0 71,584 362 0 0 52 9 0Orchard Park 67 52,817 30 1 0 31 8 0Sardinia 0 26,482 29 0 0 13 0 0Tonawanda 0 1,994 0 0 0 6 1 0Wales 0 13,322 337 0 0 10 4 0West Seneca 0 14,122 0 0 0 4 1 0
County Total 67 1,907,194 14,406 1 0 840 124 0
Genesee County
Alabama 0 29,504 100 0 0 28 0 0Alexander 0 68,189 917 0 0 35 0 0Batavia 0 69,915 363 0 0 41 5 0Bergen 0 56,656 0 0 0 3 0 0Bethany 0 30,133 1,447 0 0 29 0 0Darien 0 535,244 2,554 0 0 207 4 0Elba 0 3,578 168 0 0 1 0 0Le Roy 0 31,891 0 0 0 10 0 0Oakfield 0 21,416 68 0 0 13 0 0Pavilion 0 26,464 0 0 0 20 1 0Pembroke 0 211,228 781 0 0 108 2 0Stafford 0 365 0 0 0 2 0 0
County Total 0 1,084,583 6,398 0 0 497 12 0
Livingston County
Avon 0 20,145 0 0 0 13 3 0Caledonia 0 70,038 230 0 0 48 0 1Groveland 0 0 0 0 0 2 0 0Leicester 0 51,277 215 0 0 18 4 0
NYSDEC - Division of Mineral Resources 30 Twelfth Annual Report

New York State Oil, Gas and Mineral Resources, 1995
1995 Oil and Gas Production by Town in Each County
Active Inactive Active Inactive WaterOil Gas Water Oil Oil Gas Gas Injection
Town (BBLS) (MCF) (BBLS) Wells Wells Wells Wells WellsPortage 0 1,234 0 0 0 1 0 0
Livingston County (Cont)
Sparta 0 0 0 0 0 0 1 0West Sparta 0 50 0 0 0 8 0 0York 0 56,477 0 0 0 50 6 0
County Total 0 199,221 445 0 0 140 14 1
Madison County
Brookfield 0 0 0 0 0 1 0 0Lebanon 0 43,651 0 0 0 3 0 0
County Total 0 43,651 0 0 0 4 0 0
Niagara County
Lewiston 0 1,500 0 0 0 1 0 0
County Total 0 1,500 0 0 0 1 0 0
Oneida County
Sangerfield 0 0 0 0 0 1 2 0
County Total 0 0 0 0 0 1 2 0
Onondaga County
Lafayette 0 0 0 0 0 0 0 1Lysander 0 0 0 0 0 1 1 0
County Total 0 0 0 0 0 1 1 1
Ontario County
Bristol 0 7,906 0 0 0 3 0 0East Bloomfield 0 61,704 0 0 0 12 2 0Geneva 0 1,241 0 0 0 2 1 0Phelps 0 0 0 0 0 0 1 0Richmond 0 2,471 0 0 0 2 0 0West Bloomfield 0 4,993 0 0 0 2 0 0
County Total 0 78,315 0 0 0 21 4 0
Oswego County
Richland 0 100 0 0 0 3 5 0West Monroe 0 0 0 0 0 1 0 0Williamstown 0 100 0 0 0 1 1 0
County Total 0 200 0 0 0 5 6 0
NYSDEC - Division of Mineral Resources 31 Twelfth Annual Report

New York State Oil, Gas and Mineral Resources, 1995
1995 Oil and Gas Production by Town in Each County
Active Inactive Active Inactive WaterOil Gas Water Oil Oil Gas Gas Injection
Town (BBLS) (MCF) (BBLS) Wells Wells Wells Wells Wells
Seneca County
Fayette 0 427,399 1,179 0 0 92 1 0Junius 0 0 0 0 0 1 0 0Seneca Falls 0 1,750 0 0 0 1 0 0Varick 0 187,242 561 0 0 44 0 0Waterloo 0 0 0 0 0 0 1 0
County Total 0 616,391 1,740 0 0 138 2 0
Steuben County
Avoca 0 1,923 0 0 0 2 3 0Bath 0 24,306 2 0 0 2 0 0Cameron 0 0 0 0 0 1 1 0Canisteo 0 0 0 0 0 0 1 0Dansville 0 28,009 0 0 0 1 0 0Greenwood 444 1,200 2,220 4 0 1 0 0Hartsville 0 0 0 0 0 1 2 0Hornby 0 2,889 331 0 0 2 1 0Hornellsville 0 5,577 0 0 0 1 0 0Howard 0 2,239 0 0 0 2 0 0Jasper 0 69,566 6 0 0 2 5 0Pulteney 0 0 0 0 0 0 2 0Troupsburg 0 0 0 0 0 0 1 0West Union 11,660 10,013 1,211 111 0 1 3 11
County Total 12,104 145,722 3,770 115 0 16 19 11
Tioga County
Nichols 0 225,950 26 0 0 4 0 0Owego 0 1,606,658 307 0 0 5 4 0
County Total 0 1,832,608 333 0 0 9 4 0
Wayne County
Butler 0 990 0 0 0 1 0 0
County Total 0 990 0 0 0 1 0 0
Wyoming County
Arcade 0 65,595 7 0 0 38 1 0Attica 0 22,360 0 0 0 1 0 0Bennington 0 200,077 2,237 0 0 88 2 0Castile 0 2,910 15 0 0 1 0 0Covington 0 36,186 40 0 0 21 5 0Genesee Falls 0 0 0 0 0 0 1 0Java 0 21,488 23 0 0 22 1 0Middlebury 0 0 0 0 0 0 8 0Perry 0 76,710 195 0 0 41 3 0
NYSDEC - Division of Mineral Resources 32 Twelfth Annual Report

New York State Oil, Gas and Mineral Resources, 1995
1995 Oil and Gas Production by Town in Each County
Active Inactive Active Inactive WaterOil Gas Water Oil Oil Gas Gas Injection
Town (BBLS) (MCF) (BBLS) Wells Wells Wells Wells WellsSheldon 0 50,090 863 0 0 42 1 0
Wyoming County (Cont)
Warsaw 0 3,720 0 0 0 6 0 0
County Total 0 479,136 3,380 0 0 260 22 0
Yates County
Barrington 0 0 0 0 0 0 1 0Benton 0 8,646 0 0 0 9 2 0Milo 0 181 0 0 0 1 0 0Potter 0 0 0 0 0 0 1 0Torrey 0 3,286 0 0 0 1 0 0
County Total 0 12,113 0 0 0 11 4 0
State Total 236,733 18,747,057 686,050 3,041 978 6,134 632 782
NYSDEC - Division of Mineral Resources 33 Twelfth Annual Report
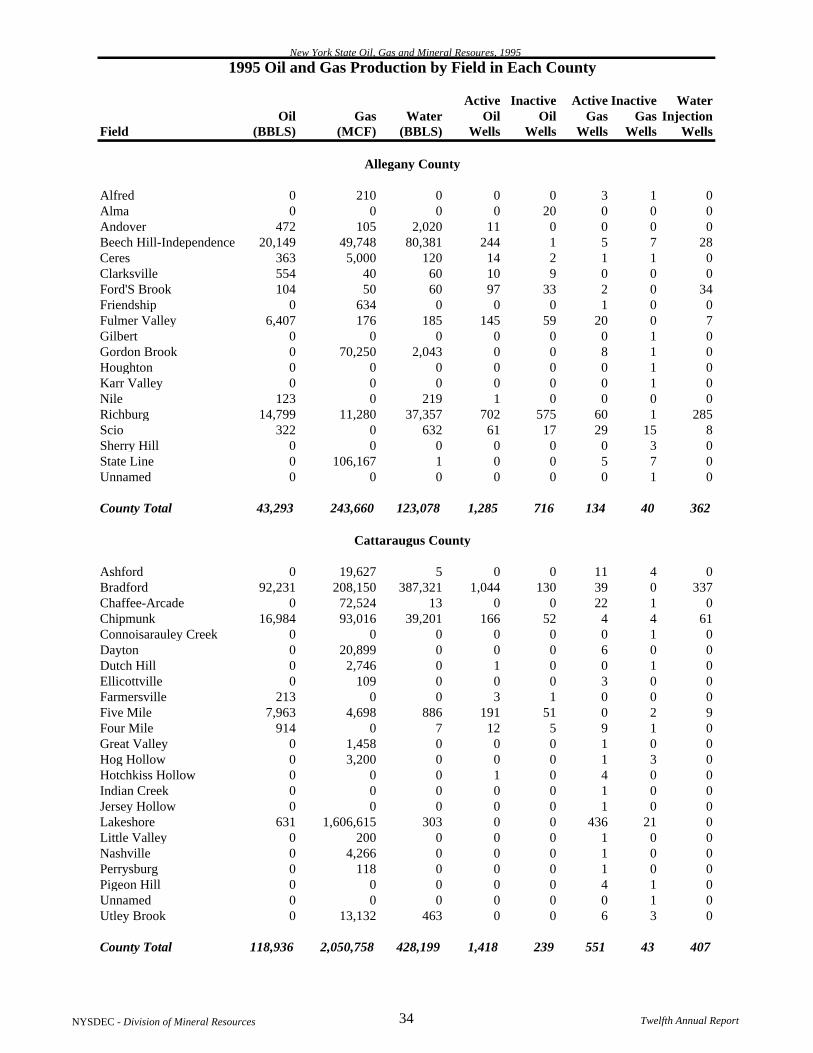
New York State Oil, Gas and Mineral Resoures, 1995
1995 Oil and Gas Production by Field in Each County
Active Inactive Active Inactive WaterOil Gas Water Oil Oil Gas Gas Injection
Field (BBLS) (MCF) (BBLS) Wells Wells Wells Wells Wells
Allegany County
Alfred 0 210 0 0 0 3 1 0Alma 0 0 0 0 20 0 0 0Andover 472 105 2,020 11 0 0 0 0Beech Hill-Independence 20,149 49,748 80,381 244 1 5 7 28Ceres 363 5,000 120 14 2 1 1 0Clarksville 554 40 60 10 9 0 0 0Ford'S Brook 104 50 60 97 33 2 0 34Friendship 0 634 0 0 0 1 0 0Fulmer Valley 6,407 176 185 145 59 20 0 7Gilbert 0 0 0 0 0 0 1 0Gordon Brook 0 70,250 2,043 0 0 8 1 0Houghton 0 0 0 0 0 0 1 0Karr Valley 0 0 0 0 0 0 1 0Nile 123 0 219 1 0 0 0 0Richburg 14,799 11,280 37,357 702 575 60 1 285Scio 322 0 632 61 17 29 15 8Sherry Hill 0 0 0 0 0 0 3 0State Line 0 106,167 1 0 0 5 7 0Unnamed 0 0 0 0 0 0 1 0
County Total 43,293 243,660 123,078 1,285 716 134 40 362
Cattaraugus County
Ashford 0 19,627 5 0 0 11 4 0Bradford 92,231 208,150 387,321 1,044 130 39 0 337Chaffee-Arcade 0 72,524 13 0 0 22 1 0Chipmunk 16,984 93,016 39,201 166 52 4 4 61Connoisarauley Creek 0 0 0 0 0 0 1 0Dayton 0 20,899 0 0 0 6 0 0Dutch Hill 0 2,746 0 1 0 0 1 0Ellicottville 0 109 0 0 0 3 0 0Farmersville 213 0 0 3 1 0 0 0Five Mile 7,963 4,698 886 191 51 0 2 9Four Mile 914 0 7 12 5 9 1 0Great Valley 0 1,458 0 0 0 1 0 0Hog Hollow 0 3,200 0 0 0 1 3 0Hotchkiss Hollow 0 0 0 1 0 4 0 0Indian Creek 0 0 0 0 0 1 0 0Jersey Hollow 0 0 0 0 0 1 0 0Lakeshore 631 1,606,615 303 0 0 436 21 0Little Valley 0 200 0 0 0 1 0 0Nashville 0 4,266 0 0 0 1 0 0Perrysburg 0 118 0 0 0 1 0 0Pigeon Hill 0 0 0 0 0 4 1 0Unnamed 0 0 0 0 0 0 1 0Utley Brook 0 13,132 463 0 0 6 3 0
County Total 118,936 2,050,758 428,199 1,418 239 551 43 407
NYSDEC - Division of Mineral Resources 34 Twelfth Annual Report
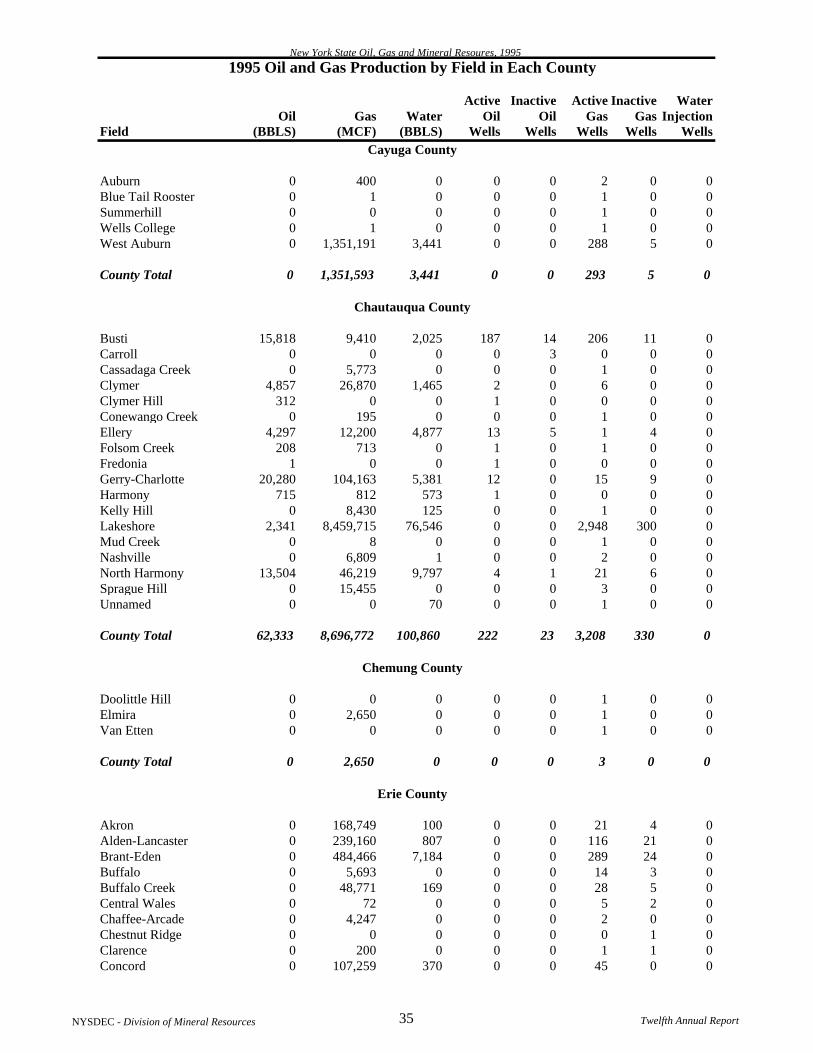
New York State Oil, Gas and Mineral Resoures, 1995
1995 Oil and Gas Production by Field in Each County
Active Inactive Active Inactive WaterOil Gas Water Oil Oil Gas Gas Injection
Field (BBLS) (MCF) (BBLS) Wells Wells Wells Wells WellsCayuga County
Auburn 0 400 0 0 0 2 0 0Blue Tail Rooster 0 1 0 0 0 1 0 0Summerhill 0 0 0 0 0 1 0 0Wells College 0 1 0 0 0 1 0 0West Auburn 0 1,351,191 3,441 0 0 288 5 0
County Total 0 1,351,593 3,441 0 0 293 5 0
Chautauqua County
Busti 15,818 9,410 2,025 187 14 206 11 0Carroll 0 0 0 0 3 0 0 0Cassadaga Creek 0 5,773 0 0 0 1 0 0Clymer 4,857 26,870 1,465 2 0 6 0 0Clymer Hill 312 0 0 1 0 0 0 0Conewango Creek 0 195 0 0 0 1 0 0Ellery 4,297 12,200 4,877 13 5 1 4 0Folsom Creek 208 713 0 1 0 1 0 0Fredonia 1 0 0 1 0 0 0 0Gerry-Charlotte 20,280 104,163 5,381 12 0 15 9 0Harmony 715 812 573 1 0 0 0 0Kelly Hill 0 8,430 125 0 0 1 0 0Lakeshore 2,341 8,459,715 76,546 0 0 2,948 300 0Mud Creek 0 8 0 0 0 1 0 0Nashville 0 6,809 1 0 0 2 0 0North Harmony 13,504 46,219 9,797 4 1 21 6 0Sprague Hill 0 15,455 0 0 0 3 0 0Unnamed 0 0 70 0 0 1 0 0
County Total 62,333 8,696,772 100,860 222 23 3,208 330 0
Chemung County
Doolittle Hill 0 0 0 0 0 1 0 0Elmira 0 2,650 0 0 0 1 0 0Van Etten 0 0 0 0 0 1 0 0
County Total 0 2,650 0 0 0 3 0 0
Erie County
Akron 0 168,749 100 0 0 21 4 0Alden-Lancaster 0 239,160 807 0 0 116 21 0Brant-Eden 0 484,466 7,184 0 0 289 24 0Buffalo 0 5,693 0 0 0 14 3 0Buffalo Creek 0 48,771 169 0 0 28 5 0Central Wales 0 72 0 0 0 5 2 0Chaffee-Arcade 0 4,247 0 0 0 2 0 0Chestnut Ridge 0 0 0 0 0 0 1 0Clarence 0 200 0 0 0 1 1 0Concord 0 107,259 370 0 0 45 0 0
NYSDEC - Division of Mineral Resources 35 Twelfth Annual Report
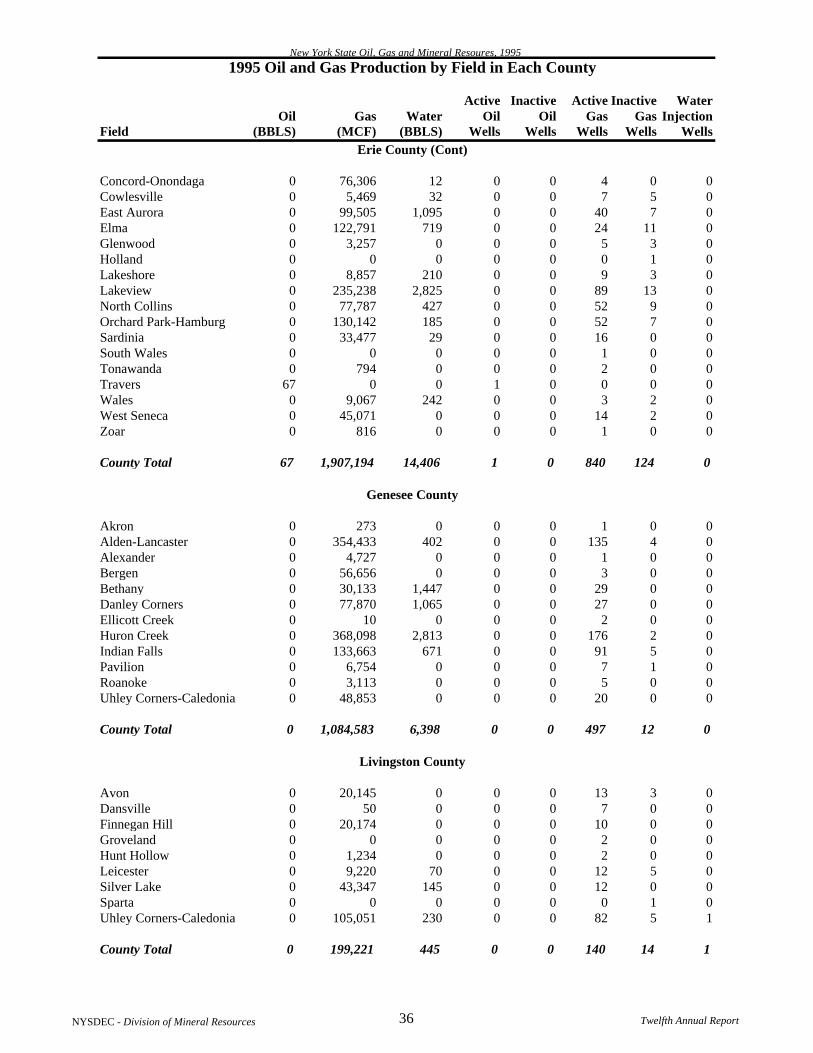
New York State Oil, Gas and Mineral Resoures, 1995
1995 Oil and Gas Production by Field in Each County
Active Inactive Active Inactive WaterOil Gas Water Oil Oil Gas Gas Injection
Field (BBLS) (MCF) (BBLS) Wells Wells Wells Wells WellsErie County (Cont)
Concord-Onondaga 0 76,306 12 0 0 4 0 0Cowlesville 0 5,469 32 0 0 7 5 0East Aurora 0 99,505 1,095 0 0 40 7 0Elma 0 122,791 719 0 0 24 11 0Glenwood 0 3,257 0 0 0 5 3 0Holland 0 0 0 0 0 0 1 0Lakeshore 0 8,857 210 0 0 9 3 0Lakeview 0 235,238 2,825 0 0 89 13 0North Collins 0 77,787 427 0 0 52 9 0Orchard Park-Hamburg 0 130,142 185 0 0 52 7 0Sardinia 0 33,477 29 0 0 16 0 0South Wales 0 0 0 0 0 1 0 0Tonawanda 0 794 0 0 0 2 0 0Travers 67 0 0 1 0 0 0 0Wales 0 9,067 242 0 0 3 2 0West Seneca 0 45,071 0 0 0 14 2 0Zoar 0 816 0 0 0 1 0 0
County Total 67 1,907,194 14,406 1 0 840 124 0
Genesee County
Akron 0 273 0 0 0 1 0 0Alden-Lancaster 0 354,433 402 0 0 135 4 0Alexander 0 4,727 0 0 0 1 0 0Bergen 0 56,656 0 0 0 3 0 0Bethany 0 30,133 1,447 0 0 29 0 0Danley Corners 0 77,870 1,065 0 0 27 0 0Ellicott Creek 0 10 0 0 0 2 0 0Huron Creek 0 368,098 2,813 0 0 176 2 0Indian Falls 0 133,663 671 0 0 91 5 0Pavilion 0 6,754 0 0 0 7 1 0Roanoke 0 3,113 0 0 0 5 0 0Uhley Corners-Caledonia 0 48,853 0 0 0 20 0 0
County Total 0 1,084,583 6,398 0 0 497 12 0
Livingston County
Avon 0 20,145 0 0 0 13 3 0Dansville 0 50 0 0 0 7 0 0Finnegan Hill 0 20,174 0 0 0 10 0 0Groveland 0 0 0 0 0 2 0 0Hunt Hollow 0 1,234 0 0 0 2 0 0Leicester 0 9,220 70 0 0 12 5 0Silver Lake 0 43,347 145 0 0 12 0 0Sparta 0 0 0 0 0 0 1 0Uhley Corners-Caledonia 0 105,051 230 0 0 82 5 1
County Total 0 199,221 445 0 0 140 14 1
NYSDEC - Division of Mineral Resources 36 Twelfth Annual Report
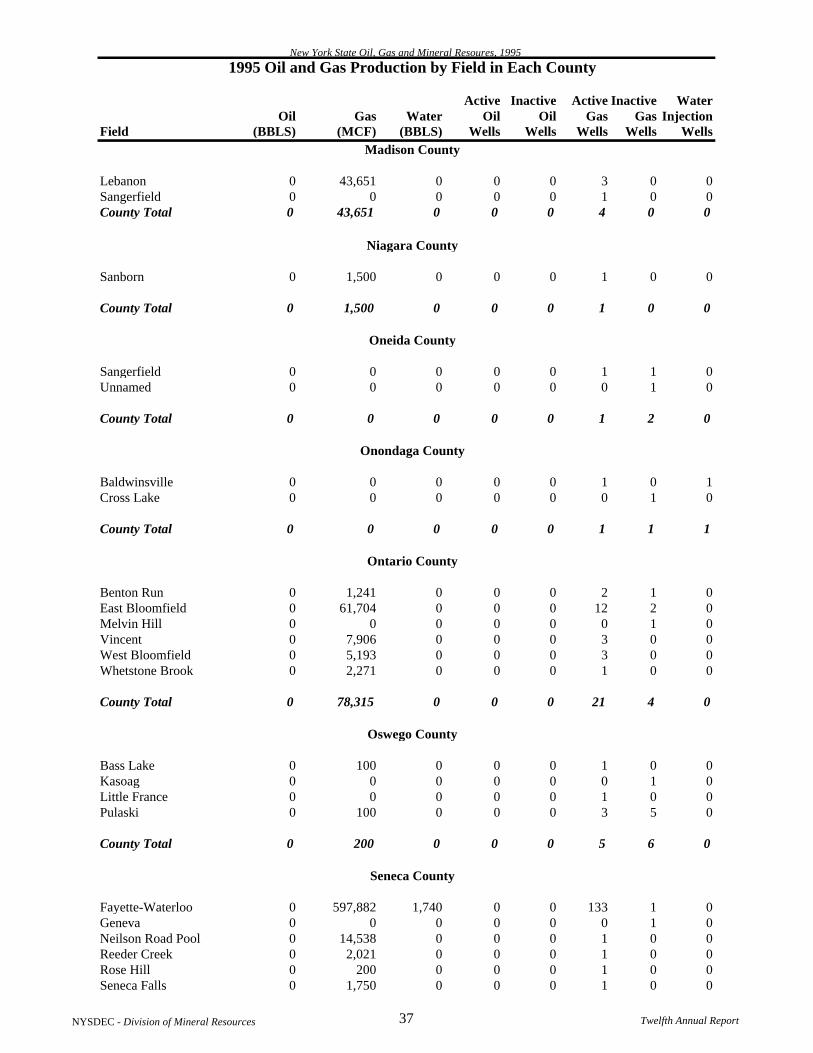
New York State Oil, Gas and Mineral Resoures, 1995
1995 Oil and Gas Production by Field in Each County
Active Inactive Active Inactive WaterOil Gas Water Oil Oil Gas Gas Injection
Field (BBLS) (MCF) (BBLS) Wells Wells Wells Wells WellsMadison County
Lebanon 0 43,651 0 0 0 3 0 0Sangerfield 0 0 0 0 0 1 0 0County Total 0 43,651 0 0 0 4 0 0
Niagara County
Sanborn 0 1,500 0 0 0 1 0 0
County Total 0 1,500 0 0 0 1 0 0
Oneida County
Sangerfield 0 0 0 0 0 1 1 0Unnamed 0 0 0 0 0 0 1 0
County Total 0 0 0 0 0 1 2 0
Onondaga County
Baldwinsville 0 0 0 0 0 1 0 1Cross Lake 0 0 0 0 0 0 1 0
County Total 0 0 0 0 0 1 1 1
Ontario County
Benton Run 0 1,241 0 0 0 2 1 0East Bloomfield 0 61,704 0 0 0 12 2 0Melvin Hill 0 0 0 0 0 0 1 0Vincent 0 7,906 0 0 0 3 0 0West Bloomfield 0 5,193 0 0 0 3 0 0Whetstone Brook 0 2,271 0 0 0 1 0 0
County Total 0 78,315 0 0 0 21 4 0
Oswego County
Bass Lake 0 100 0 0 0 1 0 0Kasoag 0 0 0 0 0 0 1 0Little France 0 0 0 0 0 1 0 0Pulaski 0 100 0 0 0 3 5 0
County Total 0 200 0 0 0 5 6 0
Seneca County
Fayette-Waterloo 0 597,882 1,740 0 0 133 1 0Geneva 0 0 0 0 0 0 1 0Neilson Road Pool 0 14,538 0 0 0 1 0 0Reeder Creek 0 2,021 0 0 0 1 0 0Rose Hill 0 200 0 0 0 1 0 0Seneca Falls 0 1,750 0 0 0 1 0 0
NYSDEC - Division of Mineral Resources 37 Twelfth Annual Report

New York State Oil, Gas and Mineral Resoures, 1995
1995 Oil and Gas Production by Field in Each County
Active Inactive Active Inactive WaterOil Gas Water Oil Oil Gas Gas Injection
Field (BBLS) (MCF) (BBLS) Wells Wells Wells Wells WellsSeneca County (Cont)
Whiskey Hill 0 0 0 0 0 1 0 0
County Total 0 616,391 1,740 0 0 138 2 0
Steuben County
Andover 444 0 2,220 4 0 0 0 0Avoca 0 1,923 0 0 0 2 0 0Beech Hill-Independence 11,660 10,013 1,211 111 0 0 0 11Big Creek 0 5,577 0 0 0 1 0 0Colonel Bills Creek 0 0 0 0 0 0 1 0Crosby Creek 0 0 0 0 0 0 1 0Dry Wildcat 0 0 0 0 0 0 1 0Glodes Corners Road 0 0 0 0 0 0 1 0Howard 0 2,239 0 0 0 1 0 0Hungry Hollow 0 0 0 0 0 1 0 0Jackson Hill 0 1,200 0 0 0 1 0 0Jasper 0 0 0 0 0 1 2 0Milwaukee Creek 0 0 0 0 0 0 1 0Northwest Harrison 0 0 0 0 0 1 0 0Painted Post 0 2,889 331 0 0 2 1 0Purdy Creek 0 0 0 0 0 1 0 0Rathbone 0 0 0 0 0 0 1 0Stone Hill 0 28,009 0 0 0 1 0 0Thomas Corners 0 24,306 2 0 0 2 0 0Unnamed 0 0 0 0 0 0 6 0Waldo Creek 0 0 0 0 0 0 1 0West Union 0 0 0 0 0 0 1 0Wyckoff 0 69,566 6 0 0 2 2 0
County Total 12,104 145,722 3,770 115 0 16 19 11
Tioga County
Cafferty Hill 0 0 0 0 0 0 1 0Stagecoach 0 1,832,608 333 0 0 9 3 0
County Total 0 1,832,608 333 0 0 9 4 0
Wayne County
Butler Creek 0 990 0 0 0 1 0 0
County Total 0 990 0 0 0 1 0 0
Wyoming County
Alden-Lancaster 0 25,284 93 0 0 7 0 0Attica 0 22,360 0 0 0 1 0 0Cascade Brook 0 0 0 0 0 0 9 0Castile 0 0 0 0 0 0 1 0Chaffee-Arcade 0 49,200 7 0 0 32 1 0
NYSDEC - Division of Mineral Resources 38 Twelfth Annual Report

New York State Oil, Gas and Mineral Resoures, 1995
1995 Oil and Gas Production by Field in Each County
Active Inactive Active Inactive WaterOil Gas Water Oil Oil Gas Gas Injection
Field (BBLS) (MCF) (BBLS) Wells Wells Wells Wells WellsWyoming County (Cont)
Cowlesville 0 2,359 105 0 0 1 0 0Danley Corners 0 172,434 2,039 0 0 80 2 0Dutch Hollow 0 200 0 0 0 1 0 0Java 0 20,904 0 0 0 25 1 0Leicester 0 92,722 200 0 0 55 3 0Northwoods 0 15,030 0 0 0 1 0 0Sheldon 0 40,246 886 0 0 37 1 0Silver Lake 0 26,723 50 0 0 12 3 0Tozier's Corners 0 11,593 0 0 0 6 0 0Wyoming 0 81 0 0 0 2 1 0
County Total 0 479,136 3,380 0 0 260 22 0
Yates County
North Penn Yan 0 3,536 0 0 0 4 2 0South Penn Yan 0 8,577 0 0 0 7 1 0Sugar Creek 0 0 0 0 0 0 1 0
County Total 0 12,113 0 0 0 11 4 0
State Total 236,733 18,747,057 686,050 3,041 978 6,134 632 782
NYSDEC - Division of Mineral Resources 39 Twelfth Annual Report

New York State Oil, Gas and Mineral Resources, 1995
1995 Oil and Gas Production by Formation in Each County
Active Inactive Active Inactive WaterOil Gas Water Oil Oil Gas Gas Injection
Formation (BBLS) (MCF) (BBLS) Wells Wells Wells Wells Wells
Allegany County
Clarksville 554 40 60 10 9 0 0 0
Devonian Shale 0 0 0 0 0 0 1 0
Fulmer Valley 26,146 49,874 82,568 356 49 25 1 35
Marcellus 0 0 0 0 0 0 1 0
Medina 0 634 0 0 0 1 0 0
Onondaga 0 0 0 0 0 0 3 0
Oriskany 0 176,417 2,044 0 0 13 9 0
Penny 483 50 12 25 0 3 0 0
Penny & Fulmer Valley 316 155 5 15 0 0 4 0
Richburg 15,034 11,280 37,183 807 622 59 3 319
Scio 322 0 632 61 17 29 15 8
Tully 0 0 0 0 0 0 1 0
Unknown 0 0 0 0 0 0 1 0
Upper Devonian 29 210 0 1 0 3 1 0
Waugh & Porter 409 5,000 574 10 19 1 0 0
County Total 43,293 243,660 123,078 1,285 716 134 40 362
Cattaraugus County
Akron 0 0 0 0 0 1 0 0
Bradford 59,040 4,710 379,488 859 175 44 3 342
Chipmunk 58,472 19,765 47,727 554 63 4 3 65
Medina 631 1,721,249 784 0 0 488 33 0Not Reported 0 0 0 0 0 0 2 0
Onondaga 580 242,778 0 1 0 8 0 0
Oriskany 0 62,256 200 0 0 2 1 0
Theresa 0 0 0 0 0 0 1 0
Upper Devonian 213 0 0 4 1 4 0 0
County Total 118,936 2,050,758 428,199 1,418 239 551 43 407
Cayuga County
Oriskany 0 0 0 0 0 1 0 0
Queenston 0 1,351,592 3,441 0 0 291 5 0
Trenton 0 1 0 0 0 1 0 0
County Total 0 1,351,593 3,441 0 0 293 5 0
Chautauqua County
Akron 0 0 0 0 0 0 2 0
Bass Island 28,417 131,629 15,786 26 6 30 12 0
Glade 15,818 9,166 2,025 187 17 205 11 0
Medina 2,341 8,405,947 76,918 0 0 2,952 299 0
Not Reported 0 0 70 0 0 1 0 0
Onondaga 15,445 60,399 6,061 8 0 12 4 0
Onondaga-Bass Island 0 0 0 0 0 0 1 0
Syracuse 312 0 0 1 0 0 0 0
Upper Devonian 0 6,012 0 0 0 5 0 0
Whirlpool 0 83,619 0 0 0 3 1 0
NYSDEC - Division of Mineral Resources 40 Twelfth Annual Report

New York State Oil, Gas and Mineral Resources, 1995
1995 Oil and Gas Production by Formation in Each County
Active Inactive Active Inactive WaterOil Gas Water Oil Oil Gas Gas Injection
Formation (BBLS) (MCF) (BBLS) Wells Wells Wells Wells WellsChautauqua County (Cont)
County Total 62,333 8,696,772 100,860 222 23 3,208 330 0
Chemung County
Marcellus 0 2,650 0 0 0 1 0 0
Oriskany 0 0 0 0 0 2 0 0
County Total 0 2,650 0 0 0 3 0 0
Erie County
Akron 0 28,808 20 0 0 24 1 0
Medina 0 1,800,149 14,374 0 0 804 119 0
Onondaga 67 78,237 12 1 0 12 3 0
Oriskany 0 0 0 0 0 0 1 0
County Total 67 1,907,194 14,406 1 0 840 124 0
Genesee County
Medina 0 1,084,573 6,398 0 0 495 12 0
Onondaga 0 10 0 0 0 2 0 0
County Total 0 1,084,583 6,398 0 0 497 12 0
Livingston County
Hamilton 0 0 0 0 0 4 0 0
Marcellus 0 50 0 0 0 2 0 0
Medina 0 199,171 445 0 0 134 14 1
County Total 0 199,221 445 0 0 140 14 1
Madison County
Herkimer 0 0 0 0 0 1 0 0
Herkimer-Oneida 0 43,651 0 0 0 3 0 0
County Total 0 43,651 0 0 0 4 0 0
Niagara County
Medina 0 1,500 0 0 0 1 0 0
County Total 0 1,500 0 0 0 1 0 0
Oneida County
Herkimer 0 0 0 0 0 1 2 0
County Total 0 0 0 0 0 1 2 0
Onondaga County
Not Reported 0 0 0 0 0 0 0 1
NYSDEC - Division of Mineral Resources 41 Twelfth Annual Report

New York State Oil, Gas and Mineral Resources, 1995
1995 Oil and Gas Production by Formation in Each County
Active Inactive Active Inactive WaterOil Gas Water Oil Oil Gas Gas Injection
Formation (BBLS) (MCF) (BBLS) Wells Wells Wells Wells WellsOnondaga County (Cont)
Queenston 0 0 0 0 0 1 0 0
Trenton 0 0 0 0 0 0 1 0
County Total 0 0 0 0 0 1 1 1
Ontario County
Medina 0 78,315 0 0 0 21 4 0
County Total 0 78,315 0 0 0 21 4 0
Oswego County
Trenton 0 200 0 0 0 5 6 0
County Total 0 200 0 0 0 5 6 0
Seneca County
Niagara 0 0 0 0 0 0 1 0
Queenston 0 599,832 1,740 0 0 136 1 0
Rochester Shale 0 2,021 0 0 0 1 0 0
Sodus Shale 0 14,538 0 0 0 1 0 0
County Total 0 616,391 1,740 0 0 138 2 0
Steuben County
Black River 0 0 0 0 0 0 2 0
Fulmer Valley 12,104 10,013 3,431 115 0 0 1 11
Marcellus 0 1,923 0 0 0 2 0 0
Not Reported 0 0 0 0 0 0 4 0
Onondaga 0 84,753 8 0 0 4 1 0
Oriskany 0 47,833 331 0 0 8 9 0
Penny 0 1,200 0 0 0 1 0 0
Rhinestreet 0 0 0 0 0 0 1 0
Tully 0 0 0 0 0 1 0 0
Upper Devonian 0 0 0 0 0 0 1 0
County Total 12,104 145,722 3,770 115 0 16 19 11
Tioga County
Helderberg 0 1,832,608 333 0 0 9 3 0
Marcellus 0 0 0 0 0 0 1 0
County Total 0 1,832,608 333 0 0 9 4 0
Wayne County
Trenton 0 990 0 0 0 1 0 0
County Total 0 990 0 0 0 1 0 0
NYSDEC - Division of Mineral Resources 42 Twelfth Annual Report

New York State Oil, Gas and Mineral Resources, 1995
1995 Oil and Gas Production by Formation in Each County
Active Inactive Active Inactive WaterOil Gas Water Oil Oil Gas Gas Injection
Formation (BBLS) (MCF) (BBLS) Wells Wells Wells Wells WellsWyoming County
Akron 0 11,593 0 0 0 6 0 0
Medina 0 452,313 3,380 0 0 252 12 0
Not Reported 0 0 0 0 0 0 1 0
Theresa 0 15,030 0 0 0 1 8 0
Upper Devonian 0 200 0 0 0 1 0 0
Whirlpool 0 0 0 0 0 0 1 0
County Total 0 479,136 3,380 0 0 260 22 0
Yates County
Queenston 0 12,113 0 0 0 11 4 0
County Total 0 12,113 0 0 0 11 4 0
State Total 236,733 18,747,057 686,050 3,041 978 6,134 632 782
NYSDEC - Division of Mineral Resources 43 Twelfth Annual Report

New York State Oil, Gas and Mineral Resources, 1995
NYSDEC - Division of Mineral Resources Twelfth Annual Report44
COMMENTS & OPINIONS
The Division of Mineral Resources is constantly striving to improve its yearly publication, the NewYork State Oil, Gas and Mineral Resources report. We would like to receive your COMMENTS &OPINIONS on how we can improve this publication!
Place your COMMENTS & OPINIONS on a copy of this page and mail it to:
Eric ShyerNYSDECDivision of Mineral Resources50 Wolf Road, Rm 290Albany, New York 12233-6500
If you wish to either Fax or e-mail your COMMENTS & OPINIONS to us
our fax number is: 518-457-9298
our e-mail address is: [email protected]