Embed Size (px)
Citation preview

1
Investment
Employment
Sentiment
Spending
Turnover
Cashflow
Collateral
Finance
Food
Accommodation
Construction
Retail
DKM/BPFI SME Market Monitor Final Report
June 2017
Prepared for the
Banking & Payments Federation Ireland June 2017

DKM/BPFI SME Market Monitor June 2017
1
Introduction
This is the eleventh publication of the DKM/BPFI SME Market Monitor, prepared for the Banking & Payments Federation
Ireland (BPFI)1. The purpose of this Market Monitor is to present up to date trends across a range of indicators which
are important for the performance of the SME sector2. With SMEs (employing less than 250 persons) accounting for the
overwhelming majority of enterprises, 69% of persons engaged, 56% of turnover and 50% of Gross Valued Added
(GVA)3, their performance is very closely linked with the overall health of the economy. How consumers feel about the
overall state of the economy, their personal financial situation and their ability to make purchases will influence the
performance of SMEs. The level of confidence amongst businesses is equally important, as the more confident business
owners and managers are, the greater the prospects for their companies, overall employment and incomes. They are
also more likely to make investment and purchase decisions.
In a report prepared for the BPFI in 2013 4 , it was noted that the highest concentration of Irish SMEs are in
Accommodation and Food services, Construction and Real Estate activities, while the Motor and Wholesale Trades as
well as Professional, Scientific and Technical services also figure prominently in terms of employment. A number of
challenges have existed for SMEs following the unprecedented economic adjustment over the past six years which hit
many SMEs especially hard. While the environment remains challenging, the return to more sustainable growth and
trading conditions should ensure that SMEs remain central to Ireland’s economic and jobs recovery.
This publication monitors a number of indicators that influence the circumstances under which SMEs conduct their
business. A total of 15 indicators, which are published on a quarterly and/or monthly basis, are presented in tabular
and graphical form with a brief commentary. This publication also contains a summary commentary which seeks to
bring an overall assessment of what these indicators are telling us about the environment for SMEs. The indicators
presented are grouped under four headings:
✓ SENTIMENT INDICATORS
✓ MACROECONOMIC INDICATORS
✓ SECTORAL INDICATORS
✓ LENDING INDICATORS
The data includes a number of the published sentiment indicators, including those from the ESRI, KBC and Investec.
Much of the macroeconomic and sectoral data comes from the Central Statistics Office while the SME lending data is
from the Central Bank of Ireland. Where data is known to be affected by seasonal patterns, the CSO presents seasonally
adjusted (SA) data which allow month on month (MoM) or quarter on quarter (QoQ) trends to be analysed. The
seasonally adjusted data can vary each month/quarter as new observations are added and these changes will be
reflected in subsequent issues of the DKM/BPFI SME Market Monitor. Unadjusted data are analysed on a year-on-year
(YoY) basis.
This publication appears in electronic on BPFI’s website: www.bpfi.ie and is available on www.dkm.ie.
1 This report is produced by DKM Economic Consultants. DKM was given editorial independence by the Banking & Payments Federation Ireland to prepare its views, analysis, forecasts and economic commentary on data and statistical trends related to the SME sector. The views expressed herein are DKM’s views and do not necessarily coincide with the views of the Banking & Payments Federation Ireland. 2 The data in this Monitor is based on data published up to 30st May 2017. 3 http://www.cso.ie/en/releasesandpublications/ep/p-bii/bii2014/ 4 http://www.bpfi.ie/publications/sme-lending-market-in-ireland/
DKM/BPFI SME Market Monitor June 2017
2
SME environment not as robust as certain indicators might suggest
Building on the concerns highlighted in the previous SME Monitor, it appears that unfolding external events, particularly Brexit, seem
to be taking their toll on the Irish economy, with the latest DKM/BPFI SME Market Monitor showing a mixed picture regarding the
current state of the SME environment. Key economic indicators, apart from the very positive GDP/GNP headline figures, portray a
more mixed picture of the SME environment, which at a first glance seems difficult to explain.
Such mixed news is evident from the Q4 2016 National Accounts. While Domestic Demand improved considerably in the final quarter
of 2016, much of this growth was due to a substantial increase in Investment, which like previous quarters, has been heavily distorted
by the importation of intellectual property assets; imports that have little or no effect on the real economy. Reassuringly for SMEs,
consumer expenditure recorded modest annual growth of 2.2% in Q4 2016, while for 2016 as a whole, it was up 2.9% on the 2015
outturn.
Further encouraging news for the SME sector is that total disposable income reached a new quarterly high of €26 billion in Q4 2016.
Total disposable income has risen in the five quarters up to Q4 2016, reaching €102 billion in 2016 as a whole, up €3.8 billion or 3.9%
relative to 2015. Despite this improvement, Q4 2016 also saw a significant increase in Gross savings of 7.7% in nominal terms,
implying that the Savings ratio is currently at its highest level since Q4 2009. Given the concerns of the external environment and its
potential impact on the Irish economy, such an increase possibly reflects the level of uncertainty which abounds.
This sense of uncertainty was reflected in the latest KBC/ESRI Consumer Sentiment Index which was practically unchanged from the
previous month, having increased to 102.0 in April from 101.9 in March. Although the survey reported that consumers’ outlook on
the economy improved, it also showed that only one in four Irish consumers are now reporting an improvement in their own financial
position, implying the scope for a broadly-based surge in consumer spending may be limited. Overall, consumers accept that there
has been an uplift in the economy, but remain cautious due to the current uncertain environment.
There was a disappointing reduction in the overall Retail Sales Index, which fell marginally by 0.6% in April, following a fairly lacklustre
performance in the opening months of the year. There were notable increases in Department Stores (+8.3%), Furniture and Lighting
(+3.9%), Bars (+1.6%) and Pharmaceutical, medical and cosmetic articles (+0.7%). The index excluding Motor Trades increased by
0.4%, marking the fourth successive increase in 2017.
One of the most striking features of this release is that for the first time since Q3 2012, the total number of overseas visitors coming
to Ireland fell on a quarterly basis, dropping 3,100 or 0.1% on the previous quarter. Brexit and the subsequent exchange rate volatility
seem to be the reason for the fall, as the number of visitors coming from Great Britain fell on both an annual and quarterly basis in
Q1 2017. Despite this, visitor numbers from outside of Great Britain continued to rise, with the number of visitors from North America
and Mainland Europe up 26.7 and 2.1% YoY.
Given the importance of the UK market to Irish producers, it is no surprise that food production also continues to be adversely
affected in the aftermath of Brexit. For the second month in a row, the Food Production Index was down, with the Index recording
annual declines in February and March of 4.3% and 1.4% respectively. For 2016 as a whole, food production was down 2% relative
to the previous year.
However, there were indicators that were largely unaffected by external developments. The Irish Manufacturing sector recorded a
notable improvement in April, as the latest Investec Purchasing Managers’ Index (PMI) rose to 55.0 in April from 53.6 in March, with
much of this improvement surprisingly due to a sharp rise in exports. Of the 68,600 new jobs created over the 12 months to Q1 2017,
36% have come from the four sectors with the greatest concentration of SMEs, highlighting the importance of SMEs to the labour
market, while the national unemployment rate fell from 7.1% to 6.8% over the quarter in Q1 2017. Other encouraging developments
for the SME environment were that gross new lending to Irish SMEs totalled €2.61 billion in 2016, representing an increase of €606
million or 30.2% on the previous year, while the level of debt accumulated by Irish SMEs came to €57.5 billion in 2016, down 12.8%
or €8.48 billion on the previous year.
In summary, while the Irish economy continues to see notable improvements in GDP, employment levels and consumption, on closer
examination, it is evident that certain sectors of the economy have been affected negatively by external factors. Thus, the SME
environment does not appear to be as robust as certain headline figures might suggest.

DKM/BPFI SME Market Monitor June 2017
3
1. Sentiment Indicators
2. Macroeconomic Indicators
Figure 1: Consumer Sentiment Index
Source: KBC/ESRI
Consumer confidence continues to be tempered by caution Nov-16 Dec-16 Jan-17 Feb-17 Mar-17 Apr-17
Monthly Index 97.8 96.2 103.1 100.7 101.9 102.0 Annual change -5.3 -7.7 -5.5 -5.1 1.3 -0.7 Monthly change 0.4 -1.6 6.9 -2.4 1.2 0.1 3 mth moving average 99.0 97.1 99.0 100.0 101.9 101.5
Source: KBC/ESRI
The KBC/ESRI Consumer Sentiment Index was practically unchanged from the previous month, having increased to 102.0 in April from 101.9 in March. There were mixed results with respect to the sub-indices as the index of current economic conditions increased to 122.4, while the index of consumer expectations fell to 88.3.
Encouragingly, April saw consumers’ outlook on the economy improve, mainly due to a series of job announcements, along with the fact that consumers feel the threat from Brexit and the Trump administration is less immediate than previously thought.
However, only one in four Irish consumers reported an improvement in their own financial position, implying the scope for a broadly-based surge in consumer spending is limited. Overall, consumers acknowledged that there has been an uplift in the economy, but given the current uncertain environment, they nonetheless remained cautious.
Figure 2: Manufacturing PMI (SA)
Source: Markit/Investec
Export orders growing at their fastest rate since July 2015 Nov-16 Dec-16 Jan-17 Feb-17 Mar-17 Apr-17 PMI (SA) 53.7 55.7 55.5 53.8 53.6 55.0 Monthly Change 1.6 2 -0.2 -1.7 -0.2 1.4
Source: Markit/Investec
Following three consecutive months of decline, the Irish manufacturing sector recorded a notable improvement in April, as the latest Investec Purchasing Managers Index (PMI) rose to 55.0 in April from 53.6 in March. Much of this improvement can be attributed to the sharp rise seen in new orders from outside Ireland, with exports growing at their fastest pace in 21 months. Such growth allowed output to rise for the ninth month running, and at its fastest pace since January. Increased levels of production in April generated a rise in employment in the sector, with the rate of job creation up considerably on March to produce the sharpest rise in the year to date. Although the rate of input cost inflation eased for the second month in a row, it was still faster than the series average, with manufacturers citing higher commodity prices for higher input costs.
Figure 3: Domestic Demand SA (€m, constant 2014 prices)
Source: CSO, National Accounts
Domestic Demand continues to be distorted by importation of IP assets Q3 15 Q4 15 Q1 16 Q2 16 Q3 16 Q4 16 Total Domestic Demand (SA) 44,719 42,128 43,296 45,601 47,898 62,552 QoQ % Change 3.5% -5.8% 2.8% 5.3% 5.0% 30.6% Final Domestic Demand (SA) 45,870 41,340 42,293 46,223 46,748 61,651 QoQ % Change 8.0% -9.9% 2.3% 9.3% 1.1% 31.9%
Source: CSO, National Accounts.
The final quarter of 2016 saw enormous quarterly growth in both Total and Final Domestic Demand, with both recording expansions above 30%. On an annual basis, both measures recorded substantial increases of 48.5 and 49.1%. Relative to 2015, Total and Final Domestic Demand were up 15.9% and 15.1% respectively.
Growth in Domestic Demand for 2016 was predominantly driven by Investment, which increased by 37.6% on the previous year. Investment continues to be inflated by the importation of high-valued intellectual property assets, imports which have little effect on domestic activity.
The next fastest growing category was Government expenditure, up 5.3% relative to 2015. Although personal consumption recorded relatively modest growth of 2.9%, this growth is encouraging for SMEs.

DKM/BPFI SME Market Monitor June 2017
4
3. Sectoral Indicators
3 Sectoral Indicators
Figure 4: Unemployment Rate (SA)
Source: CSO, QNHS
Unemployment rate falls below 7% for the first time since Q2 2008 Q4 15 Q1 16 Q2 16 Q3 16 Q4 16 Q1 17 Rate (SA) 9.1% 8.4% 8.4% 7.8% 7.1% 6.8% Number (000s SA) 196.1 181.6 182.9 171.7 154.7 148.8
Source: CSO, QNHS
The downward trend in unemployment continued in the opening quarter of 2017, as the seasonally adjusted unemployment rate fell to 6.8%, with this being the first time since Q2 2008 that the rate has fallen below the 7% mark. Over the course of the year, unemployment (SA) fell by 32,800, implying that the total number of persons unemployed came to 148,800 in Q1 2017. The latest monthly data showed that the unemployment rate for May 2017 was 6.4%, unchanged from April 2017 and down from 8.4% in May 2016. In absolute terms, the number of persons unemployed came to 140,700 in May, representing a considerable drop of 42,800 when compared to the previous year. Youth unemployment also fell from 12% in April to 11.7% in May. While consumers continue to remain cautious over unfolding global events, positive developments such as these should allow for greater purchasing activity, which shall subsequently benefit SMEs.
Figure 6: Weekly Earnings by Size of Business (€) SA
Source: CSO
Average weekly earnings surpassed their previous peak of Q4 2008 Q4 15 Q1 16 Q2 16 Q3 16 Q4 16 Q1 17
Under 50 553.33 554.44 556.58 555.21 563.09 565.95 YoY % Change 1.6% 1.4% 2.4% 0.0% 1.8% 2.1%
50 - 250 654.17 659.25 657.10 658.10 647.01 654.67 YoY % Change 0.8% 1.4% -0.4% -1.1% -1.1% -0.7%
250 + 828.98 835.15 835.70 843.46 846.89 848.47
YoY % Change 0.0% 0.4% 0.4% 2.0% 2.2% 1.6%
Source: CSO.
Following annual growth of 1.9% in Q4 2016, average weekly earnings finally surpassed their previous peak level of Q4 2008, implying that it has taken nominal earnings eight years to recover from the financial collapse. With further annual growth of 1.7% in Q1 2017, average earnings rose to €717 or €37,278 per annum. Earnings in large businesses with more than 250 employees continued to grow, as Q1 2017 registered a YoY increase of 1.6%. Small businesses, with less than 50 employees, recorded the largest annual increase in weekly earnings in Q1 2017, growing by 2.1%. Despite this improvement, earnings in small businesses remain 1.8% off their peak level in Q3 2008. Earnings in medium sized businesses, with 50-250 employees, fell for the fourth quarter in a row as Q1 2017 recorded an annual decline of 0.7%. This implies earnings in medium sized firms remain 2.4% off their peak level of Q1 2009.
Figure 5: Household Disposable Income and Savings Ratio (€ millions, current prices) SA
Source: CSO. *Consumption Expenditure (CE) here excludes Government social transfers which are included in the CE definition for National Accounts
purposes.
Savings ratio at its highest level since Q4 2009 Q3 15 Q4 15 Q1 16 Q2 16 Q3 16 Q4 16
Total Disp. Income 24,317 24,643 24,682 25,039 25,789 26,048 QoQ % Change -0.7% 1.3% 0.2% 1.4% 3.0% 1.0%
Consumption Exp. 21,978 22,220 22,676 22,457 22,630 22,539 QoQ % Change 1.5% 1.1% 2.1% -1.0% 0.8% -0.4%
Gross Saving 2,339 2,422 2,006 2,582 3,159 3,509 QoQ % Change -17.6% 3.5% -17.2% 28.7% 22.3% 11.1%
Savings Ratio 9.6% 9.8% 8.1% 10.3% 12.2% 13.5%
Source: CSO.
Having recorded marginal growth of 1%, total disposable income reached a new high of €26 billion in Q4 2016. Total disposable income has risen in each of the last five quarters, and for 2016 as a whole, it reached €102 billion, up €3.8 billion or 3.9% relative to 2015. Although consumer expenditure in 2016 was €3.1 billion or 3.5% higher relative to the previous year, there was a substantial increase in gross savings of 7.7%. The savings ratios rose to 13.5% in Q4 2016, implying that the savings ratio has increased in each of the last three quarters.

DKM/BPFI SME Market Monitor June 2017
5
Figure 9: Overseas Trips to Ireland SA
Source: CSO
Visitor numbers from Great Britain down 5.1% YoY Q4 15 Q1 16 Q2 16 Q3 16 Q4 16 Q1 17 Overseas Visitors (SA) 2.29 2.38 2.38 2.41 2.45 2.45 QoQ % Change 5.1% 4.0% 0.1% 1.2% 1.7% -0.1%
Source: CSO
For the first time since Q3 2012, the number of overseas visitors coming to Ireland fell on a quarterly basis, by 0.1% in Q1 2017. Given the number of SMEs in the form of bars, hotels, restaurants, cafes and other business outlets, that rely heavily on the tourism sector, this is not an encouraging development. Brexit, and the subsequent exchange rate volatility has clearly affected the number of visitors coming from Great Britain (GB), with quarterly growth down in each of the last four quarters, while relative to last year, visitor numbers were down by 5.1%. That said, visitor’s numbers from outside of GB continued to grow, as tourist numbers from Mainland Europe increased by 2.1% YoY. The number of visitors coming from North America and Other Areas (outside GB and Europe) also increased by 26.7 and 22.2% YoY. Reassuringly, visitors from these regions account for just over 76% of the revenue generated from overseas visitors, which should ease some of the losses from Brexit.
Annual employment growth up 3.5%, the highest recorded since Q3 2007 Q4 15 Q1 16 Q2 16 Q3 16 Q4 16 Q1 17
All sectors 2.3% 2.4% 2.9% 2.9% 3.3% 3.5% Construction 8.5% 7.8% 8.7% 7.3% 9.2% 8.5% Wholesale and retail trade 1.0% 0.7% 0.9% 1.9% 1.4% 1.5% Accommodation and food 4.1% 7.6% 6.7% 9.5% 3.4% 6.9% Real estate -17.6% -11.7% -10.2% 0.0% 22.4% -2.7%
Source: CSO, QNHS, (NSA).
The largest annual increase in employment since the recovery began was recorded in Q1 2017 with 68,600 new jobs created over the past year. Of the 68,600 jobs created, 36% can be credited to the four sectors with the greatest concentration of SMEs, highlighting the vital contribution of SMEs to the recovery. The Construction sector continues to record notable increases in employment, as Q1 2017 recorded an annual increase of 8.5%. Despite the recent fall in the number of overseas visitors coming to Ireland, the next fastest growing sector was Accommodation and Food with employment up by 6.9% YoY, while the Wholesale and Retail Trade sector registered modest annual growth of 1.5%. That said, employment in Real Estate fell by 2.7% in Q1 2017, while the overall number of individuals classified as self-employed fell by 4.1% YoY, the largest annual decline since Q3 2012.
Figure 8: Retail Sales Volume Index (2010 = 100) SA
Source: CSO
Retail sales up 2.5% in first four months despite declines in March and April Nov-16 Dec-16 Jan-17 Feb-17 Mar-17 Apr-17
Retail Sales Index 126.4 125.7 127.6 127.8 126.6 125.9 MoM % Change 1.8% -0.5% 1.5% 0.2% -1.0% -0.6%
Index ex. Motor 119.2 117.7 119.4 120.1 120.4 120.9 MoM % Change 1.9% -1.2% 1.4% 0.6% 0.3% 0.4%
Source: CSO
Having grown marginally at the start of 2017, the Retail Sales Index has fallen in each of the last two months, with March and April recording monthly declines of 1% and 0.6% respectively. Despite this, the Index in the year to date is actually 2.5% higher than the same period last year. While the overall Index is down, the majority of retail sectors did record monthly increases in April, most notably for Department Stores (+8.3%), Furniture and Lighting (+3.9%), Bars (+1.6%) and Pharmaceutical, Medical and Cosmetic Articles (+0.7%). However, some retail sectors recorded monthly declines, namely Motor Trades (-1.7%), Books, Newspapers & Stationery (-1.2%), Hardware, Paints and Glass (-1.1%), and Specialised Stores (-1.1%).
Figure 7: Employment by Sector YoY % Change
Source: CSO, QNHS, not SA.
DKM/BPFI SME Market Monitor June 2017
6
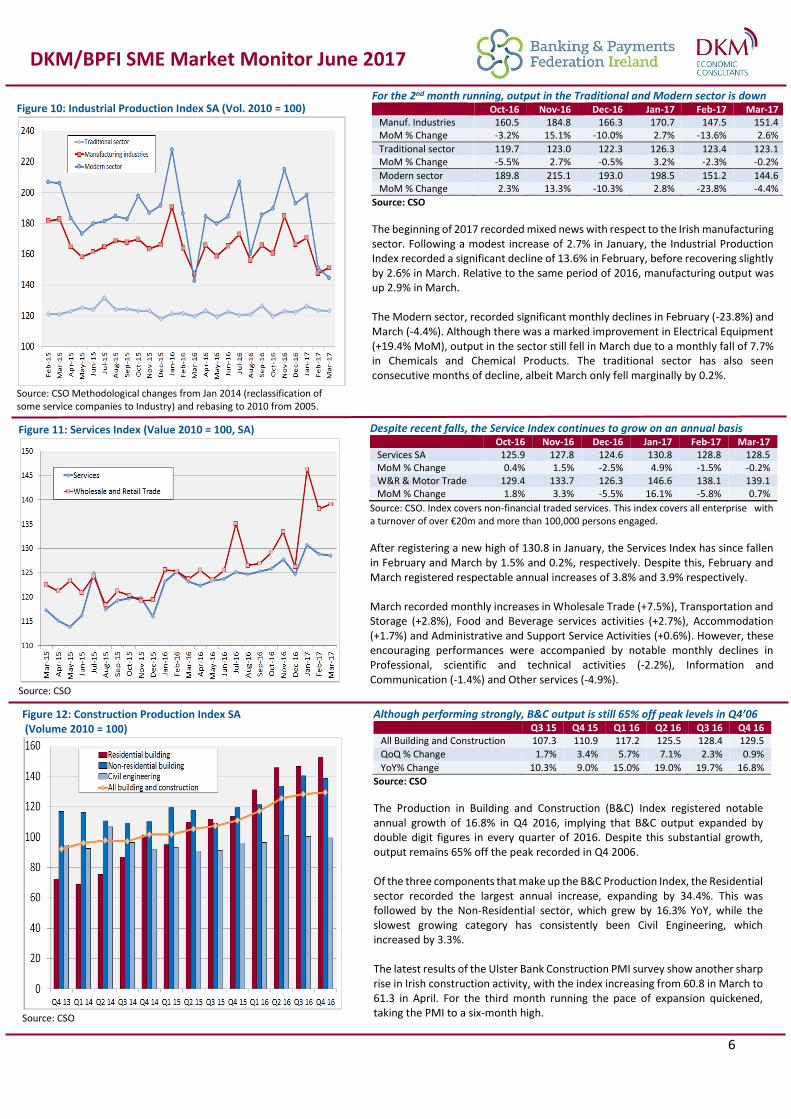
Figure 12: Construction Production Index SA (Volume 2010 = 100)
Source: CSO
Although performing strongly, B&C output is still 65% off peak levels in Q4’06 Q3 15 Q4 15 Q1 16 Q2 16 Q3 16 Q4 16
All Building and Construction 107.3 110.9 117.2 125.5 128.4 129.5
QoQ % Change 1.7% 3.4% 5.7% 7.1% 2.3% 0.9%
YoY% Change 10.3% 9.0% 15.0% 19.0% 19.7% 16.8%
Source: CSO
The Production in Building and Construction (B&C) Index registered notable annual growth of 16.8% in Q4 2016, implying that B&C output expanded by double digit figures in every quarter of 2016. Despite this substantial growth, output remains 65% off the peak recorded in Q4 2006. Of the three components that make up the B&C Production Index, the Residential sector recorded the largest annual increase, expanding by 34.4%. This was followed by the Non-Residential sector, which grew by 16.3% YoY, while the slowest growing category has consistently been Civil Engineering, which increased by 3.3%. The latest results of the Ulster Bank Construction PMI survey show another sharp rise in Irish construction activity, with the index increasing from 60.8 in March to 61.3 in April. For the third month running the pace of expansion quickened, taking the PMI to a six-month high.
Figure 10: Industrial Production Index SA (Vol. 2010 = 100)
Source: CSO Methodological changes from Jan 2014 (reclassification of some service companies to Industry) and rebasing to 2010 from 2005.
For the 2nd month running, output in the Traditional and Modern sector is down Oct-16 Nov-16 Dec-16 Jan-17 Feb-17 Mar-17 Manuf. Industries 160.5 184.8 166.3 170.7 147.5 151.4 MoM % Change -3.2% 15.1% -10.0% 2.7% -13.6% 2.6%
Traditional sector 119.7 123.0 122.3 126.3 123.4 123.1 MoM % Change -5.5% 2.7% -0.5% 3.2% -2.3% -0.2%
Modern sector 189.8 215.1 193.0 198.5 151.2 144.6 MoM % Change 2.3% 13.3% -10.3% 2.8% -23.8% -4.4%
Source: CSO
The beginning of 2017 recorded mixed news with respect to the Irish manufacturing sector. Following a modest increase of 2.7% in January, the Industrial Production Index recorded a significant decline of 13.6% in February, before recovering slightly by 2.6% in March. Relative to the same period of 2016, manufacturing output was up 2.9% in March. The Modern sector, recorded significant monthly declines in February (-23.8%) and March (-4.4%). Although there was a marked improvement in Electrical Equipment (+19.4% MoM), output in the sector still fell in March due to a monthly fall of 7.7% in Chemicals and Chemical Products. The traditional sector has also seen consecutive months of decline, albeit March only fell marginally by 0.2%.
Figure 11: Services Index (Value 2010 = 100, SA)
Source: CSO
Despite recent falls, the Service Index continues to grow on an annual basis Oct-16 Nov-16 Dec-16 Jan-17 Feb-17 Mar-17 Services SA 125.9 127.8 124.6 130.8 128.8 128.5 MoM % Change 0.4% 1.5% -2.5% 4.9% -1.5% -0.2% W&R & Motor Trade 129.4 133.7 126.3 146.6 138.1 139.1 MoM % Change 1.8% 3.3% -5.5% 16.1% -5.8% 0.7%
Source: CSO. Index covers non-financial traded services. This index covers all enterprise with a turnover of over €20m and more than 100,000 persons engaged.
After registering a new high of 130.8 in January, the Services Index has since fallen in February and March by 1.5% and 0.2%, respectively. Despite this, February and March registered respectable annual increases of 3.8% and 3.9% respectively. March recorded monthly increases in Wholesale Trade (+7.5%), Transportation and Storage (+2.8%), Food and Beverage services activities (+2.7%), Accommodation (+1.7%) and Administrative and Support Service Activities (+0.6%). However, these encouraging performances were accompanied by notable monthly declines in Professional, scientific and technical activities (-2.2%), Information and Communication (-1.4%) and Other services (-4.9%).

DKM/BPFI SME Market Monitor June 2017
7
4. Lending Indicators
Continued reduction in outstanding debt levels in all but one sector Q3 15 Q4 15 Q1 16 Q2 16 Q3 16 Q4 16
Total Outstanding Debt 15,921 15,402 14,957 14,899 14,358 13,314 YoY % Change -16.5% -18.1% -15.6% -12.2% -9.8% -13.6%
Source: Central Bank *Total outstanding debt ex Financial Intermediation, Real Estate and Primary Industry lending - see Note (1).
As per the above definition*, the level of debt accumulated by Irish SMEs came to €13.3 billion in Q4 2016, down 13.6% or €2.08 billion on the previous year. For 2016 as a whole, total outstanding debt for SMEs came to €57.5 billion, a fall of €8.48 billion or 12.8% on 2015. With the exception of Electricity, Gas, Steam and Air Conditioning Supply, all other sectors registered reductions in debt in Q4 2016. The sector to record the largest absolute decline in debt was Wholesale/Retail Trade & Repairs, having recorded a reduction of €0.44 billion YoY. Significant declines in debt were also registered in a number of other sectors, namely:
➢ Hotels and Restaurants (-€0.40 billion YoY); ➢ Business and Administrative Services (-€0.33 billion YoY); ➢ Manufacturing (-€0.29 billion YoY); and ➢ Other Community, Social and Personal Services (-€0.21 billion YoY).
Figure 15: Outstanding Debt (€m) and Rate of Change
Source: Central Bank
Figure 14: New Lending to SMEs (€m) and Rate of Change
Source: Central Bank
Strong growth in new lending to Irish SMEs - up €606 million on 2015 Q3 15 Q4 15 Q1 16 Q2 16 Q3 16 Q4 16
Total New Lending 450 500 487 720 539 868 YoY % Change -0.2% -16.8% -3.0% 29.5% 19.8% 73.6%
Source: Central Bank *Total lending ex Financial Intermediation, Real Estate and Primary Industry lending - see Note (1).
For 2016, gross new lending to Irish SME’s totalled €2.61 billion, representing an increase of €606 million or 30.2% on the previous year. Taking the most recent quarter alone, total new lending to SMEs amounted to €868 million, a substantial increase of 73.6% on the same quarter in the previous year. Of the twelve sectors under examination, the largest recipient was Wholesale/Retail Trade & Repairs, receiving 31.0% of new lending to SMEs in Q4 2016. Other sectors to receive significant shares in the quarter, included:
➢ Hotels and Restaurants (16.5% of total new lending); ➢ Business and Administrative Services (15.3%); ➢ Manufacturing (15.2%); and ➢ Other Community, Social and Personal Services (7.5%).
The remaining sectors under examination all accounted for shares of 4% or less.
Figure 13: Food Production Index SA (Vol. 2010 = 100)
Source: CSO
Food Production is down 1.4% YoY Oct-16 Nov-16 Dec-16 Jan-17 Feb-17 Mar-17
Food products 137.3 140.0 134.3 146.5 139.4 138.2 MoM % Change -11.4% 2.0% -4.1% 9.1% -4.8% -0.9%
Source: CSO
Following a positive start to 2017, February and March saw the Food Production Index fall on an annual and monthly basis. The marginal decline in March can be primarily credited to a mixed set of performances across the sub sectors, with notable monthly falls in Grain mill and starch products (-4.8%) and Other Foods (-1.8%), (which include the Processing and Preserving of Fish and Fruit and Vegetables, the Manufacture of Vegetable and Animal Oils and Fats, Sugar, Chocolate and Sugar Confectionary, Condiments and Seasonings and Prepared Meals and dishes and the Processing of Tea and Coffee). Such falls were accompanied by a notable increase in Dairy products (+4.4%) along with marginal monthly growth in Bakery and farinaceous products (+1.1%) and Meat and meat products (+0.4%).

DKM/BPFI SME Market Monitor June 2017
8
INDICATOR SOURCE FREQUENCY SEAS ADJ.
Sentiment Indicators
1 Consumer Sentiment Index ESRI/KBC Monthly No
2 Purchasing Managers’ Index Investec Monthly Yes
Macroeconomic Indicators
3 Domestic Demand CSO National Accounts Quarterly Yes
4 Unemployment CSO Quarterly Yes
5 Disposable Income CSO Quarterly Yes
Sectoral Indicators
6 Earnings by Business Size CSO Quarterly Yes
7 Employment by sector (QNHS) CSO Quarterly No
8 Retail Sales Volume Index CSO Monthly Yes
9 Overseas Trips to Ireland CSO Quarterly Yes
10 Industrial Production Index CSO Monthly Yes
11 Services Index CSO Monthly Yes
12 Building and Construction Production Index CSO Quarterly Yes
13 Food Production Volume Index CSO Monthly Yes
Lending Indicators
14 Outstanding SME debt by sector Central Bank Quarterly No
15 New Lending to SMEs by sector Central Bank Quarterly No
NOTES (1) We exclude lending to financial intermediaries and real estate lending as these account for a significant proportion of SME
lending (as defined) but a relatively small proportion of SME economic activity. In addition we exclude the primary Sector (mainly Agriculture) from our analysis as the factors influencing that sector are arguably quite different to those affecting other SMEs. It should be noted that we have included lending to the Construction sector in our aggregate (unlike the Central Bank) as we believe that most of this lending is now for working capital in the construction sector and not for property purchase or development.


![[GPM 028] - DKM Bismarck](https://img.pdfslide.net/doc/110x75/55cf9041550346703ba4586f/gpm-028-dkm-bismarck.jpg)