Embed Size (px)
Citation preview
http://www.jstor.org
Do Bad Bidders Become Good Targets?Author(s): Mark L. Mitchell and Kenneth LehnSource: The Journal of Political Economy, Vol. 98, No. 2, (Apr., 1990), pp. 372-398Published by: The University of Chicago PressStable URL: http://www.jstor.org/stable/2937670Accessed: 26/06/2008 13:20
Your use of the JSTOR archive indicates your acceptance of JSTOR's Terms and Conditions of Use, available at
http://www.jstor.org/page/info/about/policies/terms.jsp. JSTOR's Terms and Conditions of Use provides, in part, that unless
you have obtained prior permission, you may not download an entire issue of a journal or multiple copies of articles, and you
may use content in the JSTOR archive only for your personal, non-commercial use.
Please contact the publisher regarding any further use of this work. Publisher contact information may be obtained at
http://www.jstor.org/action/showPublisher?publisherCode=ucpress.
Each copy of any part of a JSTOR transmission must contain the same copyright notice that appears on the screen or printed
page of such transmission.
JSTOR is a not-for-profit organization founded in 1995 to build trusted digital archives for scholarship. We work with the
scholarly community to preserve their work and the materials they rely upon, and to build a common research platform that
promotes the discovery and use of these resources. For more information about JSTOR, please contact [email protected].
Do Bad Bidders Become Good Targets?
Mark L. Mitchell and Kenneth Lehn Securities and Exchange Commission
This paper empirically examines one motive for takeovers: to change control of firms that make acquisitions that diminish the value of their equity. Firms that subsequently become takeover targets make acquisitions that significantly reduce their equity value, and firms that do not become takeover targets make acquisitions that raise their equity value. Within the sample of acquisitions by targets, the acquisitions that reduce equity value the most are those that are later divested either in bust-up takeovers or restructuring programs to thwart the takeover. This evidence is consistent with theories ad- vanced by Marris, Manne, and Jensen concerning the disciplinary role played by takeovers.
I. Introduction
Since Berle and Means (1933), it has been widely recognized that a potential divergence of interest exists between managers and stock- holders in corporations characterized by diffusely held equity. In re- cent years, economists have probed institutional arrangements that
Mitchell is on leave from Clemson University; Lehn from Washington University (St. Louis). We are grateful to Steve Belitti, Joe Burschinger, David du Mars, John Ma- wickee, Bill Sanders, John Tortora, and Connie Wilson for research assistance. This paper has benefited from comments by Bernie Black, Robert Comment, Larry Harris, Louis Lowenstein, Robert McCormick, Mike Maloney, Wayne Marr, Michael Ryngaert, and Rick Smith; and from seminar participants at the University of Chicago, Columbia University, University of California at Los Angeles and Davis, Ohio State University, Wichita State University, George Mason University, University of Florida, University of South Carolina, Washington University, University of Illinois, Department of Justice, and the Hayek Symposium in Freiburg, West Germany. Annette Poulsen suggested the title. The views expressed herein are those of the authors and do not necessarily reflect the views of the Securities and Exchange Commission or of the authors' colleagues on the staff of the SEC.
Uournal of Political Economy, 1990, vol. 98, no. 2] ? 1990 by The University of Chicago. All rights reserved. 0022-3808/90/9802-0007$01.50
372
BAD BIDDERS 373
mitigate this potential conflict and attempted to understand why these arrangements vary from firm to firm. Among the forces that mitigate the manager-stockholder conflict are competitive labor and product markets, managerial compensation plans, the structure of equity own- ership, and the threat of corporate takeovers.' This paper focuses on the extent to which one of these forces, corporate takeovers, disci- plines managers in firms with a specific type of manager-stockholder conflict, namely, a conflict concerning the firms' acquisition pro- grams.
Our interest in this question emerges from general theoretical ar- guments by Marris (1963) and Manne (1965) and a more specific argument by Jensen (1986). Independently, Marris and Manne argue that the stock prices of firms in which managers deviate from profit maximization are less than they otherwise could be. They argue that this difference between actual and potential stock prices creates in- centives for outside parties to acquire these firms and operate them in profit-maximizing ways.
More recently, Jensen argues that takeovers mitigate manager- stockholder conflicts that are especially severe in firms that generate substantial free cash flow (i.e., cash flow in excess of what is necessary to finance positive return investment projects).2 Jensen asserts that managers in such firms often use free cash flow to finance un- profitable ventures, such as value-reducing acquisitions, rather than pay it out to stockholders in either dividends or stock buy-backs. Therefore, according to Jensen, takeovers are not only a "problem" but also a "solution." He argues that many takeovers are designed, at least in part, either to undo previous unprofitable acquisitions by target firms or to prevent these firms from making future unprofit- able acquisitions.
Although numerous studies of corporate takeovers have docu- mented that stockholders of target firms benefit from these transac- tions,3 little evidence exists on the extent to which these gains reflect the reduction of agency problems of the type discussed by Marris, Manne, and Jensen. In a 1983 review article, Jensen and Ruback
' See, among others, Marris (1963), Manne (1965), Alchian and Demsetz (1972), Jensen and Meckling (1976), Fama (1980), Demsetz (1983), Fama and Jensen (1983a, 1983b), the June 1983 issue of the Journal of Law and Economics, Demsetz and Lehn (1985), Murphy (1985), and Jensen (1986).
2 Lehn and Poulsen (1989), Mahle (1989), Maloney, McCormick, and Mitchell (1989), and Lang, Stulz, and Walkling (in press) provide empirical evidence consistent with Jensen's hypothesis.
3 For a review of the literature on the effects of takeovers on stock prices, see Jensen and Ruback (1983) and Jarrell, Brickley, and Netter (1988). Several studies also show that legislation that restricts takeovers adversely affects stock prices (see Ryngaert and Netter 1988; Schumann 1988; Mitchell and Netter, in press).
374 JOURNAL OF POLITICAL ECONOMY
conclude that "knowledge of the source of takeover gains still eludes us" (p. 47); a more recent survey article by Jarrell et al. (1988) con- curs. To partially fill this gap of knowledge, this study addresses a testable question that emerges from Marris, Manne, and Jensen: Are takeover targets distinguished from other firms by the profitability of their prior acquisitions? Specifically, do target firms, relative to other firms, systematically make acquisitions that the stock market judges harshly?
Anecdotal evidence suggests that the raison d'etre of some takeovers is the poor acquisition record of target firms. For example, one stated motive of Sir James Goldsmith's unsuccessful hostile takeover attempt of Goodyear Tire and Rubber Company in October 1986 was his desire to sell Goodyear's petroleum and aerospace divisions and con- centrate Goodyear's attention on its tire and rubber operations. Goldsmith offered a premium of approximately $1.13 billion (roughly 30 percent of the preoffer equity value of Goodyear).
Although Goodyear, originally a tire and rubber company, had diversified into the aerospace business earlier, its 1983 purchase of Celeron Oil for approximately $800 million was its first major petro- leum acquisition. On the day of the acquisition announcement, Feb- ruary 8, 1983, Goodyear's stock price suffered an abnormal decline of 10.04 percent, resulting in a loss of $249 million for Goodyear stock- holders. Over a narrow event window surrounding the announce- ment (5 trading days before the announcement through 1 trading day after the announcement), Goodyear's stock price declined 14.83 per- cent, resulting in shareholder losses of $359 million.4 The premium offered by Goldsmith may have recouped losses sustained by Good- year shareholders 3 years earlier when Goodyear began its diver- sification into the oil industry.5 Goodyear successfully defeated Gold- smith's takeover attempt, but its stock price did not fall to the preoffer level since it instituted a major restructuring program that was similar to the one that Goldsmith promised. Not surprisingly, the
4 Over a longer window surrounding this announcement (5 trading days before the announcement through 40 trading days after the announcement), Goodyear's stock price declined 23.68 percent.
5 The Standard & Poor's 500 index increased by approximately 61 percent from 5 days before the first announcement of Goodyear's acquisition of Celeron Oil in Febru- ary 1983 through 20 days before the first announcement-of Goldsmith's bid for Good- year in October 1986. If the shareholder losses ($249 million [day of announcement], $359 million [-5, 1 window], and $573 million [-5, 40 window]) associated with Goodyear's energy acquisition had been invested in the S & P 500 during this period, they would have increased to $401 million, $578 million, and $923 million, respectively. Hence, the premium offered by Goldsmith would have restored much of the equity value in Goodyear that had been depreciated earlier when Goodyear's management made these acquisitions.
BAD BIDDERS 375
restructuring program included the sale of a substantial part of Cel- eron Oil.
To determine whether the Goodyear case generalizes to a large sample of takeovers, we examine the stock price reactions to acquisi- tions made by two sets of firms during 1982-86: firms that become targets of takeover attempts after their acquisitions (i.e., "targets") and a control group of firms that do not receive takeover bids during the sample period (i.e., "nontargets"). Within the sample of targets, we estimate the stock price effects associated with acquisitions of firms that later receive hostile bids (i.e., "hostile targets") and acquisitions of firms that later receive friendly bids (i.e., "friendly targets"). The following results are revealed.
1. For the entire sample, the average stock price effect associated with acquisition announcements is not significantly different from zero: 0.14 percent measured over the period of 5 trading days before the announcements through 1 trading day after the announcements ([-5, 1] window), and 0.70 percent measured over the period of 5 trading days before the announcements through 40 trading days af- ter the announcements ([-5, 40] window).
2. Significant differences exist between the average stock price ef- fect associated with acquisitions made by targets and the corre- sponding effect associated with acquisitions made by nontargets. The stock prices of targets decline significantly when they announce acqui- sitions ( - 1.27 percent over the [ - 5, 1] window and - 3.38 percent over the [ - 5, 40] window), and the stock prices of nontargets increase significantly when they announce acquisitions (0.82 percent and 3.32 percent, respectively). Within the sample of targets, this stock price effect is similar in magnitude for hostile targets (- 1.34 percent and - 3.37 percent, respectively) and friendly targets (- 1.17 percent and - 3.39 percent, respectively).
3. For the entire sample of acquisitions, the average stock price effect associated with acquisitions that subsequently are divested is significantly lower (- 1.53 percent and -4.01 percent, respectively) than the corresponding stock price effect associated with acquisitions that are not subsequently divested (0.56 percent and 1.89 percent, respectively). This difference is especially striking for the sample of acquisitions by target firms. The average stock price effect associated with acquisitions made by targets that subsequently are divested fol- lowing the reception of their bids, either by their acquiring firms or by themselves, is - 2.07 percent and - 7.04 percent, respectively; the corresponding average stock price effect associated with other acqui- sitions made by targets is - 0.72 percent and - 0.87 percent, respec- tively.
4. Estimates from a logit equation reveal that, with equity value and
376 JOURNAL OF POLITICAL ECONOMY
the percentage of equity held by management held constant, the probability that a firm is a target, especially a hostile target, during 1982-88 is inversely and significantly related to the stock price effects associated with announcements of the firm's acquisitions: the more negative these effects, the higher the likelihood of a subsequent takeover attempt.
These results suggest that one source of value in many corporate takeovers, especially hostile takeovers, is recoupment of target equity value that had been lost because of the targets' poor acquisition strate- gies prior to the reception of their bids. They also support the argu- ment that hostile bust-up takeovers promote economic efficiency by reallocating the target's assets to higher-valued uses. Hence, these results support the theories by Marris, Manne, and Jensen concerning the disciplinary role of corporate takeovers. Additionally, the divesti- ture findings suggest that when companies announce acquisitions, the stock market provides an unbiased forecast of the likelihood that the assets will be ultimately divested.
II. Description of Data
The sample for this study consists of 1,158 public corporations in 51 industries covered by Value Line during the fourth quarter of calen- dar year 1981.6 The modified sample excludes two highly regulated industries (financial services and electric utilities) covered by Value Line and industries that contain fewer than 10 firms. The sample includes 64.4 percent of the companies in the 1981 S & P 500 index and 75.2 percent of the companies in the 1981 Fortune 500.
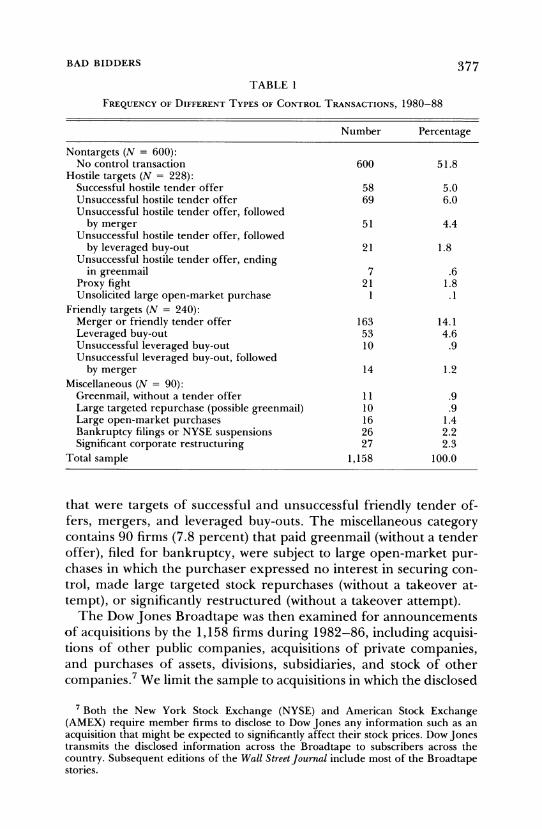
Each of the 1,158 firms was classified into one of four groups on the basis of whether the firm was a takeover target during January 1980- July 1988: (1) nontargets, (2) hostile targets, (3) friendly targets, and (4) miscellaneous firms. Table 1 displays a frequency distribution for these four groups. The 600 nontarget firms (51.8 percent of the sample) did not receive friendly or hostile bids, pay greenmail, file for bankruptcy, significantly restructure, or become subject to large un- solicited open-market purchases. The hostile target group consists of 228 firms (19.7 percent) that were targets of successful and unsuccess- ful hostile tender offers, proxy contests (in which the dissenting shareholder sought control), and large unsolicited open-market pur- chases in which the purchaser attempted to secure control. The friendly target group contains 240 firms (20.7 percent of the sample)
6 Every quarter, Value Line examines the financial prospects of approximately 1,500 firms in more than 65 industries. Each week during every quarter, it publishes a financial summary for a subset of the firms that it covers.
BAD BIDDERS 377
TABLE 1
FREQUENCY OF DIFFERENT TYPES OF CONTROL TRANSACTIONS, 1980-88
Number Percentage
Nontargets (N = 600): No control transaction 600 51.8
Hostile targets (N = 228): Successful hostile tender offer 58 5.0 Unsuccessful hostile tender offer 69 6.0 Unsuccessful hostile tender offer, followed
by merger 51 4.4 Unsuccessful hostile tender offer, followed
by leveraged buy-out 21 1.8 Unsuccessful hostile tender offer, ending
in greenmail 7 .6 Proxy fight 21 1.8 Unsolicited large open-market purchase 1 .1
Friendly targets (N = 240): Merger or friendly tender offer 163 14.1 Leveraged buy-out 53 4.6 Unsuccessful leveraged buy-out 10 .9 Unsuccessful leveraged buy-out, followed
by merger 14 1.2 Miscellaneous (N = 90):
Greenmail, without a tender offer 11 .9 Large targeted repurchase (possible greenmail) 10 .9 Large open-market purchases 16 1.4 Bankruptcy filings or NYSE suspensions 26 2.2 Significant corporate restructuring 27 2.3
Total sample 1,158 100.0
that were targets of successful and unsuccessful friendly tender of- fers, mergers, and leveraged buy-outs. The miscellaneous category contains 90 firms (7.8 percent) that paid greenmail (without a tender offer), filed for bankruptcy, were subject to large open-market pur- chases in which the purchaser expressed no interest in securing con- trol, made large targeted stock repurchases (without a takeover at- tempt), or significantly restructured (without a takeover attempt).
The Dow Jones Broadtape was then examined for announcements of acquisitions by the 1,158 firms during 1982-86, including acquisi- tions of other public companies, acquisitions of private companies, and purchases of assets, divisions, subsidiaries, and stock of other companies.7 We limit the sample to acquisitions in which the disclosed
7 Both the New York Stock Exchange (NYSE) and American Stock Exchange (AMEX) require member firms to disclose to Dow Jones any information such as an acquisition that might be expected to significantly affect their stock prices. Dow Jones transmits the disclosed information across the Broadtape to subscribers across the country. Subsequent editions of the Wall Street Journal include most of the Broadtape stories.
378 JOURNAL OF POLITICAL ECONOMY
purchase price was at least 5 percent of the market value of the acquiring firm's common equity 20 trading days prior to the first announcement of the acquisition.
While we examine the stock price effects of acquisitions made dur- ing 1982-86, we record control transactions for the firms in the sam- ple from 1980 through July 1988. Extending control transactions beyond the last year in the acquisition sample allows time for a takeover attempt to occur in response to prior value-reducing acquisi- tions. In addition, some firms may not have received a takeover offer during 1982-88, but received an offer during 1980-81. Acquisitions by these firms during 1982-86 will have occurred after takeover of- fers for themselves. Since the objective of this study is to examine the extent to which the market for corporate control disciplines firms that make value-reducing acquisitions, it seems inappropriate to include these acquisitions in the target category. It also seems inappropriate, however, to include these acquisitions in the nontarget category for obvious reasons; hence, we opt for including these acquisitions in the miscellaneous category.8
Although the first three groups of firms are well defined, the fourth group is a residual group lying between target firms and non- target firms. We examine the stock price reactions to acquisition an- nouncements by all four groups, although our principal interest lies in differences in the stock price effects of acquisitions made by the first three groups.
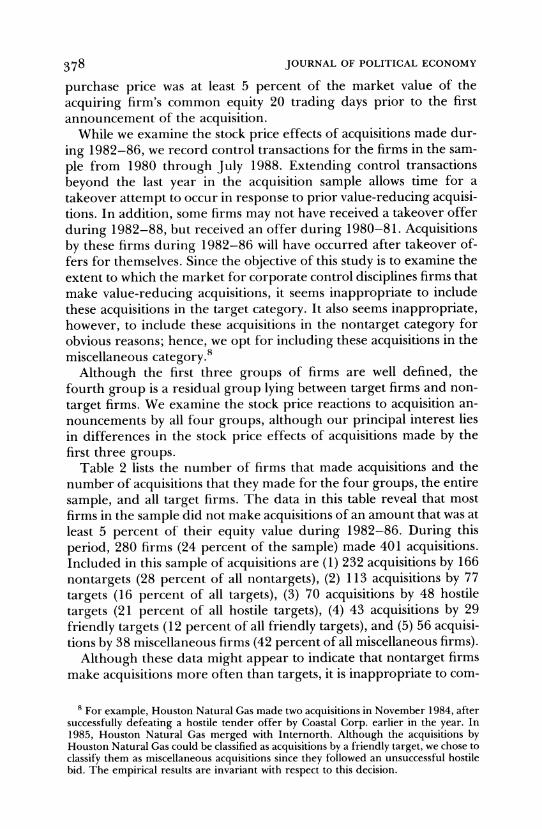
Table 2 lists the number of firms that made acquisitions and the number of acquisitions that they made for the four groups, the entire sample, and all target firms. The data in this table reveal that most firms in the sample did not make acquisitions of an amount that was at least 5 percent of their equity value during 1982-86. During this period, 280 firms (24 percent of the sample) made 401 acquisitions. Included in this sample of acquisitions are (1) 232 acquisitions by 166 nontargets (28 percent of all nontargets), (2) 113 acquisitions by 77 targets (16 percent of all targets), (3) 70 acquisitions by 48 hostile targets (21 percent of all hostile targets), (4) 43 acquisitions by 29 friendly targets (12 percent of all friendly targets), and (5) 56 acquisi- tions by 38 miscellaneous firms (42 percent of all miscellaneous firms).
Although these data might appear to indicate that nontarget firms make acquisitions more often than targets, it is inappropriate to com-
8 For example, Houston Natural Gas made two acquisitions in November 1984, after successfully defeating a hostile tender offer by Coastal Corp. earlier in the year. In 1985, Houston Natural Gas merged with Internorth. Although the acquisitions by Houston Natural Gas could be classified as acquisitions by a friendly target, we chose to classify them as miscellaneous acquisitions since they followed an unsuccessful hostile bid. The empirical results are invariant with respect to this decision.
l-. ;: 0
CIA In o 4-J CIA
4-J
0 Cr u cr) CZ
4-J L- 4) _.:, CZ 0 bjD 00 u
CZ 4) In in t-
= *-J (:; 0 C) 1; W) Cq in CZ CIA
44
C's t- ho
CZ cli
00 ho
4-J
00 CIA
ho
ho 10. C's w
t- CZ 4) u
CZ CZ 0
t- C, 00 cl, in C14 00 00 t-
0 x V Cq u i:z CZ
i7) -C ho CZ
0 0 CZ bO 0. E 00 cr) CZ
CZ C', ho U CZ
w 0
CZ
Cr u ho r cz 4) l-. U a. 44 ( 0 CZ 0
0 u u r- .r_ r- 00 t- 00 0 0 0
Cl! Cl! Cl! Cl! 0
00 o o 00 a. x 8. oo Z 0 I Cq 1-4 z E
xx .0
ho - CZ 4) ho u 00 C) 00 r- - w in C) CIA u Cr --I c V
ho (:r ;.. U
r- ho 0 > 7
4-J 4-J M
0 4-J >1 4-J bjD
4-J 0 V 4-J W) w z z 0 0 0 4-J 41 * E 3- -
0 -0 z I 0
380 JOURNAL OF POLITICAL ECONOMY
pare these frequencies directly since the sample period is effectively longer for nontargets than for targets. For target firms, we record only acquisitions made from January 1982 through 3 months prior to the first announcement of their suitor's interest in acquiring control. For example, if the first announcement of a bid for a target firm occurred in June 1984, we record acquisitions for only two years (1982 and 1983) and part of one year (January 1984-March 1984). One conclusion, however, does emerge directly from table 2. Since 79 percent of the hostile targets did not make a large acquisition during the period preceding the reception of their bids, at best, the bad- bidder explanation of hostile takeovers can explain only part of the reason for these transactions.
Table 2 also displays the mean and median ratio of the purchase price of the acquisitions to the equity value of the acquiring firms for the six groups of firms. For the entire sample, the mean value of this ratio is 0.37. The mean value of the acquisition relative size variable for the subgroups ranges from 0.30 for the hostile target category to 0.44 for the miscellaneous category. As with the full sample, the mean ratio exceeds the median ratio for every subgroup. Tests for differ- ences in means indicate that the mean ratios for the various groups are not significantly different from one another and thus make com- parable the empirical results reported in the next section.
Several modes of payments can be used in making acquisitions. For each acquisition, we collected the form of payment from Mergers and Acquisitions and the Wall Street Journal. The data indicate that pure cash offers are the predominant form of payment, accounting for 254 (63 percent) of the acquisitions. At least some cash is used in 354 (88 percent) of the acquisitions.9 In contrast, pure stock transactions ac- count for only 45 (11 percent) of the acquisitions, and at least some stock is used in 103 (26 percent) of the acquisitions.
Asquith, Bruner, and Mullins (1987) and Travlos (1987) find that form of payment is correlated with the market's reaction to an acquisi- tion announcement. For a sample of 343 mergers and tender offers that occurred during 1973-83, Asquith et al. observe positive stock price reactions to acquiring firms for cash offers and negative reac- tions for stock offers. Travlos reports insignificant stock price reac- tions to acquiring firms for cash offers and negative reactions for stock offers for a sample of 167 mergers and tender offers during
9 The "other" category includes 12 acquisitions partly financed by cash. This category is composed of cash, stock, and notes (8); cash notes and assumption of target debt (1); notes (1); cash and assets (1); cash and debentures (2); and stock and assumption of tar- get debt (1).
BAD BIDDERS 381
1972-81.10 Among nontargets, hostile targets, and friendly targets, for which comparison will be made in the following sections, the frequency distributions of form of payment do not differ signi- ficantly. The form of payment for the miscellaneous category does differ somewhat from the other categories since the miscellaneous category contains relatively fewer pure cash acquisitions. Since the primary focus of this study is to distinguish between acquisitions by target firms and acquisitions by nontarget firms, the form of payment should not bias the comparisons reported in the remainder of the paper.
III. Stock Market Analysis of Acquisitions
A. Event-Study Methodology
We employ event-study methodology to measure the stock price ef- fects associated with announcements of acquisitions. Using the Center for Research in Security Prices (CRSP) daily returns tapes, we esti- mate the abnormal return (ar,,) for each acquiring firm during the period 20 days preceding the event date through 40 days following the event date. Abnormal returns are computed as
ard = rt - -rLZ t,
where rt is the return to firm i at time t, rmt is the return to the CRSP value-weighted index of NYSE and AMEX stocks, and a, and P are market model parameter estimates from the period 170 through 21 trading days preceding the event date.
The event date for each acquisition is the first date on which the Dow Jones Broadtape reports a story about the acquisition. These initial stories range from reports that the acquiring firm is rumored to be interested in making the acquisition, often with no price disclosed, to reports that both the bidder and the target definitively agreed to the acquisition. We then average the daily abnormal returns across firms in each group to obtain the portfolio abnormal return, ARt =
EN= 1 aritIN, where N is the number of firms in each portfolio of inter- est, and cumulate over various windows to obtain the cumulative ab- normal return, CAR = T'= 1 ARt, where T is the length of the event
10 We find a higher proportion of cash offers in our study than Asquith et al. and Travlos do. They focus on mergers and tender offers, whereas our study examines all acquisitions, including purchases of assets and divisions, which are generally cash of- fers.
382 JOURNAL OF POLITICAL ECONOMY
window. In the absence of abnormal performance, the expected value of the AR and CAR equals zero."
In the tables that follow, we report the AR for the acquisition an- nouncement date [0] and the CAR for the corresponding four win- dows: (1) 1 day before the event date through 1 day after the event date, [- 1, 1], (2) 5 days before the event date through 1 day after the event date, [ - 5, 1], (3) 5 days before the event date through 40 days after the event date, [- 5, 40], and (4) 20 days before the event date through 40 days after the event date, [- 20, 40].
B. Stock Price Performance of Acquiring Firms
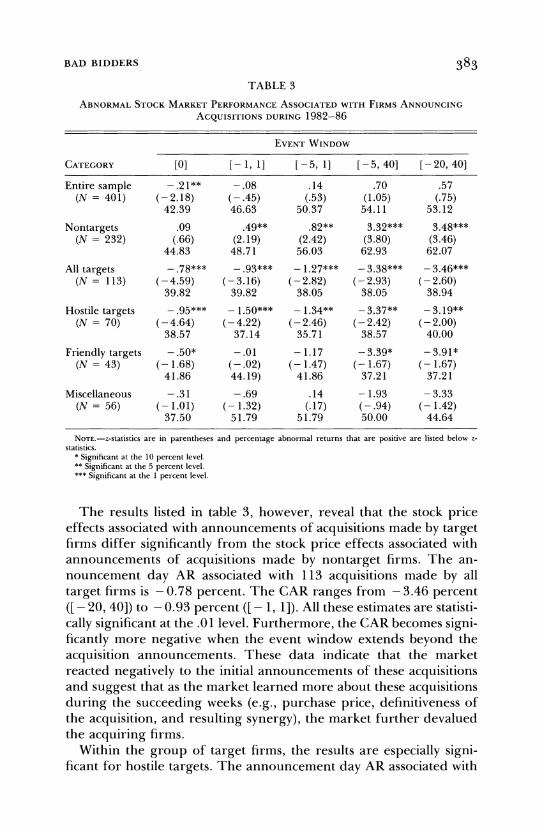
Table 3 displays the announcement day AR and corresponding CARs (z-statistics are in parentheses, with the percentage positive listed be- low z-statistics) associated with the announcements of acquisitions made by each of six groups of firms. In addition to examining the stock price effects of the four groups discussed earlier (hostile targets, friendly targets, nontargets, and miscellaneous), we also report the stock price effects associated with acquisitions by all targets and by the entire sample.
The announcement day AR corresponding to the acquisitions made by the entire sample of 401 acquisitions is - 0.21 percent and is statistically significant at the .05 level. The CARs corresponding to the other four windows range from - 0.08 percent ([ - 1, 1]) to 0.70 per- cent ([- 5, 40]), and none of these is significantly different from zero. These results suggest that, on average, acquiring firms earn a normal rate of return on their investments, a finding consistent with a com- petitive market for corporate control.'2
" We construct standardized test statistics to assess the statistical significance of stock market abnormal performance. We divide each abnormal return by the square root of its forecast variance:
Orr= or 2[1 +I+ + (R tm) 1/
at t [ L CSSRm ]}
(where a2 is the estimated residual variance for the estimation period, L is the number of observations in the estimation period, Rm is the estimation period mean of the market return, and CSSRm is the corrected sum of squares of the market return during the event window), to form a standardized abnormal return, sar,1 = arzt/gar. The test statistic for the AR is Zt = (VONUN) EN= sart1, and the test statistic for the CAR is ( 1IVT
T= 1 Zt, where T is the length of the event window. We also conduct nonparametric tests to test the robustness of the results reported. These tests include a test for the percent- age of the abnormal returns that are positive and the Wilcoxon signed rank test. The statistical significance of the results reported throughout the text is robust with respect to these nonparametric tests. As with all other results mentioned but not reported in the text, they are available on request.
12 See Bradley, Desai, and Kim (1988) and Jarrell and Poulsen (1989) for studies of returns to acquiring firms and target firms in tender offers.
BAD BIDDERS 383
TABLE 3 ABNORMAL STOCK MARKET PERFORMANCE ASSOCIATED WITH FIRMS ANNOUNCING
ACQUISITIONS DURING 1982-86
EVENT WINDOW
CATEGORY [0] [-, 1] [-5,1] [-5,40] [-20,40]
Entire sample - .21** -.08 .14 .70 .57 (N = 401) (-2-18) (- .45) (.53) (1.05) (.75)
42.39 46.63 50.37 54.11 53.12
Nontargets .09 .49** .82** 3.32*** 3.48*** (N = 232) (.66) (2.19) (2.42) (3.80) (3.46)
44.83 48.71 56.03 62.93 62.07
All targets - .78*** - .93*** - 1.27*** - 3.38*** - 3.46*** (N = 113) (-4.59) (- 3.16) (- 2.82) (-2.93) (- 2.60)
39.82 39.82 38.05 38.05 38.94
Hostile targets - .95*** - 1.50*** - 1.34** - 3.37** - 3.19** (N = 70) (-4.64) (-4.22) (- 2.46) (- 2.42) (- 2.00)
38.57 37.14 35.71 38.57 40.00
Friendly targets - .50* - .01 - 1.17 - 3.39* - 3.91* (N = 43) (- 1.68) (-.02) (- 1.47) (- 1.67) (- 1.67)
41.86 44.19) 41.86 37.21 37.21
Miscellaneous -.31 -.69 .14 - 1.93 - 3.33 (N = 56) (- 1.01) (- 1.32) (.17) (-.94) (-1.42)
37.50 51.79 51.79 50.00 44.64
NOTE.-z-statistics are in parentheses and percentage abnormal returns that are positive are listed below z- statistics.
* Significant at the 10 percent level. ** Significant at the 5 percent level. *** Significant at the 1 percent level.
The results listed in table 3, however, reveal that the stock price effects associated with announcements of acquisitions made by target firms differ significantly from the stock price effects associated with announcements of acquisitions made by nontarget firms. The an- nouncement day AR associated with 113 acquisitions made by all target firms is - 0.78 percent. The CAR ranges from - 3.46 percent ([- 20, 40]) to -0.93 percent ([ - 1, 1]). All these estimates are statisti- cally significant at the .01 level. Furthermore, the CAR becomes signi- ficantly more negative when the event window extends beyond the acquisition announcements. These data indicate that the market reacted negatively to the initial announcements of these acquisitions and suggest that as the market learned more about these acquisitions during the succeeding weeks (e.g., purchase price, definitiveness of the acquisition, and resulting synergy), the market further devalued the acquiring firms.
Within the group of target firms, the results are especially signi- ficant for hostile targets. The announcement day AR associated with
384 JOURNAL OF POLITICAL ECONOMY
70 acquisitions made by hostile targets is - 0.95 percent, and the CAR ranges from -3.37 percent ([-5, 40]) to - 1.34 percent ([-5,1]). All the estimates are significant at the .05 level or higher. These results compare with the corresponding results for acquisitions by friendly targets. The AR on the announcement day for 43 acquisitions made by friendly targets is - 0.50 percent and is significant at the .10 level. The CAR ranges from -3.91 percent ([-20, 40]) to -0.01 percent ([ - 1,1]) and is significant at the .10 level for the two longest windows. The pattern of returns is similar for both hostile targets and friendly targets; both sets of returns become considerably more negative when the event window extends beyond day 1.
The abnormal stock price performance associated with 232 acquisi- tions made by nontarget firms contrasts sharply with the results for target firms. The announcement day AR for nontarget firms is 0.09 percent, and the CAR ranges from 0.49 percent ([- 1, 1]) to 3.48 percent ([- 20, 40]). With the exception of the announcement day AR, all these estimates are significant at the .05 level or higher. The CAR for nontargets increases and remains statistically significant when the event window extends beyond the day after the announce- ment of the acquisitions, a result that contrasts sharply with the corre- sponding result for target firms.
Finally, the results reveal that the 56 acquisitions made by the group of miscellaneous firms had no statistically significant effect on their stock prices, regardless of the window used to measure the ef- fect. The announcement day AR for these firms is - 0.31 percent, and the CAR for the four other windows ranges from - 3.33 percent ([-20, 40]) to 0.14 percent ([-5, 1]).
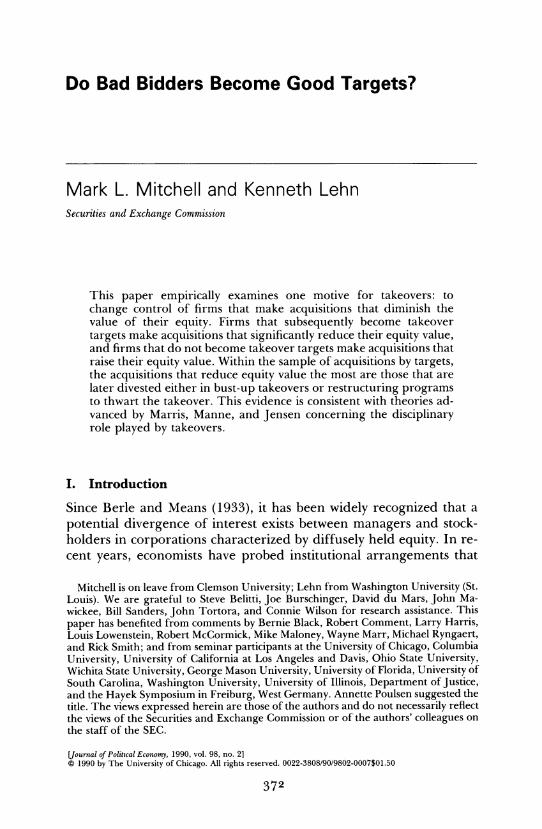
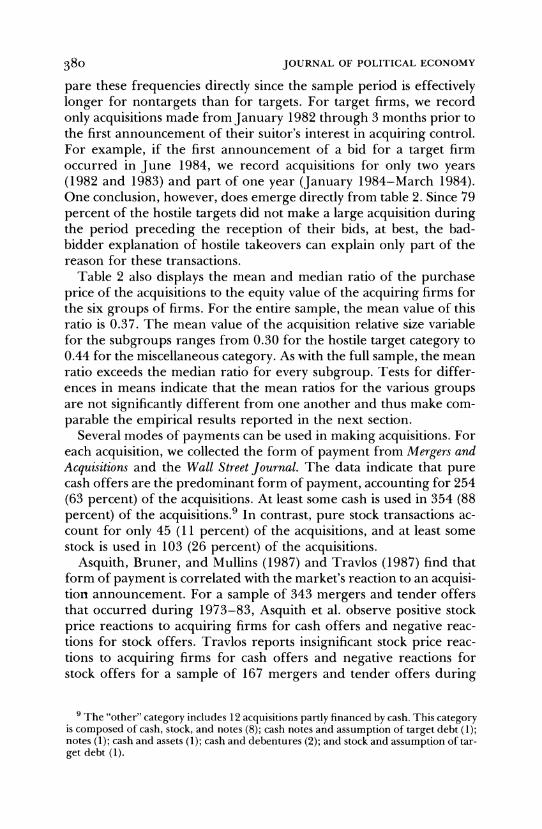
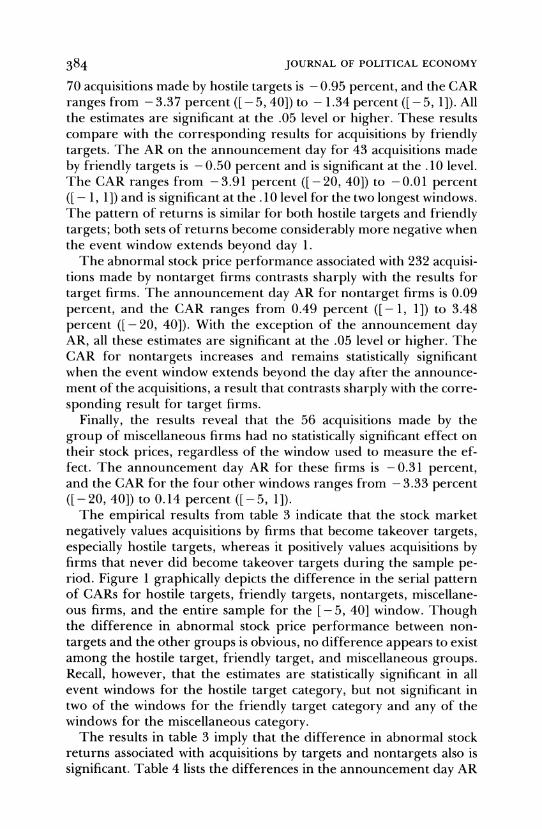
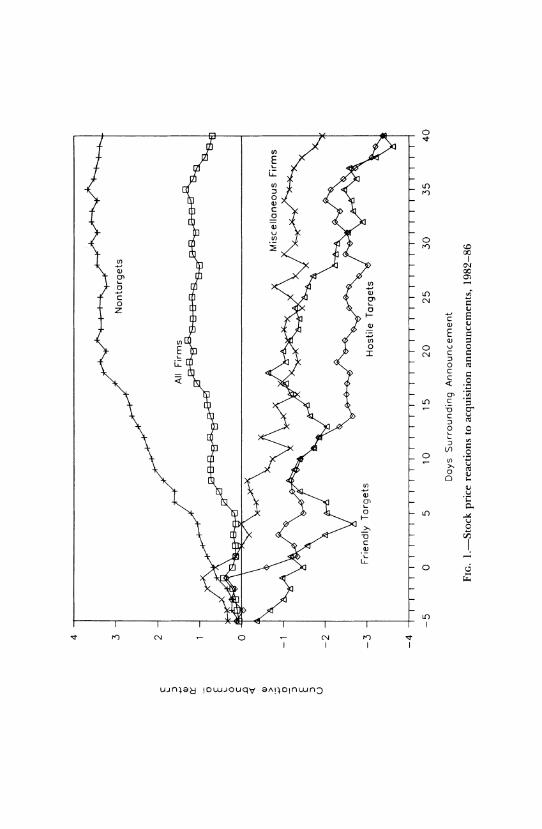
The empirical results from table 3 indicate that the stock market negatively values acquisitions by firms that become takeover targets, especially hostile targets, whereas it positively values acquisitions by firms that never did become takeover targets during the sample pe- riod. Figure 1 graphically depicts the difference in the serial pattern of CARs for hostile targets, friendly targets, nontargets, miscellane- ous firms, and the entire sample for the [- 5, 40] window. Though the difference in abnormal stock price performance between non- targets and the other groups is obvious, no difference appears to exist among the hostile target, friendly target, and miscellaneous groups. Recall, however, that the estimates are statistically significant in all event windows for the hostile target category, but not significant in two of the windows for the friendly target category and any of the windows for the miscellaneous category.
The results in table 3 imply that the difference in abnormal stock returns associated with acquisitions by targets and nontargets also is significant. Table 4 lists the differences in the announcement day AR
cn ~ ~ ~ .
E
cn
OJ
0~~~~~~~~~~~~0 Q)~~~~~~~~~~~0
V)~~~~~~~~U 0 ~~~~~~~~~~~~~~~~~~~~~~0
Q) cc~~~~~~~~~0 0
U))U)0)
E L0 0 N
z 0~~~~~~~~
0 u~~~ C
LZ ~~~~~~~~~~~~~~~~0 0m
< <~~~~~~~~~~~~~ o 0
0J U~~~
o LI)~~~~~~V 0
V)~~~~~~0
0)
LL)
~~~t ~~~~~~~') cN 0 c~~~~~~~~~~~~~~~~~~ ~~~~~')~~_ cn I I I I~~~~~C
U~fll)d IDJO~q~0)Ai4~flwn
386 JOURNAL OF POLITICAL ECONOMY
TABLE 4
DIFFERENCES IN ABNORMAL RETURNS ASSOCIATED WITH ANNOUNCEMENTS OF
ACQUISITIONS, 1982-86
EVENT WINDOW COMPARISON OF
ABNORMAL RETURNS [0] [-1, 1] [-5, 1] [-5,40] [-20,40]
All targets .87*** 1.42*** 2.09*** 6.70*** 6.94*** vs. nontargets (3.99) (3.84) (3.71) (4.63) (4.16)
Hostile targets 1.04*** 1.99*** 2.16*** 6.69*** 6.67*** vs. nontargets (4.23) (4.74) (3.37) (4.07) (3.54)
Friendly targets .59* .50 1.99** 6.71*** 7.39*** vs. nontargets (1.80) (.91) (2.30) (3.04) (2.90)
NOTE.-z-statistics are in parentheses. * Significant at the 10 percent level. ** Significant at the 5 percent level. *** Significant at the 1 percent level.
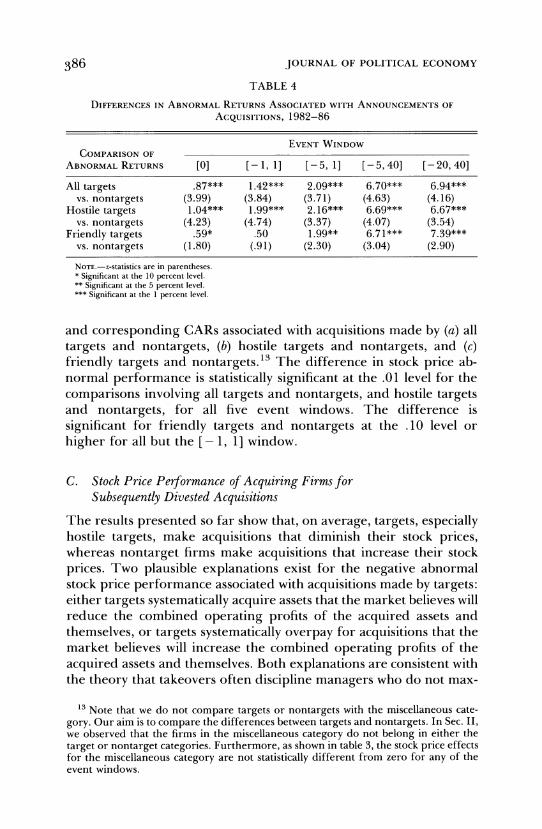
and corresponding CARs associated with acquisitions made by (a) all targets and nontargets, (b) hostile targets and nontargets, and (c) friendly targets and nontargets.13 The difference in stock price ab- normal performance is statistically significant at the .01 level for the comparisons involving all targets and nontargets, and hostile targets and nontargets, for all five event windows. The difference is significant for friendly targets and nontargets at the .10 level or higher for all but the [- 1, 1] window.
C. Stock Price Performance of Acquiring Firms for Subsequently Divested Acquisitions
The results presented so far show that, on average, targets, especially hostile targets, make acquisitions that diminish their stock prices, whereas nontarget firms make acquisitions that increase their stock prices. Two plausible explanations exist for the negative abnormal stock price performance associated with acquisitions made by targets: either targets systematically acquire assets that the market believes will reduce the combined operating profits of the acquired assets and themselves, or targets systematically overpay for acquisitions that the market believes will increase the combined operating profits of the acquired assets and themselves. Both explanations are consistent with the theory that takeovers often discipline managers who do not max-
13 Note that we do not compare targets or nontargets with the miscellaneous cate- gory. Our aim is to compare the differences between targets and nontargets. In Sec. LI, we observed that the firms in the miscellaneous category do not belong in either the target or nontarget categories. Furthermore, as shown in table 3, the stock price effects for the miscellaneous category are not statistically different from zero for any of the event windows.
BAD BIDDERS 387
imize stockholders' wealth. The former explanation suggests that the motive behind many takeovers is to undo inefficient acquisitions pre- viously made by the targets. The latter explanation suggests that takeovers can serve to restrain managers in target firms from persis- tently overpaying for acquisitions in the future.'4
Although it is difficult to measure the extent to which the latter explanation prevails, the relative importance of the former explana- tion can be examined by comparing the rate at which acquisitions made by targets are subsequently divested with the corresponding rate for nontargets during the sample period. 15 The target divestiture sample consists of acquisitions made by targets that are divested dur- ing a period ranging from 3 months prior to the reception of their bids through the end of the sample period. The target divestiture sample includes divestitures by targets to defend against takeovers, divestitures as part of restructuring programs after defeating takeover attempts, and divestitures by acquiring firms following suc- cessful takeovers of the targets. The nontarget divestiture sample consists of acquisitions that are divested by the end of the sample period.
If the former explanation is important, then the divestiture rate should be higher for targets than for nontargets. In addition, if the former explanation holds, then the abnormal returns associated with acquisitions that subsequently are divested should be significantly lower than the abnormal returns associated with acquisitions that are not subsequently divested. This relationship should hold not only for the group of targets but also for the entire sample and each of the subsamples.
Data on subsequent divestitures of acquisitions in the sample come from four sources: annual issues of Mergers and Acquisitions, the Wall Street Journal Index, and Standard & Poor's Directory of Corporate Affiliations during 1982-88 and telephone conversations with repre- sentatives of the acquiring companies themselves.'6 The data reveal that 81 of the 401 acquisitions during 1982-86, or 20.2 percent of the sample, were subsequently divested during 1982-88.
14 According to Roll (1986), bidder overpayment results from hubris on the part of managers of acquiring firms (see also Black 1989).
15 Porter (1987) and Ravenscraft and Scherer (1987) show that acquisitions made by firms in conglomerate mergers during the 1960s and 1970s were subsequently divested at a high rate. Neither study, however, examines divestiture rates for target and non- target firms.
16 Although we are confident that these four sources allow us to identify most divesti- tures, we are not certain that we have identified them all. Some divestitures may not have been reported in Mergers and Acquisitions, the Wall Street Journal Index, or Standard & Poor's Directory of Corporate Affiliations, and in some cases, we were unable to receive definitive information from the companies themselves. We have no reason to believe that the unidentified divestitures bias the results above.
388 JOURNAL OF POLITICAL ECONOMY
A significant difference in the divestiture rate exists between non- targets and targets. Whereas only 9.1 percent (21/232) of the acquisi- tions made by nontargets are subsequently divested, 40.7 percent (46/ 113) of the acquisitions made by targets are subsequently divested, either in response to or following successful or unsuccessful takeover attempts (the z-statistic for the difference in divestiture rates is 6.34). No significant difference in divestiture rates exists between hostile targets and friendly targets; this rate is 41.9 percent (18/43) for acqui- sitions made by friendly targets and 40 percent (28/70) for acquisi- tions made by hostile targets (the z-statistic for the difference in dives- titure rates is 0.20).17
It is noteworthy that only two of the friendly targets and none of the hostile targets divested previously acquired units prior to the threat of a takeover. Since we are interested in whether one motive for takeovers is to undo acquisitions made by target firms, these two acquisitions made by friendly targets are excluded from the friendly target divestiture sample.
Table 5 displays abnormal returns for two sets of acquisitions for each group of firms: acquisitions that subsequently were divested dur- ing the sample period and those that were not. For the entire sample, the announcement day AR associated with 81 acquisitions that subse- quently were divested is - 1.26 percent and is significant at the .01 level. The CAR for the corresponding four windows ranges from - 5.59 percent ([ - 20, 40]) to - 1.53 percent ([- 5, 1]), and all these estimates are significant at the .01 level. The announcement day AR for the 320 acquisitions that were not subsequently divested is 0.05 percent and is not statistically significant. The corresponding CARs for announcements of acquisitions that were not divested range from 0.35 ([- 1, 1]) to 2.13 ([-20, 40]), and all these estimates are significant at the .10 level or higher.
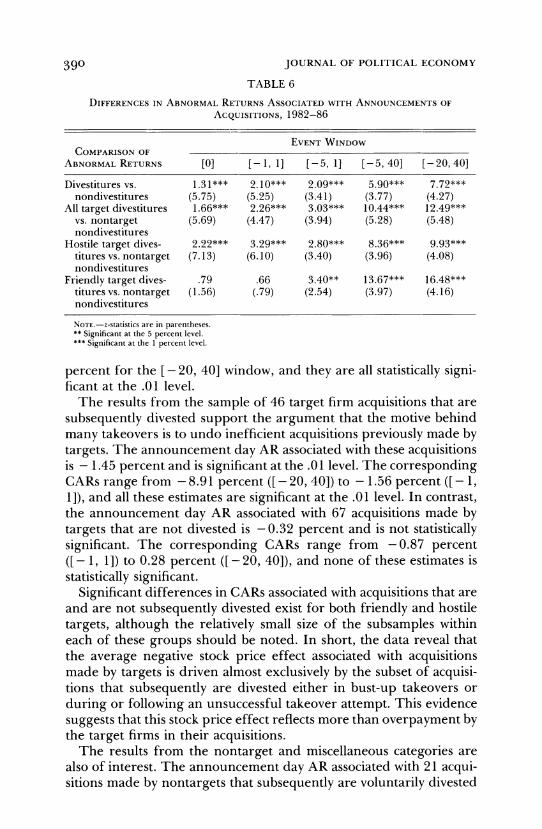
The findings of negative and significant abnormal returns associ- ated with acquisitions that subsequently are divested during the sam- ple period and positive and significant abnormal returns associated with acquisitions that are not subsequently divested during the sample period deliver a strong message of market efficiency. On average, the market is able to immediately provide an unbiased forecast of the likelihood that the assets will ultimately be divested, long before any cash flows from the resulting business combination are known. Table 6 displays the difference in abnormal returns for these two groups; they range from 1.31 percent for the announcement day to 7.72
17 Both hostile and friendly targets exhibit significantly higher divestiture rates than nontargets. The z-statistic is 5.03 for the hostile target and nontarget comparison, and 4.23 for the friendly target and nontarget comparison.
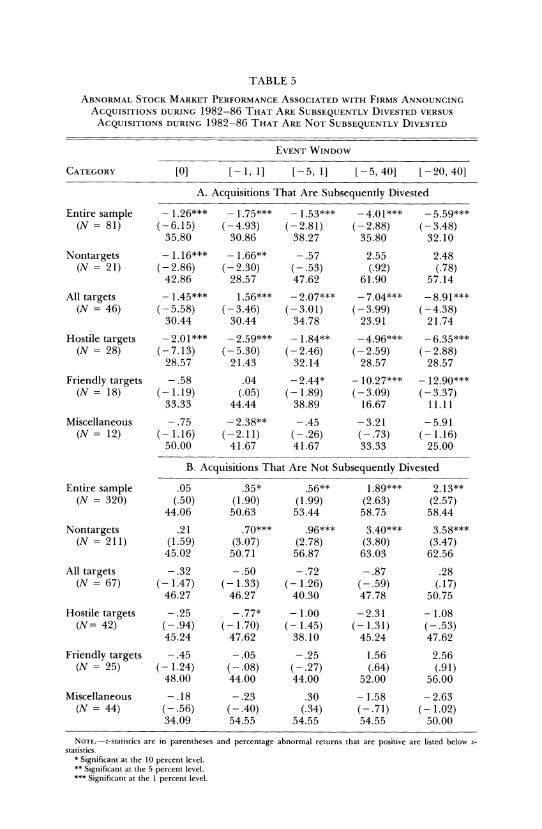
TABLE 5 ABNORMAL STOCK MARKET PERFORMANCE ASSOCIATED WITH FIRMS ANNOUNCING
ACQUISITIONS DURING 1982-86 THAT ARE SUBSEQUENTLY DIVESTED VERSUS
ACQUISITIONS DURING 1982-86 THAT ARE NOT SUBSEQUENTLY DIVESTED
EVENT WINDOW
CATEGORY [0] [-1, 1] [-5, 1] [-5,40] [-20,40]
A. Acquisitions That Are Subsequently Divested
Entire sample - 1.26*** - 1.75*** - 1.53*** -4.01*** -5.59*** (N = 81) (-6.15) (-4.93) (-2.81) (-2.88) (-3.48)
35.80 30.86 38.27 35.80 32.10
Nontargets - 1.16*** - 1.66** -.57 2.55 2.48 (N = 21) (- 2.86) (- 2.30) (- .53) (.92) (.78)
42.86 28.57 47.62 61.90 57.14
All targets - 1.45*** 1.56*** - 2.07*** - 7.04*** - 8.91 (N = 46) (-5.58) (-3.46) (-3.01) (-3.99) (-4.38)
30.44 30.44 34.78 23.91 21.74
Hostile targets - 2.01*** - 2.59*** - 1.84** - 4.96*** - 6.35*** (N = 28) (- 7.13) (- 5.30) (- 2.46) (- 2.59) (- 2.88)
28.57 21.43 32.14 28.57 28.57
Friendly targets -.58 .04 -2.44* - 10.27*** - 12.90*** (N = 18) (- 1.19) (.05) (- 1.89) (-3.09) (-3.37)
33.33 44.44 38.89 16.67 11.11
Miscellaneous - .75 - 2.38** - .45 - 3.21 - 5.91 (N = 12) (- 1.16) (-2.11) (-.26) (-.73) (- 1.16)
50.00 41.67 41.67 33.33 25.00
B. Acquisitions That Are Not Subsequently Divested
Entire sample .05 .35* .56** 1.89*** 2.13** (N = 320) (.50) (1.90) (1.99) (2.63) (2.57)
44.06 50.63 53.44 58.75 58.44
Nontargets .21 .70*** .96*** 3.40*** 3.58*** (N = 211) (1.59) (3.07) (2.78) (3.80) (3.47)
45.02 50.71 56.87 63.03 62.56
All targets - .32 - .50 - .72 - .87 .28 (N = 67) (-1.47) (-1.33) (-1.26) (-.59) (.17)
46.27 46.27 40.30 47.78 50.75
Hostile targets - .25 - .77* - 1.00 - 2.31 - 1.08 (N= 42) (-.94) (- 1.70) (- 1.45) (- 1.31) (-.53)
45.24 47.62 38.10 45.24 47.62
Friendly targets -.45 -.05 -.25 1.56 2.56 (N = 25) (- 1.24) (-.08) (-.27) (.64) (.91)
48.00 44.00 44.00 52.00 56.00
Miscellaneous -.18 -.23 .30 - 1.58 -2.63 (N = 44) (-.56) (-.40) (.34) (-.71) (- 1.02)
34.09 54.55 54.55 54.55 50.00
NOTE.-z-statistics are in parentheses and percentage abnormal returns that are positive are listed below z- statistics.
* Significant at the 10 percent level. ** Significant at the 5 percent level. *** Significant at the 1 percent level.
390 JOURNAL OF POLITICAL ECONOMY
TABLE 6
DIFFERENCES IN ABNORMAL RETURNS ASSOCIATED WITH ANNOUNCEMENTS OF
ACQUISITIONS, 1982-86
EVENT WINDOW COMPARISON OF
ABNORMAL RETURNS [0] [-1, 1] [-5, 1] [-5, 40] [-20,40]
Divestitures vs. 1.3 1*** 2.10*** 2.09*** 5.90*** 7.72*** nondivestitures (5.75) (5.25) (3.41) (3.77) (4.27)
All target divestitures 1.66*** 2.26*** 3.03*** 10.44*** 12.49*** vs. nontarget (5.69) (4.47) (3.94) (5.28) (5.48) nondivestitures
Hostile target dives- 2.22*** 3.29*** 2.80*** 8.36*** 9.93*** titures vs. nontarget (7.13) (6.10) (3.40) (3.96) (4.08) nondivestitures
Friendly target dives- .79 .66 3.40** 13.67*** 16.48*** titures vs. nontarget (1.56) (.79) (2.54) (3.97) (4.16) nondivestitures
NOTE.-z-statistics are in parentheses. ** Significant at the 5 percent level. *** Significant at the 1 percent level.
percent for the [ - 20, 40] window, and they are all statistically signi- ficant at the .01 level.
The results from the sample of 46 target firm acquisitions that are subsequently divested support the argument that the motive behind many takeovers is to undo inefficient acquisitions previously made by targets. The announcement day AR associated with these acquisitions is - 1.45 percent and is significant at the .01 level. The corresponding CARs range from -8.91 percent ([-20,40]) to -1.56 percent ([-1, 1]), and all these estimates are significant at the .01 level. In contrast, the announcement day AR associated with 67 acquisitions made by targets that are not divested is -0.32 percent and is not statistically significant. The corresponding CARs range from -0.87 percent ([- 1, 1]) to 0.28 percent ([-20, 40]), and none of these estimates is statistically significant.
Significant differences in CARs associated with acquisitions that are and are not subsequently divested exist for both friendly and hostile targets, although the relatively small size of the subsamples within each of these groups should be noted. In short, the data reveal that the average negative stock price effect associated with acquisitions made by targets is driven almost exclusively by the subset of acquisi- tions that subsequently are divested either in bust-up takeovers or during or following an unsuccessful takeover attempt. This evidence suggests that this stock price effect reflects more than overpayment by the target firms in their acquisitions.
The results from the nontarget and miscellaneous categories are also of interest. The announcement day AR associated with 21 acqui- sitions made by nontargets that subsequently are voluntarily divested
BAD BIDDERS 391
is - 1.16 percent and is significant at the .01 level. The corresponding CARs range from - 1.66 percent ([ - 1, 1]) to 2.55 percent ([ - 5,40]), and only the negative CAR associated with the [- 1, 1] window is significant (.05 level). In contrast, the announcement day AR associ- ated with 211 nontarget acquisitions that are not divested is 0.21 percent, though it is not significant. The corresponding CARs range from 0.70 percent ([ - 1, 1]) to 3.58 percent ([ - 20, 40]), and all these estimates are significant at the .01 level. On average, these results indicate that nontarget firms voluntarily divest relatively less profitable acquisitions. Similar results hold for the miscellaneous cate- gory: the abnormal returns associated with acquisitions subsequently divested are more negative than the acquisitions that are not divested.
We noted earlier that while the divestiture rate is significantly higher for targets (40.7 percent, 46/113) than for nontargets (9.1 percent, 21/232), there are only two divestitures by target firms prior to a takeover attempt for themselves. Thus the voluntary divestiture rate for targets (1.8 percent, 2/113) is actually considerably lower than the divestiture rate for nontargets (z-statistic = 3.23). Given the re- sults reported in tables 3-5, this finding suggests that those non- targets that divested acquisitions may have avoided takeover attempts by divesting less profitable acquisitions, whereas had the target firms divested their bad acquisitions, a takeover attempt might not have resulted.
In conjunction with this reasoning, table 6 shows the difference in abnormal returns associated with the following paired subsamples of acquisitions: the 211 acquisitions made by nontargets that subse- quently are not divested and (a) the 46 acquisitions made by targets that subsequently are divested, (b) the 28 acquisitions made by hostile targets that subsequently are divested, and (c) the 18 acquisitions made by friendly targets that subsequently are divested. These data reveal that, with the exception of the abnormal returns estimated over the two shortest windows for the last pairing, the differences in the abnormal returns across all paired subsamples are highly significant. These results indicate that the stock market provides a much differ- ent evaluation of acquisitions by nontargets that are retained versus acquisitions by target firms that are retained until a takeover attempt results in a divestiture either by a disciplining acquirer or through restructuring efforts to thwart off the takeover.
D. Do Value-reducing Acquisitions Increase the Likelihood of Becoming a Takeover Target?
To examine the effect that value-reducing acquisitions have on the probability of becoming a takeover target, we estimate three sets of logit equations, which differ by the dependent variable and the sam-
392 JOURNAL OF POLITICAL ECONOMY
ple used for the estimate. The dependent variables and the samples corresponding to the three sets of equations are (1) the logistic trans- formation of the probability that a firm is a target, hostile or friendly, for the sample of targets and nontargets; (2) the logistic transforma- tion of the probability that a firm is a hostile target, for the sample of hostile targets and nontargets; and (3) the logistic transformation of the probability that a firm is a friendly target, for the sample of friendly targets and nontargets. Within each set, five equations are estimated in which one of the independent variables is the sum of the abnormal returns associated with each firm's acquisitions. For ex- ample, 77 firms made 113 acquisitions in the target category; thus we have 77 target firm acquisition observations. These five equations differ only by the five windows over which the abnormal returns are estimated. We anticipate an inverse relationship between this inde- pendent variable and the likelihood of being a target, especially a hostile target.
Two other variables, the logarithm of the market value of the firms' equity (SIZE) and the percentage of equity held by the firms' man- agers (MGTHOLD),18 both computed as of the end of 1981, are included as regressors in the logit equations.'9 Palepu (1986) finds an inverse relationship between firm size and the likelihood of becoming a target during 1971-79. Since our sample period is 1982-88, a pe- riod that witnessed the advent of hostile takeovers for large corpora- tions, we expect a weaker and perhaps insignificant relationship be- tween SIZE and the likelihood of becoming a target.
The expected sign of the estimated coefficient on MGTHOLD is more ambiguous. First, MGTHOLD proxies for the extent to which managers own sufficient shares to defeat takeover attempts; in this respect, we expect a negative estimated coefficient on MGTHOLD. In addition, if equity ownership by management and corporate take-
18 The management ownership data come from proxy filings. Data were not available for Royal Dutch Petroleum, an acquiring firm in the nontarget group.
19 Although the partial correlation coefficient between SIZE and MGTHOLD is negative (- .329) and significant (p = .0001), we are not concerned with the simultane- ous inclusion of these variables in the logit equations since we are primarily interested in the estimated coefficient on the abnormal returns. Potentially more troubling is a statistically significant, partial correlation coefficient between each of the abnormal returns and MGTHOLD (.159 [p = .013], .159 [p = .013], .125 [p = .053], .130 [p = .043], and .104 [p = .108] for the abnormal returns computed over the [0], [- 1, 1], [-5, 1], [-5, 20], and [-20, 40] windows, respectively). This direct correlation be- tween the returns to acquiring firms and MGTHOLD is consistent with Lewellen, Loderer, and Rosenfeld (1985) and You et al. (1986) and suggests that managers are less likely to make value-reducing acquisitions when they bear a larger proportion of the wealth consequences of their decisions. Although this significant correlation might suggest the use of a recursive system, the magnitude of the correlation seems low enough to allow us to draw meaningful inferences from a single-equation logit model.
BAD BIDDERS 393
overs are alternative means of mitigating manager-stockholder con- flicts, we expect firms with low managerial holdings to receive more takeover bids; this also leads us to expect a negative estimated coef- ficient on MGTHOLD. However, MGTHOLD may have a counter- acting positive effect on the likelihood of being a target: where man- agers own a large percentage of equity and thus bear a relatively larger proportion of the wealth consequences associated with their decisions, they may have stronger incentives to seek out bids, and they may have less incentive to resist bids and their accompanying pre- miums.20 Hence, the relationship between MGTHOLD and the likeli- hood of being a target is ambiguous a priori. The relationship be- tween MGTHOLD and the likelihood of being a hostile target seems unambiguous since the argument in favor of a positive coefficient estimate on MGTHOLD holds only for friendly bids. Hence, we ex- pect an inverse relationship between MGTHOLD and the likelihood of being a hostile target.2'
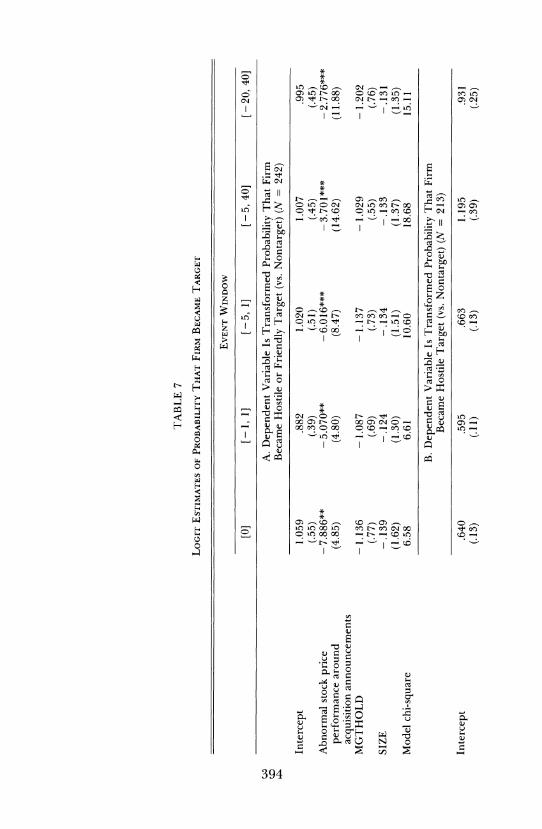
The results displayed in table 7 show that the likelihood of being a takeover target, either friendly or hostile, is significantly and inversely related to the abnormal stock price performance with the firm's acqui- sitions. The estimated coefficient has a negative sign in all the equa- tions, and all these coefficients are significant at the .05 level or higher. Both SIZE and MGTHOLD enter with negative estimated coefficients in all five equations, but none of these estimates is significant.
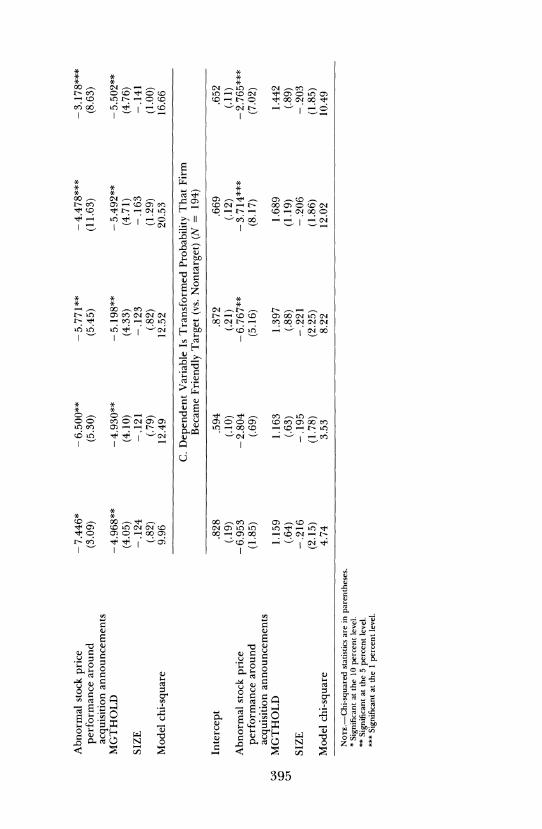
The abnormal returns associated with the firms' acquisitions also enter with negative, significant coefficients in the set of equations in which the dependent variable is the transformed probability that the firm is a hostile target. In four of the five equations, the estimated
20 Although MGTHOLD may be a good approximation of the extent to which man- agers directly bear the wealth consequences of their decisions, other measures may be more appropriate. Specifically, the proportion of a manager's wealth that consists of equity in his firm might be a better proxy for the extent to which his interests are directly aligned with stockholders. However, this measure also has its drawbacks. Theo- retically, if a manager's entire wealth consists of equity in his firm, he may be more risk averse than other, diversified stockholders. In order to diversify his wealth while main- taining his equity ownership in the firm, he may diversify the firm's activities in ways that do not necessarily maximize stockholder value. Hence, it is not obvious that as this proportion increases, managers' interests are more directly aligned with the interests of other stockholders. As a practical matter, this variable cannot be measured directly since the personal wealth of managers is not publicly available information. Since our principal interest in this paper lies elsewhere, we did not attempt an approximation of this variable (e.g., the ratio of the value of a manager's stockholdings to the value of his salary).
21 Walkling and Long (1984) find that the probability that a takeover attempt is hostile, as opposed to friendly, is inversely related to the percentage of equity owned by managers. Morck, Shleifer, and Vishny (1988) find that management of hostile targets owns significantly less equity than management of friendly targets.
3' *~~~~~~~~~'
m c t b 00
0 bG _
in - n
3' +t * .
m t- 11 c t- *n- O_ CC sG s 4_
C'I~~~~~~~ H Lt C ooN NCn> L m
H *
- v O Q *. O Z
H n - F ~o~ <
XZD_ c
_I _ O D
0~~~~~~~~~~~~~0
H .3 ' o *Y 0
~~~~~~
:~~~~~C Cl an an Cc ? -?_ >
o~~~~~~~
-~~~~~~~
E v *
c0 ON___
34 - 0 _
-4Q) 06ena>06394o (~
* * i*
00 Cj cl~~i In~ ZkL a
to- N- C) C) "IO 0
-
cut 0
* o o ' - o . _ t*
* * *
*0 *- cc n t-G) - CS G r _ C4 GM t 00 M O C) 31c" ~c t -G T in t-r- c:-G 00 0)
. I
t 0-c en - ( t- tC- (~ -In a) on C\ I -O C t- C. c _) _0 1 _n cu
sCZ
* * o * * * ; t * _ _
00 _
4 _ c
_n _ b _- _
b t -G<:00 M <, 00 M - 00 ( N C- r-
I~~~ I
> sH~ ~ ~ ~~>
*~ ~~~~ * * *
s _0 O 00(0_ 0G4_t-_
O-00 z 00 - 0o _0 N
CZ
Q
A
395
396 JOURNAL OF POLITICAL ECONOMY
coefficient on the abnormal returns is negative and significant at the .05 level or higher; in the equation containing the announcement day AR, this estimate is negative and significant at the .10 level. As antici- pated, MGTHOLD enters with a negative and significant (at the .05 level) estimated coefficient in all these equations. However, SIZE does not enter any of these equations with a significant estimated coef- ficient. Weaker results hold when the dependent variable is the trans- formed probability that the firm is a friendly target. The estimated coefficient on the abnormal returns is negative in all five equations, but it is not significant in the equations containing the announcement day AR and the CAR computed over the [-1, 1] window. The vari- able MGTHOLD enters each equation with a positive but insignificant coefficient estimate, and SIZE enters each of these equations with a negative but insignificant coefficient estimate.
In summary, the logit equations show that the results presented in tables 3 and 4 remain robust after firm size and management own- ership are controlled for. Firms that make bad acquisitions are more likely to receive a takeover offer than firms that make good acquisi- tions.
IV. Conclusion
The evidence in this paper is consistent with the argument, developed originally by Marris (1963) and Manne (1965), that one motive for corporate takeovers is to discipline managers who operate their firms in ways that do not maximize profits. It is also consistent with a more specific argument, developed by Jensen (1986), that many takeovers discipline managers who use free cash flow to make value-reducing acquisitions.
The evidence is also relevant for arguments made by critics of hostile takeovers. First, although critics often lament the advent of hostile "bust-up" takeovers (i.e., takeovers that are followed by large divestitures of the target firms' assets), this paper supports the argu- ment that hostile bust-up takeovers often promote economic effi- ciency by reallocating the targets' assets to higher-valued uses. Sec- ond, these results cast new light on evidence concerning the effect of takeovers on the equity value of acquiring firms. Critics of hostile takeovers often argue that although target shareholders fare well in takeovers, these transactions frequently diminish the equity value of acquiring firms. Our evidence suggests that takeovers can be both a "problem" and a "solution." Although, in the aggregate, we find that the returns to acquiring firms are approximately zero, the aggregate data obscure the fact that the market discriminates between "bad"
BAD BIDDERS 397
bidders, which are more likely to become takeover targets, and "good" bidders, which are less likely to become targets.
References
Alchian, Armen A., and Demsetz, Harold. "Production, Information Costs, and Economic Organization." A.E.R. 62 (December 1972): 777-95.
Asquith, Paul; Bruner, Robert F.; and Mullins, David W., Jr. "Merger Re- turns and the Form of Financing." Manuscript. Cambridge, Mass.: Har- vard Univ., 1987.
Berle, Adolf A., and Means, Gardiner C. The Modern Corporation and Private Property. New York: Macmillan, 1933.
Black, Bernard S. "Bidder Overpayment in Takeovers." Stanford Law Rev. 41 (February 1989): 597-660.
Bradley, Michael; Desai, Anand; and Kim, E. Han. "Synergistic Gains from Corporate Acquisitions and Their Division between the Stockholders of Target and Acquiring Firms."J. Financial Econ. 21 (May 1988): 3-40.
Demsetz, Harold. "The Structure of Ownership and the Theory of the Firm." J. Law and Econ. 26 (June 1983): 375-90.
Demsetz, Harold, and Lehn, Kenneth. "The Structure of Corporate Own- ership: Causes and Consequences."J.P.E. 93 (December 1985): 1155-77.
Fama, Eugene F. "Agency Problems and the Theory of the Firm."J.P.E. 88 (April 1980): 288-307.
Fama, Eugene F., and Jensen, Michael C. "Agency Problems and Residual Claims." J. Law and Econ. 26 (June 1983): 327-49. (a)
. "Separation of Ownership and Control." J. Law and Econ. 26 (June 1983): 301-25. (b)
Jarrell, Gregg A.; Brickley, James A.; and Netter, Jeffry M. "The Market for Corporate Control: The Empirical Evidence since 1980." J. Econ. Perspec- tives 2 (Winter 1988): 49-68.
Jarrell, Gregg A., and Poulsen, Annette. "Returns to Acquiring Firms in Tender Offers: Evidence from Three Decades." Financial Management 18 (Autumn 1989): 12-19.
Jensen, Michael C. "Agency Costs of Free Cash Flow, Corporate Finance, and Takeovers." A.E.R. Papers and Proc. 76 (May 1986): 323-29.
Jensen, Michael C., and Meckling, William H. "Theory of the Firm: Manage- rial Behavior, Agency Costs and Ownership Structure."J. Financial Econ. 3 (October 1976): 305-60.
Jensen, Michael C., and Ruback, Richard S. "The Market for Corporate Con- trol: The Scientific Evidence." J. Financial Econ. 11 (April 1983): 5-50.
Lang, Larry; Stulz, Rene M.; and Walkling, Ralph A. "Tobin's Q and the Gains from Successful Tender Offers." J. Financial Econ. (in press).
Lehn, Kenneth, and Poulsen, Annette. "Free Cash Flow and Stockholder Gains in Going Private Transactions."J. Finance 44 (July 1989): 771-87.
Lewellen, Wilbur; Loderer, Claudio; and Rosenfeld, Ahron. "Merger Deci- sions and Executive Stock Ownership in Acquiring Firms." J. Accounting and Econ. 7 (April 1985): 209-31.
Mahle, Steven. "Agency Costs and Acquiring Firm Excess Returns: An Em- pirical Test of the Free Cash Flow Hypothesis." Manuscript. Iowa City: Univ. Iowa, 1989.
398 JOURNAL OF POLITICAL ECONOMY
Maloney, Michael T.; McCormick, Robert E.; and Mitchell, Mark L. "Mana- gerial Decision Making and Capital Structure." Manuscript. Clemson, S.C.: Clemson Univ., 1989.
Manne, Henry G. "Mergers and the Market for Corporate Control." J.P.E. 73 (April 1965): 110-20.
Marris, Robin. "A Model of the 'Managerial' Enterprise." QJ.E. 77 (May 1963): 185-209.
Mitchell, Mark L., and Netter, Jeffry M. "Triggering the 1987 Stock Market Crash: Antitakeover Provisions in the Proposed House Ways and Means Tax Bill?" J. Financial Econ. (in press).
Morck, Randall; Shleifer, Andrei; and Vishny, Robert W. "Characteristics of Targets of Hostile and Friendly Takeovers." In Corporate Takeovers: Causes and Consequences, edited by AlanJ. Auerbach. Chicago: Univ. Chicago Press (for NBER), 1988.
Murphy, Kevin J. "Corporate Performance and Managerial Remuneration: An Empirical Analysis." J. Accounting and Econ. 7 (April 1985): 11-42.
Palepu, Krishna G. "Predicting Takeover Targets: A Methodological and Empirical Analysis." J. Accounting and Econ. 8 (March 1986): 3-35.
Porter, Michael E. "From Competitive Advantage to Corporate Strategy." Harvard Bus. Rev. 65 (May/June 1987): 43-59.
Ravenscraft, David J., and Scherer, F. M. "Life after Takeovers." J. Indus. Econ. 36 (December 1987): 147-56.
Roll, Richard. "The Hubris Hypothesis of Corporate Takeovers."J. Bus. 59, no. 2, pt. 1 (April 1986): 197-216.
Ryngaert, Michael, and Netter, Jeffry M. "Shareholder Wealth Effects of the Ohio Antitakeover Law."J. Law, Econ. and Organization 4 (Fall 1988): 373- 83.
Schumann, Lawrence. "State Regulation of Takeovers and Shareholder Wealth: The Case of New York's 1985 Takeover Statutes." RandJ. Econ. 19 (Winter 1988): 557-67.
Travlos, Nickolaos G. "Corporate Takeover Bids, Methods of Payment, and Bidding Firms' Stock Returns." J. Finance 42 (September 1987): 943-63.
Walkling, Ralph A., and Long, Michael S. "Agency Theory, Managerial Wel- fare, and Takeover Bid Resistance." RandJ. Econ. 15 (Spring 1984): 54-68.
You, Victor; Caves, Richard; Smith, Michael; and Henry, James. "Mergers and Bidders' Wealth: Managerial and Strategic Factors." In The Economics of Strategic Planning: Essays in Honor of Joel Dean, edited by Lacy Glenn Thomas ILL. Lexington, Mass.: Lexington Books, 1986.