Embed Size (px)
Citation preview
Do Liberal Arts Colleges Really Foster Good Practices in UndergraduateEducation?
Ernest T. Pascarella, Ty M. Cruce, Gregory C. Wolniak, Charles F. Blaich
Journal of College Student Development, Volume 45, Number 1, January/February2004, pp. 57-74 (Article)
Published by The Johns Hopkins University PressDOI: 10.1353/csd.2004.0013
For additional information about this article
Access provided by Grand Valley State University Library (14 Nov 2013 12:09 GMT)
http://muse.jhu.edu/journals/csd/summary/v045/45.1pascarella.html

JANUARY/FEBRUARY 2004 VOL 45 NO 1 57
Do Liberal Arts Colleges Really Foster GoodPractices in Undergraduate Education?Ernest T. Pascarella Gregory C. Wolniak Ty M. Cruce Charles F. Blaich
Researchers estimated the net effects ofliberal arts colleges on 19 measures of goodpractices in undergraduate educationgrouped into seven categories. Analyses of3-year longitudinal data from five liberalarts colleges, four research universities, andseven regional universities were conducted.Net of a battery of student precollegecharacteristics, whether or not a student wasenrolled full-time and lived on campus, andthe academic selectivity of the institutionattended, liberal arts colleges evidencedstronger positive impacts on a broad rangeof empirically vetted good practices inundergraduate education than did eitherresearch universities or regional institutions.The impact was most pronounced in theinitial year of postsecondary education.
In a review of the literature on collegeimpact, Pascarella and Terenzini (1991)argued that the academic selectivity, orpreparedness, of an institution’s student bodymay, in and of itself, reveal very little aboutthat institution’s impact on student cognitiveand personal development. Rather, “selecti-vity may have a latent impact . . . that isactivated only when embedded in a support-ive social-psychological context” (Pascarella& Terenzini, 1991, p. 546). The elements ofthis supportive social-psychological context
Ernest T. Pascarella is the Mary Louise Petersen Chair in Higher Education; Gregory C. Wolniak is adoctoral student of Social Foundations of Education; and Ty M. Cruce is a doctoral candidate in HigherEducation; each at The University of Iowa. Charles F. Blaich is Associate Professor of Psychology andDirector of Inquiries at the Center of Inquiry in the Liberal Arts at Wabash College. This research wassupported by The Center of Inquiry in the Liberal Arts at Wabash College and by Grant No. R117G10037from the U.S. Department of Education.
would appear to be such things as a strongfaculty emphasis on teaching and studentdevelopment, a common valuing of the lifeof the mind, small size, a shared intellectualexperience, and frequent interaction in andoutside the classroom between students andfaculty and between students and their peers(Pascarella & Terenzini, 1998). Such insti-tutional traits would appear to be most oftenfound at small, selective liberal arts colleges(Astin, 1999; Chickering, 1969; Chickering& Reisser, 1993; Pascarella & Terenzini,1991). To be sure, there is cross-sectionalevidence to suggest that both current stu-dents and alumni of liberal arts collegesreport a significantly different undergraduateexperience than counterparts who arestudents or graduates of other types ofinstitutions. These differences include higherlevels of academic and social engagement,more intense learning experiences, and morefrequent extracurricular involvement (Heath,1968; Hu & Kuh, 2003; “What Matters inCollege After College,” 2002). However, theextent to which liberal arts colleges actuallyfoster such educationally influential experi-ences is not clear from the existing cross-sectional evidence. By their very nature,cross-sectional studies make it extremelydifficult to control for differential studentrecruitment and selection effects (Astin,
58 Journal of College Student Development
Pascarella, Cruce, Wolniak, & Blaich
2003; Pascarella, 2001; Pascarella & Teren-zini, 1991). It may simply be the case thatliberal arts colleges attract and enrollstudents who are more inclined to high levelsof academic and social engagement, andmore receptive to the educational influencesof postsecondary education. To address thisissue, we employed longitudinal data toestimate the unique or net impact of attend-ing a liberal arts college on students’experiences in seven areas identified byexisting evidence as good practices inundergraduate education. The longitudinalnature of the data permitted us to estimatethe impact of liberal arts colleges on goodpractices while statistically controlling fora broad range of important student pre-college characteristics, secondary schoolexperiences, and other potential confoundinginfluences.
The Structure of Good Practices inUndergraduate EducationIn a project sponsored by the AmericanAssociation for Higher Education, theEducation Commission of the States, andThe Johnson Foundation, Chickering andGamson (1987, 1991) synthesized theexisting evidence on the impact of collegeon students and distilled it into seven broadcategories or principles for good practice inundergraduate education. These sevenprinciples or categories are: (a) student-faculty contact, (b) cooperation amongstudents, (c) active learning, (d) promptfeedback to students, (e) time on task,(f ) high expectations, and (g) respect fordiverse students and diverse ways of know-ing (Chickering & Gamson, 1991). Theinfluence of Chickering and Gamson’s sevenprinciples has been extensive. For example,one of the most broad-based annual surveysof undergraduates in the country, the Nation-
al Survey of Student Engagement (NSSE),is based on questionnaire items that attemptto operationalize the seven good practices(Kuh, 2001).
From an empirical standpoint, the NSSEand similar surveys are solidly based. Exten-sive evidence exists to support the predictivevalidity of Chickering and Gamson’s (1987,1991) principles of good practice in under-graduate education. Even in the presence ofcontrols for important confounding influ-ences, various measures of the good practicedimensions are significantly and positivelylinked to desired aspects of cognitive andnoncognitive growth during college (Astin,1993; Chickering & Reisser, 1993; Kuh,Schuh, Whitt, & Associates, 1991; Pascarella& Terenzini, 1991, in press). Examples ofindividual studies supporting the predictivevalidity of specific dimensions of goodpractices in undergraduate education includethe following: student-faculty contact(Anaya, 1999; Frost, 1991; Kuh & Hu, 1999;Terenzini, Springer, Yaeger, Pascarella, &Nora, 1994); cooperation among students(Cabrera, Crissman, Bernal, Nora, Terenzini,& Pascarella, 2002; Johnson & Johnson,1993; Johnson, Johnson, & Smith, 1998a,1998b; Qin, Johnson, & Johnson, 1995);active learning (Grayson, 1999; Hake, 1998;Kuh, Pace, & Vesper, 1997; Lang, 1996;Murray & Lang, 1997); academic effort/timeon task (Astin, 1993; Ethington, 1998;Hagedorn, Siadat, Nora, & Pascarella, 1997;Johnstone, Ashbaugh, & Warfield, 2002;Watson & Kuh, 1996); prompt feedback tostudents (d’Apollonia & Abrami, 1997;Feldman, 1997); high expectations (Arnold,Kuh, Vesper, & Schuh, 1993; Astin, 1993;Bray, Pascarella, & Pierson, 2003; Whitmire& Lawrence, 1996); and diversity experi-ences (Gurin, 1999; Kitchener, Wood, &Jensen, 2000; Pascarella, Palmer, Moye, &
JANUARY/FEBRUARY 2004 VOL 45 NO 1 59
Good Practices in Undergraduate Education
Pierson, 2001; Terenzini et al., 1994;Umbach & Kuh, (2003).
Other evidence on college impact notsynthesized by Chickering and Gamson(1987, 1991) suggests the predictive validityof two additional dimensions of good prac-tice in undergraduate education. These arethe quality of teaching received (Feldman,1997; Hines, Cruickshank, & Kennedy,1985; Pascarella, Edison, Nora, Hagedorn,& Braxton, 1996; Wood & Murray, 1999);and influential interactions with otherstudents (Astin, 1993; Davis & Murrell,1993; Douzenis, 1996; Volkwein & Carbone,1994; Whitt, Edison, Pascarella, Nora, &Terenzini, 1999).
It is clear from the existing evidence thatwe can identify dimensions of good practicein undergraduate education that uniquelyenhance cognitive and personal developmentduring college. For the current investigation,we sought to determine if liberal arts collegesare more proficient in fostering these goodpractices than are other institutions. Inoperationalizing good practices, we wereguided by the research on the predictivevalidity of different dimensions of goodpractice reviewed above. Indeed, many ofthe operational definitions of good practicesemployed in this investigation were eitheradapted or taken directly from the studieson predictive validity previously cited (e.g.,Bray et al., 2003; Cabrera et al., 2002;Feldman, 1997; Hagedorn et al., 1997;Pascarella et al., 1996; Terenzini et al., 1994;Whitt et al., 1999).
METHODSample and Data CollectionThe institutional sample was 16 four-yearcolleges and universities located in 13 statesthroughout the country. Institutions were
chosen from the National Center on Edu-cation Statistics IPEDS data to representdifferences in colleges and universitiesnationwide on such characteristics as insti-tutional type and control (e.g., selective andgeneral private liberal arts colleges, publicand private national research universities,comprehensive regional colleges and univer-sities), size, location, commuter versusresidential character, and ethnic distributionof the undergraduate student body. Thissampling technique provided a sample ofinstitutions with a wide range of selec-tivity—from some of the most selectiveinstitutions in the country to institutions thatwere essentially open admission. The studentpopulation from the 16 schools approxi-mated the national population of four-yearundergraduates by ethnicity, gender, and age.Five of the institutions were private liberalarts colleges that varied widely in selectivity,and had a median enrollment of 1,707.According to the Carnegie Typology, theywere designated as either selective or generalliberal arts colleges. Three of the institutionswere designated by the Carnegie Typologyas Research I institutions, while one wasdesignated a Research II institution. Here-after, this group of four institutions will betermed research universities. The medianenrollment of the research universities was22,990. The remaining seven institutions fellinto Carnegie categories between liberal artscolleges and research universities. Thesewere comprehensive and doctoral-grantinginstitutions with limited graduate programsand a primarily regional mission. The medi-an enrollment at these seven institutions was12,478. Hereafter, this group of colleges anduniversities is termed regional institutions.
The individuals in the sample wereparticipants in the National Study of StudentLearning (NSSL), a federally funded, 3-year
60 Journal of College Student Development
Pascarella, Cruce, Wolniak, & Blaich
longitudinal investigation of the factors thatinfluence learning and cognitive develop-ment in college. The initial sample of 2,913students was selected randomly from theincoming first-year class at each of the 16participating institutions. The first datacollection was conducted in Fall 1992 as thestudents were entering college. The datacollected included student demographiccharacteristics and high school experiences,as well as aspirations and expectations ofcollege. Participants also completed thereading comprehension, mathematics, andcritical thinking tests of the Collegiate As-sessment of Academic Proficiency (CAAP)developed by ACT (American CollegeTesting Program, 1990). Each of the threetests consisted of multiple-choice items andtook 40 minutes to complete. In the Springof 1993, and again in the Spring of 1994 andthe Spring of 1995, each participant com-pleted different CAAP tests as well as theCollege Student Experiences Questionnaire(CSEQ) (Pace, 1990) and an NSSL follow-up questionnaire. The CSEQ and the NSSLquestionnaires gathered extensive informa-tion about each student’s classroom andnonclassroom experiences during the pre-ceding school year. Useable data at the endof the first, second, and third years of thestudy were available for 1,957 students,1,341 students, and 936 students, respec-tively. Because of attrition from the sample,we developed a separate sample weightingalgorithm for each of the 3 years of the studyto adjust for potential response bias by sex,ethnicity, and institution. For each year ofthe study, within each of the 16 institutions,participants were weighted up to thatinstitution’s end-of-year population by sex(male or female) and race/ethnicity (White,Black, Hispanic, Other). For example, if aninstitution had 100 Hispanic men in its first-
year class and 25 Hispanic men in thesample, each Hispanic male in the first-yearsample was assigned a weight of 4.00.
Although applying sample weights inthis way corrects for bias in the samples weanalyzed by sex, ethnicity, and institution,it cannot adjust for nonresponse bias.However, we conducted several additionalanalyses to examine differences in thecharacteristics of students who participatedin all years of the NSSL and those whodropped out of the study. The dropoutsconsisted of two groups: (a) those whodropped out of the institution during thestudy, and (b) those who persisted at theinstitution but dropped out of the study.Initial participants who left their respectiveinstitutions had somewhat lower levels ofprecollege cognitive test scores (as measuredby Fall 1992 scores on the CAAP readingcomprehension, mathematics, and criticalthinking modules), socioeconomic back-ground, and academic motivation than theircounterparts who persisted in the study. Yetstudents who remained in the study and thosewho dropped out of the study but persistedat the institution differed in only small,chance ways with respect to precollegecognitive test scores, age, race, and socio-economic background (Pascarella, Edison,Nora, Hagedorn, & Terenzini, 1998).
Variables. The independent variable wasa set of two dummy variables (coded 1 or0) that compared students attending liberalarts colleges with students attending eitherresearch universities or regional institutions.As indicated previously, in selecting andcreating dependent measures, we wereguided by Chickering and Gamson’s (1987,1991) principles of good practice in under-graduate education and research on effectiveteaching and influential peer interactions incollege. From the data available on the
JANUARY/FEBRUARY 2004 VOL 45 NO 1 61
Good Practices in Undergraduate Education
yearly CSEQ and NSSL follow-up question-naires, we created 19 individual measures orscales of good practices grouped in sevengeneral categories:1. Student-Faculty Contact: quality of
nonclassroom interactions with faculty,faculty interest in teaching and studentdevelopment;
2. Cooperation Among Students: instruc-tional emphasis on cooperative learning,course-related interaction with peers;
3. Active Learning/Time on Task: academiceffort/involvement, essay exams incourses, instructor use of higher orderquestioning techniques, emphasis onhigher order examination questions,computer use;
4. Prompt Feedback: instructor feedback tostudents;
5. High Expectations: course challenge/effort, scholarly/intellectual emphasis,number of textbooks or assigned read-ings, number of term papers or writtenreports;
6. Quality of Teaching: institutional skill/clarity, instructional organization/preparation;
7. Influential Interactions With OtherStudents: quality of interactions withstudents, non-course-related interactionswith peers, cultural and interpersonalinvolvement.
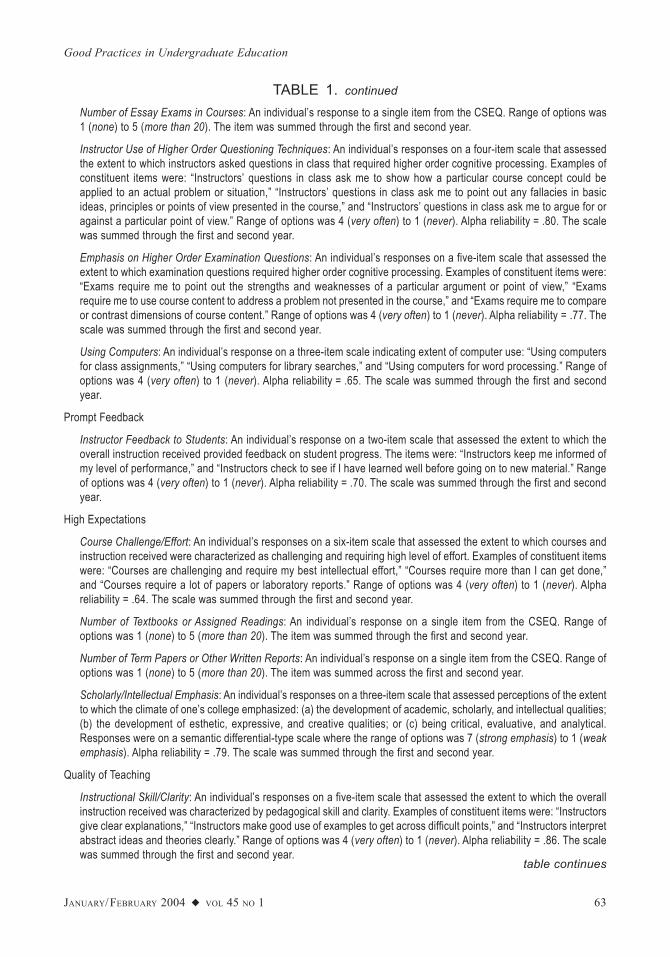
All 19 individual measures were formedby summing student responses on the CSEQand NSSL follow-up questionnaires obtainedduring the first; the first and second; or thefirst, second, and third follow-up datacollections. Table 1 shows detailed opera-tional definitions and where appropriate,psychometric properties of the independent
variable and all dependent variables in thestudy.
Analyses. Because measures of goodpractices in the study were based on studentself-reports, there was a danger that theimpact of liberal arts colleges would beseriously confounded by the distinct charac-teristics or predilections of the students theyrecruit and enroll (Astin, 2003; Pascarella,2001). This is a major methodologicalproblem in nearly all existing cross-sectionalresearch on the impact of liberal arts collegeson students’ academic and nonacademicexperiences during college. However, in thisinvestigation, the longitudinal nature of theNSSL data permitted us to introduce statis-tical controls for a wide range of studentprecollege characteristics and experiences.
Ordinary least squares regression wasthe basic data analytic approach employed.For each of the 3 years of the study, eachdependent variable (i.e., good practicemeasure) was regressed on the two dummyvariables representing liberal arts collegesversus research universities or regionalinstitutions and a battery of student pre-college and other control variables. Thestudent precollege control variables were:tested academic preparation (a composite ofstudents’ precollege CAAP reading, mathe-matics, and critical thinking test scores;reliability = .83); a measure of academicmotivation (reliability = .65); a measure ofeducational degree plans; whether or not thecollege attended was one’s first choice; age;race; sex; a composite measure of parentaleducational degree attainment and income;self-reported secondary school grades; andtime spent during secondary school in eightseparate areas of involvement (studying,socializing with friends, talking with teach-ers outside of class, working for pay,exercising or sports, studying with friends,

62 Journal of College Student Development
Pascarella, Cruce, Wolniak, & Blaich
table continues
TABLE 1.Operational Definitions of Independent and Dependent Variables
Independent Variable
Liberal Arts College vs. Other Institutions: Two dummy variables that represented students at liberal arts colleges vs.students at research universities and students at liberal arts colleges vs. students at regional institutions.
Dependent Variables
Student-Faculty Contact
Quality of Nonclassroom Interactions With Faculty: An individual’s responses on a five-item scale that assessed thequality and impact of one’s nonclassroom interactions with faculty. Examples of constituent items were: “Since comingto this institution I have developed a close personal relationship with at least one faculty member,” “My nonclassroominteractions with faculty have had a positive influence on my personal growth, values and attitudes,” and “Mynonclassroom interactions with faculty have had a positive influence on my intellectual growth and interest in ideas.”Range of options was 5 (strongly agree) to 1 (strongly disagree). Alpha reliability = .83. The scale was summed throughthe first and second year of college.
Faculty Interest in Teaching and Student Development: An individual’s responses on a five-item scale assessing students’perceptions of faculty interest in teaching and students. Examples of constituent items were: “Few of the faculty membersI have had contact with are genuinely interested in students” (coded in reverse), “Most of the faculty members I havehad contact with are genuinely interested in teaching,” and “Most of the faculty members I have had contact with areinterested in helping students grow in more than just academic areas.” Range of options was 5 (strongly agree) to1 (strongly disagree). Alpha reliability = .71. The scale was summed through the first and second year.
Cooperation Among Students
Instructional Emphasis on Cooperative Learning: An individual’s responses on a four-item scale that assessed theextent to which the overall instruction received emphasized cooperative learning. Examples of constituent items were:“I am required to work cooperatively with other students on course assignments,” “In my classes, students teach eachother in groups instead of only having instructors teach,” and “Instructors encourage learning in student groups.” Rangeof options was 4 (very often) to 1 (never). Alpha reliability = .81. The scale was summed through the first and secondyear.
Course-Related Interaction With Peers: An individual’s responses on a 10-item scale that assessed the nature of one’sinteractions with peers focusing on academic coursework. Examples of constituent items were: “Studying with studentsfrom my classes,” “Tried to explain the material to another student or friend,” and “Attempted to explain an experimentalprocedure to a classmate.” Range of options was 4 (very often) to 1 (never). Alpha reliability = .79. The scale wassummed through the first and second year.
Active Learning/Time on Task
Academic Effort/Involvement: An individual’s response on a 37-item, factorially derived but modified scale that assessedone’s academic effort or involvement in library experiences, experiences with faculty, course learning, and experiencesin writing. The scale combined four, 10-item involvement dimensions from the CSEQ, minus three items that wereincorporated into the Course-Related Interaction with Peers Scale described above. Examples of constituent itemswere: “Ran down leads, looked for further references that were cited in things you read,” “Did additional readings ontopics that were discussed in class,” and “Revised a paper or composition two or more times before you were satisfiedwith it.” Range of options was 4 (very often) to 1 (never). Alpha reliability = .92. The scale was summed through thefirst and second year.
JANUARY/FEBRUARY 2004 VOL 45 NO 1 63
Good Practices in Undergraduate Education
TABLE 1. continued
table continues
Number of Essay Exams in Courses: An individual’s response to a single item from the CSEQ. Range of options was1 (none) to 5 (more than 20). The item was summed through the first and second year.
Instructor Use of Higher Order Questioning Techniques: An individual’s responses on a four-item scale that assessedthe extent to which instructors asked questions in class that required higher order cognitive processing. Examples ofconstituent items were: “Instructors’ questions in class ask me to show how a particular course concept could beapplied to an actual problem or situation,” “Instructors’ questions in class ask me to point out any fallacies in basicideas, principles or points of view presented in the course,” and “Instructors’ questions in class ask me to argue for oragainst a particular point of view.” Range of options was 4 (very often) to 1 (never). Alpha reliability = .80. The scalewas summed through the first and second year.
Emphasis on Higher Order Examination Questions: An individual’s responses on a five-item scale that assessed theextent to which examination questions required higher order cognitive processing. Examples of constituent items were:“Exams require me to point out the strengths and weaknesses of a particular argument or point of view,” “Examsrequire me to use course content to address a problem not presented in the course,” and “Exams require me to compareor contrast dimensions of course content.” Range of options was 4 (very often) to 1 (never). Alpha reliability = .77. Thescale was summed through the first and second year.
Using Computers: An individual’s response on a three-item scale indicating extent of computer use: “Using computersfor class assignments,” “Using computers for library searches,” and “Using computers for word processing.” Range ofoptions was 4 (very often) to 1 (never). Alpha reliability = .65. The scale was summed through the first and secondyear.
Prompt Feedback
Instructor Feedback to Students: An individual’s response on a two-item scale that assessed the extent to which theoverall instruction received provided feedback on student progress. The items were: “Instructors keep me informed ofmy level of performance,” and “Instructors check to see if I have learned well before going on to new material.” Rangeof options was 4 (very often) to 1 (never). Alpha reliability = .70. The scale was summed through the first and secondyear.
High Expectations
Course Challenge/Effort: An individual’s responses on a six-item scale that assessed the extent to which courses andinstruction received were characterized as challenging and requiring high level of effort. Examples of constituent itemswere: “Courses are challenging and require my best intellectual effort,” “Courses require more than I can get done,”and “Courses require a lot of papers or laboratory reports.” Range of options was 4 (very often) to 1 (never). Alphareliability = .64. The scale was summed through the first and second year.
Number of Textbooks or Assigned Readings: An individual’s response on a single item from the CSEQ. Range ofoptions was 1 (none) to 5 (more than 20). The item was summed through the first and second year.
Number of Term Papers or Other Written Reports: An individual’s response on a single item from the CSEQ. Range ofoptions was 1 (none) to 5 (more than 20). The item was summed across the first and second year.
Scholarly/Intellectual Emphasis: An individual’s responses on a three-item scale that assessed perceptions of the extentto which the climate of one’s college emphasized: (a) the development of academic, scholarly, and intellectual qualities;(b) the development of esthetic, expressive, and creative qualities; or (c) being critical, evaluative, and analytical.Responses were on a semantic differential-type scale where the range of options was 7 (strong emphasis) to 1 (weakemphasis). Alpha reliability = .79. The scale was summed through the first and second year.
Quality of Teaching
Instructional Skill/Clarity: An individual’s responses on a five-item scale that assessed the extent to which the overallinstruction received was characterized by pedagogical skill and clarity. Examples of constituent items were: “Instructorsgive clear explanations,” “Instructors make good use of examples to get across difficult points,” and “Instructors interpretabstract ideas and theories clearly.” Range of options was 4 (very often) to 1 (never). Alpha reliability = .86. The scalewas summed through the first and second year.
64 Journal of College Student Development
Pascarella, Cruce, Wolniak, & Blaich
TABLE 1. continued
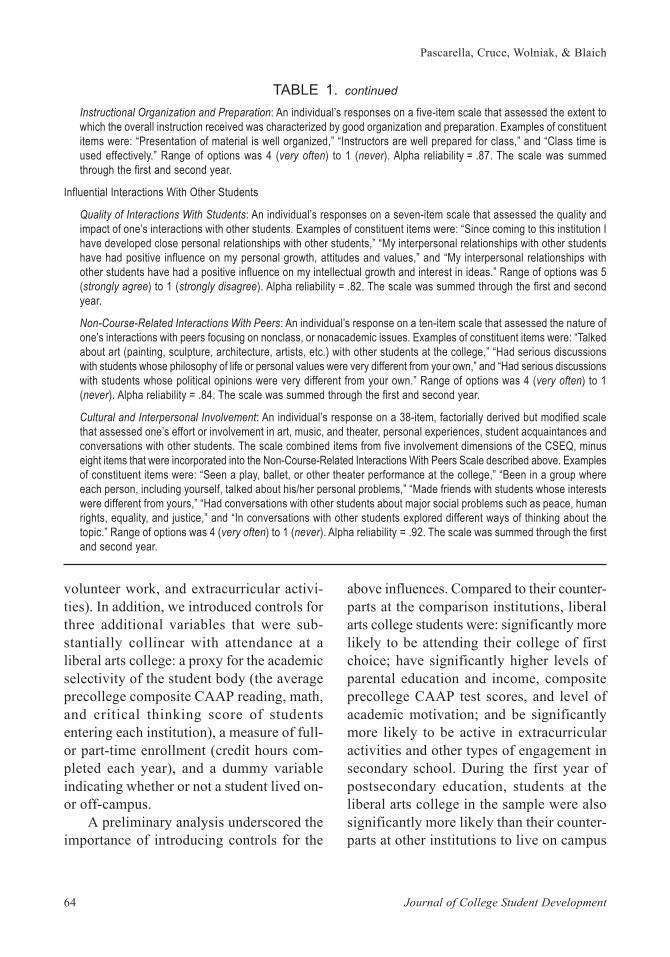
Instructional Organization and Preparation: An individual’s responses on a five-item scale that assessed the extent towhich the overall instruction received was characterized by good organization and preparation. Examples of constituentitems were: “Presentation of material is well organized,” “Instructors are well prepared for class,” and “Class time isused effectively.” Range of options was 4 (very often) to 1 (never). Alpha reliability = .87. The scale was summedthrough the first and second year.
Influential Interactions With Other Students
Quality of Interactions With Students: An individual’s responses on a seven-item scale that assessed the quality andimpact of one’s interactions with other students. Examples of constituent items were: “Since coming to this institution Ihave developed close personal relationships with other students,” “My interpersonal relationships with other studentshave had positive influence on my personal growth, attitudes and values,” and “My interpersonal relationships withother students have had a positive influence on my intellectual growth and interest in ideas.” Range of options was 5(strongly agree) to 1 (strongly disagree). Alpha reliability = .82. The scale was summed through the first and secondyear.
Non-Course-Related Interactions With Peers: An individual’s response on a ten-item scale that assessed the nature ofone’s interactions with peers focusing on nonclass, or nonacademic issues. Examples of constituent items were: “Talkedabout art (painting, sculpture, architecture, artists, etc.) with other students at the college,” “Had serious discussionswith students whose philosophy of life or personal values were very different from your own,” and “Had serious discussionswith students whose political opinions were very different from your own.” Range of options was 4 (very often) to 1(never). Alpha reliability = .84. The scale was summed through the first and second year.
Cultural and Interpersonal Involvement: An individual’s response on a 38-item, factorially derived but modified scalethat assessed one’s effort or involvement in art, music, and theater, personal experiences, student acquaintances andconversations with other students. The scale combined items from five involvement dimensions of the CSEQ, minuseight items that were incorporated into the Non-Course-Related Interactions With Peers Scale described above. Examplesof constituent items were: “Seen a play, ballet, or other theater performance at the college,” “Been in a group whereeach person, including yourself, talked about his/her personal problems,” “Made friends with students whose interestswere different from yours,” “Had conversations with other students about major social problems such as peace, humanrights, equality, and justice,” and “In conversations with other students explored different ways of thinking about thetopic.” Range of options was 4 (very often) to 1 (never). Alpha reliability = .92. The scale was summed through the firstand second year.
volunteer work, and extracurricular activi-ties). In addition, we introduced controls forthree additional variables that were sub-stantially collinear with attendance at aliberal arts college: a proxy for the academicselectivity of the student body (the averageprecollege composite CAAP reading, math,and critical thinking score of studentsentering each institution), a measure of full-or part-time enrollment (credit hours com-pleted each year), and a dummy variableindicating whether or not a student lived on-or off-campus.
A preliminary analysis underscored theimportance of introducing controls for the
above influences. Compared to their counter-parts at the comparison institutions, liberalarts college students were: significantly morelikely to be attending their college of firstchoice; have significantly higher levels ofparental education and income, compositeprecollege CAAP test scores, and level ofacademic motivation; and be significantlymore likely to be active in extracurricularactivities and other types of engagement insecondary school. During the first year ofpostsecondary education, students at theliberal arts college in the sample were alsosignificantly more likely than their counter-parts at other institutions to live on campus
JANUARY/FEBRUARY 2004 VOL 45 NO 1 65
Good Practices in Undergraduate Education
and be enrolled full-time.In estimating the net or unique impact
of attending a liberal arts college (versusother institutions) on any good practicedimension in the second and third year, wealso included controls for one’s score on thatdimension in the previous year. This per-mitted us to estimate the unique impact ongood practices of each succeeding year ofattendance at a liberal arts college.
All analyses conducted were based onweighted sample estimates, adjusted to theactual sample size to obtain correct standarderrors for tests of statistical significance.Because of the large sample sizes, an alphalevel of .01 was used in all tests of statisticalsignificance. For all statistically significantnet differences in good practice variablesbetween liberal arts colleges and otherinstitutions, an estimated effect size wascomputed. This was done by dividing themetric regression coefficient, indicating theaverage adjusted difference on a specificgood practice dimension between liberal artscollege students and their counterparts atother institutions, by the pooled standarddeviation of the good practice variable(Hays, 1994). The result indicated that partof a standard deviation that liberal artscolleges were advantaged or disadvantagedon the good practice variable relative toresearch universities or regional institutions.A positive effect size indicated an advantagefor liberal arts colleges, whereas a negativeeffect size indicated that liberal arts collegeswere disadvantaged relative to researchuniversities or regional institutions.
RESULTS
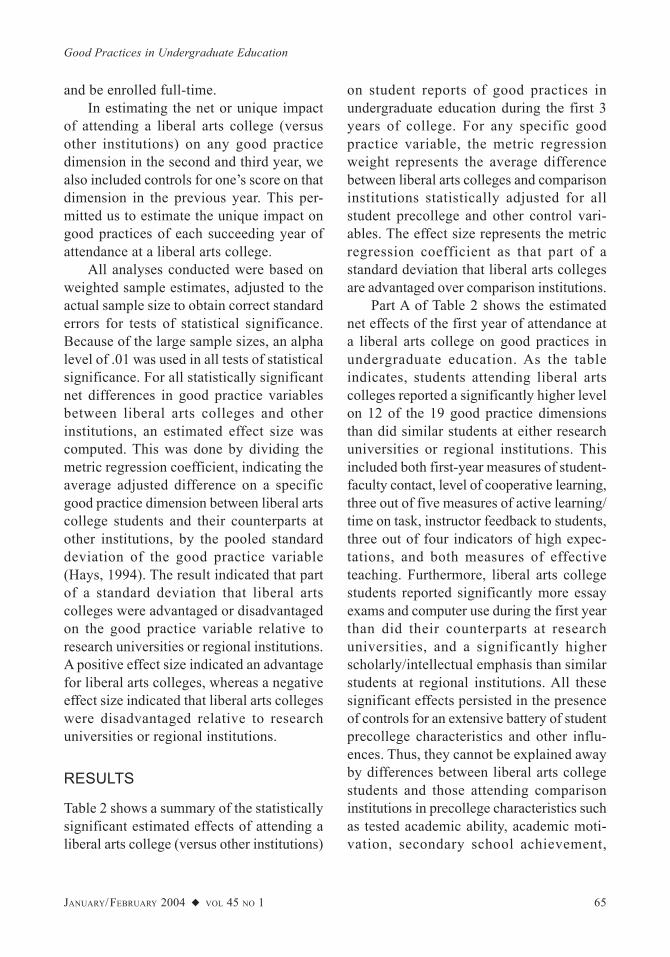
Table 2 shows a summary of the statisticallysignificant estimated effects of attending aliberal arts college (versus other institutions)
on student reports of good practices inundergraduate education during the first 3years of college. For any specific goodpractice variable, the metric regressionweight represents the average differencebetween liberal arts colleges and comparisoninstitutions statistically adjusted for allstudent precollege and other control vari-ables. The effect size represents the metricregression coefficient as that part of astandard deviation that liberal arts collegesare advantaged over comparison institutions.
Part A of Table 2 shows the estimatednet effects of the first year of attendance ata liberal arts college on good practices inundergraduate education. As the tableindicates, students attending liberal artscolleges reported a significantly higher levelon 12 of the 19 good practice dimensionsthan did similar students at either researchuniversities or regional institutions. Thisincluded both first-year measures of student-faculty contact, level of cooperative learning,three out of five measures of active learning/time on task, instructor feedback to students,three out of four indicators of high expec-tations, and both measures of effectiveteaching. Furthermore, liberal arts collegestudents reported significantly more essayexams and computer use during the first yearthan did their counterparts at researchuniversities, and a significantly higherscholarly/intellectual emphasis than similarstudents at regional institutions. All thesesignificant effects persisted in the presenceof controls for an extensive battery of studentprecollege characteristics and other influ-ences. Thus, they cannot be explained awayby differences between liberal arts collegestudents and those attending comparisoninstitutions in precollege characteristics suchas tested academic ability, academic moti-vation, secondary school achievement,

66 Journal of College Student Development
Pascarella, Cruce, Wolniak, & Blaich
TABLE 2.Statistically Significant Estimated Effects of Attending a Liberal Arts College (vs. aResearch University or Regional Institution) on Good Practices in Undergraduate
Education
Liberal Arts Colleges Liberal Arts Collegesvs.Research Universities vs.Regional Institutions
Metric MetricRegression Effect Regression Effect
Good Practice Variable Coefficienta Sizeb Coefficienta Sizeb
PART A: FIRST YEAR OF COLLEGEStudent-Faculty Contact
Quality of nonclassroom interactionswith faculty 2.211* .590 1.092* .291Faculty interest in teaching andstudent development 1.814* .570 0.783* .246
Cooperation Among StudentsInstructional emphasis oncooperative learning 0.496* .186 0.586* .206
Active Learning/Time on TaskAcademic effort/involvement 4.893* .330 6.460* .486Number of essay exams in courses 0.395* .386Instructor use of higher orderquestioning techniques 1.415* .544 0.986* .412Emphasis on higher orderexamination questions 1.073* .396 0.665* .245Computer use 0.910* .389
Prompt FeedbackInstructor feedback to students 0.778* .542 0.348* .243
High ExpectationsCourse challenge/effort 1.313* .476 0.982* .356Number of textbooks orassigned readings 0.318* .360 0.284* .322Number of term papers or written reports 0.425* .421 0.458* .453Scholarly/intellectual emphasis 0.953* .323
Quality of TeachingInstructional skill/clarity 1.304* .466 0.896* .316Instructional organization/preparation 0.891* .347 0.876* .341
PART B: SECOND YEAR OF COLLEGEStudent-Faculty Contact
Quality of nonclassroom interactionswith faculty 2.273* .345 1.205* .183Faculty interest in teaching andstudent development 1.725* .303 1.069* .188
Cooperation Among StudentsInstructional emphasis oncooperative learning 0.629* .148

JANUARY/FEBRUARY 2004 VOL 45 NO 1 67
Good Practices in Undergraduate Education
Active Learning/Time on TaskNumber of essay exams in courses 0.463* .288Instructor use of higher orderquestioning techniques 0.679* .168Emphasis on higher orderexamination questions 1.085* .234
Prompt FeedbackInstructor feedback to students 0.522* .360
High ExpectationsNumber of term papers or written reports 0.404* .256 0.385* .244Scholarly/intellectual emphasis 0.703* .143
Quality of TeachingInstructional skill/clarity 0.614* .127
PART C: THIRD YEAR OF COLLEGEStudent-Faculty Contact
Faculty interest in teaching andstudent development 1.209* .142
Cooperation Among StudentsInstructional emphasis oncooperative learning 0.831* .140
Active Learning/Time on TaskAcademic effort/involvement 5.083* .135Number of essay exams in courses 0.298* .136Instructor use of higher orderquestioning techniques 0.658* .118
Prompt FeedbackInstructor feedback to students 0.580* .414
Quality of TeachingInstructional skill/clarity 0.930* .131
Note. Sample sizes: First year—liberal arts colleges = 580; research universities = 544; regional institutions = 833. Second year—liberal arts colleges = 419;research universities = 373; regional institutions = 549. Third year—liberal arts colleges = 299; research universities = 259; regional institutions = 378.Equations also include controls for: tested precollege academic ability (composite of CAAP reading comprehension, mathematics, and criticalthinking test scores); the average tested precollege academic ability (composite of CAAP reading comprehension, mathematics, and critical thinkingtest scores) of students entering each institution; precollege educational plans; a measure of precollege academic motivation; whether or not thecollege attended was one’s first choice; age; sex; race; parents’ education and income; secondary school grades; time spent during secondaryschool in eight separate activities (studying, socializing with friends, talking with teachers outside of class, working for pay, exercising or sports,studying with friends, volunteer work, and extracurricular activities); on-campus versus off-campus residence; and cumulative number of credithours completed. In the second-year analyses, each equation also included a student’s first-year score on each good practice variable. In the third-year analyses, each equation also included a student’s cumulative first- and second-year score on each good practice variable.
a The metric regression coefficient represents the average difference between liberal arts college students and comparison institution students oneach good practice variable, statistically adjusted for the controls listed in the above “Note”.
b The effect size is computed by dividing the metric regression coefficient by the pooled standard deviation of the good practice variable andindicates that fraction of a standard deviation that liberal arts college students are advantaged or disadvantaged (depending on the sign) relativeto the comparison institution students.
*p < .01.
TABLE 2. continuedLiberal Arts Colleges Liberal Arts Colleges
vs.Research Universities vs.Regional Institutions
Metric MetricRegression Effect Regression Effect
Good Practice Variable Coefficienta Sizeb Coefficienta Sizeb
68 Journal of College Student Development
Pascarella, Cruce, Wolniak, & Blaich
family background, or secondary schoollevel of social and other involvement.Similarly, the differences uncovered are notattributable to full- or part-time attendance,living on versus off campus, or the academicselectivity (average student precollege testscores) of the institution attended.
Part A of Table 2 also shows an effectsize estimate of the net first-year advantageof liberal arts colleges on each statisticallysignificant good practice variable. Theaverage advantage of liberal arts collegesover research universities in good practices(.429 of a standard deviation) was somewhatlarger than the corresponding averageadvantage of liberal arts colleges overregional institutions (.322 of a standarddeviation).
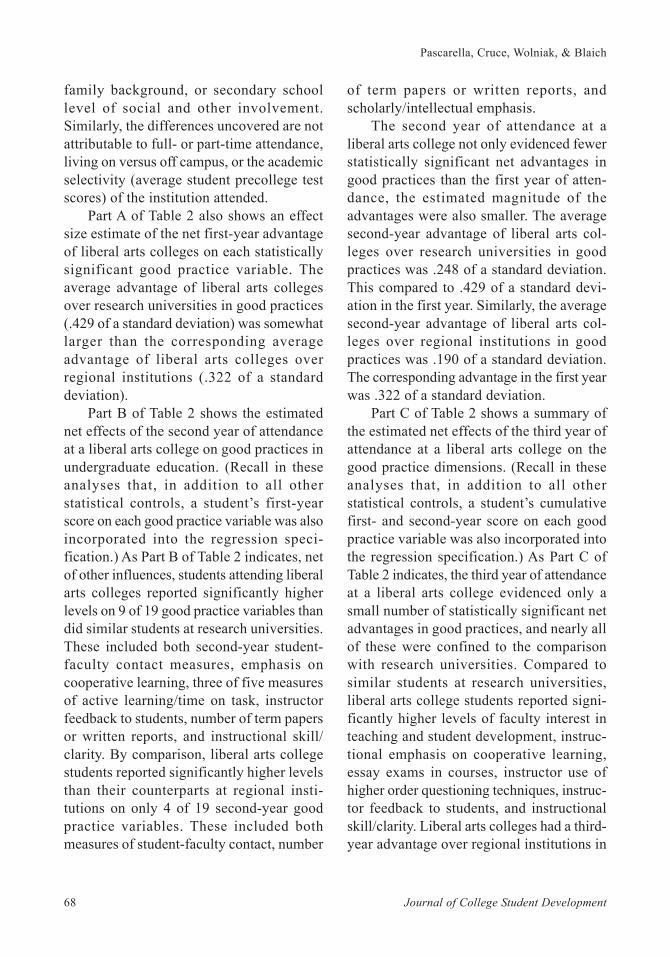
Part B of Table 2 shows the estimatednet effects of the second year of attendanceat a liberal arts college on good practices inundergraduate education. (Recall in theseanalyses that, in addition to all otherstatistical controls, a student’s first-yearscore on each good practice variable was alsoincorporated into the regression speci-fication.) As Part B of Table 2 indicates, netof other influences, students attending liberalarts colleges reported significantly higherlevels on 9 of 19 good practice variables thandid similar students at research universities.These included both second-year student-faculty contact measures, emphasis oncooperative learning, three of five measuresof active learning/time on task, instructorfeedback to students, number of term papersor written reports, and instructional skill/clarity. By comparison, liberal arts collegestudents reported significantly higher levelsthan their counterparts at regional insti-tutions on only 4 of 19 second-year goodpractice variables. These included bothmeasures of student-faculty contact, number
of term papers or written reports, andscholarly/intellectual emphasis.
The second year of attendance at aliberal arts college not only evidenced fewerstatistically significant net advantages ingood practices than the first year of atten-dance, the estimated magnitude of theadvantages were also smaller. The averagesecond-year advantage of liberal arts col-leges over research universities in goodpractices was .248 of a standard deviation.This compared to .429 of a standard devi-ation in the first year. Similarly, the averagesecond-year advantage of liberal arts col-leges over regional institutions in goodpractices was .190 of a standard deviation.The corresponding advantage in the first yearwas .322 of a standard deviation.
Part C of Table 2 shows a summary ofthe estimated net effects of the third year ofattendance at a liberal arts college on thegood practice dimensions. (Recall in theseanalyses that, in addition to all otherstatistical controls, a student’s cumulativefirst- and second-year score on each goodpractice variable was also incorporated intothe regression specification.) As Part C ofTable 2 indicates, the third year of attendanceat a liberal arts college evidenced only asmall number of statistically significant netadvantages in good practices, and nearly allof these were confined to the comparisonwith research universities. Compared tosimilar students at research universities,liberal arts college students reported signi-ficantly higher levels of faculty interest inteaching and student development, instruc-tional emphasis on cooperative learning,essay exams in courses, instructor use ofhigher order questioning techniques, instruc-tor feedback to students, and instructionalskill/clarity. Liberal arts colleges had a third-year advantage over regional institutions in
JANUARY/FEBRUARY 2004 VOL 45 NO 1 69
Good Practices in Undergraduate Education
only one good practice variable—academiceffort involvement.
Consistent with the trends observed fromthe first to the second year, the third year ofattendance at a liberal arts college not onlyevidenced fewer statistically significant netadvantages in good practices than the secondyear of attendance, the estimated magnitudeof the advantages were also smaller. Theaverage third-year advantage of liberal artscolleges over research universities in goodpractices was .171 of a standard deviation.This compared to .248 of a standard devi-ation in the second year. Though based ononly one significant net difference, themagnitude of the third advantage of liberalarts colleges over regional institutions was.135 of a standard deviation. This corre-sponding advantage in the second year was.190 of a standard deviation.
DISCUSSION
The primary purpose of this study was todetermine if liberal arts colleges positivelyinfluenced 19 measures of good practices inundergraduate education grouped into sevencategories. Analyses of three-year longi-tudinal data from five liberal arts colleges,four research universities, and seven regionalinstitutions, located in 13 states from aroundthe country were conducted. The longi-tudinal data permitted us to introduce statis-tical controls for an extensive battery ofstudent precollege characteristics and otherconfounding influences. The results of ouranalyses suggested two major conclusions.
First, our study provided consistentevidence supporting the contention that incomparison with other institutions, liberalarts colleges do, in fact, foster a broad rangeof empirically vetted good practices inundergraduate education. These good prac-
tices included measures of the quality andimpact of student interactions with faculty,emphasis on cooperative learning, measuresof student academic effort and time on task,prompt feedback to students, indices of highacademic expectations, and measures of thequality of teaching received. Though modestin magnitude, the statistically significantpositive effects of liberal arts collegespersisted even in the presence of controls foran extensive battery of confounding influ-ences. The positive link between attendanceat a liberal arts college and exposure to goodpractices in undergraduate education was notmerely a function of such characteristics ofthe students enrolled as academic ability,academic motivation, secondary schoolachievement, family background, or pre-college propensity for social and extra-curricular involvement. Similarly, the liberalarts college advantages we uncovered werestatistically independent of full- or part-timeenrollment, living on or off campus, and theacademic selectivity of an institution’sstudent body. Put another way, our evidencesuggests that liberal arts colleges tend topromote good practices in undergraduateeducation in a manner that cannot beexplained by their full-time, residentialcharacter, their academic selectivity, or thebackground abilities, motivations, andinterests of the students they enroll.
A second major conclusion was that theadvantages liberal arts colleges demonstratedin promoting good practices in under-graduate education were most pronouncedin the first year of postsecondary education.Thereafter, the incremental contribution ofeach additional year of attendance at a liberalarts college over previous years becomesprogressively smaller in magnitude. Forexample, during the first year of post-secondary education, liberal arts colleges had
70 Journal of College Student Development
Pascarella, Cruce, Wolniak, & Blaich
significant net advantages over researchuniversities on 14 good practice dimensions,with an average effect size of .429 of astandard deviation. By comparison, in thesecond year of college, liberal arts collegeswere advantaged on nine good practices(versus research universities) with anaverage effect size of .248 of a standarddeviation. In the third year, liberal artscolleges were advantaged on only six goodpractices, with an average effect size of .171of a standard deviation. A very similar trendwas found in the comparison of net differ-ences in good practices between liberal artscolleges and regional universities.
Such evidence is quite consistent withthe notion that many of the most powerfuleducating experiences of liberal arts collegesare a function of intense socializationprocesses that occur primarily during thefirst year of exposure to postsecondaryeducation (Chickering & Reisser, 1993;Hagedorn, Pascarella, Edison, Braxton,Nora, & Terenzini, 1999; Heath, 1968). Thisdoes not mean that liberal arts colleges arehaving only a trivial influence on goodpractices in undergraduate education sub-sequent to one’s initial exposure to postsec-ondary education. Our regression specifi-cations were designed to estimate theincremental impact on good practicesattributable to each successive year ofattendance at a liberal arts college. Thediminishing returns relationships we un-covered, however, does not mean that theemphasis on good practices in undergraduateeducation at liberal arts colleges is any lesssalient in the second and third years ofpostsecondary education than it was in thefirst year. Rather, what our findings suggestis that liberal arts colleges have their mostpronounced impact on good practices inundergraduate education in the initial year
of college. Thereafter, liberal arts collegescontinue to significantly promote goodpractices above and beyond their first-yearimpact, but their additional contributions insubsequent years increase at a diminishingrate.
In terms of promoting good practices inundergraduate education, the liberal artscolleges in our sample started out with asubstantial number of advantages overresearch universities and regional insti-tutions. They tended to enroll a student bodythat was more likely to live on campus andattend college full-time, was more aca-demically selective and motivated, hadparents with greater exposure to post-secondary education, and was more orientedtoward extracurricular and social engage-ment in secondary school. Yet, even withthese advantages taken into account, liberalarts colleges were still significantly morelikely than research universities and regionalinstitutions to promote a broad range of goodpractices. Although our data are not ashelpful in determining just how liberal artscolleges are able to bring this about, wesuggest that it may be attributable to thecombination of several factors.
The first of these factors is institutionalsize. As indicated previously, the medianstudent enrollment in the liberal arts collegesin our sample was 1,707. This compared witha median student enrollment of 22,990 in thesample’s research universities and 12,478 inthe sample’s regional institutions. As sug-gested by Chickering and Reisser (1993),simply by virtue of their relatively small size,liberal arts colleges present students with amore manageable social-psychologicalenvironment that invites greater levels ofstudent engagement than do larger insti-tutions. Interestingly, in our findings, theimpact of small size did not manifest itself

JANUARY/FEBRUARY 2004 VOL 45 NO 1 71
Good Practices in Undergraduate Education
in a student’s interactions with his or herpeers. The effects of attending a liberal artscollege on measures of influential interactionwith other students tended to becomenonsignificant when attending college full-time and living on campus were taken intoaccount. Rather, the small size of liberal artscolleges may have had a more pronouncedenabling influence on the frequency, quality,and impact of a student’s relationships withfaculty. In both the first and second year ofpostsecondary education, liberal arts collegestudents reported higher levels of bothfaculty interest in teaching and studentdevelopment and the quality of their non-classroom interactions with faculty than didsimilar students at either research univer-sities or regional institutions. Though limitedto relationships with faculty, such evidenceis supportive of recent efforts such aslearning communities and living-learningcenters that attempt to create more effectiveacademic subenvironments within largeuniversities (Inkelas & Weisman, 2003;Tinto & Goodsell, 1994).
Clearly, small institutional size and theattendant likelihood of small classes mighthave important implications, not only forshaping the nature of student-faculty rela-tionships, but also for the quality and impactof teaching that occurs in liberal arts colleges(Astin, 1999; Ludlow, 1996; Wachtel, 1998).However, it is likely that size accounts foronly part of the impact. What may be ofequal if not greater importance is an insti-tutional ethos or culture that places apremium on effective teaching and highacademic expectations. This ethos or culturemay be most pervasive at selective liberalarts colleges, but the evidence from thisstudy, though admittedly indirect, suggeststhat it may be characteristic of liberal artscolleges irrespective of their level of
selectivity. Controlling for student-bodyselectivity, as well as an extensive batteryof other confounding influences, liberal artscolleges in our sample still demonstratedsignificant first-year advantages over bothresearch universities and regional institutionson measures of effective teaching and highexpectations such as: instructional skill/clarity, instructional organization/prepara-tion, instructional emphasis on cooperativelearning, instructor use of higher orderquestioning techniques, emphasis on higherorder examination questions, student aca-demic effort/involvement, course challenge/effort, and number of assigned readings andwritten reports.
A culture that values both innovative andeffective teaching and high academic expec-tations is probably the result of a complexinterweaving of mutually reinforcing influ-ences. Certainly liberal arts colleges aremore likely than other four-year institutionsto attract and hire faculty who, for bothpersonal and professional reasons, valuegood teaching (Leslie, 2002). Furthermore,these initial values are probably accentuatedeven further by interaction with similarlyoriented faculty already at the institution.High academic expectations may also beshaped in part at least by faculty recruitmentand hiring practices. However, it is likelythat creating an institutional culture of highintellectual expectations is also promotedthrough purposeful administrative policiesthat support and reinforce a challengingundergraduate academic experience both inand out of the classroom. Our findingssuggest that an academically selective stu-dent body may not be a necessary pre-requisite for such an institutional culture atliberal arts colleges.
Finally, if student precollege traits, anda selective, residential, full-time student
72 Journal of College Student Development
Pascarella, Cruce, Wolniak, & Blaich
body do not fully explain why liberal artscolleges foster good practices in under-graduate education, it further reinforces theimportance of institutional policies andprograms aimed at narrowing the gap instudent experiences between liberal artscolleges and other types of institutions.Learning communities, living-learningcenters, first-year seminars and similarinterventions may offer several viableapproaches for accomplishing this at largerinstitutions (Inkelas & Weisman, 2003; Tinto& Goodsell, 1994; Upcraft, Gardner, &Associates, 1989).
LimitationsClearly the results of this investigation arelimited by the nature of the sample. TheNSSL researchers chose to study the effectsof a wide range of student experiences, insubstantial depth, over time. This meant alimit on the number of institutions studied.Consequently, the findings may not begeneralized to all four-year institutions in thecountry, and external validity is an un-deniable limitation of the study.
Similarly, a second limitation of therelatively small number of institutions in thestudy is that it made more sophisticated, andpotentially more revealing, data analyticapproaches such as hierarchical linearmodeling problematic. This study focused onthe estimated effects of attending a liberalarts college on individual students’ reportsof good practices in undergraduate educa-tion. It is not clear how different the results
might have been if institutional-level datahad been analyzed.
The findings are also limited by ouroperational definitions of “good practices inundergraduate education.” Although we wereguided by existing evidence on empiricallyvetted indicators of good practice dimen-sions, our operational definitions of variableswere limited by the data we analyzed.Certainly there are other equally validmeasures of good practices that might haveyielded somewhat different results than thecurrent investigation.
Fourth, the findings are limited byattrition from the sample across the threeyears of the study. Despite our weighting ofthe sample to make it more representativeof the population in each successive follow-up year, the potential for some selection biasis a clear limitation of the study.
Finally, the study is limited by the factthat the data were collected in the 1990s.Weighed against this, however, is thelongitudinal nature of the NSSL data and therichness of the variables measured. We knowof no other longitudinal data set that permitsone to introduce extensive controls forimportant confounding influences and yetprovides such an extensive array of reliableand valid measures of good practices inundergraduate education
Correspondence concerning this article should beaddressed to Ernest T. Pascarella, N491 LindquistCenter, University of Iowa, Iowa City, IA 52242;[email protected]
JANUARY/FEBRUARY 2004 VOL 45 NO 1 73
Good Practices in Undergraduate Education
REFERENCESAmerican College Testing Program (ACT). (1990). Report
on the technical characteristics of CAAP; Pilot year 1:1988-89. Iowa City, IA: Author.
Anaya, G. (1999, April). Within-college, curricular and co-curricular correlates of performance on the MCAT. Paperpresented at the annual meeting of the AmericanEducational Research Association, Montreal, Canada.
Arnold, J., Kuh, G., Vesper, N., & Schuh, J. (1993). Studentage and enrollment status as determinants of learning andpersonal development at metropolitan institutions.Journal of College Student Development, 34, 11-16.
Astin, A. (1993). What matters in college? San Francisco:Jossey-Bass.
Astin, A. (1999). How the liberal arts college affectsstudents. Daedalus, 128(1), 77-100.
Astin, A. (2003). Studying how college affects students: Apersonal history of the CIRP. About Campus, 8(3), 21-28.
Bray, G., Pascarella, E., & Pierson, C. (2003). Postsecondaryeducation and some dimensions of literacy development:An exploration of longitudinal evidence. Unpublishedmanuscript, University of Iowa, Iowa City.
Cabrera, A., Crissman, J., Bernal, E., Nora, A., Terenzini,P., & Pascarella, E. (2002). Collaborative learning: Itsimpact on college students’ development and diversity.Journal of College Student Development, 43(1), 20-34.
Chickering, A. (1969). Education and identity. SanFrancisco: Jossey-Bass.
Chickering, A., & Gamson, Z. (1987). Seven principles forgood practice in undergraduate education. AAHEBulletin,39(7), 3-7.
Chickering, A., & Gamson, Z. (1991). Applying the sevenprinciples for good practice in undergraduate education.San Francisco: Jossey-Bass.
Chickering, A., & Reisser, L. (1993). Education and identity(2nd ed.). San Francisco: Jossey-Bass.
d’Apollonia, S., & Abrami, P. (1997). Navigating studentratings of instruction. American Psychologist, 52,1198-1208.
Davis, T., & Murrell, P. (1993). A structural model ofperceived academic, personal, and vocational gainsrelated to college student responsibility. Research inHigher Education, 34, 267-289.
Douzenis, C. (1996). The relationship of quality of effortand estimate of knowledge gain among communitycollege students. Community College Review, 24(3),27-35.
Ethington, C. (1998, November). Influences of the normativeenvironment of peer groups on community collegestudents’ perceptions of growth and development. Paperpresented at the annual meeting of the Association forthe Study of Higher Education, Miami, FL.
Feldman, K. (1997). Identifying exemplary teachers andteaching: Evidence from student ratings. In R. Perry &J. Smart (Eds.), Effective teaching in higher education:Research and practice (pp. 368-395). Edison, NJ:Agathon Press.
Frost, S. (1991). Fostering the critical thinking of college
women through academic advising and faculty contact.Journal of College Student Development, 32, 359-366.
Grayson, J. (1999). The impact of university experienceson self-assessed skills. Journal of College StudentDevelopment, 40, 687-699.
Gurin, P. (1999). Expert report of Patricia Gurin. Retrievedfrom http://www.umich.edu/newsinfo/admission/expert/studies.html
Hagedorn, L., Pascarella, E., Edison, M., Braxton, J., Nora,A., & Terenzini, P. (1999). Institutional context and thedevelopment of critical thinking: A research note. Reviewof Higher Education, 22(3), 247-263.
Hagedorn, L., Siadat, M., Nora, A., & Pascarella, E. (1997).Factors leading to gains in mathematics during the firstyear of college. Journal of Women and Minorities inScience and Engineering, 3(3), 185-202.
Hake, R. (1998). Interactive-engagement versus traditionalmethods: A 6,000-student survey of mechanics test datafor introductory physics courses. American Journal ofPhysics, 66(1), 64-74.
Hays, W. (1994). Statistics (5th ed.). Fort Worth, TX:Harcourt Brace College.
Heath, D. (1968). Growing up in college: Liberal educationand maturity. San Francisco: Jossey-Bass.
Hines, C., Cruickshank, D., & Kennedy, J. (1985). Teacherclarity and its relationship to student achievement andsatisfaction. American Educational Research Journal, 22,87-99.
Hu, S., & Kuh, G. (2003). Maximizing what students getout of college: Testing a learning productivity model.Journal of College Student Development, 44, 185-203.
Inkelas, K., & Weisman, J. (2003). Different by design: Anexamination of student outcomes among participants inthree types of living-learning prognosis. Journal ofCollege Student Development, 44, 335-368.
Johnson, D., & Johnson, R. (1993). Cooperation amongadults: Impact on individual learning versus teamproductivity. Unpublished manuscript, University ofMinnesota, Minneapolis, MN.
Johnson, D., Johnson, R., & Smith, K. (1998a). Activelearning: Cooperation in the college classroom (2nd ed.).Edina, MN: Interaction.
Johnson, D., Johnson, R., & Smith, K. (1998b). Cooperativelearning returns to college. Change, 30(4), 26-35.
Johnstone, K., Ashbaugh, H., & Warfield, T. (2002). Effectsof repeated practice and contextual-writing experienceson college students’ writing skills. Journal of EducationalPsychology, 94(2), 305-315.
Kitchener, K., Wood, P., & Jensen, L. (2000, August).Promoting epistemic cognition and complex judgment incollege students. Paper presented at the annual meetingof the American Psychological Association, Washington,DC.
Kuh, G. (2001). The National Survey of Student Engagement:Conceptual framework and overview of psychometricproperties. Bloomington: Indiana University Center forPostsecondary Research and Planning.
74 Journal of College Student Development
Pascarella, Cruce, Wolniak, & Blaich
Kuh, G., & Hu, S. (1999, November). Is more better?Student-faculty interaction revisited. Paper presented atthe annual meeting of the Association for the Study ofHigher Education, San Antonio, TX.
Kuh, G., Pace, C., & Vesper, N. (1997). The developmentof process indicators to estimate student gains associatedwith good practices in undergraduate education. Researchin Higher Education, 38(4), 435-454.
Kuh, G., Schuh, J., Whitt, E., & Associates. (1991). Involvingcolleges. San Francisco: Jossey-Bass.
Lang, M. (1996). Effects of class participation on studentachievements and motivation. Unpublished honors thesis,University of Western Ontario, London, Ontario.
Leslie, D. (2002). Resolving the dispute: Teaching isacademe’s core value. Journal of Higher Education,73(1), 49-73.
Ludlow, L. (1996). Instructor evaluation ratings: Alongitudinal analysis. Journal of Personnel Evaluationin Education, 10, 83-92.
Murray, H., & Lang, M. (1997). Does classroom partici-pation improve student learning? Teaching and Learningin Higher Education, 20(February), 7-9.
Pace, C. (1990). College Student Experiences Questionnaire(3rd ed.). Los Angeles: University of California, Centerfor the Study of Evaluation, Graduate School ofEducation.
Pascarella, E. (2001). Using student self-reported gains toestimate college impact: A cautionary tale. Journal ofCollege Student Development, 42, 488-492.
Pascarella, E., Edison, M., Nora, A., Hagedorn, L., &Braxton, J. (1996). Effects of teacher organization/preparation and teacher skill/clarity on general cognitiveskills in college. Journal of College Student Development,37, 7-19.
Pascarella, E., Edison, M., Nora, A., Hagedorn, L., &Terenzini, P. (1998). Does work inhibit cognitivedevelopment during college? Educational Evaluation andPolicy Analysis, 20(2), 75-93.
Pascarella, E., Palmer, B., Moye, M., & Pierson, C. (2001).Do diversity experiences influence the development ofcritical thinking? Journal of College Student Devel-opment, 42, 257-271.
Pascarella, E., & Terenzini, P. (1991). How college affectsstudents. San Francisco: Jossey-Bass.
Pascarella, E., & Terenzini, P. (1998). Studying collegestudents in the 21st century: Meeting new challenges.Review of Higher Education, 21(2), 151-165.
Pascarella, E., & Terenzini, P. (in press). How college affectsstudents revisited: Research from the decade of the 1990s.San Francisco: Jossey-Bass.
Qin, Z., Johnson, D., & Johnson, R. (1995). Cooperativeversus competitive efforts and problem solving. Reviewof Educational Research, 65, 129-143.
Terenzini, P., Springer, L., Yaeger, P., Pascarella, E., & Nora,A. (1994). The multiple influences on students’ criticalthinking skills. Paper presented at the annual meeting ofthe Association for the Study of Higher Education,Orlando, FL.
Tinto, V., & Goodsell, A. (1994). Freshman interest groupsand the first-year experience: Constructing studentcommunities in a large university. Journal of theFreshman Year Experience, 6, 7-27.
Umbach, P., & Kuh, G. (2003, May). Student experienceswith diversity at liberal arts colleges: Another claim fordistinction. Paper presented at the annual meeting of theAssociation for Institutional Research, Tampa, FL.
Upcraft, L., Gardner, J., & Associates (1989). The freshmanyear experience. San Francisco: Jossey-Bass.
Volkwein, J., & Carbone, D. (1994). The impact ofdepartment research and teaching climate on under-graduate growth and satisfaction. Journal of HigherEducation, 65, 147-167.
Wachtel, H. (1998). Student evaluation of college teachingeffectiveness: A brief review. Assessment & Evaluationin Higher Education, 23(2), 191-211.
Watson, L., & Kuh, G. (1996). The influence of dominantrace environments on students’ involvement, perceptions,and educational gains: A look at historically Black andpredominantly White liberal arts institutions. Journal ofCollege Student Development, 37, 415-424.
What matters in college after college. (2002, December).Minneapolis, MN: Hardwick Day.
Whitmire, E., & Lawrence, J. (1996, November). Under-graduate students’ development of critical thinking skills:An institutional and disciplinary analysis and comparisonwith academic library use and other measures. Paperpresented at the annual meeting of the Association forthe Study of Higher Education, Memphis, TN.
Whitt, E., Edison, M., Pascarella, E., Nora, A., & Terenzini,P. (1999). Interactions with peers and objective and self-reported cognitive outcomes across 3 years of college.Journal of College Student Development, 40, 61-78.
Wood, A., & Murray, H. (1999). Effects of teacherenthusiasm on student attention, motivation, and memoryencoding. Paper presented at the annual meeting of theAmerican Educational Research Association, Montreal,Canada.