Embed Size (px)
Citation preview
Ecology, 89(5), 2008, pp. 1375–1387� 2008 by the Ecological Society of America
DO RESOURCES OR NATURAL ENEMIES DRIVE BEE POPULATIONDYNAMICS IN FRAGMENTED HABITATS?
INGOLF STEFFAN-DEWENTER1,3
AND SUSANNE SCHIELE2
1Department of Animal Ecology I, Population Ecology, University of Bayreuth, Universitatsstrasse 30, D-95447 Bayreuth, Germany2Department of Crop Sciences, Agroecology, University of Gottingen, Waldweg 26, D-37073 Gottingen, Germany
Abstract. The relative importance of bottom-up or top-down forces has been mainlystudied for herbivores but rarely for pollinators. Habitat fragmentation might change drivingforces of population dynamics by reducing the area of resource-providing habitats, disruptinghabitat connectivity, and affecting natural enemies more than their host species. We studiedspatial and temporal population dynamics of the solitary bee Osmia rufa (Hymenoptera:Megachilidae) in 30 fragmented orchard meadows ranging in size from 0.08 to 5.8 ha in anagricultural landscape in central Germany. From 1998 to 2003, we monitored local beepopulation size, rate of parasitism, and rate of larval and pupal mortality in reed trap nests asan accessible and standardized nesting resource. Experimentally enhanced nest site availabilityresulted in a steady increase of mean local population size from 80 to 2740 brood cells between1998 and 2002. Population size and species richness of natural enemies increased with habitatarea, whereas rate of parasitism and mortality only varied among years. Inverse density-dependent parasitism in three study years with highest population size suggests ratherdestabilizing instead of regulating effects of top-down forces. Accordingly, an analysis ofindependent time series showed on average a negative impact of population size on populationgrowth rates but provides no support for top-down regulation by natural enemies. Weconclude that population dynamics of O. rufa are mainly driven by bottom-up forces,primarily nest site availability.
Key words: habitat fragmentation; orchard meadows; Osmia rufa; pollinators; population ecology; redmason bee; resource limitation; solitary bees; time series; top-down or bottom-up control.
INTRODUCTION
Population dynamics are the key for understanding
the causes of a species’ distribution and abundance and
more generally patterns of species diversity (Kareiva
1990). Native bees are important pollinators in most
terrestrial ecosystems, and therefore a better knowledge
of factors driving their population dynamics is essential
for future conservation of suitable habitats and ecolog-
ical interactions (Kearns et al. 1998). Regulating
mechanisms of population dynamics in such mutualistic
plant–pollinator food webs might be different from
those in antagonistic plant–herbivore food webs, but
only a few studies focus on pollinators. Population
dynamics can be driven by resources (bottom-up) or by
natural enemies (top-down). Bottom-up factors mainly
act as density-independent factors that limit population
growth. In this case, dynamics of a population can be
stabilized by negative feedback processes like intra- or
interspecific competition resulting in reduced population
growth rates (Berryman 2001, Eber 2004, Sibly et al.
2005). Top-down factors, i.e., natural enemies, can
regulate population dynamics by positive density-
dependent parasitism or predation (Hassell and Wilson
1997, Berryman 2001). The relative importance of top-
down or bottom-up control for population dynamics
remains an open question for nearly all biological
systems (Hunter et al. 1997, Ylioja et al. 1999, Hunter
2001, Freckleton et al. 2006. Moreau et al. 2006).
Population dynamics always have two dimensions: a
temporal and a spatial one; thus local populations at a
certain place change over time, and the dynamics of
spatially separated populations might differ due to local
variation in habitat conditions or interact by extinction–
colonization dynamics of hosts and their natural
antagonists (Eber and Brandl 1996, Hanski 1998, van
Nouhuys and Hanski 2002, Cronin 2004). In the past
most research has been done either on long-term time
series, often including life table data of one or a few local
populations (Hassell 2000, Hunter 2001, Price and
Hunter 2005), or on short-term spatial colonization–
extinction dynamics of metapopulations (Hanski 1998)
and only few studies consider landscape scales (Solbreck
1995, Cronin and Reeve 2005, McGeoch and Price
2005).
Spatial variation of local population dynamics be-
comes particularly important in the context of habitat
destruction and fragmentation and increasing land use
intensification (Fahrig 2003). First, resource quantity is
most time related to the size of a local habitat and at a
Manuscript received 3 August 2006; revised 31 August 2007;accepted 11 September 2007. Corresponding Editor: D. H.Feener, Jr.
3 E-mail: [email protected]
1375
larger scale to the quality of the surrounding landscape
matrix (Vandermeer and Carvajal 2001, Krauss et al.
2004). Thus, reduced habitat area or matrix quality
should increase the impact of limiting resources for
population growth. Second, natural enemies are expect-
ed to respond stronger to reduced local area or increased
isolation of habitats (Holt et al. 1999). Thus, top-down
regulation might be disrupted by the increasing destruc-
tion and fragmentation of perennial habitats
(Tscharntke and Brandl 2004, Tylianakis et al. 2006).
Bees (Hymenoptera: Apiformes) depend for repro-
duction on pollen, a resource that is spatially and
temporally limited because it is only produced by plants
as a reward to attract pollinators (Wcislo and Cane
1996, Roulston and Cane 2000). Consequently, it has
been often assumed that intra- or interspecific compe-
tition for food resources plays an important role for the
size of bee populations, but direct empirical evidence is
still lacking (Minckley et al. 1994, Steffan-Dewenter and
Tscharntke 2000, Minckley et al. 2003, Palmer et al.
2003). Nesting sites in the soil or in preexisting cavities
above ground are a second key resource that potentially
limits bee populations, but again experimental evidence
is rare (Potts and Willmer 1997, Wuellner 1999, Potts
et al. 2003, 2005).
Similarly, the knowledge about the impact of natural
enemies on population dynamics of native bees is very
limited, but natural enemies are hypothesized to regulate
bee populations (Wcislo and Cane 1996). Rates of
parasitism show great annual and regional variation
(Wcislo et al. 1994, Petanidou et al. 1995, Wcislo and
Cane 1996) and on average nests in natural aggregations
or trap nests are more heavily parasitized than isolated
ones (Wcislo and Cane 1996). Natural enemies are
expected to affect common species most, because
parasite loads correlate positively with the local abun-
dance and regional distribution of their hosts (Durrer
and Schmid-Hempel 1995, Steffan-Dewenter 2003).
Both density-dependent and inverse density-dependent
correlations between rate of parasitism and local
population size have been found in the few existing case
studies for solitary bees (Rosenheim 1990, Antonini
et al. 2003, Bischoff 2003).
Here we present a six-year study on regional-scale
population dynamics of the solitary mason bee Osmia
rufa in a fragmented agricultural landscape. We
combined observational and manipulative experimental
approaches to get deeper insights into the driving forces
and the relative importance of bottom-up or top-down
regulation. We exposed trap nests as a standardized
nesting resource in 30 orchard meadows covering an
area and isolation gradient (see Plate 1). Such orchard
meadows are a typical habitat for the studied species by
providing pollen resources, mainly from flowering fruit
trees and also from herbaceous vegetation, and nesting
sites in dead wood (Steffan-Dewenter 2003). This system
made it possible to annually record changes of local
population size, occurrence of natural enemies, and
mortality rates (Tscharntke et al. 1998). We intended to
test the following main hypotheses.Hypothesis 1: Bee populations are limited by the
quantity of nesting resources. Evidence for this hypoth-esis should come from an annual increase of local
population size after the introduction of additionalnesting resources.
Hypothesis 2: Bee populations are limited by pollenresources. Evidence for this hypothesis should come
from a negative relationship between population growthrates and local population size. Further, assuming a
carrying capacity due to limited resources, we expected apositive correlation between population size and habitatarea as a surrogate for the quantity of pollen resources
from flowering fruit trees.Hypothesis 3: Bee populations are regulated by
natural enemies. Evidence for this hypothesis shouldcome from (1) positive density-dependent parasitism or
mortality and (2) negative density-dependent regulationof population growth rates.
MATERIAL AND METHODS
The study system
The red mason bee Osmia rufa (Linnaeus 1758)(Hymenoptera: Megachilidae) is common throughout
Germany and is widely distributed in central Europe.The males are 6–11 mm and the females 10–16 mm long.O. rufa is a solitary species with a univoltine life cycle.
The main flight period of females lasts from mid-Apriluntil the end of June. It overlaps with the flowering time
of typical orchard fruit trees like cherries and apples,which are used as major pollen sources (Westrich 1989,
Seidelmann 1995). Therefore we assume that habitatarea is related to pollen resource availability for O. rufa.
Homing experiments suggest a maximum foragingdistance of 800 m around the nest site (Gathmann and
Tscharntke 2002). The linear brood nests are built inpreexisting cavities such as hollow plant stems or beetle
borings in dead wood. Females prefer as nestingsubstrate, holes of 5–9 mm inner diameter (Westrich
1989, Seidelmann 1995). A brood nest consists of severalbrood cells each provisioned with pollen as larval food
and separated by loam partitions. Larvae feed on pollenprovision, spin into a cocoon, pupate, and hibernate asadults in their cocoons. O. rufa is a polylectic species
using a wide variety of pollen sources. Typical habitatsare mature hedgerows, woodland edges, and old orchard
meadows with dead wood (Westrich 1989). The broodcells of O. rufa are attacked by several brood parasitoids
and cleptoparasites, which feed on larval pollen provi-sions (Wcislo and Cane 1996). The wasp Monodonto-
merus obscurus Westwood 1833 (Hymenoptera:Encyrtidae) is a specialist parasitoid whereas the
parasitoid Melittobia acaster Walker 1839 (Hymenop-tera: Eulophidae) and the fly Anthrax anthrax Schrank
1781 (Diptera: Bombyliidae) have been reared fromseveral species of the family Megachilidae (Gathmann
and Tscharntke 1999). These species develop inside the
INGOLF STEFFAN-DEWENTER AND SUSANNE SCHIELE1376 Ecology, Vol. 89, No. 5
cocoon of O. rufa. The most common cleptoparasite is
the specialist Cacoxenus indagator Loew 1858 (Diptera:
Drosophilidae). Female flies enter the nest and lay
clutches of eggs when a female bee has departed on a
foraging trip. Further cleptoparasites are the specialist
mite Chaetodactylus osmiae (Dufour, 1839) (Acari:
Chaetodactylidae) and the generalist beetle Megatoma
undata Linnaeus 1758 (Coleoptera: Dermestidae) (Gath-
mann and Tscharntke 1999).
Study region and study sites
The study was carried out in the Leine-Weser region
in the vicinity of the city of Gottingen in southern
Lower-Saxony, Germany, from 1998 to 2003. The study
region represents a typical human-dominated central
European landscape. It is characterized by a mix of
annual crops, grasslands, forests, and a small fraction of
seminatural habitats of high conservation value like
calcareous grasslands (0.26% of the area; Krauss et al.
2003) and orchard meadows (0.7% of the area).
We selected a total of 30 orchard meadows as study
sites ranging in size from 0.08 to 5.8 ha located in a
region of ;403 35 km. Study sites were chosen to cover
the full gradient of habitat area and isolation in the
region. Selection was based on a complete mapping of
orchard meadows covering a total of 743 habitat
fragments (Untere Naturschutzbehorde Gottingen, un-
published data).
The orchard meadows were characterized by stands of
old, tall fruit trees, mainly apples, sweet cherries, and
plums that provide both pollen resources and nesting
sites in dead wood for the studied bee species.
Management regimes (mowing, grazing, or lying fallow)
varied between the study sites and partly changed over
the six years. However, in an earlier study no significant
effects of management regimes on trap-nesting bees were
found (Steffan-Dewenter and Leschke 2003), and
therefore this factor was not included in the statistical
analysis.
Connectivity to other orchard meadows was quanti-
fied as Ci¼R e�dijAj where Aj is the area of neighboring
orchard meadows and dij the distance (kilometers) to the
study site i (Steffan-Dewenter 2003).
Trap nests
The core approach in this study was the use of trap
nests in order to (1) monitor the annual change of the O.
rufa populations and (2) to experimentally enhance the
quantity of nesting resources (Tscharntke et al. 1998).
On each of the 30 study sites we exposed 12 trap nests in
1998 (a total of 360 trap nests). Four trap nests were
fixed on each of three wooden posts (1.5 m in height, 5–7
cm diameter) that were placed in the center of each
meadow (Steffan-Dewenter 2003). The distance between
the three wooden posts per study site was 52.4 6 18.7 m
(mean 6 SE) with a range between 26.3 and 114.1 m.
Each trap nest consisted of 153 6 14.3 stems of common
reed, Phragmites australis (Cav.), with an inner diameter
of 5.4 6 0.004 mm (mean 6 SE, range, 2–10 mm; n ¼1531 reed stems from 10 randomly selected trap nests)
and a length of 20 cm. From the size distribution of the
stems we calculated that on average 51.7% of the stems
were within a range of 5–9 mm diameter and thus
suitable nesting sites for O. rufa. The reed stems were
placed inside plastic tubes, thus each plastic tube
represents one trap nest. Four trap nests together were
protected against rain by a wooden roof (50 3 50 cm).
The trap nests were exposed at the beginning of April
and removed from the sites after the end of the season
between mid- and the end of September. The collected
trap nests were stored at 48C in cold storage over winter
for detailed analysis of population parameters. The
community structure of trap-nesting bees, wasps, and
their natural enemies in orchard meadows has been
described in more detail in Steffan-Dewenter (2003).
Population dynamics of O. rufa
During the winter months all reed stems containing
brood cells of O. rufa were removed from the trap nests
and opened. The brood cells in one stem from the
opening to the first node were defined as one brood nest
(Krombein 1967). For each brood nest we recorded the
total number of brood cells, the number of dead brood
cells, the number of brood cells attacked by parasitoids
or cleptoparasites, and the number of fully developed
cocoons. In 2001 and 2002 at nine and 17 sites,
respectively, it was not possible to open and analyze
all nests in detail because the numbers were too high. At
these sites the number of O. rufa nests .300 per post
were only counted but not dissected. The mean number
of brood cells per nest of the dissected nests was used to
calculate the total number of brood cells per site. Rate of
parasitism and mortality are only based on the examined
nests for these sites.
All reed stems with intact brood cells including those
with natural enemies were closed and individually
numbered after examination, and then stored in one
plastic box per wooden post (i.e., three per study site) at
48C until spring. The boxes (with holes) were returned to
the same study site and post from which the nests had
been removed the year before, together with a fresh set
of empty trap nests. Thereby, hibernated O. rufa females
could emerge, mate, and reproduce in the study sites in a
natural way and, in parallel, the winter dissection
allowed us to get detailed data for population param-
eters. The emergence boxes were collected after each
field season in autumn. All numbered O. rufa nests were
opened again to check for successful emergence of the
exposed cocoons and potential additional nests that
were built in the emergence boxes. From the previously
described analyses we extracted the following parame-
ters to characterize the local O. rufa populations:
1) The total number of brood cells was considered as
an equivalent for variation of local population size
(Steffan-Dewenter and Schiele 2004).
May 2008 1377POPULATION DYNAMICS IN HABITAT ISLANDS
2) The rate of parasitism was calculated as the ratio of
parasitized brood cells to the total number of brood
cells.
3) The rate of larval mortality was calculated as the
ratio of dead brood cells in the stage of eggs or larvae to
the total number of brood cells. Responsible mortality
agents for dead brood cells were presumably pathogens,
but this could not be further proven.
4) The rate of pupal mortality was calculated as the
number of cocoons, which did not emerge after
returning them to the study sites to the total number
of brood cells.
5) The annual population growth rate of local O. rufa
populations was calculated as rt¼ ln(Nt/Nt�1), where Nt
and Nt�1 are the total number of brood cells at time t
and t � 1 (Ylioja et al. 1999, Bjorkman et al. 2004).
Monitoring temporal population dynamics
From the start of the study in the spring 1998 until the
end of the field season 2002 we repeated the previously
described methods each year. Thus trap nests and
emergence boxes (from 1999 onward) were exposed on
the study sites in spring and removed for laboratory
analysis in autumn. The number of trap nests was
adjusted to the increasing number of O. rufa cocoons
from 2000 onward to prevent nest site quantity from
becoming a limiting resource for population growth.
Thus, at posts with .100 O. rufa nests two additional
empty trap nests were fixed in the following year. In
2003 we did not return any O. rufa cocoons to the study
sites. Consequently, the colonization could only come
from individuals that hibernated in natural nest sites on
the orchard meadow or colonized from outside, thereby
providing additional insights into the relative size of
natural compared to experimentally enhanced O. rufa
populations.
Statistical analysis
The statistical analyses were performed using R (R
Development Core Team 2004). We used linear mixed-
effect models (LMEM) to analyze the combined effects
of year and habitat parameters on population param-
eters of O. rufa (Pinheiro and Bates 2000). Year, habitat
area, and habitat connectivity were included as fixed
factors and study site as a random factor. Thereby, our
models took into account that sampling was repeated
over six years on the same study sites. We used
logarithmic transformation of population abundance
data, habitat area, and habitat connectivity and arcsine
transformation for parasitism and mortality rates.
Additionally, rates of parasitism and rates of larval or
pupal mortality were analyzed by fitting a generalized
linear mixed model via PQL (package MASS in R) using
logit transformation and assuming binomial errors.
Thereby, rates estimated from small samples gave less
influence (Crawley 2002). Nonsignificant interactions
and parameters were removed in a stepwise approach
from the model until all parameters were significant
(Crawley 2002). When year and habitat factors (or
interactions with year) had significant effects onpopulation parameters, we illustrated results in figures
using simple regressions for each year independently.We always give means 6 SE of untransformed data in
the text and tables.To test for density-dependent effects on annual
growth rates, linear mixed effects models for year,population size at time t� 1, and rates of parasitism andrates of mortality at time t � 1 were analyzed (Hunter
et al. 1997, Ylioja et al. 1999). Our data provide thepotential to test for both spatial and temporal patterns
of density dependence. We use the term ‘‘spatialpatterns’’ for population data where we analyze the
changes of several spatially separated local populationsfrom one year to the next year in contrast to the classical
approach of using long-term time series data of only onelocal population. Therefore we show spatial patterns for
population growth rates against the previously men-tioned variables for each study year separately. Addi-
tionally, we analyzed temporal patterns of densitydependence for population size and parasitism at time
t � 1 using time series with three or more data points.Thus, the term ‘‘temporal patterns’’ is used for temporal
dynamics of local populations over several years. As thestatistical power for each individual time series is low,we also used the distribution of correlation coefficients
and tested for departure from zero (mean 6 95%
confidence limits).
Spatial synchrony among local O. rufa populationswas explored using a spatial covariance function, which
describes the correlation between time series at pairs oflocations as a function of the geographical distance
between study sites (Bjørnstad et al. 1999, Koenig 1999).We used the R-package ‘‘NCF’’ to estimate the
nonparametric covariance function and calculated con-fidence intervals for the estimated functions using
bootstrap resamplings replicated 500 times (Bjørnstadand Falck 2001). Overall regional synchrony was
calculated by the mean cross-correlations among allpopulations (Bjørnstad et al. 1999). We analyzed
synchrony for annual population growth rates, popula-tion abundance, and rate of parasitism. Measures of
population growth rates and parasitism did not requireadditional detrending, whereas abundance data showed
a positive trend that might have obscured short-termspatial synchrony (Liebhold et al. 2004). Thereforeresiduals of a simple regression to the time series of log-
abundance (1998–2002) were used for spatial covariancefunctions (Koenig 1999).
RESULTS
General characteristics of O. rufa populations
Altogether, we analyzed 33 959 O. rufa nests contain-ing 136 664 brood cells. Each nest contained on average
4.4 6 0.1 brood cells. We found that 17.1% of the broodcells were attacked by parasitoids or cleptoparasites,
13.6% were dead as revealed by nest dissections, and
INGOLF STEFFAN-DEWENTER AND SUSANNE SCHIELE1378 Ecology, Vol. 89, No. 5
8.2% did not emerge after they were returned to the
study sites resulting in a loss of 38.9% of the provisioned
brood cells.
The fraction of orchard meadows occupied by O. rufa
was 84.4% in 1998, 88.9% in 1999, 93.4% in 2000, and
100% in 2001 and 2002 indicating that the additional
nest resources promoted the establishment of new local
populations. After the removal of all brood cells from
2002 the occupancy rate declined to 93.3% in 2003. The
fraction of O. rufa populations attacked by natural
enemies was extremely high and only varied between
92.5% in 1999 and 100% in 2002 suggesting that natural
enemies were highly mobile and not limited by habitat
connectivity.
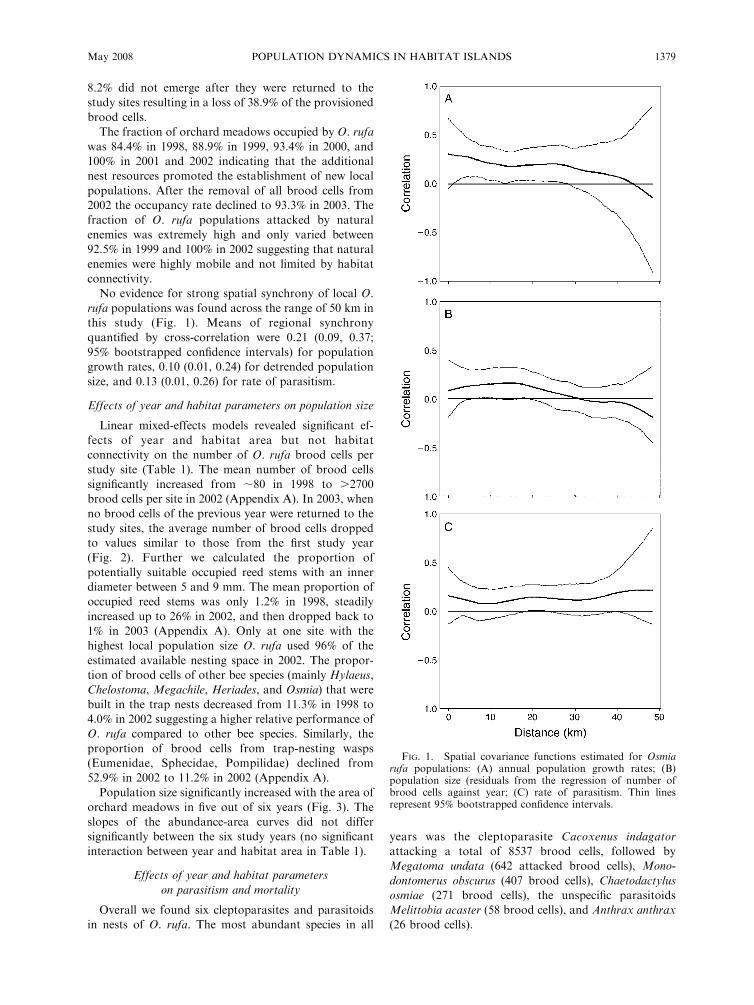
No evidence for strong spatial synchrony of local O.
rufa populations was found across the range of 50 km in
this study (Fig. 1). Means of regional synchrony
quantified by cross-correlation were 0.21 (0.09, 0.37;
95% bootstrapped confidence intervals) for population
growth rates, 0.10 (0.01, 0.24) for detrended population
size, and 0.13 (0.01, 0.26) for rate of parasitism.
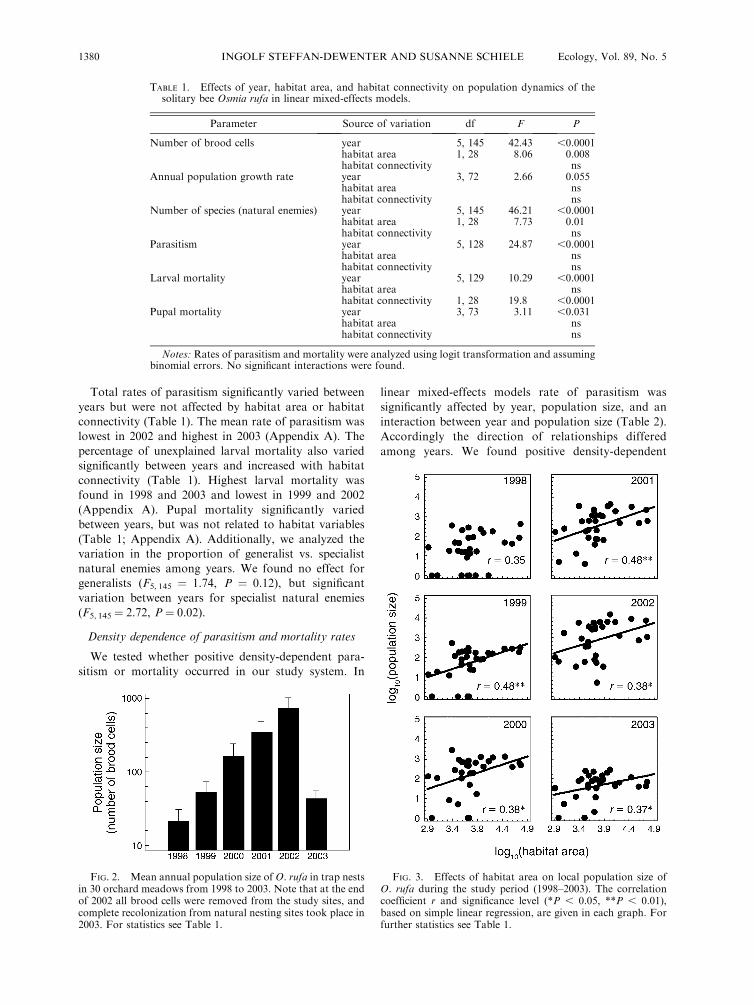
Effects of year and habitat parameters on population size
Linear mixed-effects models revealed significant ef-
fects of year and habitat area but not habitat
connectivity on the number of O. rufa brood cells per
study site (Table 1). The mean number of brood cells
significantly increased from ;80 in 1998 to .2700
brood cells per site in 2002 (Appendix A). In 2003, when
no brood cells of the previous year were returned to the
study sites, the average number of brood cells dropped
to values similar to those from the first study year
(Fig. 2). Further we calculated the proportion of
potentially suitable occupied reed stems with an inner
diameter between 5 and 9 mm. The mean proportion of
occupied reed stems was only 1.2% in 1998, steadily
increased up to 26% in 2002, and then dropped back to
1% in 2003 (Appendix A). Only at one site with the
highest local population size O. rufa used 96% of the
estimated available nesting space in 2002. The propor-
tion of brood cells of other bee species (mainly Hylaeus,
Chelostoma, Megachile, Heriades, and Osmia) that were
built in the trap nests decreased from 11.3% in 1998 to
4.0% in 2002 suggesting a higher relative performance of
O. rufa compared to other bee species. Similarly, the
proportion of brood cells from trap-nesting wasps
(Eumenidae, Sphecidae, Pompilidae) declined from
52.9% in 2002 to 11.2% in 2002 (Appendix A).
Population size significantly increased with the area of
orchard meadows in five out of six years (Fig. 3). The
slopes of the abundance-area curves did not differ
significantly between the six study years (no significant
interaction between year and habitat area in Table 1).
Effects of year and habitat parameters
on parasitism and mortality
Overall we found six cleptoparasites and parasitoids
in nests of O. rufa. The most abundant species in all
years was the cleptoparasite Cacoxenus indagator
attacking a total of 8537 brood cells, followed by
Megatoma undata (642 attacked brood cells), Mono-
dontomerus obscurus (407 brood cells), Chaetodactylus
osmiae (271 brood cells), the unspecific parasitoids
Melittobia acaster (58 brood cells), and Anthrax anthrax
(26 brood cells).
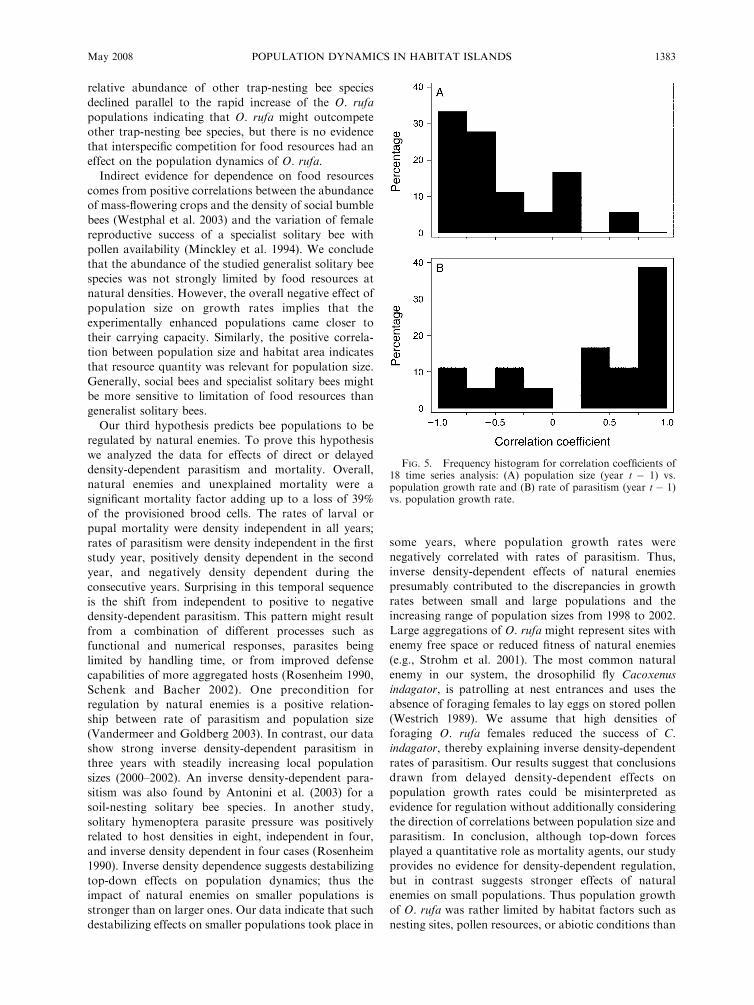
FIG. 1. Spatial covariance functions estimated for Osmiarufa populations: (A) annual population growth rates; (B)population size (residuals from the regression of number ofbrood cells against year; (C) rate of parasitism. Thin linesrepresent 95% bootstrapped confidence intervals.
May 2008 1379POPULATION DYNAMICS IN HABITAT ISLANDS
Total rates of parasitism significantly varied between
years but were not affected by habitat area or habitat
connectivity (Table 1). The mean rate of parasitism was
lowest in 2002 and highest in 2003 (Appendix A). The
percentage of unexplained larval mortality also varied
significantly between years and increased with habitat
connectivity (Table 1). Highest larval mortality was
found in 1998 and 2003 and lowest in 1999 and 2002
(Appendix A). Pupal mortality significantly varied
between years, but was not related to habitat variables
(Table 1; Appendix A). Additionally, we analyzed the
variation in the proportion of generalist vs. specialist
natural enemies among years. We found no effect for
generalists (F5, 145 ¼ 1.74, P ¼ 0.12), but significant
variation between years for specialist natural enemies
(F5, 145 ¼ 2.72, P ¼ 0.02).
Density dependence of parasitism and mortality rates
We tested whether positive density-dependent para-
sitism or mortality occurred in our study system. In
linear mixed-effects models rate of parasitism was
significantly affected by year, population size, and an
interaction between year and population size (Table 2).
Accordingly the direction of relationships differed
among years. We found positive density-dependent
TABLE 1. Effects of year, habitat area, and habitat connectivity on population dynamics of thesolitary bee Osmia rufa in linear mixed-effects models.
Parameter Source of variation df F P
Number of brood cells year 5, 145 42.43 ,0.0001habitat area 1, 28 8.06 0.008habitat connectivity ns
Annual population growth rate year 3, 72 2.66 0.055habitat area nshabitat connectivity ns
Number of species (natural enemies) year 5, 145 46.21 ,0.0001habitat area 1, 28 7.73 0.01habitat connectivity ns
Parasitism year 5, 128 24.87 ,0.0001habitat area nshabitat connectivity ns
Larval mortality year 5, 129 10.29 ,0.0001habitat area nshabitat connectivity 1, 28 19.8 ,0.0001
Pupal mortality year 3, 73 3.11 ,0.031habitat area nshabitat connectivity ns
Notes: Rates of parasitism and mortality were analyzed using logit transformation and assumingbinomial errors. No significant interactions were found.
FIG. 2. Mean annual population size of O. rufa in trap nestsin 30 orchard meadows from 1998 to 2003. Note that at the endof 2002 all brood cells were removed from the study sites, andcomplete recolonization from natural nesting sites took place in2003. For statistics see Table 1.
FIG. 3. Effects of habitat area on local population size ofO. rufa during the study period (1998–2003). The correlationcoefficient r and significance level (*P , 0.05, **P , 0.01),based on simple linear regression, are given in each graph. Forfurther statistics see Table 1.
INGOLF STEFFAN-DEWENTER AND SUSANNE SCHIELE1380 Ecology, Vol. 89, No. 5
parasitism in 1999, but negative density dependence in
the following years (2000–2003) and no relationship in
1998 (Appendix B). Larval mortality and pupal mortal-
ity were density independent (Table 2).
Evidence for regulation of population growth rates
Annual changes of O. rufa population size, i.e.,
population growth rates, were used to identify the
relative importance of natural enemies or resource
limitation as potential drivers of local population
dynamics. In linear mixed-effects models, population
size and rates of parasitism significantly affected
population growth rates. The interaction among year
and population size indicates annual variation in factors
influencing population growth rates (Table 3). This
analysis combines density-dependent effects on popula-
tion growth rates in space and time. To separate these
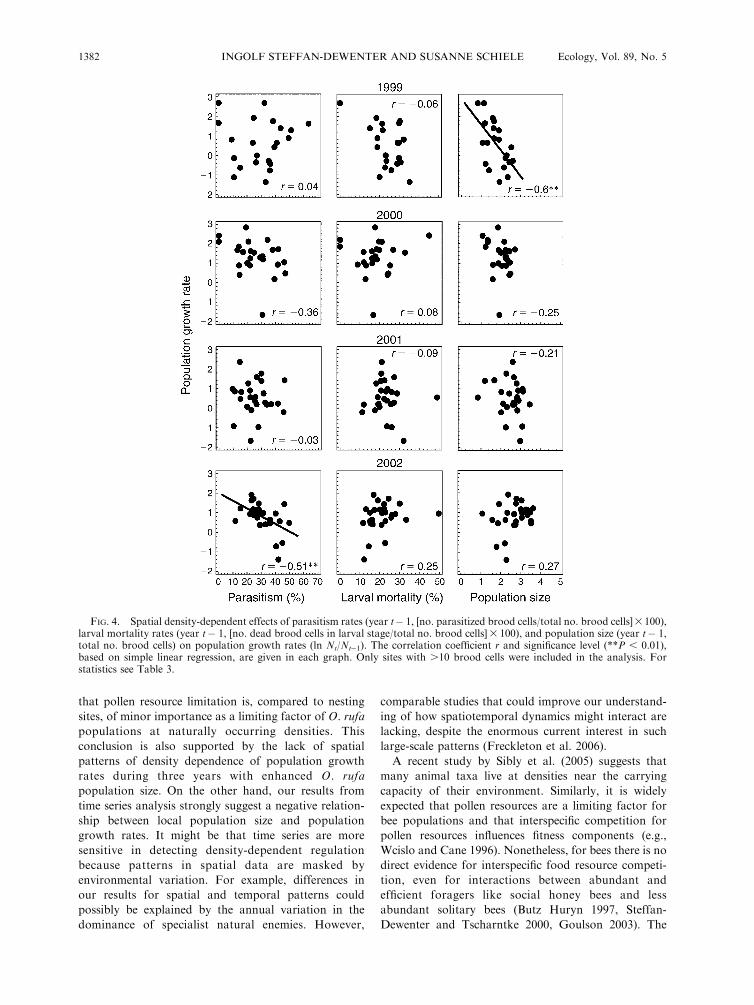
two aspects we first illustrate spatial patterns of each
independent variable on population growth rates from
1999 to 2002 using simple regression analysis (Fig. 4).
Density-dependent effects of population size (Nt�1) on
population growth rates were only found in 1999, but
not in the following years when local O. rufa popula-
tions were significantly larger. The rate of parasitism of
the previous year was not correlated with population
growth rate in the first three years, but showed a
significant negative effect in 2002 indicating that delayed
density-dependent regulation by natural enemies took
place in this year (Fig. 4). Pupal mortality showed no
effect on growth rates.
Second, we analyzed short time series of individual
study sites each covering population dynamics for 3–4
years. In three out of 18 cases we found a significant
negative correlation between population growth rate
and population size (Appendix C). The distribution of
correlation coefficients for all time series indicates a
general negative relationship (Fig. 5). The mean was
�0.49 6 0.19 (95% confidence intervals). In contrast no
significant correlations were found for rate of parasitism
(t � 1) in single time series; the mean of the correlation
coefficients was positive, but not significantly different
from zero (0.3 6 0.48; 95% confidence intervals; Fig. 5),
and correlation coefficients for population size and rate
of parasitism were significantly different (paired t test,
t ¼�4.28, P , 0.0001).
DISCUSSION
The main objective of our study was to evaluate the
relative importance of bottom-up and top-down forces
for the population dynamics of a solitary bee species in a
fragmented agricultural landscape. By recording data at
replicated sites on a landscape scale over six years, we
got a data set that allows us to prove evidence for each
of our three main hypotheses.
Evidence for bottom-up or top-down regulation
The most obvious result of our study is the marked,
steady increase of population size in response to the
additional nesting resources. After five years the mean
population size was 35-times higher than at the
beginning of the experiment. The removal of all cocoons
of the previous year in 2003 required a complete
recolonization of trap nests from natural nesting sites
and resulted in densities as low as in the first study year.
Thus, the data indicate that nesting sites are a limiting
resource for local population size of O. rufa. Bees are
known to have specific needs for nesting sites and
therefore have been often assumed to be limited by this
factor (e.g., Westrich 1989, Potts and Willmer 1997,
Wuellner 1999). Potts et al. (2005) show that the relative
abundance of dominant species is influenced by the
availability of nesting sites, but we are not aware of
other studies that derive evidence for nest site limitation
from direct experimental manipulation of nest site
quantity.
The interpretation of our data regarding bottom-up
control by pollen resources is less straightforward.
Considering that the analyzed populations were built
up to significantly higher densities, it can be concluded
TABLE 2. Effects of year and population size on rates of parasitism and mortality of O. rufa populationsin linear mixed-effects models.
Parameter Source of variation df F P
Parasitism year 5, 122 32.05 ,0.0001population size 1, 122 30.28 ,0.0001year 3 population size 5, 122 3.31 0.0078
Larval mortality year 5, 128 9.58 ,0.0001Pupal mortality year 3, 73 3.11 0.031
population size ns
Notes: Rates of parasitism and mortality were analyzed using logit transformation and assumingbinomial errors. Only significant interactions are shown in the table.
TABLE 3. Density-dependent effects on population growthrates of O. rufa in linear mixed-effects models.
Source of variation df F P
Year 3, 63 4.22 0.009Population size (t � 1) 1, 63 4.01 0.049Parasitism (t � 1) 1, 63 4.59 0.036Larval mortality (t � 1) nsYear 3 population size (t � 1) 3, 63 4.15 0.01
Notes: Only significant interactions are shown in the table.Study sites with ,10 brood cells have been excluded from theanalysis. For sources of variation, ‘‘(t � 1)’’ indicates that thedata are from the previous year.
May 2008 1381POPULATION DYNAMICS IN HABITAT ISLANDS
that pollen resource limitation is, compared to nesting
sites, of minor importance as a limiting factor of O. rufa
populations at naturally occurring densities. This
conclusion is also supported by the lack of spatial
patterns of density dependence of population growth
rates during three years with enhanced O. rufa
population size. On the other hand, our results from
time series analysis strongly suggest a negative relation-
ship between local population size and population
growth rates. It might be that time series are more
sensitive in detecting density-dependent regulation
because patterns in spatial data are masked by
environmental variation. For example, differences in
our results for spatial and temporal patterns could
possibly be explained by the annual variation in the
dominance of specialist natural enemies. However,
comparable studies that could improve our understand-
ing of how spatiotemporal dynamics might interact are
lacking, despite the enormous current interest in such
large-scale patterns (Freckleton et al. 2006).
A recent study by Sibly et al. (2005) suggests that
many animal taxa live at densities near the carrying
capacity of their environment. Similarly, it is widely
expected that pollen resources are a limiting factor for
bee populations and that interspecific competition for
pollen resources influences fitness components (e.g.,
Wcislo and Cane 1996). Nonetheless, for bees there is no
direct evidence for interspecific food resource competi-
tion, even for interactions between abundant and
efficient foragers like social honey bees and less
abundant solitary bees (Butz Huryn 1997, Steffan-
Dewenter and Tscharntke 2000, Goulson 2003). The
FIG. 4. Spatial density-dependent effects of parasitism rates (year t� 1, [no. parasitized brood cells/total no. brood cells]3100),larval mortality rates (year t� 1, [no. dead brood cells in larval stage/total no. brood cells]3 100), and population size (year t� 1,total no. brood cells) on population growth rates (ln Nt/Nt�1). The correlation coefficient r and significance level (**P , 0.01),based on simple linear regression, are given in each graph. Only sites with .10 brood cells were included in the analysis. Forstatistics see Table 3.
INGOLF STEFFAN-DEWENTER AND SUSANNE SCHIELE1382 Ecology, Vol. 89, No. 5
relative abundance of other trap-nesting bee species
declined parallel to the rapid increase of the O. rufa
populations indicating that O. rufa might outcompete
other trap-nesting bee species, but there is no evidence
that interspecific competition for food resources had an
effect on the population dynamics of O. rufa.
Indirect evidence for dependence on food resources
comes from positive correlations between the abundance
of mass-flowering crops and the density of social bumble
bees (Westphal et al. 2003) and the variation of female
reproductive success of a specialist solitary bee with
pollen availability (Minckley et al. 1994). We conclude
that the abundance of the studied generalist solitary bee
species was not strongly limited by food resources at
natural densities. However, the overall negative effect of
population size on growth rates implies that the
experimentally enhanced populations came closer to
their carrying capacity. Similarly, the positive correla-
tion between population size and habitat area indicates
that resource quantity was relevant for population size.
Generally, social bees and specialist solitary bees might
be more sensitive to limitation of food resources than
generalist solitary bees.
Our third hypothesis predicts bee populations to be
regulated by natural enemies. To prove this hypothesis
we analyzed the data for effects of direct or delayed
density-dependent parasitism and mortality. Overall,
natural enemies and unexplained mortality were a
significant mortality factor adding up to a loss of 39%
of the provisioned brood cells. The rates of larval or
pupal mortality were density independent in all years;
rates of parasitism were density independent in the first
study year, positively density dependent in the second
year, and negatively density dependent during the
consecutive years. Surprising in this temporal sequence
is the shift from independent to positive to negative
density-dependent parasitism. This pattern might result
from a combination of different processes such as
functional and numerical responses, parasites being
limited by handling time, or from improved defense
capabilities of more aggregated hosts (Rosenheim 1990,
Schenk and Bacher 2002). One precondition for
regulation by natural enemies is a positive relation-
ship between rate of parasitism and population size
(Vandermeer and Goldberg 2003). In contrast, our data
show strong inverse density-dependent parasitism in
three years with steadily increasing local population
sizes (2000–2002). An inverse density-dependent para-
sitism was also found by Antonini et al. (2003) for a
soil-nesting solitary bee species. In another study,
solitary hymenoptera parasite pressure was positively
related to host densities in eight, independent in four,
and inverse density dependent in four cases (Rosenheim
1990). Inverse density dependence suggests destabilizing
top-down effects on population dynamics; thus the
impact of natural enemies on smaller populations is
stronger than on larger ones. Our data indicate that such
destabilizing effects on smaller populations took place in
some years, where population growth rates were
negatively correlated with rates of parasitism. Thus,
inverse density-dependent effects of natural enemies
presumably contributed to the discrepancies in growth
rates between small and large populations and the
increasing range of population sizes from 1998 to 2002.
Large aggregations of O. rufa might represent sites with
enemy free space or reduced fitness of natural enemies
(e.g., Strohm et al. 2001). The most common natural
enemy in our system, the drosophilid fly Cacoxenus
indagator, is patrolling at nest entrances and uses the
absence of foraging females to lay eggs on stored pollen
(Westrich 1989). We assume that high densities of
foraging O. rufa females reduced the success of C.
indagator, thereby explaining inverse density-dependent
rates of parasitism. Our results suggest that conclusions
drawn from delayed density-dependent effects on
population growth rates could be misinterpreted as
evidence for regulation without additionally considering
the direction of correlations between population size and
parasitism. In conclusion, although top-down forces
played a quantitative role as mortality agents, our study
provides no evidence for density-dependent regulation,
but in contrast suggests stronger effects of natural
enemies on small populations. Thus population growth
of O. rufa was rather limited by habitat factors such as
nesting sites, pollen resources, or abiotic conditions than
FIG. 5. Frequency histogram for correlation coefficients of18 time series analysis: (A) population size (year t � 1) vs.population growth rate and (B) rate of parasitism (year t � 1)vs. population growth rate.
May 2008 1383POPULATION DYNAMICS IN HABITAT ISLANDS
regulated by top-down forces. For other solitary
hymenoptera showing positive density-dependent para-
sitism (Rosenheim 1990), top-down regulation could be
more important and this might partly explain the
commonness of O. rufa in comparison to other
aboveground nesting solitary bee species.
Response to spatial factors: habitat area, connectivity,
and spatial synchrony
A second objective of our study was to quantify the
impact of habitat fragmentation on local population
dynamics. Impacts may come through limited spatial
exchange by dispersal between local populations (Han-
ski 1998, Baguette et al. 2000, Thomas 2000), different
sensitivity of trophic levels, here bees and their natural
enemies, to habitat loss and isolation (Holt et al. 1999,
Tscharntke and Brandl 2004), and increased importance
of resource limitation due to habitat loss (Dennis et al.
2003, Krauss et al. 2004).
Spatial synchrony of growth rate, abundance, and
rate of parasitism among O. rufa populations was low.
The slightly higher spatial synchrony for population
growth rates at distances up to 10 km could be a result
of dispersal between neighboring populations. Although
estimated foraging distances of O. rufa are ,1 km
(Gathmann and Tscharntke 2002), dispersal distances
might be significantly larger. We suggest that restricted
exchange between local populations is an unlikely
explanation for low spatial synchrony because occupan-
cy of orchard meadows was already high in the first
study year and increased up to 100% in 2001. In total,
only two local extinctions could be observed. Thus,
O. rufa did not show a metapopulation structure and
was able to colonize even the smallest and most isolated
habitat patches, provided suitable nesting resources were
available. Population synchrony can be based on
different processes such as dispersal coupling locally
regulated populations, trophic interactions, or density-
independent factors that are correlated across wide
regions (Bjørnstad et al. 1999). Therefore it is not
possible to identify a single cause for the lack of
synchrony.
An unsolved aspect in our study is the importance of
immigration and emigration rates for local population
dynamics (Baguette et al. 2000). Although the evidence
for high dispersal ability is obvious, we will in the
following still argue that mainly local factors influenced
population dynamics. First, as mentioned, we did not
detect spatial autocorrelation suggesting that local O.
rufa populations varied independently and rates of
dispersal between orchard meadows were low (Bjork-
man et al. 2004). Second, the quantitative impact of
immigrating individuals from neighboring sites not
involved in this study should have gone down as the
local populations increased due to the reed trap nests.
Third, mark–recapture experiments in five orchard
meadows revealed high nest site fidelity in that 80% of
reobserved females built their nests at the maternal nest
site within the habitat (Steffan-Dewenter and Schiele
2004).
Our study provides no support for the hypothesis that
higher trophic levels (in this case natural enemies) are
more affected by habitat fragmentation than their hosts
(Holt et al. 1999, Tscharntke and Brandl 2004). Natural
enemies successfully colonized more or less all sites
occupied by O. rufa and neither habitat area nor
connectivity influenced rates of parasitism. Another
study also found that a specific parasitoid of a restricted
and rare butterfly species was not limited by dispersal
(Van Nouhuys and Hanski 2002). Thus, the general
hypothesis that specific natural enemies are more
affected by habitat fragmentation than their hosts
(e.g., Tscharntke and Brandl 2004) needs a more
differentiated consideration on a single species level.
Our data suggest that the dominant effect of habitat
fragmentation on this generalist mobile bee species was
primarily the reduction of available nesting sites and
only secondarily of food resources in small habitat
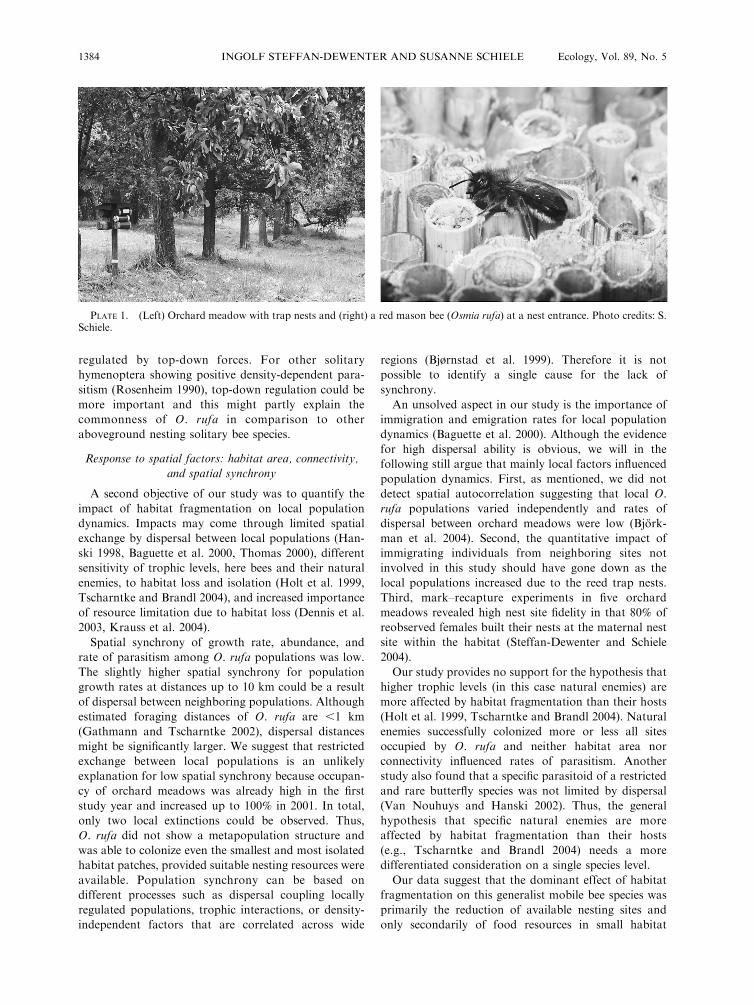
PLATE 1. (Left) Orchard meadow with trap nests and (right) a red mason bee (Osmia rufa) at a nest entrance. Photo credits: S.Schiele.
INGOLF STEFFAN-DEWENTER AND SUSANNE SCHIELE1384 Ecology, Vol. 89, No. 5
patches. Local population size in orchard meadows
could be enhanced by exposing trap nests, thereby
indicating that nest site limitation was mainly respon-
sible for the absence of O. rufa in small habitats at the
start of the experiment. The positive density–area
relationship follows the predictions of the resource
concentration hypothesis and might be explained by
different emigration and immigration rates in small and
large patches (Hamback and Englund 2005).
Conclusions
Our study provides strong evidence for limitation of
local O. rufa population size by nesting resources,
marginal evidence for negative density-dependent bot-
tom-up regulation of population growth rates, but no
support for top-down regulation by natural enemies.
Habitat area positively influenced O. rufa populations
whereas habitat connectivity neither affected O. rufa nor
associated natural enemies. Taking into account how
few other studies on population dynamics of bees exist,
it is too early to draw general conclusions for the relative
importance of top-down and bottom-up forces for other
more specialized solitary bees. However, it can be
hypothesized that solitary species with aggregated
nesting sites and inverse density-dependent parasitism
may be primarily limited by food or nesting resources. It
remains a challenging task to build up the data basis for
a more general comparison of driving forces of
population dynamics in pollinator food webs.
From an applied point of view, trap nests as
additional nesting resources provide a suitable manage-
ment strategy to significantly enhance solitary bee
densities and to ensure pollination services for insect-
pollinated perennial orchard crops (Richards 1993,
Kremen et al. 2002). A detailed understanding of driving
factors of pollinator population dynamics is the key for
a successful implementation of such management
strategies.
ACKNOWLEDGMENTS
We thank Mark Hunter, Riccardo Bommarco, YannClough, and Sabine Eber for valuable comments on themanuscript and statistical advice, R. Bommarco for supportin spatial synchrony analysis, the owners of the orchardmeadows for cooperation, and the Deutsche Forschungsge-meinschaft (DFG) for financial support (STE 957/2). MechthildRittmeier, Magdolna Weller, and Martin Gronmeier providedexcellent field and laboratory assistance.
LITERATURE CITED
Antonini, Y., R. P. Martins, and C. A. Rosa. 2003. Inversedensity-dependent and density-dependent parasitism in asolitary ground-nesting bee in southeast Brazil. TropicalZoology 16:83–92.
Baguette, M., S. Petit, and F. Queva. 2000. Population spatialstructure and migration of three butterfly species within thesame habitat network: consequences for conservation.Journal of Applied Ecology 37:100–108.
Berryman, A. A. 2001. Functional web analysis: detecting thestructure of population dynamics from multi-species timeseries. Basic and Applied Ecology 2:311–321.
Bischoff, I. 2003. Population dynamics of the solitary digger beeAndrena vaga Panzer (Hymenoptera, Andrenidae) studiedusing mark–recapture and nest counts. Population Ecology45:197–204.
Bjorkman, C., R. Bommarco, K. Eklund, and S. Hoglund.2004. Harvesting disrupts biological control of herbivores ina short-rotation coppice system. Ecological Applications 14:1624–1633.
Bjørnstad, O. N., and W. Falck. 2001. Nonparametric spatialcovariance functions: estimation and testing. Environmentaland Ecological Statistics 8:53–70.
Bjørnstad, O. N., R. A. Ims, and X. Lambin. 1999. Spatialpopulation dynamics: analyzing patterns and processes ofpopulation synchrony. Trends in Ecology and Evolution 14:427–432.
Butz Huryn, V. M. 1997. Ecological impacts of introducedhoney bees. Quarterly Review of Biology 72:275–297.
Crawley, M. J. 2002. Statistical computing. An introduction todata analysis using S-Plus. John Wiley and Sons, Chichester,UK.
Cronin, J. T. 2004. Host–parasitoid extinction and colonizationin a fragmented prairie landscape. Oecologia 139:503–514.
Cronin, J. T., and J. D. Reeve. 2005. Host–parasitoid spatialecology: a plea for a landscape-level synthesis. Proceedings ofthe Royal Society B 272:2225–2235.
Dennis, R. L. H., T. G. Shreeve, and H. Van Dyck. 2003.Towards a functional resource-based concept for habitat: abutterfly biology viewpoint. Oikos 102:417–426.
Durrer, S., and P. Schmid-Hempel. 1995. Parasites and theregional distribution of bumblebee species. Ecography 18:114–122.
Eber, S. 2004. Bottom-up density regulation in the holly leaf-miner Phytomyza ilicis. Journal of Animal Ecology 73:948–958.
Eber, S., and R. Brandl. 1996. Metapopulation dynamics of thetephritid fly Urophora cardui: an evaluation of incidence-function model assumptions with field data. Journal ofAnimal Ecology 65:621–630.
Fahrig, L. 2003. Effects of habitat fragmentation on biodiver-sity. Annual Review of Ecology, Evolution, and Systematics34:487–515.
Freckleton, R. P., A. R. Watkinson, E. E. Green, and W. J.Sutherland. 2006. Census error and the detection of densitydependence. Journal of Animal Ecology 75:837–851.
Gathmann, A., and T. Tscharntke. 1999. Landschafts-Bewer-tung mit Bienen und Wespen in Nisthilfen: Artenspektrum,Interaktionen und Bestimmungsschlussel. Naturschutz undLandschaftspflege Baden-Wurttemberg 73:277–305.
Gathmann, A., and T. Tscharntke. 2002. Foraging ranges ofsolitary bees. Journal of Animal Ecology 71:757–764.
Goulson, D. 2003. Effects of introduced bees on nativeecosystems. Annual Review of Ecology, Evolution, andSystematics 34:1–26.
Hamback, P. A., and G. Englund. 2005. Patch area, populationdensity and the scaling of migration rates: the resourcehypothesis revisited. Ecology Letters 8:1057–1065.
Hanski, I. 1998. Metapopulation dynamics. Nature 396:41–49.Hassell, M. P. 2000. Host–parasitoid population dynamics.
Journal of Animal Ecology 69:543–566.Hassell, M. P., and H. B. Wilson. 1997. The dynamics of
spatially distributed host–parasitoid systems. Pages 75–110 inD. Tilman and P. Kareiva, editors. Spatial ecology: the roleof space in population dynamics and interspecific interac-tions. Princeton University Press, Princeton, New Jersey,USA.
Holt, R. D., J. H. Lawton, G. A. Polis, and N. D. Martinez.1999. Trophic rank and the species–area relationship.Ecology 80:1495–1504.
Hunter, M. D. 2001. Multiple approaches to estimating therelative importance of top-down and bottom-up forces on
May 2008 1385POPULATION DYNAMICS IN HABITAT ISLANDS
insect populations: experiments, life tables, and time-seriesanalysis. Basic and Applied Ecology 2:295–309.
Hunter, M. D., G. C. Varley, and G. R. Gradwell. 1997.Estimating the relative roles of top-down and bottom-upforces on insect herbivore populations: a classic studyrevisited. Proceedings of the National Academy of Sciences(USA) 94:9176–9181.
Kareiva, P. 1990. Population dynamics in spatially complexenvironments: theory and data. Philosophical Transactionsof the Royal Society B 330:175–190.
Kearns, C. A., D. W. Inouye, and N. M. Waser. 1998.Endangered mutualisms: the conservation of plant–pollina-tor interactions. Annual Review of Ecology and Systematics29:83–112.
Koenig, W. D. 1999. Spatial autocorrelation of ecologicalphenomena. Trends in Ecology and Evolution 14:22–26.
Krauss, J., I. Steffan-Dewenter, and T. Tscharntke. 2003. Howdoes landscape context contribute to effects of habitatfragmentation on diversity and population density ofbutterflies. Journal of Biogeography 30:889–900.
Krauss, J., I. Steffan-Dewenter, and T. Tscharntke. 2004.Landscape occupancy and local population size depends onhost plant distribution in the butterfly Cupido minimus.Conservation Biology 120:359–365.
Kremen, C., N. M. Williams, and R. W. Thorp. 2002. Croppollination from native bees at risk from agriculturalintensification. Proceedings of the National Academy ofSciences (USA) 99:16812–16816.
Krombein, K. V. 1967. Trap-nesting wasps and bees: lifehistories, nests, and associates. Smithsonian Press, Wash-ington, D.C., USA.
Liebhold, A., W. D. Koenig, and O. N. Bjørnstad. 2004. Spatialsynchrony in population dynamics. Annual Review ofEcology, Evolution, and Systematics 35:467–490.
McGeoch, M. A., and P. W. Price. 2005. Scale-dependentmechanisms in the population dynamics of an insectherbivore. Oecologia 144:278–288.
Minckley, R. L., J. H. Cane, L. Kervin, and D. Yanega. 2003.Biological impediments to measures of competition amongintroduced honey bees and desert bees (Hymenoptera:Apiformes). Journal of the Kansas Entomological Society76:306–319.
Minckley, R. L., W. T. Wcislo, D. Yanega, and S. L.Buchmann. 1994. Behavior and phenology of a specialistbee (Dieunomia) and sunflower (Helianthus) pollen availabil-ity. Ecology 75:1406–1419.
Moreau, G., E. S. Eveleigh, C. J. Lucarotti, and D. T. Quiring.2006. Ecosystem alteration modifies the relative strengths ofbottom-up and top-down forces in a herbivore population.Journal of Animal Ecology 75:853–861.
Palmer, T. M., M. L. Stanton, and T. P. Young. 2003.Competition and coexistence: Exploring mechanisms thatrestrict and maintain diversity within mutualist guilds.American Naturalist 162(Supplement):63–79.
Petanidou, T., W. N. Ellis, and A. C. Ellis-Adams. 1995.Ecogeographical patterns in the incidence of brood parasit-ism in bees. Biological Journal of the Linnean Society 55:261–272.
Pinheiro, J. C., and D. M. Bates. 2000. Mixed-effects models inS and S-Plus. Springer, New York, New York, USA.
Potts, S. G., B. Vulliamy, A. Dafni, G. Neeman, andP. Willmer. 2003. Linking bees and flowers: How do floralcommunities structure pollinator communities? Ecology 84:2628–2642.
Potts, S. G., B. Vulliamy, S. Roberts, C. O’Toole, A. Dafni, G.Neeman, and P. Willmer. 2005. Role of nesting resources inorganising diverse bee communities in a mediterraneanlandscape. Ecological Entomology 30:78–85.
Potts, S. G., and P. Willmer. 1997. Abiotic and biotic factorsinfluencing nest-site selection by Halictus rubicundus, a
ground-nesting halictine bee. Ecological Entomology 22:319–328.
Price, P. W., and M. D. Hunter. 2005. Long-term populationdynamics of a sawfly show strong bottom-up effects. Journalof Animal Ecology 74:917–925.
R Development Core Team. 2004. R: a language andenvironment for statistical computing. Foundation forStatistical Computing, Vienna, Austria. hhttp://www.R-project.orgi
Richards, K. W. 1993. Non-Apis bees as crop pollinators.Revue Swisse de Zoologie 100:807–822.
Rosenheim, J. A. 1990. Density-dependent parasitism and theevolution of aggregated nesting in the solitary Hymenoptera.Annals of the Entomological Society of America 83:277–286.
Roulston, T. H., and J. H. Cane. 2000. Pollen nutritionalcontent and digestibility for animals. Plant Systematics andEvolution 222:187–209.
Schenk, D., and S. Bacher. 2002. Functional response of ageneralist insect predator to one of its prey species in the field.Journal of Animal Ecology 71:524–531.
Seidelmann, K. 1995. Untersuchungen zur Reproduktionsbio-logie der Roten Mauerbiene Osmia rufa (L., 1758). Disser-tation. Martin-Luther Universitat, Halle-Wittenberg,Germany.
Sibly, R. M., D. Barker, M. C. Denham, J. Hone, andM. Pagel. 2005. On the regulation of populations ofmammals, birds, fish, and insects. Science 309:607–610.
Solbreck, C. 1995. Long-term population dynamics of a seed-feeding insect in a landscape perspective. Pages 279–301 inN. Cappuccino and P. W. Price, editors. Populationdynamics: new approaches and synthesis. Academic Press,San Diego, California, USA.
Steffan-Dewenter, I. 2003. Importance of habitat area andlandscape context for species richness of bees and wasps infragmented orchard meadows. Conservation Biology 17:1036–1044.
Steffan-Dewenter, I., and K. Leschke. 2003. Effects of habitatmanagement on vegetation and above-ground nesting beesand wasps of orchard meadows in Central Europe. Biodi-versity and Conservation 12:1953–1968.
Steffan-Dewenter, I., and S. Schiele. 2004. Nest-site fidelity,body weight and population size on the red mason bee,Osmia rufa (Hymenoptera: Megachilidae), evaluated bymark–recapture experiments. Entomologia Generalis 27:123–131.
Steffan-Dewenter, I., and T. Tscharntke. 2000. Resourceoverlap and possible competition between honey bees andwild bees in central Europe. Oecologia 122:288–296.
Strohm, E., C. Laurien-Kehnen, and S. Bordon. 2001. Escapefrom parasitism: spatial and temporal strategies of a sphecidwasp against a specialised cuckoo wasp. Oecologia 129:50–57.
Thomas, C. D. 2000. Dispersal and extinction in fragmentedlandscapes. Proceedings of the Royal Society B 267:139–145.
Tscharntke, T., and R. Brandl. 2004. Plant–insect interactionsin fragmented landscapes. Annual Reviews of Entomology49:405–430.
Tscharntke, T., A. Gathmann, and I. Steffan-Dewenter. 1998.Bioindication using trap-nesting bees and wasps and theirnatural enemies: community structure and interactions.Journal of Applied Ecology 35:708–719.
Tylianakis, J. M., T. Tscharntke, and A.-M. Klein. 2006.Diversity, ecosystem functioning, and stability of para-sitoid–host interactions across a tropical habitat gradient.Ecology 87:3047–3057.
Vandermeer, J., and R. Carvajal. 2001. Metapopulationdynamics and the quality of the matrix. American Naturalist158:211–220.
Vandermeer, J. H., and D. E. Goldberg. 2003. Populationecology: first principles. Princeton University Press, Prince-ton, New Jersey, USA.
INGOLF STEFFAN-DEWENTER AND SUSANNE SCHIELE1386 Ecology, Vol. 89, No. 5
Van Nouhuys, S., and I. Hanski. 2002. Colonization rates anddistances of a host butterfly and two specific parasitoids in afragmented landscape. Journal of Animal Ecology 71:639–650.
Wcislo, W. T., and J. H. Cane. 1996. Floral resource utilizationby solitary bees (Hymenoptera: Apoidea) and exploitataionof their stored foods by natural enemies. Annual Review ofEntomology 41:257–286.
Wcislo, W. T., R. L. Minckley, R. A. B. Leschen, and S. S.Reyes, 1994. Rates of parasitism by natural enemies of asolitary bee Dieunomia triangulifera (Hymenoptera, Coleop-tera and Diptera) in relation to phenologies. Sociobiology 23:265–273.
Westphal, C., I. Steffan-Dewenter, and T. Tscharntke. 2003.Mass flowering crops enhance pollinator densities at alandscape scale. Ecology Letters 6:961–965.
Westrich, P. 1989. Die Wildbienen Baden-Wurttembergs.Eugen Ulmer, Stuttgart, Germany.
Wuellner, C. T. 1999. Nest site preference and success in agregarious, ground-nesting bee Dieunomia triangulifera.Ecological Entomology 24:471–479.
Ylioja, T., H. Roininen, M. P. Ayres, M. Rousi, and P. W.Price. 1999. Host-driven population dynamics in an herbiv-orous insect. Proceedings of the National Academy ofSciences (USA) 96:10735–10740.
APPENDIX A
Abundance and biotic interactions of Osmia rufa populations, and percentage brood cells of O. rufa, other bees, and wasps intrap nests from 1998 to 2003 (Ecological Archives E089-083-A1).
APPENDIX B
Effects of population size on rate of parasitism of O. rufa populations during the study period, 1998–2003 (Ecological ArchivesE089-083-A2).
APPENDIX C
Time series analyses of effects of population size on population growth rates (Ecological Archives E089-083-A3).
May 2008 1387POPULATION DYNAMICS IN HABITAT ISLANDS