Embed Size (px)
Citation preview
E D U C A T I O N P O L I C Y P R O G R A M
RE S E AR C H RE P O R T
Do Voucher Students Attain Higher
Levels of Education? Extended Evidence from the Milwaukee Parental Choice Program
Patrick J. Wolf John F. Witte Brian Kisida UNIVERSITY OF ARKANSAS UNIVERSITY OF WISCONSIN-
MADISON
UNIVERSITY OF MISSOURI
February 2018
AB O U T T H E U R BA N I N S T I T U TE
The nonprofit Urban Institute is dedicated to elevating the debate on social and economic policy. For nearly five
decades, Urban scholars have conducted research and offered evidence-based solutions that improve lives and
strengthen communities across a rapidly urbanizing world. Their objective research helps expand opportunities for
all, reduce hardship among the most vulnerable, and strengthen the effectiveness of the public sector.
Copyright © February 2018. Urban Institute. Permission is granted for reproduction of this file, with attribution to
the Urban Institute. Cover image by Tim Meko.
Contents Acknowledgments iv
Executive Summary v
Do Voucher Students Attain Higher Levels of Education? 1
The Milwaukee Parental Choice Program 3
General Research Strategy 6
Results 11
Conclusions 16
Appendix 18
Notes 24
References 25
About the Authors 28
Statement of Independence 29
I V A C K N O W L E D G M E N T S
Acknowledgments This report was funded by the Bill and Susan Oberndorf Foundation, the Walton Family Foundation, the
Robertson Foundation, Kate and Bill Duhamel, the Foundation for Excellence in Education, and the
Charles and Helen Schwab Foundation. We are grateful to them and to all our funders, who make it
possible for Urban to advance its mission.
The views expressed are those of the authors and should not be attributed to the Urban Institute,
its trustees, or its funders. Funders do not determine research findings or the insights and
recommendations of Urban experts. Further information on the Urban Institute’s funding principles is
available at https://www.urban.org/aboutus/our-funding/funding-principles.
We thank Deven Carlson, Joshua Cowen, and Daniel Kuehn for helpful comments on earlier drafts
of this report. This study was commissioned by the Urban Institute as part of a series of reports on the
long-term effects of publicly funded private school choice programs (Matthew Chingos, project
director).
E X E C U T I V E S U M M A R Y V
Executive Summary The Milwaukee Parental Choice Program (MPCP), the first modern private school choice program in the
United States, has grown from 341 students attending 7 private schools in 1990 to 27,857 students
attending 126 private schools today. The MPCP has been subject to extensive study that has focused
largely on student performance on standardized tests, which have found few differences in
performance between MPCP students and similar students in the Milwaukee Public Schools (MPS).
This study presents new data on the college enrollment, persistence, and graduation of MPCP and
MPS students who were tracked over 11 years beginning in 2006. MPCP participants are compared
with a matched sample of MPS students who lived in the same neighborhood and had similar
demographic characteristics and test scores at the beginning of the study.
The collective evidence in this paper indicates that students in the MPCP program have greater
educational attainment than the comparison group, as measured by college enrollment and persistence.
This finding applies both to students who were in ninth grade at the beginning of the study, for whom
positive attainment effects have previously been reported, and to students who were initially enrolled
in grades three through eight, who we examine here for the first time. As of 2017, MPCP students have
spent more total years in a four-year college than their MPS peers, but differences in degree attainment
rates are not statistically significant.

D O V O U C H E R S T U D E N T S A T T A I N H I G H E R L E V E L S O F E D U C A T I O N ? 1
Do Voucher Students Attain Higher
Levels of Education? This paper is an important extension of the ongoing analysis of the first modern school voucher program
in America—the Milwaukee Parental Choice Program (MPCP). Specifically, we analyze the effects of
that program on the rates at which MPCP students graduate from high school and enroll in, persist in,
and graduate from college compared with similar students in the Milwaukee Public Schools (MPS). Most
early studies of vouchers and school choice more generally have focused on student achievement,
almost always defined as scores on standardized achievement tests. Achievement is an important
metric with which to evaluate school choice programs, but we think that educational attainment is at
least as central as standardized test scores for the long-term benefits of students.
Studies of school choice programs have increasingly included outcomes other than test scores
among their primary analyses. These outcomes include student and parent satisfaction (Campbell 2008;
Dee 2005; Howell et al. 2006; Kisida and Wolf 2015; Schneider et al. 1997) as well as societal goals,
such as racial integration and reductions in achievement gaps for minority or other historically
disadvantaged groups of students (Betts et al. 2006; Bifulco and Ladd 2007; Egalite, Mills, and Wolf
2017; Greene 2005; Neal 2006; Zimmer et al. 2009). Recent work has also considered the impact of
transferring to or from an alternative to public school on students’ special needs classification (Wolf and
Lasserre-Cortez 2018; Wolf, Witte, and Fleming 2012).
Student attainment levels may be the most consequential outcome for individual students and their
surrounding communities over the long term. Students with higher levels of attainment live longer, lead
healthier lives, earn more income, and avoid welfare and the criminal justice system at higher rates than
their peers with lower levels of attainment (Belfield and Levin 2007; Carneiro, Heckman, and Vytlacil
2001; Day and Newburger 2002; Levitt and Lochner 2000; Lleras-Muney 2005; Muennig 2005; Meara,
Richards, and Cutler 2008; Wirt et al. 2004). Most of these studies find positive effects of going to
college even for students who do not obtain a degree.
School choice studies have correspondingly begun to focus on student attainment, both in terms of
high school graduation and exposure to college. Early work in the field showed that students, especially
African Americans in urban areas, graduated at much higher rates if they attended Catholic high schools
(Coleman and Hoffer 1987; Neal 1997). Recently a large, multistate analysis of public charter schools
found large attainment gains for students who moved from traditional public schools to charters
2 D O V O U C H E R S T U D E N T S A T T A I N H I G H E R L E V E L S O F E D U C A T I O N ?
(Booker et al. 2011). Another study reported that choice among public schools is associated with
modest impacts on the probability of high school graduation (Lauen 2007).
In the school voucher literature, recent studies have uncovered encouraging evidence regarding
the effect of participating in private school choice programs on subsequent student educational
attainment. An experimental study of the DC Opportunity Scholarship Program for the US Department
of Education found that using a voucher increased the likelihood of graduating from high school by 21
percentage points, a 30 percent boost (Wolf et al. 2013). In a similarly rigorous experimental evaluation,
Chingos and Peterson (2015) reported that participating in the New York City private-school
scholarship program had no significant impact on attainment for the full sample of participants but
increased college enrollment rates for African American and Hispanic students 6 percentage points,
which represented a 10 percent hike. The program also increased those students’ college graduation
rates 3.5 percentage points, an increment of 35 percent. In a nonexperimental analysis employing a
student-matching approach similar to the one we use here, Chingos and Kuehn (2017) found that
participation in the Florida Tax Credit Scholarship Program increased the student rate of two-year
college enrollment 15 to 43 percent, depending on how many years the individual used a scholarship.
Cowen and colleagues (2013) analyzed high school graduation and college enrollment of
Milwaukee students who were in eighth or ninth grade at the beginning of the study and college
persistence for students in ninth grade at baseline. After controlling for a variety of student and parent
background factors, MPCP students were 4 to 5 percentage points more likely to graduate from high
school and enroll in a four-year college than a matched sample of MPS students.
This report is an extension of the previous MPCP attainment study (Cowen et al. 2013) in terms of
both the outcomes studied and the students for whom those outcomes apply. The approach taken in
this report is similar but focuses on college enrollment, persistence, and graduation over a longer
period. For the first time, we present college enrollment and persistence outcomes for students who
were in grades three through eight in 2006. We track all students in our study for 11 years to 2017.
We find that students in the MPCP program have greater educational attainment than the
comparison group. MPCP students are more likely to enroll, persist, and have more total years in a four-
year college than their MPS peers. We do not find evidence that MPCP students are significantly more
likely to graduate from college.
D O V O U C H E R S T U D E N T S A T T A I N H I G H E R L E V E L S O F E D U C A T I O N ? 3
The Milwaukee Parental Choice Program
The first modern private-school voucher program in the United States began in 1990 in Milwaukee,
Wisconsin.1 In the second half of the 20th century, the student population in MPSs followed a path
similar to many other large-city districts in America. In 1967, the district was over 70 percent white; 30
years later, before the establishment of the MPCP, the numbers were 18 percent white, 62 percent
black, 13 percent nonwhite Hispanic, and 7 percent other races (Witte 2000, 37).
The Milwaukee Parental Choice (voucher) Program began in the fall of 1990 as a five-year pilot
program with seven private schools and 341 students. It was a highly constrained and targeted
program, with eligible students limited to Milwaukee residents with incomes at 175 percent of the
federal poverty level or less. Participants had to have been in an MPS school in the previous year or
entering kindergarten. Program participation was capped at 1 percent of the MPS enrollment
(approximately 1,000 students). Most importantly, the private schools had to be secular and could not
enroll more than 49 percent of their students through the voucher program. The maximum voucher
amount was $2,446. Thus, the program was small, constrained in many ways, and only open to a minute
portion of Milwaukee private schools, over 80 percent of which were religious at that time (Witte 2000,
44–6).
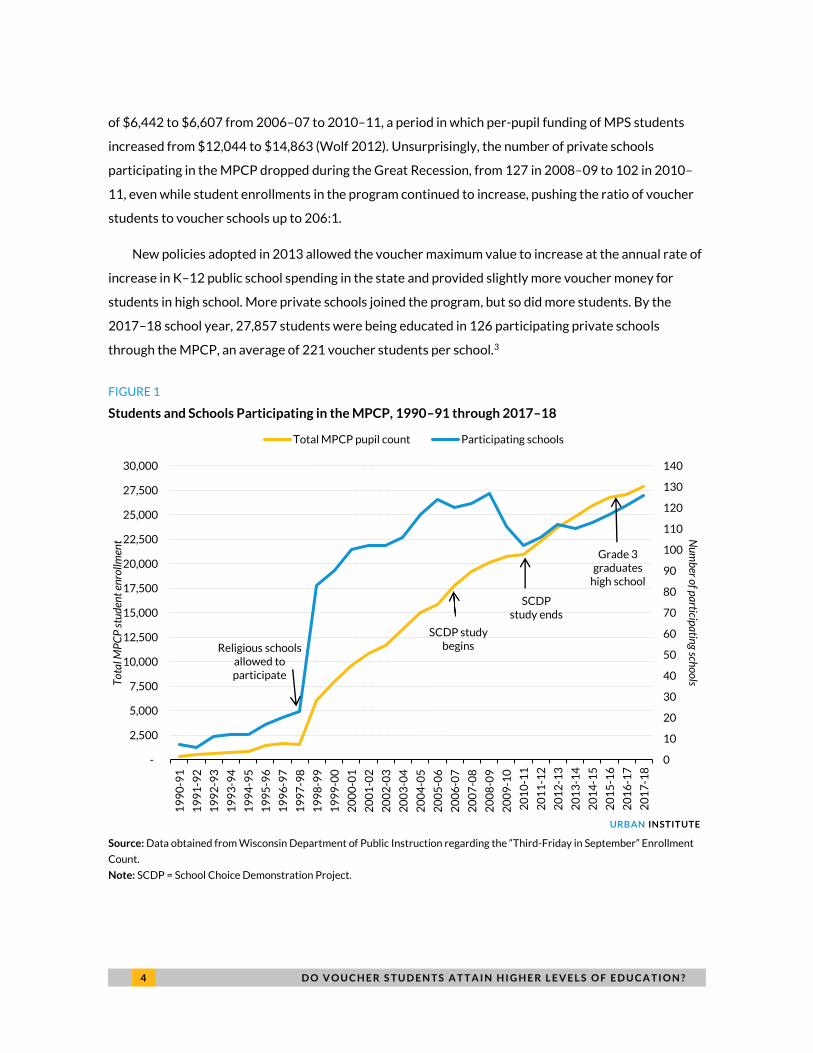
Over the next 25 years, the voucher program in Milwaukee grew substantially in terms of
programs, policy changes, costs, and the numbers of schools and students participating (figure 1). A
major legislative change to allow entry of religious schools occurred in 1996, approved by the
Wisconsin Supreme Court in 1998 and further supported by the 2002 US Supreme Court Zelman v.
Simmons-Harris ruling that, under certain conditions common to school voucher programs, they do not
violate the US Constitution.2 That change led to major increases in total students and in participating
private schools that they could attend.
From the 1998–99 to the 2008–09 school year, student enrollments in the MPCP grew steadily
each year while the number of participating schools increased very slightly. The average number of
MPCP students per participating school was 73 in 1998–99; it had more than doubled to 158 by 2008–
09. During this period, public pressure to exclude private schools that were perceived to be of low
quality led to program changes, such as the requirement that all MPCP schools be accredited (Public
Policy Forum 2008).
Throughout the program’s history, the voucher has had to be accepted as the full cost of educating
the child in their chosen private school. The maximum value of the voucher was held to a narrow range
4 D O V O U C H E R S T U D E N T S A T T A I N H I G H E R L E V E L S O F E D U C A T I O N ?
of $6,442 to $6,607 from 2006–07 to 2010–11, a period in which per-pupil funding of MPS students
increased from $12,044 to $14,863 (Wolf 2012). Unsurprisingly, the number of private schools
participating in the MPCP dropped during the Great Recession, from 127 in 2008–09 to 102 in 2010–
11, even while student enrollments in the program continued to increase, pushing the ratio of voucher
students to voucher schools up to 206:1.
New policies adopted in 2013 allowed the voucher maximum value to increase at the annual rate of
increase in K–12 public school spending in the state and provided slightly more voucher money for
students in high school. More private schools joined the program, but so did more students. By the
2017–18 school year, 27,857 students were being educated in 126 participating private schools
through the MPCP, an average of 221 voucher students per school.3
FIGURE 1
Students and Schools Participating in the MPCP, 1990–91 through 2017–18
URBAN INSTITUTE
Source: Data obtained from Wisconsin Department of Public Instruction regarding the “Third-Friday in September” Enrollment
Count.
Note: SCDP = School Choice Demonstration Project.
0
10
20
30
40
50
60
70
80
90
100
110
120
130
140
-
2,500
5,000
7,500
10,000
12,500
15,000
17,500
20,000
22,500
25,000
27,500
30,000
19
90
-91
19
91
-92
19
92
-93
19
93
-94
19
94
-95
19
95
-96
19
96
-97
19
97
-98
19
98
-99
19
99
-00
20
00
-01
20
01
-02
20
02
-03
20
03
-04
20
04
-05
20
05
-06
20
06
-07
20
07
-08
20
08
-09
20
09
-10
20
10
-11
20
11
-12
20
12
-13
20
13
-14
20
14
-15
20
15
-16
20
16
-17
20
17
-18
Nu
mb
er of p
articip
atin
g scho
olsT
ota
l MP
CP
stu
den
t en
rollm
ent
Total MPCP pupil count Participating schools
SCDP study beginsReligious schools
allowed to participate
SCDP study ends
Grade 3graduates
high school
D O V O U C H E R S T U D E N T S A T T A I N H I G H E R L E V E L S O F E D U C A T I O N ? 5
The MPCP is by far the largest, oldest, and most controversial of the four private-school voucher
programs in the Badger State.4 It also provides the best opportunity for continued research. Initial
evaluations of the MPCP five-year pilot program remain a major component of the literature on
voucher impacts, whether from the state’s official evaluator (summarized in Witte 2000) or analyses by
outside scholars (Greene, Peterson, and Du 1999; Rouse 1998). In 2005, the program was reauthorized
and expanded to a maximum of 22,500 students (2005 Wisconsin Act 125). The reauthorization also
began a new evaluation by the School Choice Demonstration Project, starting in 2006, the first one to
use student-level data from after its post-pilot expansion in 1996 (figure 1).
Multiple reports, published articles, and dissertations have emerged from the second evaluation
that began with baseline data collected on a sample of MPCP students in grades three through nine in
2006 (e.g., Carlson, Cowen, and Fleming 2013; Cowen et al. 2012; Cowen et al. 2013; Egalite et al. 2014;
Fleming 2009; Fleming et al. 2015; McShane 2013; Witte et al. 2008; Witte et al. 2014; Wolf 2012;
Wolf, Witte, and Fleming 2012). The evaluation data covered the outcome years of 2007–08 to 2010–
11, a period of consolidation of more MPCP students into fewer MPCP schools. The range of outcomes
studied was considerable, including behavioral and attitudinal comparisons based on extensive annual
surveys of parents and students, school case studies, parental focus groups, student results on
standardized achievement effects, and attainment, defined as graduation from high school and initial
enrollment and persistence in college. We focus in this report on attainment, but we briefly describe the
achievement results from the previous study.
The evaluation originally was focused primarily on student achievement gains because of legislative
interest and requirements. That legislation required the evaluators to track the progress of a
“representative” panel of new and continuing MPCP students against a panel of “comparable” MPS
students over five years (2005 Wisconsin Act 125). No statutory provision was made to allow the
evaluators to conduct a randomized lottery for research purposes. Generally, the evaluation found few
differences in math or reading growth between the MPCP students and their matched MPS peers from
2007 to 2009. The 2010 data, however, indicated that MPCP students gained significantly in reading
achievement compared with their matched MPS peers, at least in part because a separate high-stakes
testing provision was added to the MPCP authorization in 2009 (Witte et al. 2014).
The three of us, along with Joshua Cowen and David Fleming, extended the scope of the MPCP
evaluation to include initial data on attainment in the form of high school graduation and postsecondary
enrollment primarily for the ninth graders and secondarily for the eighth graders in our sample in 2006.
Cowen and colleagues (2013) found that enrollment in the MPCP in ninth grade was associated with
significantly higher rates of high school graduation, four-year college enrollment, and persistence into
6 D O V O U C H E R S T U D E N T S A T T A I N H I G H E R L E V E L S O F E D U C A T I O N ?
the second year of college. Our analysis here adds more years of attainment data to that original ninth-
grade sample and examines data on students enrolled in grades three through nine in 2006.
General Research Strategy
Because of resource constraints, the research was based on a random sample of 1,926 students in the
MPCP in grades three through eight. We added all 801 ninth grade MPCP students to this
representative sample of elementary school students. We followed all the MPCP ninth-graders, instead
of a random sample, because MPCP program enrollments were much lower in the high school grades
and we knew that ninth-graders in 2006 were scheduled to graduate high school (or not) and perhaps
enroll in college within the five-year timeline of our initial study. The total sample of MPCP students
numbered 2,727.
Since the MPCP had been operating for 16 years when we started our study, 70 percent of the
students in our representative sample were continuing in the program and not newly entering it. These
continuing students already had some exposure to the MPCP before our evaluation. Thus, our study is
of the effect of being in the MPCP in 2006, regardless of whether it was the student’s 1st or 10th year in
the program. Since the MPCP students had varying amounts of prior participation in the program, it was
especially important to match them carefully to similar students who were enrolled instead in MPS.
We used a three-part strategy to select a comparison group that combined exact, test-band, and
propensity score matching (Witte et al. 2008). We began with a unique step of exactly matching each
MPCP student to a set of MPS students in their grade and residing in their same neighborhood,
narrowly defined by census tract. Milwaukee has 213 census tracts, drawn deliberately to follow the
contours of actual neighborhoods. This approach is important because the underlying problem in
behavioral studies is the effect of unmeasured selection bias. Neighborhood effects capture some of
this unmeasured bias (Bifulco 2012), as people who live in the same neighborhood tend to share similar
characteristics (Aaronson 1998; Cullen, Jacob, and Leavitt 2005).
Because we were concerned with sets of students beginning with widely disparate initial levels of
educational achievement, from within the set of MPS students exactly matched by grade and
neighborhood, we further matched MPCP students to MPS peers who were within a narrow test-score
band of 5 percent of the student baseline achievement distribution. In some cases, these requirements
reduced the list of potential MPS student matches to only one student and the matching for those
particular students ended.
D O V O U C H E R S T U D E N T S A T T A I N H I G H E R L E V E L S O F E D U C A T I O N ? 7
In most cases, there remained multiple possible MPS matches for each MPCP student. We used
propensity score analysis to order the remaining set of MPS comparison students (Rosenbaum and
Rubin 1983). The propensity analysis included initial test scores (again) and a series of student
demographic variables including race, gender, and English language status. The student with the closest
propensity score to the MPCP student then was selected as the match.
To generate the propensity score, we were limited to using reliable variables in the MPCP and MPS
student enrollment databases. We could not match students based on their eligibility status for free and
reduced-price lunch since many private schools do not participate in the program even if their students
are poor. We also could not match on mother’s level of education because we were only able to obtain
that information from a portion of the sample after the match.
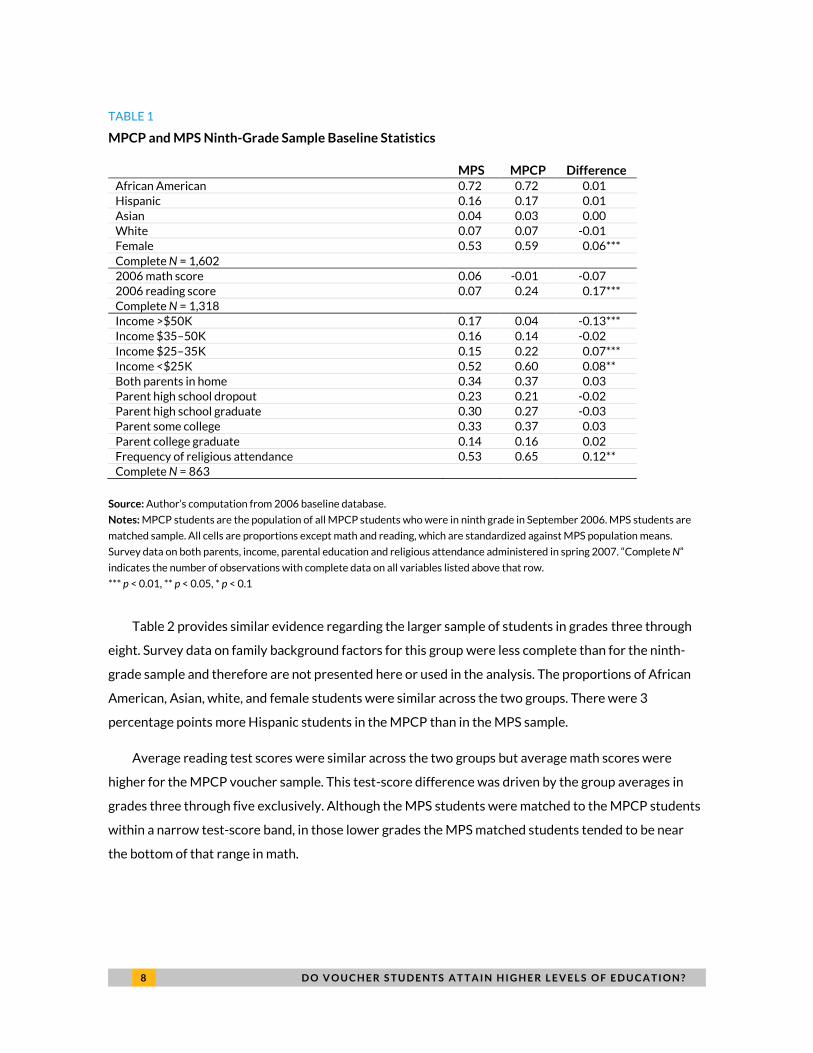
Tables 1 and 2 provide descriptive statistics of student race, gender, and 2006 math and reading
scores for both our ninth-grade and third-through-eighth-grade attainment samples of MPCP and
matched MPS students. Table 1 also provides information about parental education, income, religion,
and family structure for the original attainment sample of ninth-graders in MPCP and MPS in 2006 that
were obtained from study participants through surveys administered after the match. The survey
response rate was 68 percent, but some respondents left specific survey items blank. Complete data
were obtained from 54 percent of respondents. All differences are weighted to account for survey
nonresponse.
Matching approaches rarely produce study samples that are exactly equal in all relevant respects.
Since we prioritized student grade level and neighborhood, exactly matching on those critical features,
there was a chance that the groups would differ systematically on some of the other measurable
factors. As table 1 indicates, the ninth-grade match resulted in similar proportions of students of
various ethnicities in the MPCP and MPS samples. The proportion of female students was 6 percentage
points higher in the MPCP than the MPS sample.
Average baseline math test scores were similar for the two groups, but average baseline reading
scores were higher for the MPCP students. Average income was higher for MPS students, which
reflects the heavily means-tested nature of the MPCP program at that time; fewer MPCP students
came from families with income more than $50,000 annually and more came from families with less
than $25,000 annually. Students in both groups were equally likely to have a parent with a college
degree and to have both parents in their homes—crucial factors when studying educational attainment.
MPCP students in the ninth-grade sample were 12 percentage points more likely to have parents who
attended religious services at least once a week.
8 D O V O U C H E R S T U D E N T S A T T A I N H I G H E R L E V E L S O F E D U C A T I O N ?
TABLE 1
MPCP and MPS Ninth-Grade Sample Baseline Statistics
MPS MPCP Difference African American 0.72 0.72 0.01
Hispanic 0.16 0.17 0.01
Asian 0.04 0.03 0.00
White 0.07 0.07 -0.01
Female 0.53 0.59 0.06***
Complete N = 1,602
2006 math score 0.06 -0.01 -0.07
2006 reading score 0.07 0.24 0.17***
Complete N = 1,318
Income >$50K 0.17 0.04 -0.13***
Income $35–50K 0.16 0.14 -0.02
Income $25–35K 0.15 0.22 0.07***
Income <$25K 0.52 0.60 0.08**
Both parents in home 0.34 0.37 0.03
Parent high school dropout 0.23 0.21 -0.02
Parent high school graduate 0.30 0.27 -0.03
Parent some college 0.33 0.37 0.03
Parent college graduate 0.14 0.16 0.02
Frequency of religious attendance 0.53 0.65 0.12**
Complete N = 863
Source: Author’s computation from 2006 baseline database.
Notes: MPCP students are the population of all MPCP students who were in ninth grade in September 2006. MPS students are
matched sample. All cells are proportions except math and reading, which are standardized against MPS population means.
Survey data on both parents, income, parental education and religious attendance administered in spring 2007. “Complete N”
indicates the number of observations with complete data on all variables listed above that row.
*** p < 0.01, ** p < 0.05, * p < 0.1
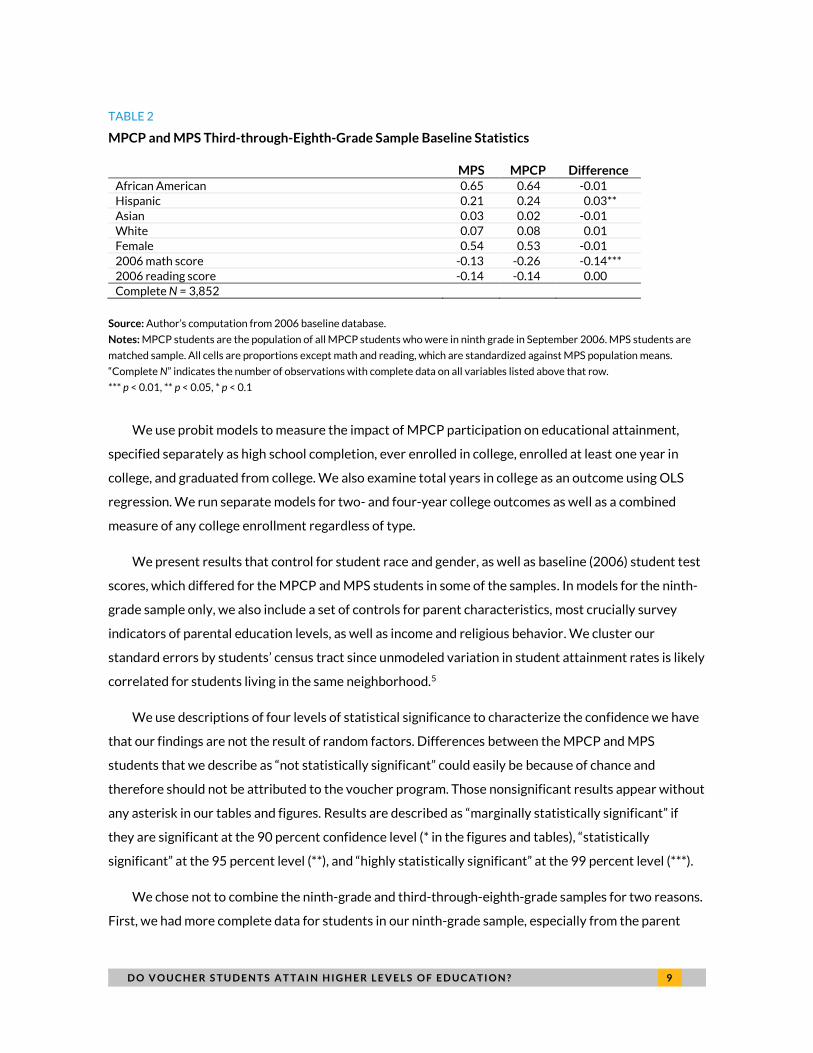
Table 2 provides similar evidence regarding the larger sample of students in grades three through
eight. Survey data on family background factors for this group were less complete than for the ninth-
grade sample and therefore are not presented here or used in the analysis. The proportions of African
American, Asian, white, and female students were similar across the two groups. There were 3
percentage points more Hispanic students in the MPCP than in the MPS sample.
Average reading test scores were similar across the two groups but average math scores were
higher for the MPCP voucher sample. This test-score difference was driven by the group averages in
grades three through five exclusively. Although the MPS students were matched to the MPCP students
within a narrow test-score band, in those lower grades the MPS matched students tended to be near
the bottom of that range in math.
D O V O U C H E R S T U D E N T S A T T A I N H I G H E R L E V E L S O F E D U C A T I O N ? 9
TABLE 2
MPCP and MPS Third-through-Eighth-Grade Sample Baseline Statistics
MPS MPCP Difference African American 0.65 0.64 -0.01
Hispanic 0.21 0.24 0.03**
Asian 0.03 0.02 -0.01
White 0.07 0.08 0.01
Female 0.54 0.53 -0.01
2006 math score -0.13 -0.26 -0.14***
2006 reading score -0.14 -0.14 0.00
Complete N = 3,852
Source: Author’s computation from 2006 baseline database.
Notes: MPCP students are the population of all MPCP students who were in ninth grade in September 2006. MPS students are
matched sample. All cells are proportions except math and reading, which are standardized against MPS population means.
“Complete N” indicates the number of observations with complete data on all variables listed above that row.
*** p < 0.01, ** p < 0.05, * p < 0.1
We use probit models to measure the impact of MPCP participation on educational attainment,
specified separately as high school completion, ever enrolled in college, enrolled at least one year in
college, and graduated from college. We also examine total years in college as an outcome using OLS
regression. We run separate models for two- and four-year college outcomes as well as a combined
measure of any college enrollment regardless of type.
We present results that control for student race and gender, as well as baseline (2006) student test
scores, which differed for the MPCP and MPS students in some of the samples. In models for the ninth-
grade sample only, we also include a set of controls for parent characteristics, most crucially survey
indicators of parental education levels, as well as income and religious behavior. We cluster our
standard errors by students’ census tract since unmodeled variation in student attainment rates is likely
correlated for students living in the same neighborhood.5
We use descriptions of four levels of statistical significance to characterize the confidence we have
that our findings are not the result of random factors. Differences between the MPCP and MPS
students that we describe as “not statistically significant” could easily be because of chance and
therefore should not be attributed to the voucher program. Those nonsignificant results appear without
any asterisk in our tables and figures. Results are described as “marginally statistically significant” if
they are significant at the 90 percent confidence level (* in the figures and tables), “statistically
significant” at the 95 percent level (**), and “highly statistically significant” at the 99 percent level (***).
We chose not to combine the ninth-grade and third-through-eighth-grade samples for two reasons.
First, we had more complete data for students in our ninth-grade sample, especially from the parent
1 0 D O V O U C H E R S T U D E N T S A T T A I N H I G H E R L E V E L S O F E D U C A T I O N ?
survey administered after the match. If we had combined the samples, we would not have been able to
include control variables for parent characteristics without losing over half of the observations in the
sample because of missing data. Since our most complete and rigorous model could only be estimated
on the ninth-grade sample, we kept that sample separate from the larger third-through-eighth-grade
sample.
Second, the experience of the MPCP may have been different for the voucher students in the two
samples. For the ninth-graders we knew that they had experienced at least one year in a private high
school. For the third-through-eighth-graders we only knew for sure that they had experienced at least
one year in a private elementary school. Private schooling may have a different effect on attainment if
experienced in high school versus elementary school. Coupled with the differences in data on control
variables, this gave us convincing reasons to analyze the two samples separately.
We obtained data on student college enrollments from the Student Tracker service of the National
Student Clearinghouse. The Clearinghouse consolidates the information about college enrollments,
persistence, and graduation from almost every two- and four-year institution of higher education in the
US, covering over 98 percent of all college students. We received data from the Clearinghouse on
October 6, 2017. Those data reflect the college-going status of students at least through June of 2017.
A ninth-grade student in our sample who graduated from high school on time, immediately enrolled
in a four-year college, and graduated from college on time would have graduated by June of 2014. That
means that our ninth-grade cohort was checked for on-time college graduation plus an extra three
years. The eighth-grade cohort was covered for on-time college graduation plus two years, the seventh-
graders for on-time plus one year, the sixth-graders for on-time, the fifth-graders for on-time minus one
year, the fourth-graders for on-time minus two years, and the third-graders for on-time minus three
years. The attainment measure of “ever graduated from a four-year college” is thus much more
appropriate for our ninth-grade cohort, who had seven years to enroll in and complete college, than for
our third-through-eighth-grade sample, half of whom would not have had the opportunity to graduate
from college on time within the time parameters of our study. For that reason, we exclude the third-
through-fifth grade students from the sample specifically when analyzing four-year college graduation
rates, making that sample effectively sixth-through-eighth grade.
We only have limited data on the number of years that students who were in MPCP at baseline
attended private schools in subsequent years, but the available information suggests divergent patterns
by grade level. Forty-four percent of the ninth-grade sample of MPCP students remained in the voucher
program for the next four years (Cowen et al. 2013) compared with 55 percent of students who began
D O V O U C H E R S T U D E N T S A T T A I N H I G H E R L E V E L S O F E D U C A T I O N ? 1 1
the study in grades three through five (Cowen et al. 2012). The persistence rate of the baseline sixth-
through-eighth-grade students was between the lower rate of the ninth-grade students and the higher
rate of the third-through-fifth grade students. Since 70 percent of the students in the study had
participated in the voucher program prior to 2006, it is reasonable to conclude that most of them
experienced a moderate “dose” of the school voucher intervention of three to six years total. Although
our data are not precise on this question, they suggest that most MPCP students experienced private
schooling for more than one year but not for the majority of their years in K–12 schools.
Results
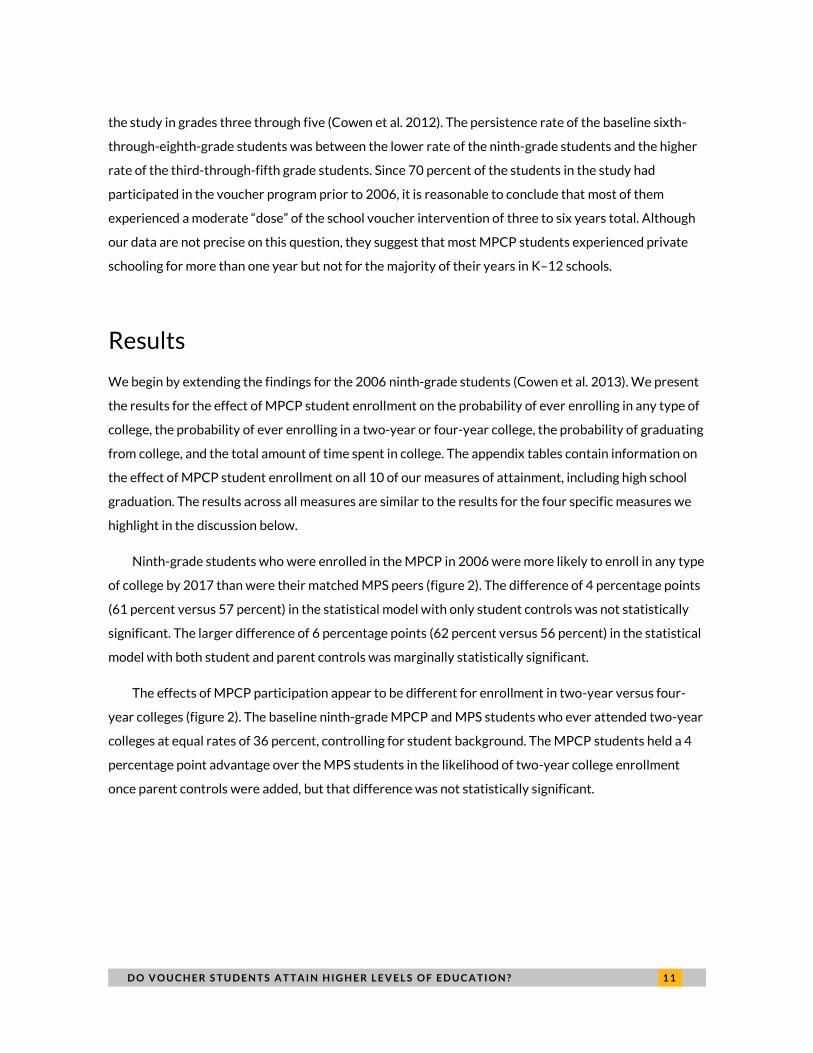
We begin by extending the findings for the 2006 ninth-grade students (Cowen et al. 2013). We present
the results for the effect of MPCP student enrollment on the probability of ever enrolling in any type of
college, the probability of ever enrolling in a two-year or four-year college, the probability of graduating
from college, and the total amount of time spent in college. The appendix tables contain information on
the effect of MPCP student enrollment on all 10 of our measures of attainment, including high school
graduation. The results across all measures are similar to the results for the four specific measures we
highlight in the discussion below.
Ninth-grade students who were enrolled in the MPCP in 2006 were more likely to enroll in any type
of college by 2017 than were their matched MPS peers (figure 2). The difference of 4 percentage points
(61 percent versus 57 percent) in the statistical model with only student controls was not statistically
significant. The larger difference of 6 percentage points (62 percent versus 56 percent) in the statistical
model with both student and parent controls was marginally statistically significant.
The effects of MPCP participation appear to be different for enrollment in two-year versus four-
year colleges (figure 2). The baseline ninth-grade MPCP and MPS students who ever attended two-year
colleges at equal rates of 36 percent, controlling for student background. The MPCP students held a 4
percentage point advantage over the MPS students in the likelihood of two-year college enrollment
once parent controls were added, but that difference was not statistically significant.
1 2 D O V O U C H E R S T U D E N T S A T T A I N H I G H E R L E V E L S O F E D U C A T I O N ?
FIGURE 2
Effect of MPCP Participation on College Enrollment, Ninth Grade at Baseline
URBAN INSTITUTE
Notes: Regression estimates with student controls (N = 1,289) include student race, gender, and baseline reading and math
scores; estimates with full controls (N = 863) add parent education, parent income, and parent religiosity. Robust standard errors
are clustered by census tract. Estimates are marginal effects from probit estimations.
*** p < 0.01, ** p < 0.05, * p < 0.10
We find stronger evidence that MPCP students in our ninth-grade sample enrolled in four-year
colleges at higher rates than their matched MPS peers. Controlling for student background, the MPCP
rate of ever enrolling in a four-year institution was 43 percent compared with 37 percent for MPS. The
MPCP advantage of 6 percentage points in the probability of ever attending a four-year college or
university was statistically significant. After parent controls were added to the model, the MPCP
advantage in the probability of enrolling in a four-year institution remained 6 percentage points and
statistically significant.
The evidence continues to be stronger for an MPCP effect on attainment in four-year institutions of
higher education than two-year institutions, when total time at the institution is the attainment
measure (tables A.1–A.3). The Milwaukee students obtained an average of about three-quarters of a
year of education at two-year colleges, whether they were MPCP or MPS ninth-graders in 2006 and
whether we controlled for only student background or both student and parent background.
Controlling for student background, the MPCP students completed an average of 1.38 years in a four-
57% 56%
36%
32%
37% 38%
61% 62%*
36% 36%
42%** 44%**
Student controls Full controls Student controls Full controls Student controls Full controls
Any College Ever Enrolled in Two-Year College Ever Enrolled in Four-Year College
MPS in 2006 MPCP in 2006
D O V O U C H E R S T U D E N T S A T T A I N H I G H E R L E V E L S O F E D U C A T I O N ? 1 3
year college or university compared with 1.16 years for their matched MPS peers. The gain of an extra
22 percent of a year in four-year college attainment for the MPCP students was statistically significant.
Once parent controls were added to the model, however, the MPCP advantage in time completed at a
four-year college dropped to an extra 17 percent of a year and became not statistically significant.
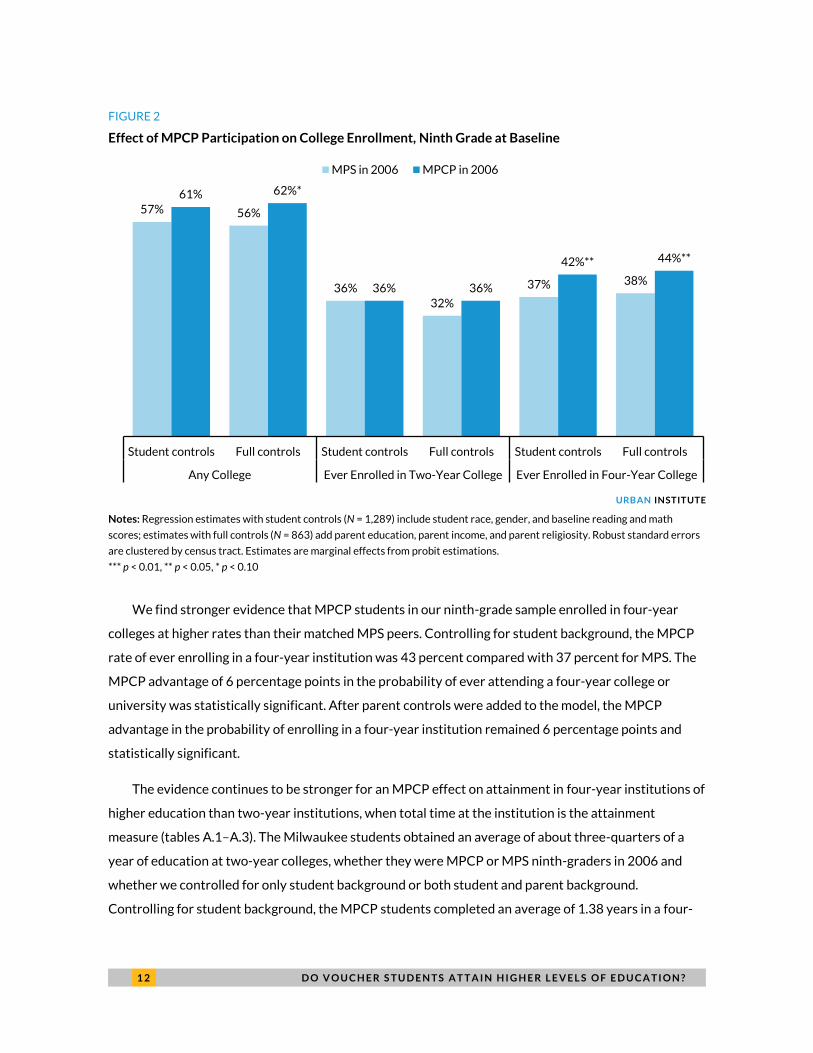
Although simply enrolling and spending some time in college benefits students, the ultimate
attainment prize is college graduation. Low-income inner-city students traditionally struggle to
complete college degrees (Bound, Lovenheim, and Turner 2012). Our results indicate that struggle
continued for the Milwaukee 2006 ninth-graders in our study. By 2017, the students had obtained two-
year degrees at rates of 3–4 percent whether they were enrolled in MPCP or MPS and whether we
controlled for only student or both student and parent background factors (figure 3). The estimated
graduation rate from a four-year college was 13–14 percent for the MPCP students and a statistically
similar 12–13 percent for their matched MPS peers, depending on the statistical model.
FIGURE 3
Effect of MPCP Participation on Degree Attainment, Ninth Grade at Baseline
URBAN INSTITUTE
Notes: Regression estimates with student controls (N = 1,289) include student race, gender, and baseline reading and math
scores; estimates with full controls (N = 863) add parent education, parent income, and parent religiosity. Robust standard errors
are clustered by census tract. Estimates are marginal effects from probit estimations.
*** p < 0.01, ** p < 0.05, * p < 0.10
4%
3%
12%
13%
3% 3%
13%
14%
Student controls Full controls Student controls Full controls
Graduated Two-Year College Graduated Four-Year College
MPS in 2006 MPCP in 2006
1 4 D O V O U C H E R S T U D E N T S A T T A I N H I G H E R L E V E L S O F E D U C A T I O N ?
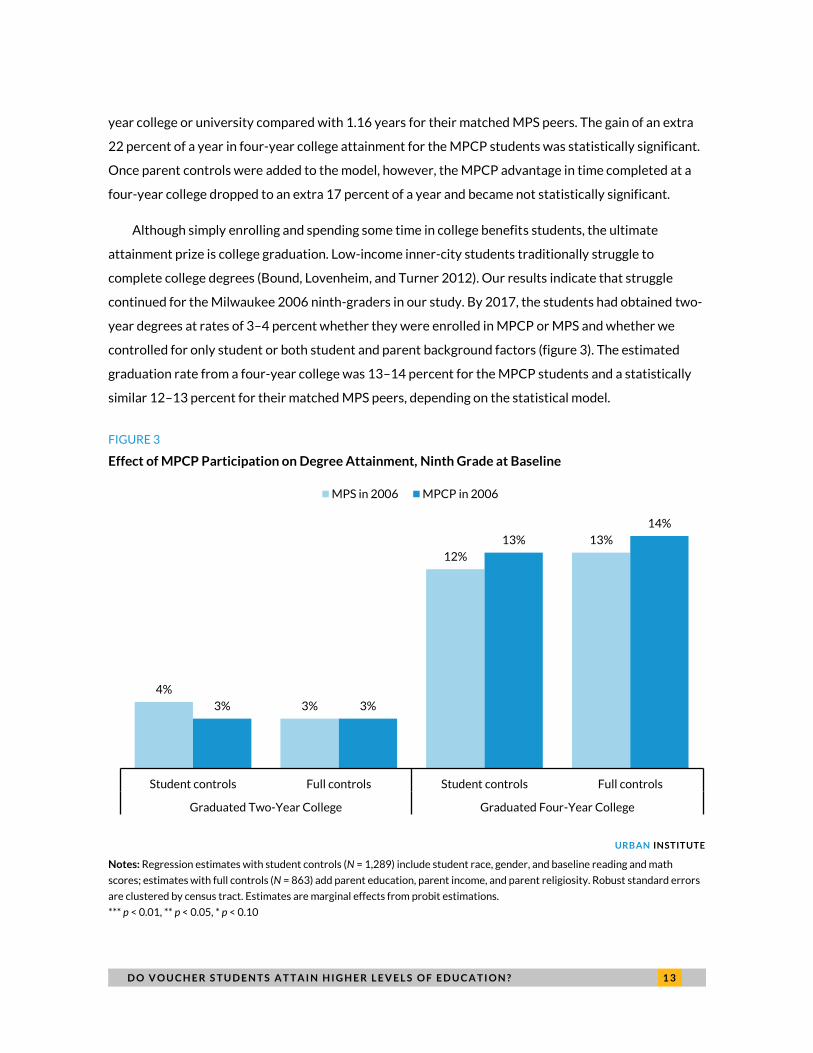
What about our sample of students in third through eighth grade in 2006? Does that group
generate clearer attainment results of the MPCP because of their larger sample size or less clear effects
because we can only be sure that they attended private schools of choice in the elementary grades? We
see a nearly identical pattern of attainment effects for the younger sample of students in 2006 as we
observed for the ninth-graders. All of the results we present here for the sample of students in grades
three through eight in 2006 are based on statistical models that include student controls for gender,
race, income, English language learner status, and 2006 test scores.
Students enrolled in the MPCP in grades three through eight in 2006 were 4 percentage points
more likely than their matched MPS peers to enroll in any type of college by 2017 (47 percent versus 43
percent). The higher college enrollment rate for the MPCP students was highly statistically significant
(figure 4). The MPCP enrollment advantage for the younger sample of students is only clear regarding
four-year colleges. MPCP students enrolled in two-year colleges at a rate that was 4 percentage points
higher than their MPS peers (30 percent versus 26 percent), but that difference was not statistically
significant. The younger sample of MPCP students enrolled in four-year colleges at a rate that was 5
percentage points higher than their MPS peers (30 percent versus 25 percent) and that difference was
highly statistically significant.
FIGURE 4
Effect of MPCP Participation on College Enrollment, Third through Eighth Grades at Baseline
URBAN INSTITUTE
Notes: N = 3,682. Regression estimates include student race, gender, and baseline reading and math scores. Robust standard
errors are clustered by census tract. Estimates are marginal effects from probit estimations.
*** p < 0.01, ** p < 0.05, * p < 0.10
43%
26% 25%
47%***
30% 30%***
Ever enrolled anywhere Ever enrolled in two-year college Ever enrolled in four-year college
MPS in 2006 MPCP in 2006

D O V O U C H E R S T U D E N T S A T T A I N H I G H E R L E V E L S O F E D U C A T I O N ? 1 5
A similar pattern is apparent regarding the years of college completed by MPCP and MPS students
in our 2006 third-through-eighth-grade sample (tables A.4 and A.5). By 2017, both groups had averaged
about half a year at a two-year college. The MPCP students, however, averaged 13 percent of a year
more time at a four-year college than the matched MPS students (0.81 of a year versus 0.68 of a year),
another attainment advantage for the voucher students that was highly statistically significant.
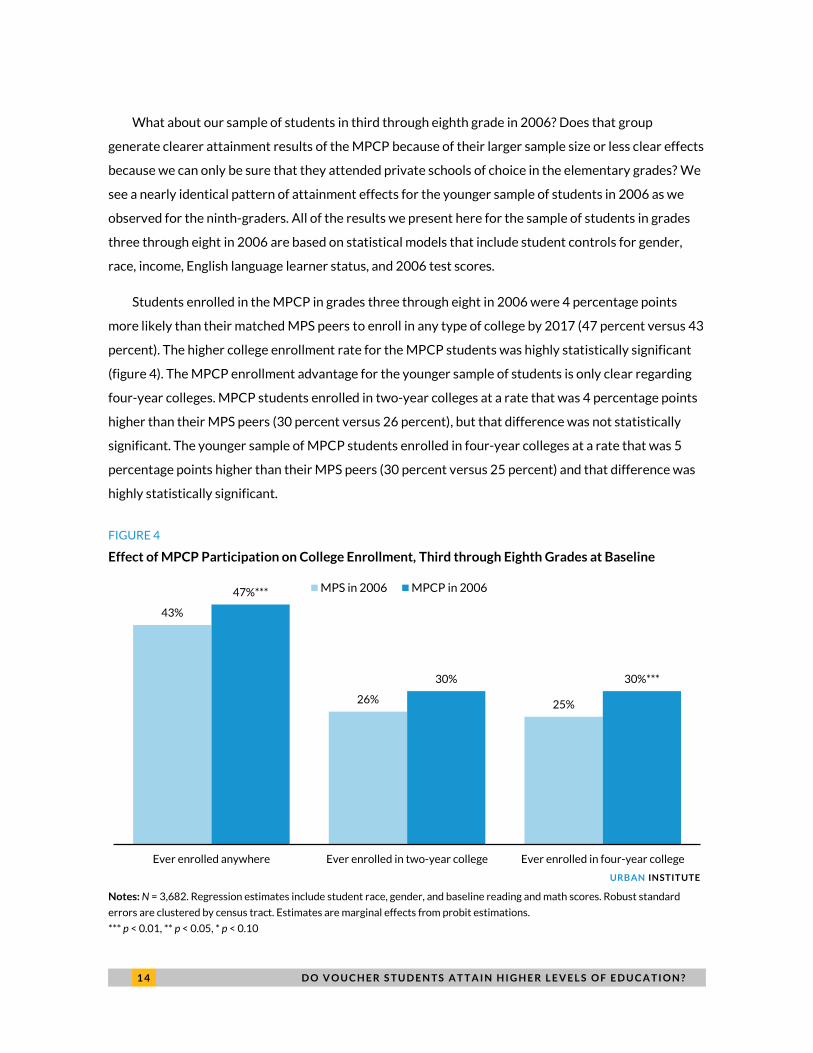
Finally, as with our ninth-grade sample, we do not see clear evidence that students who were in
grades three through eight in 2006 are graduating from college at higher rates if they were in the MPCP
(figure 5). Only 2 percent of both the MPCP and MPS groups had graduated from a two-year college by
2017. The MPCP students graduated from four-year colleges at a rate that was 2 percentage points
higher than their MPS peers (9 percent versus 7 percent) but that difference was not statistically
significant. One reason for the lower graduation rates of the third-through-eighth-grade sample
compared with the ninth-grade sample is that the younger students had less time to graduate from a
four-year college when we collected our outcome data.
FIGURE 5
Effect of MPCP Participation on Degree Attainment, Third through Eighth Grades at Baseline
URBAN INSTITUTE
Notes: N = 3,682; 3,030 for two-year graduation; 1,786 for four-year graduation. Regression estimates include student race,
gender, and baseline reading and math scores. Robust standard errors are clustered by census tract. Graduation from two-year
college limited to students in fourth grade and up in 2006–07. Graduation from four-year college limited to students in sixth
grade and up in 2006–07. *** p < 0.01, ** p < 0.05, * p < 0.10
2%
7%
2%
9%
Graduated two-year college Graduated four-year college
MPS in 2006 MPCP in 2006
1 6 D O V O U C H E R S T U D E N T S A T T A I N H I G H E R L E V E L S O F E D U C A T I O N ?
Conclusions
These findings regarding the attainment effects of the Milwaukee Parental Choice Program are from a
quasi-experimental study that matched a representative sample of MPCP students who were enrolled
in the voucher program in 2006 with a similar group of students enrolled in Milwaukee Public Schools
that same year. There are three reasons to think these effects were caused by the voucher program.
First, we matched students on neighborhood, an approach viewed as state-of-the-art in quasi-
experimental matching studies (Bifilco 2012) because families who live in the same neighborhood tend
to share similar traits, including their value of education and educational aspirations for their children
(Aaronson 1998; Cullen, Jacob, and Leavitt 2005). Second, for our sample of 2006 ninth-grade students,
both the MPCP and MPS students were statistically similar regarding key parent characteristics, such
as parent educational attainment and the proportion who had two parents living in the home, even
though those two variables were not available for the match. Third, the statistically significant
differences we observed between the MPCP and MPS groups were highly consistent for most
attainment outcomes regardless of whether we controlled for no variables, only student background
factors, or both student and parent variables, suggesting that uncorrected self-selection bias is not
driving our findings.
The collective evidence in this paper indicates that students in the Milwaukee Parental Choice
Program tend to have higher levels of many measures of educational attainment than a carefully
matched comparison group of Milwaukee Public School students. That finding generally applies to the
original ninth-grade sample of students and a new sample of students enrolled in the program in grades
three through eight in 2006. The MPCP students are more likely to enroll, persist, and experience more
total years in a four-year college. Although both of our samples of students graduated from a four-year
college at slightly higher rates if they participated in the MPCP as opposed to the MPS in 2006, those
differences were not statistically significant.
For all students in either group, both two- and four-year college graduation rates are very low. The
highest estimated rate for four-year graduation for any students is 14 percent. This low completion rate
is symptomatic of many inner-city high school graduates who go on to college. Colleges and universities
have been struggling with this issue for decades and are far from solving it. Fortunately, research
indicates that any exposure to college is positive in terms of careers, lifetime income, and reduced
behavioral problems. The message to both public and private schools is that goals must be elevated
beyond high school graduation and college enrollment to success in those colleges. And that may
D O V O U C H E R S T U D E N T S A T T A I N H I G H E R L E V E L S O F E D U C A T I O N ? 1 7
suggest using different forms of high school education, imparting more advanced skills and study and
research habits that will reduce the shock that college imposes.
Our findings contribute to a growing body of social science results indicating that private school
voucher programs positively affect student educational attainment (Chingos and Peterson 2015;
Chingos and Kuehn 2017; Cowen et al. 2013; Wolf et al. 2013). Our results pose an interesting contrast
to the findings of Matthew Chingos and Daniel Kuehn (2017) regarding the attainment effects of the
Florida Tax Credit Scholarship Program. The evaluators of the Florida program found clear positive
attainment effects of that voucher program that were limited to two-year colleges. The positive
attainment effects of the Milwaukee Parental Choice Program that we present here, in contrast, are
limited to four-year colleges. It is possible that four-year colleges are more common sources of higher
education in Wisconsin, which has an extensive network of public four-year colleges, than in Florida.
The urban students in our Milwaukee study might have been especially attracted to four-year colleges
including the University of Wisconsin-Milwaukee, which was the most common target of enrollment for
both our MPCP and MPS students. The Florida voucher program, in contrast, was statewide and
included many students from rural areas who are more commonly served by two-year than by four-year
colleges. These points underscore the fact that context matters in any study of the effects of private
school vouchers on student outcomes, including attainment. More research on this vital question would
be welcome.
1 8 A P P E N D I X
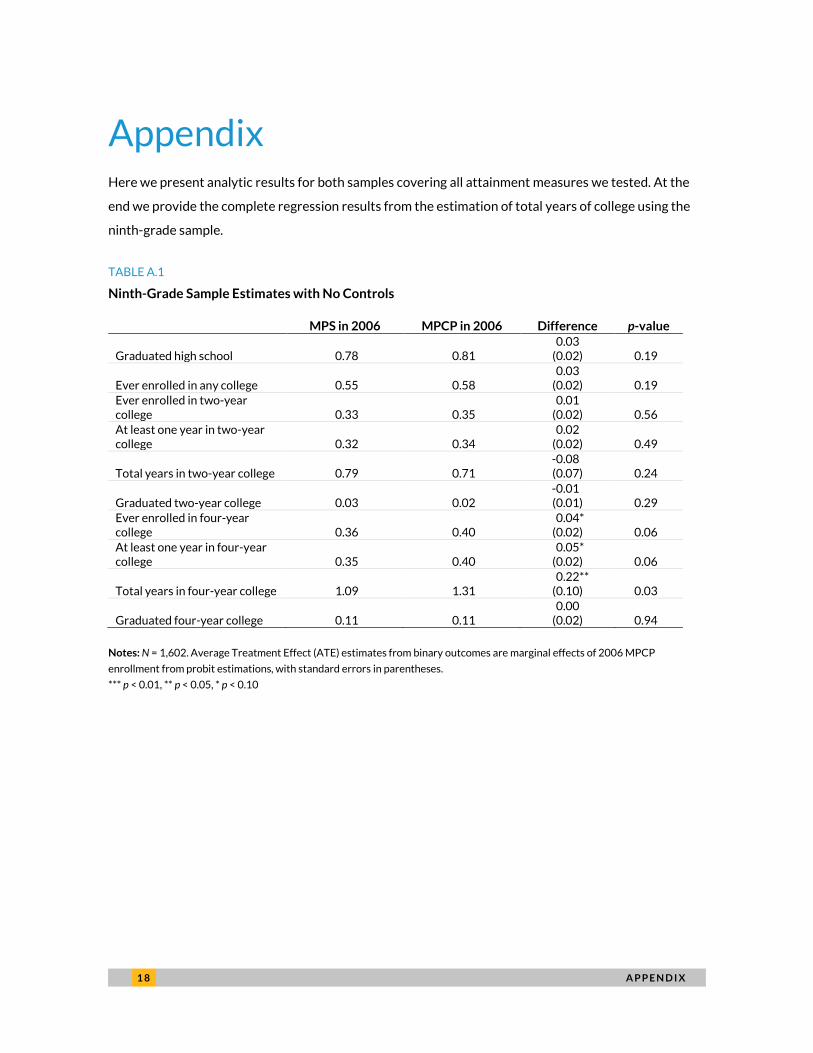
Appendix Here we present analytic results for both samples covering all attainment measures we tested. At the
end we provide the complete regression results from the estimation of total years of college using the
ninth-grade sample.
TABLE A.1
Ninth-Grade Sample Estimates with No Controls
MPS in 2006 MPCP in 2006 Difference p-value
Graduated high school 0.78 0.81 0.03
(0.02) 0.19
Ever enrolled in any college 0.55 0.58 0.03
(0.02) 0.19
Ever enrolled in two-year college 0.33 0.35
0.01 (0.02) 0.56
At least one year in two-year college 0.32 0.34
0.02 (0.02) 0.49
Total years in two-year college 0.79 0.71 -0.08 (0.07) 0.24
Graduated two-year college 0.03 0.02 -0.01 (0.01) 0.29
Ever enrolled in four-year college 0.36 0.40
0.04* (0.02) 0.06
At least one year in four-year college 0.35 0.40
0.05* (0.02) 0.06
Total years in four-year college 1.09 1.31 0.22**
(0.10) 0.03
Graduated four-year college 0.11 0.11 0.00
(0.02) 0.94
Notes: N = 1,602. Average Treatment Effect (ATE) estimates from binary outcomes are marginal effects of 2006 MPCP
enrollment from probit estimations, with standard errors in parentheses.
*** p < 0.01, ** p < 0.05, * p < 0.10
A P P E N D I X 1 9
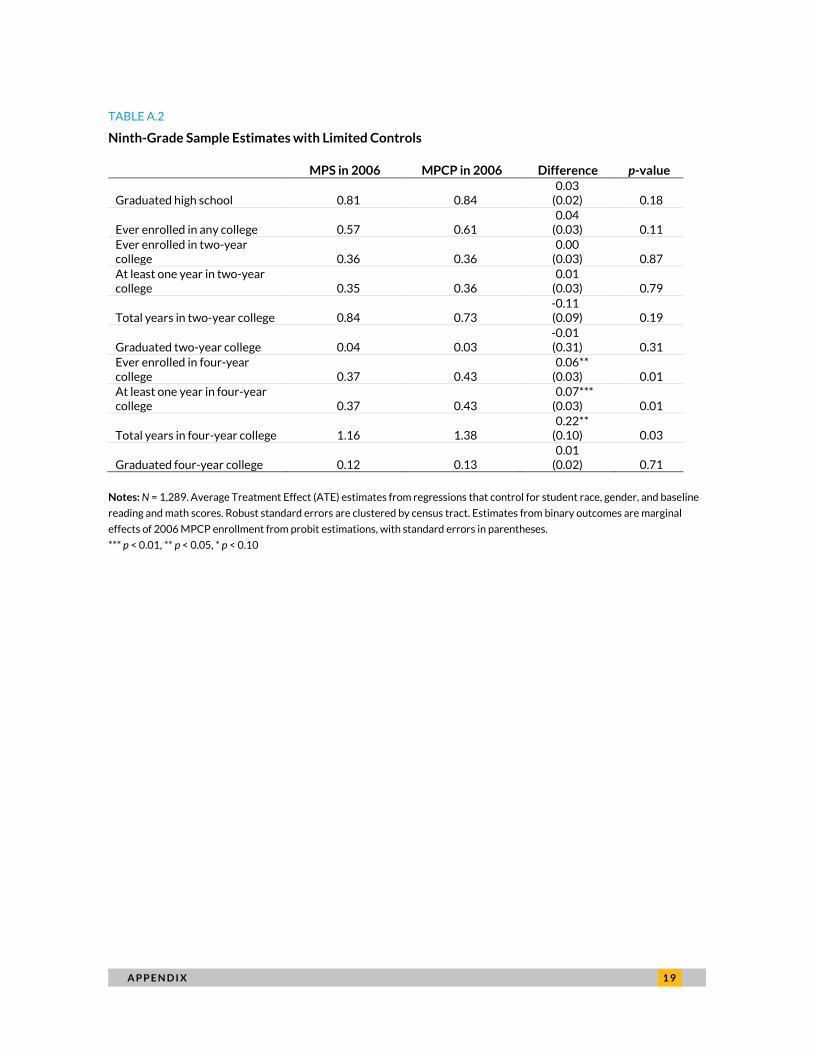
TABLE A.2
Ninth-Grade Sample Estimates with Limited Controls
MPS in 2006 MPCP in 2006 Difference p-value
Graduated high school 0.81 0.84 0.03
(0.02) 0.18
Ever enrolled in any college 0.57 0.61 0.04
(0.03) 0.11
Ever enrolled in two-year college 0.36 0.36
0.00 (0.03) 0.87
At least one year in two-year college 0.35 0.36
0.01 (0.03) 0.79
Total years in two-year college 0.84 0.73 -0.11 (0.09) 0.19
Graduated two-year college 0.04 0.03 -0.01 (0.31) 0.31
Ever enrolled in four-year college 0.37 0.43
0.06** (0.03) 0.01
At least one year in four-year college 0.37 0.43
0.07*** (0.03) 0.01
Total years in four-year college 1.16 1.38 0.22**
(0.10) 0.03
Graduated four-year college 0.12 0.13 0.01
(0.02) 0.71
Notes: N = 1,289. Average Treatment Effect (ATE) estimates from regressions that control for student race, gender, and baseline
reading and math scores. Robust standard errors are clustered by census tract. Estimates from binary outcomes are marginal
effects of 2006 MPCP enrollment from probit estimations, with standard errors in parentheses.
*** p < 0.01, ** p < 0.05, * p < 0.10
2 0 A P P E N D I X
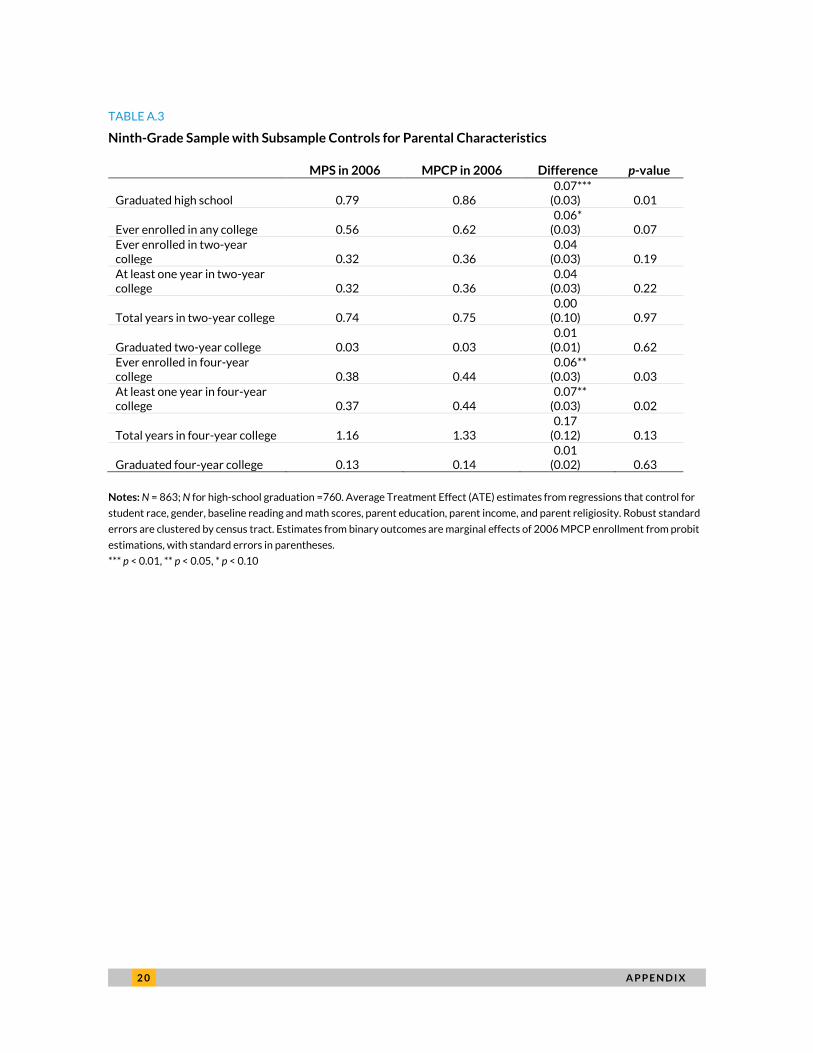
TABLE A.3
Ninth-Grade Sample with Subsample Controls for Parental Characteristics
MPS in 2006 MPCP in 2006 Difference p-value
Graduated high school 0.79 0.86 0.07***
(0.03) 0.01
Ever enrolled in any college 0.56 0.62 0.06*
(0.03) 0.07
Ever enrolled in two-year college 0.32 0.36
0.04 (0.03) 0.19
At least one year in two-year college 0.32 0.36
0.04 (0.03) 0.22
Total years in two-year college 0.74 0.75 0.00
(0.10) 0.97
Graduated two-year college 0.03 0.03 0.01
(0.01) 0.62
Ever enrolled in four-year college 0.38 0.44
0.06** (0.03) 0.03
At least one year in four-year college 0.37 0.44
0.07** (0.03) 0.02
Total years in four-year college 1.16 1.33 0.17
(0.12) 0.13
Graduated four-year college 0.13 0.14 0.01
(0.02) 0.63
Notes: N = 863; N for high-school graduation =760. Average Treatment Effect (ATE) estimates from regressions that control for
student race, gender, baseline reading and math scores, parent education, parent income, and parent religiosity. Robust standard
errors are clustered by census tract. Estimates from binary outcomes are marginal effects of 2006 MPCP enrollment from probit
estimations, with standard errors in parentheses.
*** p < 0.01, ** p < 0.05, * p < 0.10
A P P E N D I X 2 1
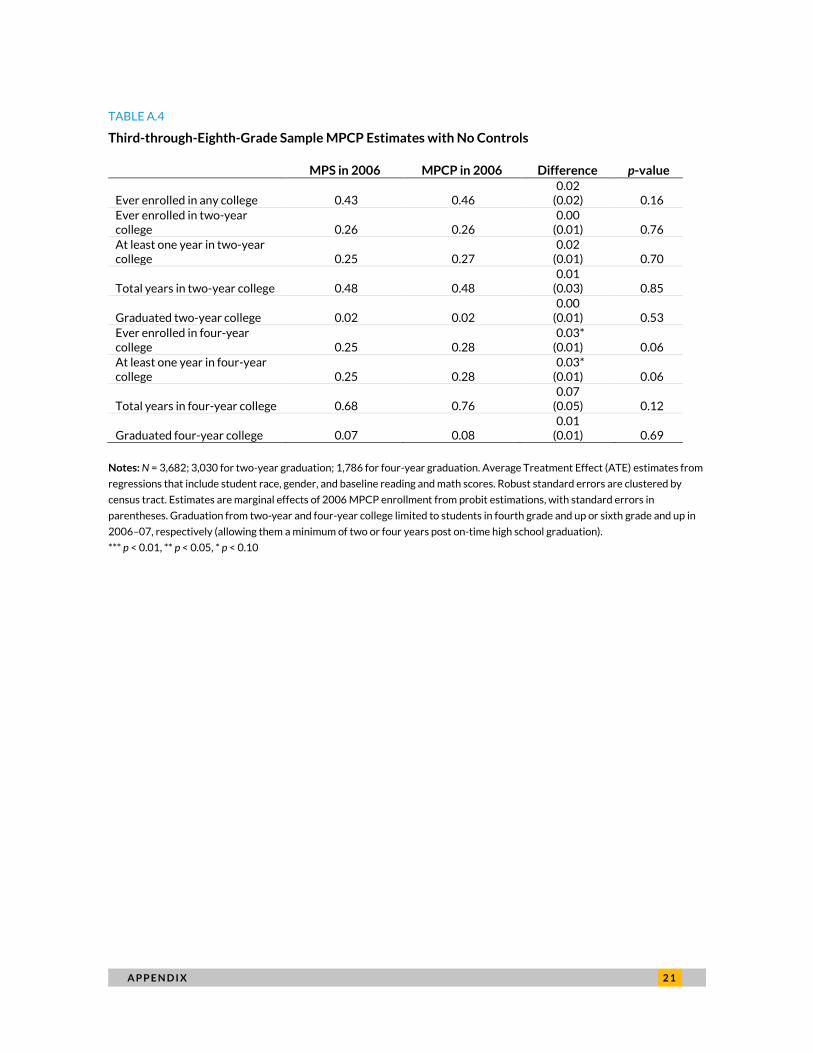
TABLE A.4
Third-through-Eighth-Grade Sample MPCP Estimates with No Controls
MPS in 2006 MPCP in 2006 Difference p-value
Ever enrolled in any college 0.43 0.46 0.02
(0.02) 0.16
Ever enrolled in two-year college 0.26 0.26
0.00 (0.01) 0.76
At least one year in two-year college 0.25 0.27
0.02 (0.01) 0.70
Total years in two-year college 0.48 0.48 0.01
(0.03) 0.85
Graduated two-year college 0.02 0.02 0.00
(0.01) 0.53
Ever enrolled in four-year college 0.25 0.28
0.03* (0.01) 0.06
At least one year in four-year college 0.25 0.28
0.03* (0.01) 0.06
Total years in four-year college 0.68 0.76 0.07
(0.05) 0.12
Graduated four-year college 0.07 0.08 0.01
(0.01) 0.69
Notes: N = 3,682; 3,030 for two-year graduation; 1,786 for four-year graduation. Average Treatment Effect (ATE) estimates from
regressions that include student race, gender, and baseline reading and math scores. Robust standard errors are clustered by
census tract. Estimates are marginal effects of 2006 MPCP enrollment from probit estimations, with standard errors in
parentheses. Graduation from two-year and four-year college limited to students in fourth grade and up or sixth grade and up in
2006–07, respectively (allowing them a minimum of two or four years post on-time high school graduation).
*** p < 0.01, ** p < 0.05, * p < 0.10
2 2 A P P E N D I X
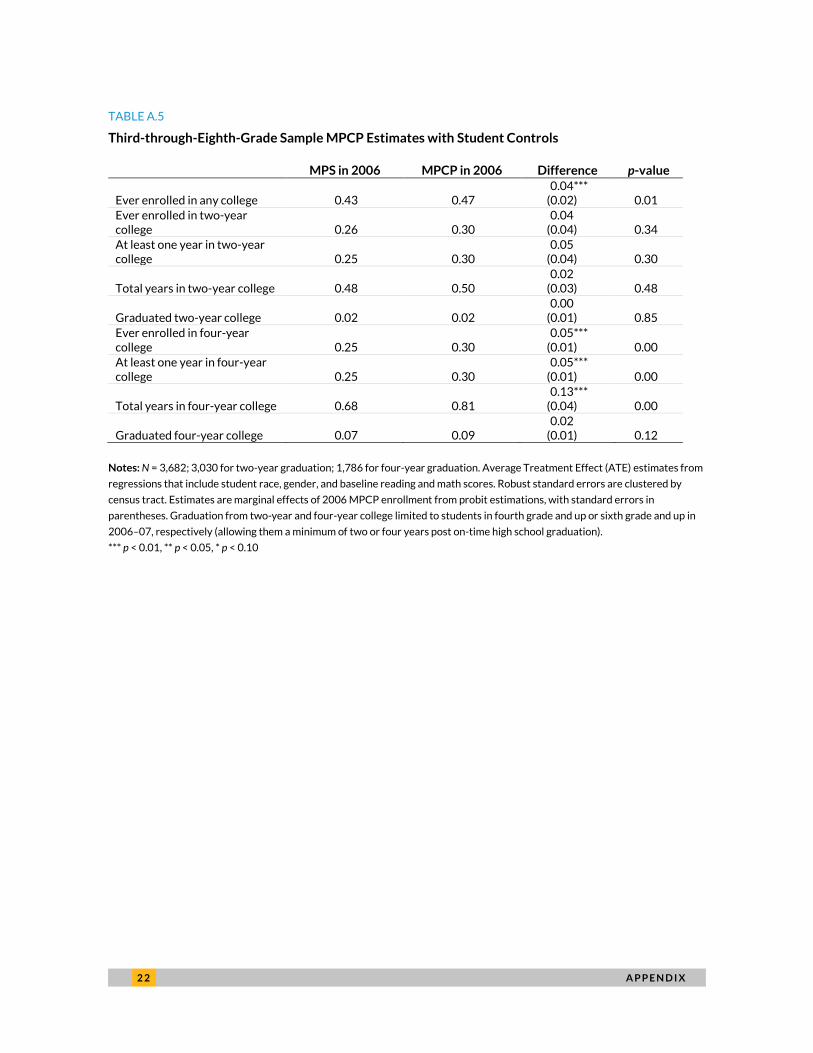
TABLE A.5
Third-through-Eighth-Grade Sample MPCP Estimates with Student Controls
MPS in 2006 MPCP in 2006 Difference p-value
Ever enrolled in any college 0.43 0.47 0.04***
(0.02) 0.01
Ever enrolled in two-year college 0.26 0.30
0.04 (0.04) 0.34
At least one year in two-year college 0.25 0.30
0.05 (0.04) 0.30
Total years in two-year college 0.48 0.50 0.02
(0.03) 0.48
Graduated two-year college 0.02 0.02 0.00
(0.01) 0.85
Ever enrolled in four-year college 0.25 0.30
0.05*** (0.01) 0.00
At least one year in four-year college 0.25 0.30
0.05*** (0.01) 0.00
Total years in four-year college 0.68 0.81 0.13***
(0.04) 0.00
Graduated four-year college 0.07 0.09 0.02
(0.01) 0.12
Notes: N = 3,682; 3,030 for two-year graduation; 1,786 for four-year graduation. Average Treatment Effect (ATE) estimates from
regressions that include student race, gender, and baseline reading and math scores. Robust standard errors are clustered by
census tract. Estimates are marginal effects of 2006 MPCP enrollment from probit estimations, with standard errors in
parentheses. Graduation from two-year and four-year college limited to students in fourth grade and up or sixth grade and up in
2006–07, respectively (allowing them a minimum of two or four years post on-time high school graduation).
*** p < 0.01, ** p < 0.05, * p < 0.10
A P P E N D I X 2 3
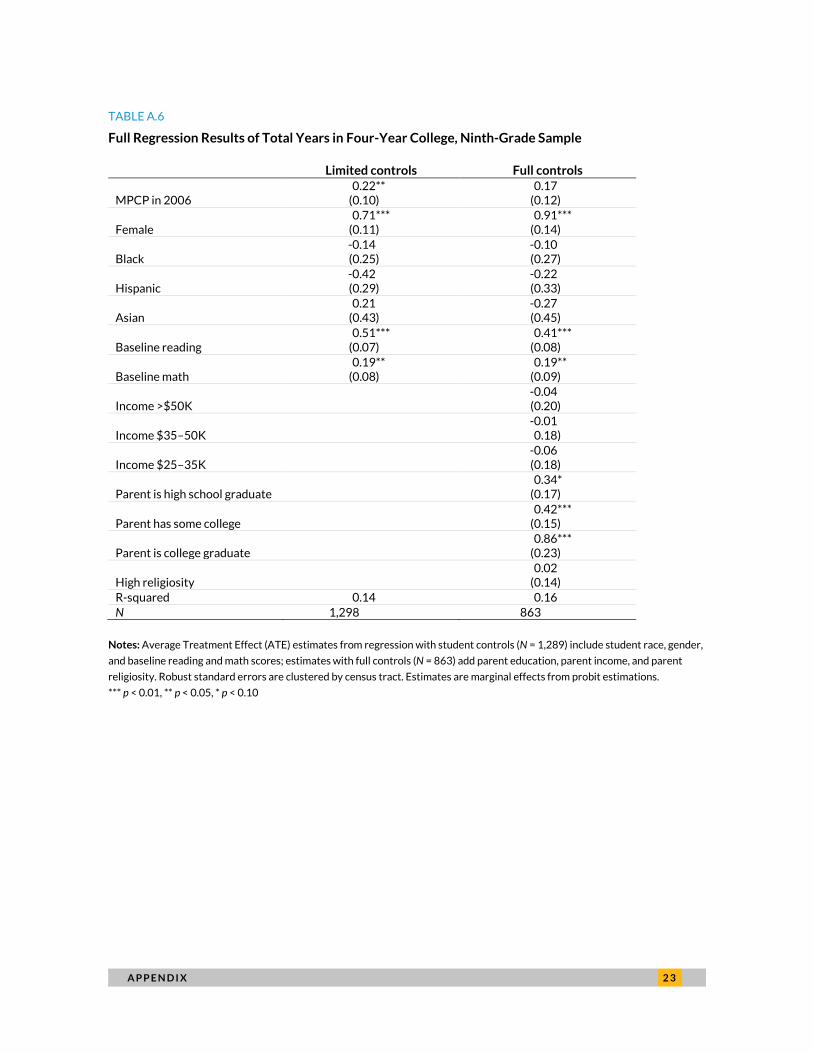
TABLE A.6
Full Regression Results of Total Years in Four-Year College, Ninth-Grade Sample
Limited controls Full controls
MPCP in 2006 0.22**
(0.10) 0.17
(0.12)
Female 0.71***
(0.11) 0.91***
(0.14)
Black -0.14 (0.25)
-0.10 (0.27)
Hispanic -0.42 (0.29)
-0.22 (0.33)
Asian 0.21
(0.43) -0.27 (0.45)
Baseline reading 0.51***
(0.07) 0.41***
(0.08)
Baseline math 0.19**
(0.08) 0.19**
(0.09)
Income >$50K -0.04 (0.20)
Income $35–50K -0.01 0.18)
Income $25–35K -0.06 (0.18)
Parent is high school graduate 0.34*
(0.17)
Parent has some college 0.42***
(0.15)
Parent is college graduate 0.86***
(0.23)
High religiosity 0.02
(0.14)
R-squared 0.14 0.16
N 1,298 863
Notes: Average Treatment Effect (ATE) estimates from regression with student controls (N = 1,289) include student race, gender,
and baseline reading and math scores; estimates with full controls (N = 863) add parent education, parent income, and parent
religiosity. Robust standard errors are clustered by census tract. Estimates are marginal effects from probit estimations.
*** p < 0.01, ** p < 0.05, * p < 0.10
2 4 N O T E S
Notes 1. Vermont and Maine began providing government funds to private schools in 1869 and 1873, respectively, to
cover the tuition for students in rural areas that lacked public schools. We consider the MPCP meaningfully
different from these early government-funded private school choice programs. The central purpose of the
Milwaukee program is to provide families with a variety of educational options from which to choose. The
central purpose of the Vermont and Maine town-tuitioning programs, in contrast, is to relieve their public
school systems of the burden to build and operate expensive, comprehensive public schools in remote areas
that lack a critical mass of students but where there are small, private schools. The Milwaukee voucher
program is an exercise in parental school choice. The town-tuitioning programs are an exercise in government
outsourcing.
2. Zelman v. Simmons-Harris, 536 U.S. 639 (2002).
3. “Milwaukee Parental Choice Program: MPCP facts and figures for 2017–18,” Wisconsin Department of Public
Instruction, October 2017.
4. Starting in 2011, three new and smaller Wisconsin school voucher programs were enacted. The first was a
program for Racine, Wisconsin, called the Racine Parental Choice Program, that is very similar to the current
design of the MPCP. The program, launched in 2011, enrolled 2,915 students in 23 participating schools in
2017–18. A statewide program, the Wisconsin Parental Choice Program, was enacted in 2013 and remains
targeted only to students with family incomes below 220 percent of the poverty level. The program currently
serves 4,540 students in 154 private schools. In 2016, a statewide voucher program for students with
disabilities was launched with an estimated enrollment of 244 students in 28 private schools 2017–18. Almost
$275 million in education spending was channeled through the various voucher programs in Wisconsin in
2016–17. See “Racine Parental Choice Program: RPCP facts and figures for 2017–18,” Wisconsin Department
of Public Instruction, October 2017; “Wisconsin Parental Choice Program: WPCP facts and figures for 2017–
18,” Wisconsin Department of Public Instruction, October 2017; “Private School Choice Programs and Special
Needs Scholarship Program Summary, 2017–18 School Year Student HC, FTE, and Annualized Payment,”
Wisconsin Department of Public Instruction, October 2017.
5. For example, a particular neighborhood might have flooded one year during high school, similarly negatively
affecting the attainment probabilities of all the students who lived there. Conversely, a neighborhood might
have gentrified during the study, similarly boosting the attainment probabilities of students who live there.
Clustering the errors in our regression estimations by neighborhood corrects for such spatial autocorrelation
and thus produces more reliable standard errors and significance tests for the variables in our models,
especially our variable of interest (MPCP participation). We also ran our models with neighborhood fixed
effects and the results were virtually identical to those from our preferred analytic approach.
R E F E R E N C E S 2 5
References Aaronson, Daniel. 1998. “Using Sibling Data to Estimate the Impact of Neighborhoods on Children’s Educational
Outcomes.” Journal of Human Resources 33 (4): 915–46.
Belfield, Clive R., and Henry M. Levin. 2007. “The Return on Investment for Improving California's High School
Graduation Rate.” Santa Barbara: California Dropout Research Project.
Betts, Julian R., Lorien A. Rice, Andrew C. Zau, Y. Emily Tang, and Cory R. Koedel. 2006. Does School Choice Work?
Effects on Student Integration and Achievement. San Francisco: Public Policy Institute of California.
Bifulco, Robert, and Helen F. Ladd. 2007. “School Choice, Racial Segregation, and Test Score Gaps: Evidence from
North Carolina's Charter School Program.” Journal of Policy Analysis and Management 26 (1): 31–56.
Bifulco, Robert. 2012. “Can Nonexperimental Estimates Replicate Random Assignment in Evaluations of School
Choice? A Within‐Study Comparison.” Journal of Policy Analysis and Management 31 (3): 729–51.
Booker, Kevin, Tim R. Sass, Brian Gill, and Ron Zimmer. 2011. “The Effects of Charter High Schools on Educational
Attainment.” Journal of Labor Economics 29 (2): 377–15.
Bound, John, Michael F. Lovenheim, and Sarah Turner. 2012. “Increasing Time to Baccalaureate Degree in the
United States.” Education Finance and Policy 7 (4): 375–24.
Campbell, David E. 2008. “The Civic Side of School Choice: An Empirical Analysis of Civic Education in Public and
Private Schools.” Brigham Young University Law Review 2008 (2): 487–23.
Carlson, Deven, Joshua M. Cowen, and David J. Fleming. 2013. “Life after Vouchers: What Happens to Private
School Students When They Return to the Public Sector?” Educational Evaluation and Policy Analysis 35 (2):
179–99.
Carneiro, Pedro, James J. Heckman, and Edward Vytlacil. 2003. “Understanding What Instrumental Variables
Estimate: Estimating Marginal and Average Returns to Education.” Working paper. University of Chicago.
Chingos, Matthew M., and Daniel Kuehn. 2017. The Effects of Statewide Private School Choice on College Enrollment
and Graduation. Washington, DC: Urban Institute.
Chingos, Matthew M., and Paul E. Peterson. 2015. “Experimentally Estimated Impacts of School Vouchers on
College Enrollment and Degree Attainment.” Journal of Public Economics 122 (1): 1–12.
Coleman, James S., and Thomas Hoffer. 1987. Public and Private High Schools: The Impact of Communities. New York:
Basic Books.
Cowen, Joshua M., David J. Fleming, John F. Witte, and Patrick J. Wolf. 2012. “Going Public: Who Leaves a Large,
Longstanding, and Widely Available Urban Voucher Program?” American Educational Research Journal 49 (2):
231–56.
Cowen, Joshua M., David J. Fleming, John F. Witte, Patrick J. Wolf, and Brian Kisida. 2013. “School Vouchers and
Student Attainment: Evidence from a State-Mandated Study of the Milwaukee Parental Choice Program.”
Policy Studies Journal 41 (1): 147–67.
Cullen, Julie Berry, Brian Jacob, and Steven Leavitt. 2005. “The Impact of School Choice on Student Outcomes: An
Analysis of the Chicago Public Schools.” Journal of Public Economics 89 (5–6): 729–60.
Day, Jennifer Cheeseman, and Eric C. Newburger. 2002. “The Big Payoff: Educational Attainment and Synthetic
Estimates of Work-Life Earnings.” Washington, DC: US Census Bureau.
Dee, Thomas S. 2005. “The Effects of Catholic Schooling on Civic Participation.” International Tax and Public Finance
12 (5): 605–25.
2 6 R E F E R E N C E S
Egalite, Anna J., Laura I. Jensen, Thomas Stewart, and Patrick J. Wolf. 2014. “Finding the Right Fit: Recruiting and
Retaining Teachers in Milwaukee Choice Schools.” Journal of School Choice 8 (1): 113–40.
Egalite, Anna J., Jonathan N. Mills, and Patrick J. Wolf. 2017. “The Impact of Targeted School Vouchers on Racial
Stratification in Louisiana Schools.” Education and Urban Society 49 (3): 271–96.
Fleming, David J. 2009. “Parents and Politics: How Parenthood and Education Policy Shape Civic and Political
Behavior.” PhD dissertation, Department of Political Science, University of Wisconsin.
Fleming, David J., Joshua M. Cowen, John F. Witte, and Patrick J. Wolf. 2015. “Similar Students, Different Choices:
Who Uses a School Voucher in an Otherwise Similar Population of Students?” Education and Urban Society 47
(7): 785–812.
Greene, Jay P., Paul E. Peterson, and Jiangtao Du. 1999. “Effectiveness of School Choice: The Milwaukee Voucher
Experiment.” Education and Urban Society 31 (2): 190–213.
Greene, Jay P. 2005. “Choosing Integration.” In School Choice and Diversity: What the Evidence Says, edited by Janelle
Scott, 27–41. New York: Teachers College Press.
Heckman, JamesJ., and Edward J. Vytlacil. 2001. “Instrumental Variables, Selection Models, and Tight Bounds on
the Average Treatment Effect.” In Economic Evaluation of Labour Market Policies, edited by Michael Lechner and
Friedhelm Pfeiffer, 1–15. University of Chicago.
Howell, William G., Paul E. Peterson, Patrick J. Wolf, and David E. Campbell. 2006. The Education Gap: Vouchers and
Urban Schools. Revised Edition. Washington, DC: Brookings Institution Press.
Kisida, Brian, and Patrick J. Wolf. 2015. “Customer Satisfaction and Educational Outcomes: Experimental Impacts
of the Market-Based Delivery of Public Education.” International Public Management Journal 18 (2): 265–85.
Lauen, Douglas Lee. 2007. “Contextual Explanations of School Choice.” Sociology of Education 80 (3): 179–209.
Lleras-Muney, Adriana. 2005. “The Relationship between Education and Adult Morality in the United States.”
Review of Economic Studies 72 (1): 180–221.
Levitt, Steven D., and Lance Lochner. 2001. “The Determinants of Juvenile Crime.” In Risky Behavior among Youths:
An Economic Analysis, edited by Jonathan Gruber, 327–74. University of Chicago Press.
McShane, Michael. 2013. “Does Mission matter? Examining the Role of Organizational Mission and Religious
Identity in Schools Participating in the Milwaukee Parental Choice Program.” PhD dissertation, Department of
Education Reform, College of Education and Health Professions, University of Arkansas.
Meara, Ellen, Seth Richards, and David Cutler. 2008. “The Gap Gets Bigger: Changes in Mortality and Life
Expectancy, by Education, 1981–2000.” Health Affairs 27 (2): 350–60.
Muennig, Peter. 2005. “The Economic Value of Health Gains Associated with Education Interventions.” Paper
presented at the Equity Symposium on the Social Costs of Inadequate Education, Teachers' College, Columbia
University, New York, October 24–25.
Neal, Derek. 1997. “The Effects of Catholic Secondary Schooling on Educational Achievement.” Journal of Labor
Economics 15 (1): 98–123.
Neal, Derek. 2006. “How Families and Schools Shape the Achievement Gap.” In Generational Change: Closing the Test
Score Gap, edited by Paul E. Peterson. Lanham, MD: Rowman and Littlefield.
Public Policy Forum. 2008. “Did Compromise Voucher Law Achieve Intended Purposes?” Research Brief 96 (1):
February.
Rosenbaum, Paul R., and Donald B. Rubin. 1983. “The Central Role of the Propensity Score in Observational Studies
for Causal Effects.” Biometrika 70 (1): 41–55.
R E F E R E N C E S 2 7
Rouse, Cecilia Elena. 1998. “Private School Vouchers and Student Achievement: An Evaluation of the Milwaukee
Parental Choice Program.” Quarterly Journal of Economics 113 (2): 553–602.
Schneider, Mark, Paul Teske, Melissa Marschall, Michael Mintrom, and Christine Roch. 1997. “Institutional
Arrangements and the Creation of Social Capital: The Effects of Public School Choice.” American Political
Science Review 91 (1): 82–93.
Wirt, John, Susan Choy, Patrick Rooney, Stephen Provasnik, Anindita Sen, and Richard Tobin. 2004. The Condition of
Education. NCES 2004-077. Washington, DC: US Department of Education, National Center for Education
Statistics.
Witte, John F. 2000. The Market Approach to Education: An Analysis of America's First Voucher Program. NJ: Princeton
University Press.
Witte, John F., Patrick J. Wolf, Joshua Cowen, David J. Fleming, and Juanita Lucas-McLean. 2008. MPCP
Longitudinal Educational Growth Study Baseline Report. Milwaukee Evaluation report 5. Fayetteville: University
of Arkansas.
Witte, John F., Patrick J. Wolf, Joshua M. Cowen, Deven E. Carlson, and David J. Fleming. 2014. “High-Stakes
Choice Achievement and Accountability in the Nation’s Oldest Urban Voucher Program.” Educational
Evaluation and Policy Analysis 36 (4): 437–56.
Wolf, Patrick J. 2012. The Comprehensive Longitudinal Evaluation of the Milwaukee Parental Choice Program: Summary
of Final Reports. Milwaukee Evaluation report 36. Fayetteville: University of Arkansas.
Wolf, Patrick J., and Shannon Lasserre-Cortez. 2018. Special Education Enrollment and Classification in Louisiana
Charter Schools and Traditional Schools. REL 2018–288. Washington, DC: US Department of Education, Institute
of Education Sciences, National Center for Education Evaluation and Regional Assistance, Regional
Educational Laboratory Southwest.
Wolf, Patrick J., John F. Witte, and David J. Fleming. 2012. “Special Choices: Do Voucher Schools Serve Students
with Disabilities?” Education Next 12 (3): 16–22.
Wolf, Patrick J., Brian Kisida, Babette Guttmann, Michael Puma, Nada Eissa, and Lou Rizzo. 2013. “School Vouchers
and Student Outcomes: Experimental Evidence from Washington, DC.” Journal of Policy Analysis and
Management 32 (2): 246–70.
Zimmer, Ron, Brian Gill, Kevin Booker, Stephane Lavertu, Tim R. Sass, and John F. Witte. 2009. Charter Schools in
Eight States: Effects on Achievement, Attainment, Integration and Competition. Santa Monica, CA: RAND.
2 8 A B O U T T H E A U T H O R S
About the Authors Patrick J. Wolf is a distinguished professor of education policy at the University of Arkansas in
Fayetteville.
John F. Witte is an emeritus professor of political science and public policy at the University of
Wisconsin–Madison.
Brian Kisida is an assistant research professor in the department of economics and the Truman School
of Public Affairs at the University of Missouri.
ST A T E M E N T O F I N D E P E N D E N C E
The Urban Institute strives to meet the highest standards of integrity and quality in its research and analyses and in
the evidence-based policy recommendations offered by its researchers and experts. We believe that operating
consistent with the values of independence, rigor, and transparency is essential to maintaining those standards. As
an organization, the Urban Institute does not take positions on issues, but it does empower and support its experts
in sharing their own evidence-based views and policy recommendations that have been shaped by scholarship.
Funders do not determine our research findings or the insights and recommendations of our experts. Urban
scholars and experts are expected to be objective and follow the evidence wherever it may lead.

2100 M Street NW
Washington, DC 20037
www.urban.org