Embed Size (px)
Citation preview

Doc.nr: Version: Classification: Page:
IMAGE-D4.5 2016.11.07 PU 1 of 15
Grant Agreement Number 608553
IMAGE Integrated Methods for Advanced Geothermal Exploration
IMAGE-D4.5: Tracers for Supercritical Conditions
Responsible author
Jiri Muller (IFE)
Responsible WP-leader
Gylfi Páll Hersir (ISOR)
Contributions by: Sissel Opsahl Viig (IFE) Per Arne Hubred (IFE) Øyvind Brandvoll (IFE) Odd Benny Haugen (IFE) Isabella Nardini (CNR) Jiri Muller (IFE)

Doc.nr: Version: Classification: Page:
IMAGE-D4.5 2016.11.07 PU 2 of 15
Introduction & summary This document describes “Tracers for supercritical conditions”. It consists of 2 parts. The first part deals with behaviour of Perfluorinated cyclic hydrocarbons (PFCs) tracers tested at supercritical conditions obtained from static and dynamic experiments performed at IFE. The second part consists of two reports describing field tests tracers studies at Krafla field performed in the summer 2016 by BRGM, CNR, ISOR and LV.
Doc.nr: Version: Classification: Page:
IMAGE-D4.5 2016.11.07 PU 3 of 15
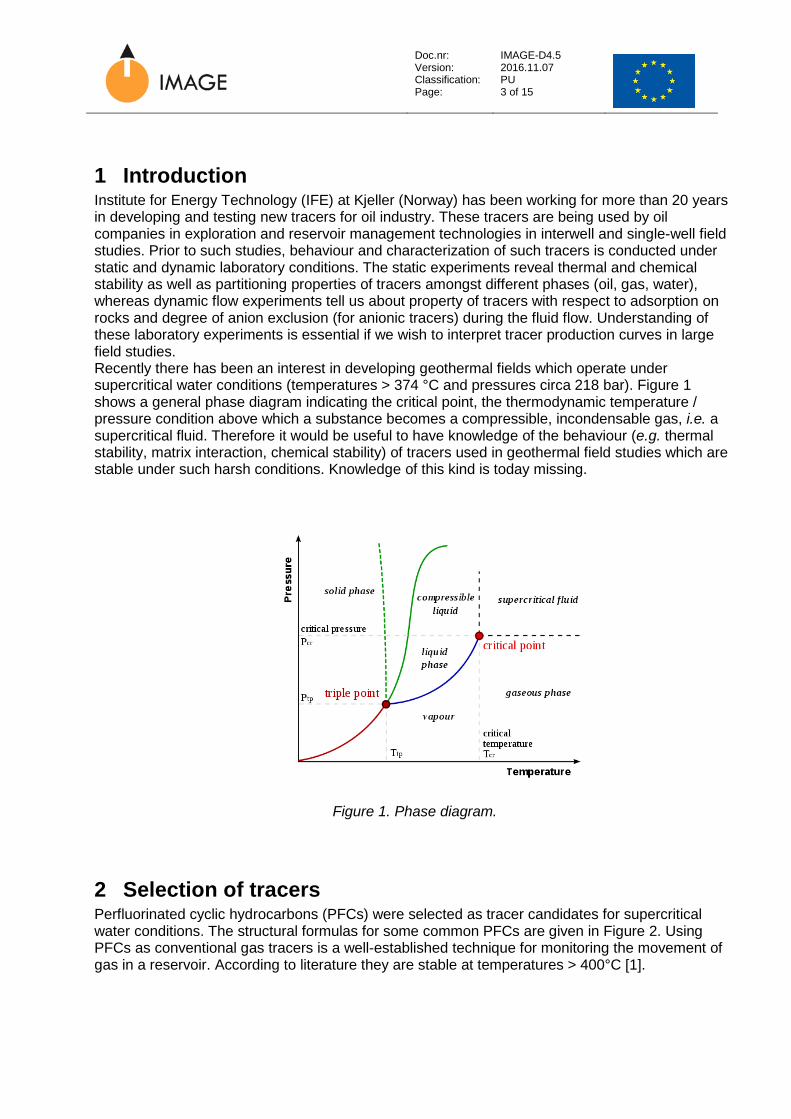
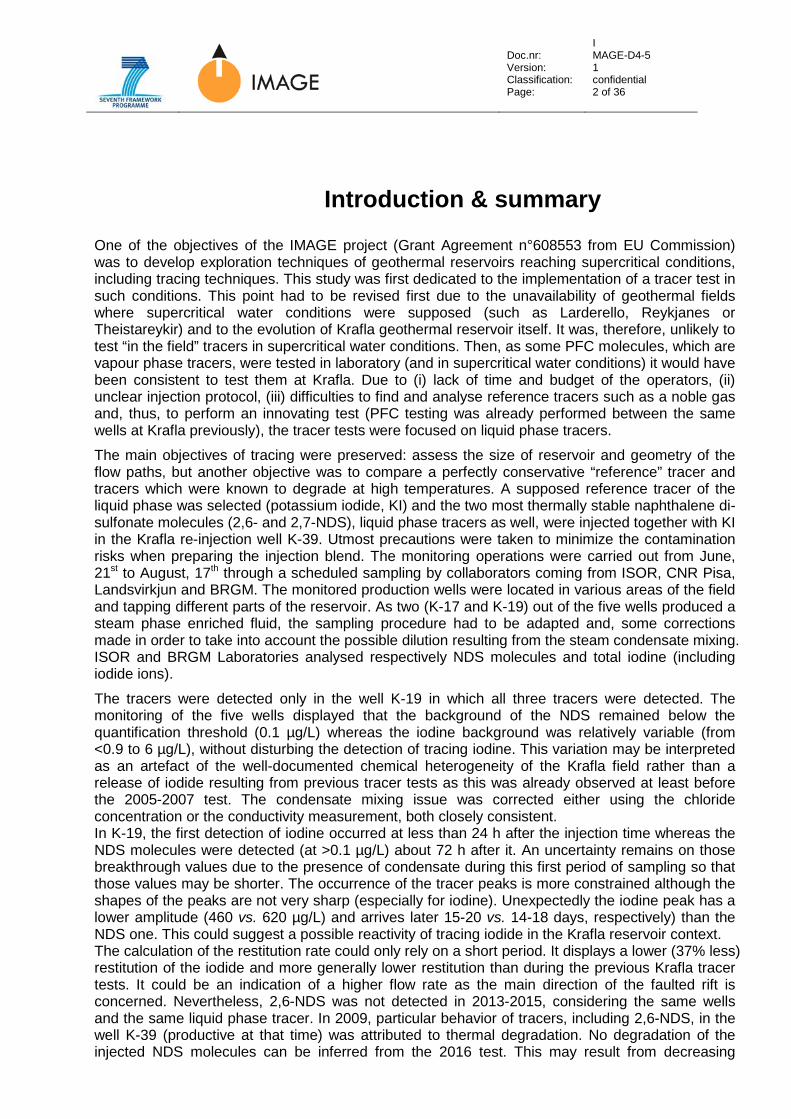
1 Introduction Institute for Energy Technology (IFE) at Kjeller (Norway) has been working for more than 20 years in developing and testing new tracers for oil industry. These tracers are being used by oil companies in exploration and reservoir management technologies in interwell and single-well field studies. Prior to such studies, behaviour and characterization of such tracers is conducted under static and dynamic laboratory conditions. The static experiments reveal thermal and chemical stability as well as partitioning properties of tracers amongst different phases (oil, gas, water), whereas dynamic flow experiments tell us about property of tracers with respect to adsorption on rocks and degree of anion exclusion (for anionic tracers) during the fluid flow. Understanding of these laboratory experiments is essential if we wish to interpret tracer production curves in large field studies. Recently there has been an interest in developing geothermal fields which operate under supercritical water conditions (temperatures > 374 °C and pressures circa 218 bar). Figure 1 shows a general phase diagram indicating the critical point, the thermodynamic temperature / pressure condition above which a substance becomes a compressible, incondensable gas, i.e. a supercritical fluid. Therefore it would be useful to have knowledge of the behaviour (e.g. thermal stability, matrix interaction, chemical stability) of tracers used in geothermal field studies which are stable under such harsh conditions. Knowledge of this kind is today missing.
Figure 1. Phase diagram.
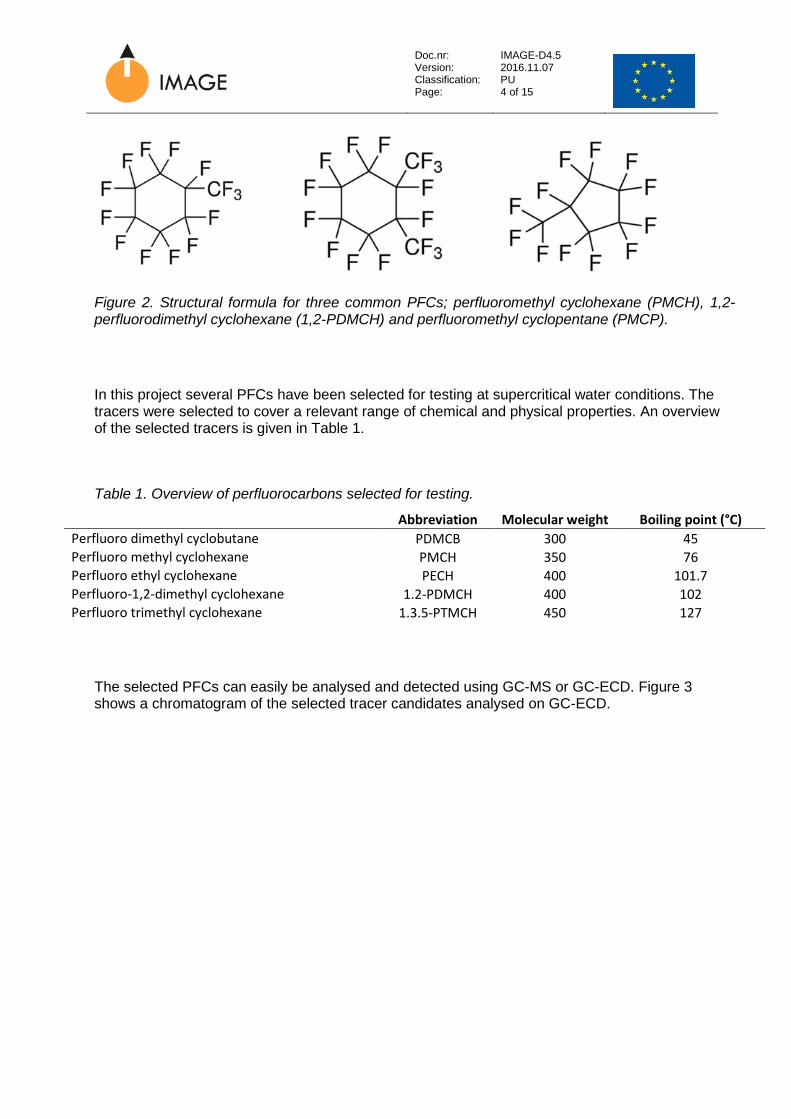
2 Selection of tracers Perfluorinated cyclic hydrocarbons (PFCs) were selected as tracer candidates for supercritical water conditions. The structural formulas for some common PFCs are given in Figure 2. Using PFCs as conventional gas tracers is a well-established technique for monitoring the movement of gas in a reservoir. According to literature they are stable at temperatures > 400°C [1].
Doc.nr: Version: Classification: Page:
IMAGE-D4.5 2016.11.07 PU 4 of 15
Figure 2. Structural formula for three common PFCs; perfluoromethyl cyclohexane (PMCH), 1,2-perfluorodimethyl cyclohexane (1,2-PDMCH) and perfluoromethyl cyclopentane (PMCP).
In this project several PFCs have been selected for testing at supercritical water conditions. The tracers were selected to cover a relevant range of chemical and physical properties. An overview of the selected tracers is given in Table 1.
Table 1. Overview of perfluorocarbons selected for testing.
Abbreviation Molecular weight Boiling point (°C) Perfluoro dimethyl cyclobutane PDMCB 300 45 Perfluoro methyl cyclohexane PMCH 350 76 Perfluoro ethyl cyclohexane PECH 400 101.7 Perfluoro-1,2-dimethyl cyclohexane 1.2-PDMCH 400 102 Perfluoro trimethyl cyclohexane 1.3.5-PTMCH 450 127
The selected PFCs can easily be analysed and detected using GC-MS or GC-ECD. Figure 3 shows a chromatogram of the selected tracer candidates analysed on GC-ECD.

Doc.nr: Version: Classification: Page:
IMAGE-D4.5 2016.11.07 PU 5 of 15
Figure 3. A chromatogram of a standard solution of the five selected PFCs.
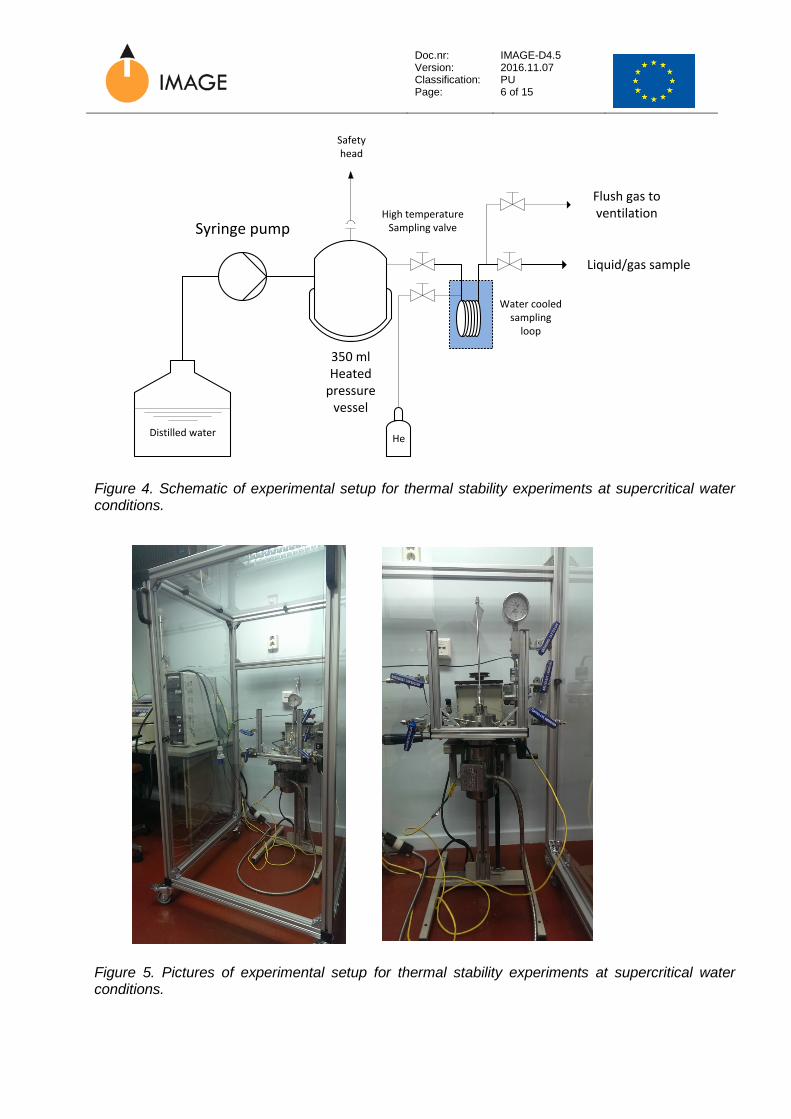
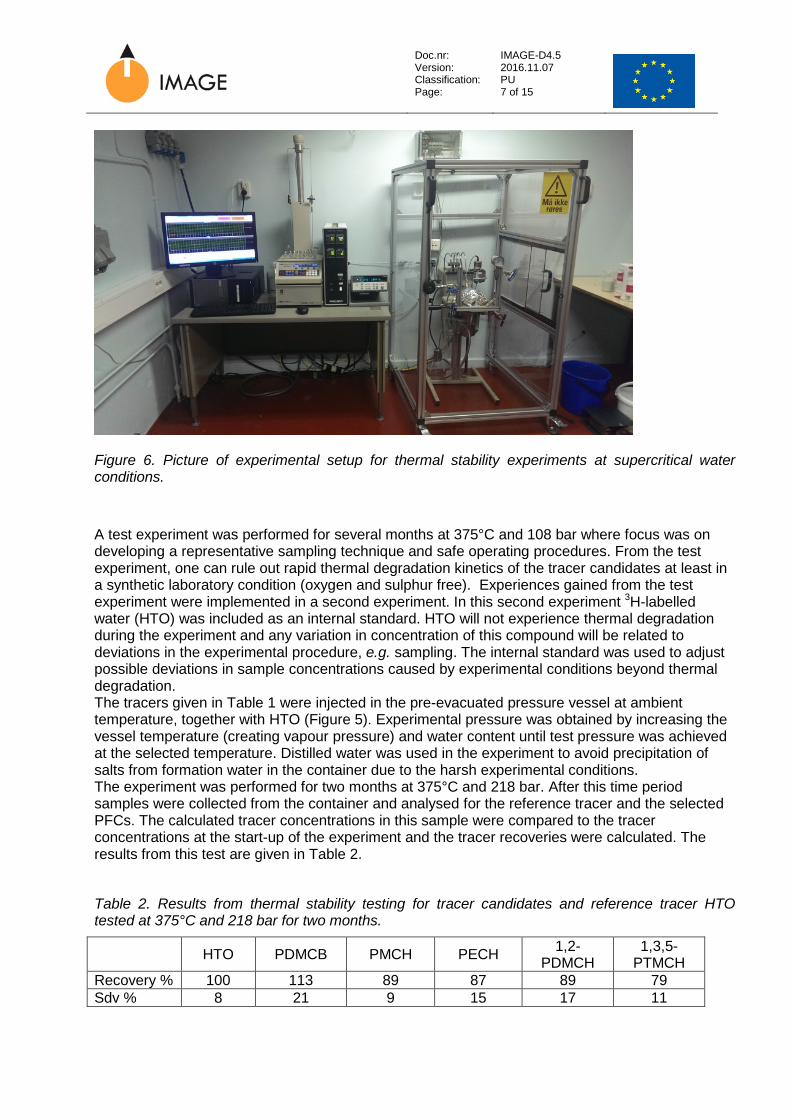
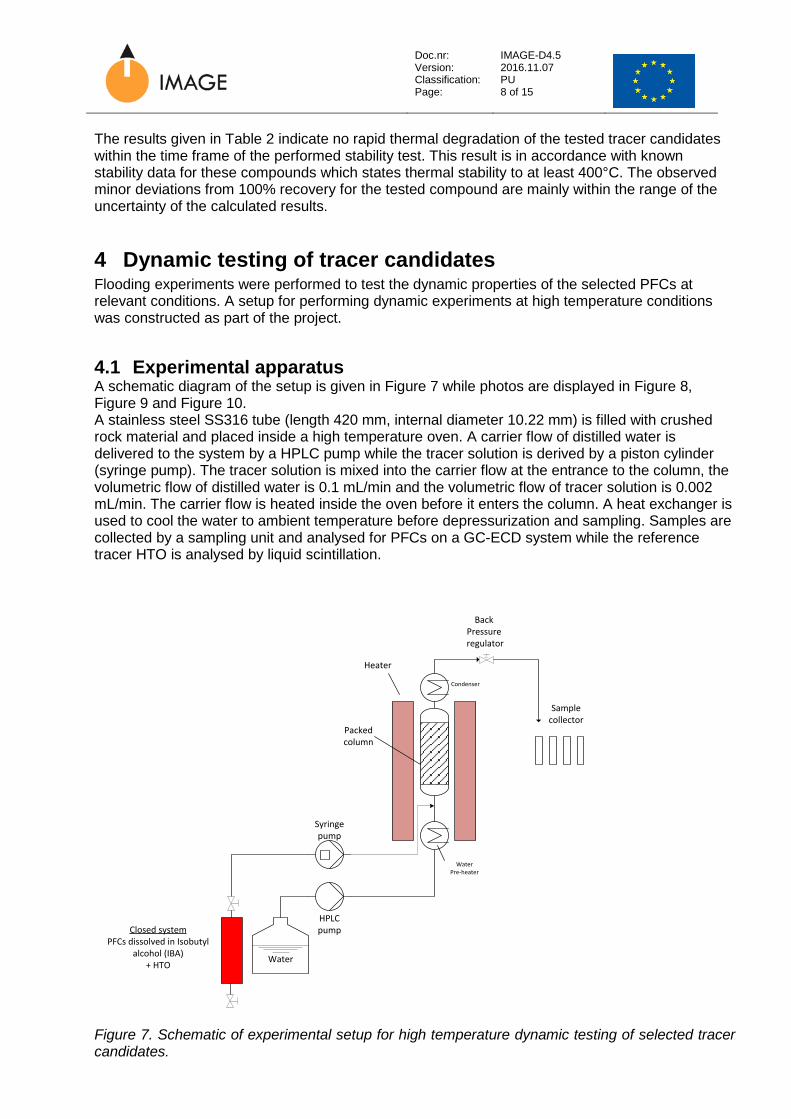
3 Thermal stability of tracer candidates Testing of tracers under supercritical conditions requires experimental set-up which tolerates harsh conditions with respect to high temperature and pressure (temperatures > 374 °C and pressures circa 218 bar). Therefore, an important part of the project has been dedicated to discussion of experimental concepts for laboratory testing at supercritical conditions, safety considerations (pressure vessel, shielding, ventilation, physical placement) and selection of equipment. A schematic sketch of the experimental setup constructed for testing of thermal stability of the tracer candidates is given in Figure 4, while Figure 5 and Figure 6 show pictures of this setup.
min1 1.5 2 2.5 3 3.5 4 4.5
Hz
0
5000
10000
15000
20000
25000
30000
35000
40000
ECD2 B, Back Signal (I:\TRACER\...KTMAPPER-FOU\PÅGÅENDE PROSJEKTER\IMAGE\DATAFILER\20150311A\ECD000002.D)
PDMCB PMCH PECH
1,2-PDMCH
1,3,5-PTMCH
Doc.nr: Version: Classification: Page:
IMAGE-D4.5 2016.11.07 PU 6 of 15
350 mlHeated
pressurevessel
Syringe pumpHigh temperature
Sampling valve
He
Liquid/gas sample
Flush gas toventilation
Water cooledsampling
loop
Distilled water
Safety head
Figure 4. Schematic of experimental setup for thermal stability experiments at supercritical water conditions.
Figure 5. Pictures of experimental setup for thermal stability experiments at supercritical water conditions.
Doc.nr: Version: Classification: Page:
IMAGE-D4.5 2016.11.07 PU 7 of 15
Figure 6. Picture of experimental setup for thermal stability experiments at supercritical water conditions.
A test experiment was performed for several months at 375°C and 108 bar where focus was on developing a representative sampling technique and safe operating procedures. From the test experiment, one can rule out rapid thermal degradation kinetics of the tracer candidates at least in a synthetic laboratory condition (oxygen and sulphur free). Experiences gained from the test experiment were implemented in a second experiment. In this second experiment 3H-labelled water (HTO) was included as an internal standard. HTO will not experience thermal degradation during the experiment and any variation in concentration of this compound will be related to deviations in the experimental procedure, e.g. sampling. The internal standard was used to adjust possible deviations in sample concentrations caused by experimental conditions beyond thermal degradation. The tracers given in Table 1 were injected in the pre-evacuated pressure vessel at ambient temperature, together with HTO (Figure 5). Experimental pressure was obtained by increasing the vessel temperature (creating vapour pressure) and water content until test pressure was achieved at the selected temperature. Distilled water was used in the experiment to avoid precipitation of salts from formation water in the container due to the harsh experimental conditions. The experiment was performed for two months at 375°C and 218 bar. After this time period samples were collected from the container and analysed for the reference tracer and the selected PFCs. The calculated tracer concentrations in this sample were compared to the tracer concentrations at the start-up of the experiment and the tracer recoveries were calculated. The results from this test are given in Table 2.
Table 2. Results from thermal stability testing for tracer candidates and reference tracer HTO tested at 375°C and 218 bar for two months.
HTO PDMCB PMCH PECH 1,2-PDMCH
1,3,5-PTMCH
Recovery % 100 113 89 87 89 79 Sdv % 8 21 9 15 17 11
Doc.nr: Version: Classification: Page:
IMAGE-D4.5 2016.11.07 PU 8 of 15
The results given in Table 2 indicate no rapid thermal degradation of the tested tracer candidates within the time frame of the performed stability test. This result is in accordance with known stability data for these compounds which states thermal stability to at least 400°C. The observed minor deviations from 100% recovery for the tested compound are mainly within the range of the uncertainty of the calculated results.
4 Dynamic testing of tracer candidates Flooding experiments were performed to test the dynamic properties of the selected PFCs at relevant conditions. A setup for performing dynamic experiments at high temperature conditions was constructed as part of the project.
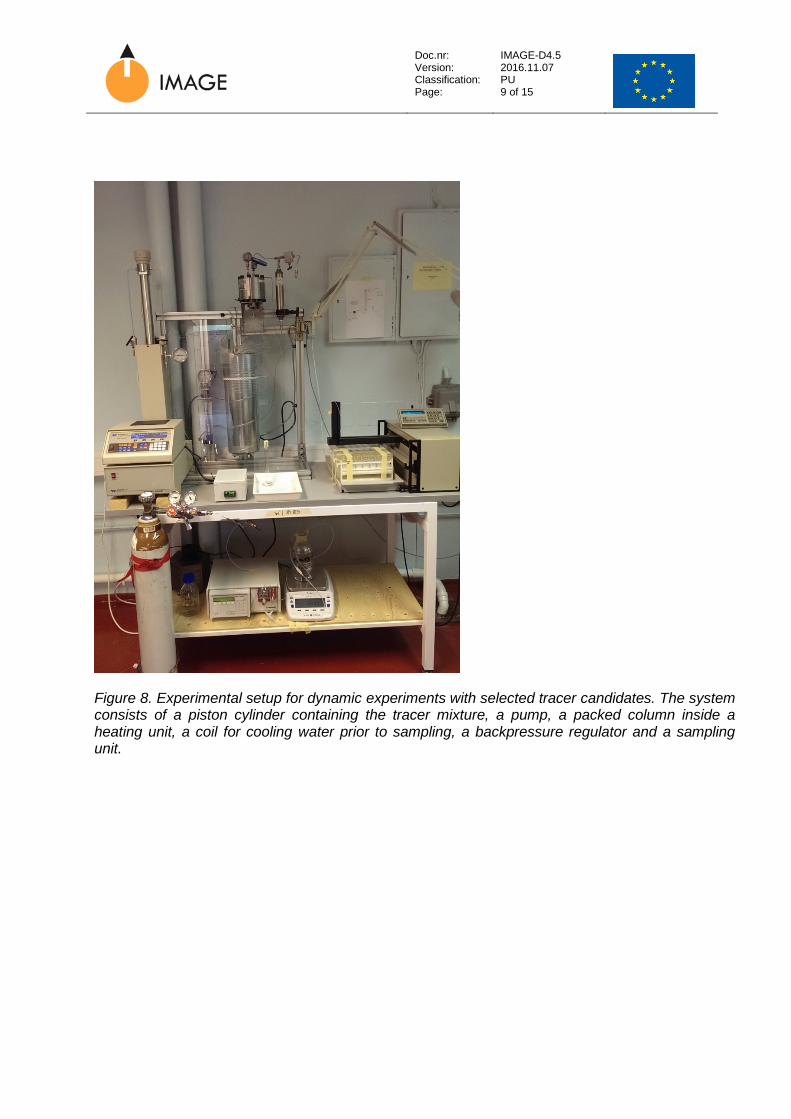
4.1 Experimental apparatus A schematic diagram of the setup is given in Figure 7 while photos are displayed in Figure 8, Figure 9 and Figure 10. A stainless steel SS316 tube (length 420 mm, internal diameter 10.22 mm) is filled with crushed rock material and placed inside a high temperature oven. A carrier flow of distilled water is delivered to the system by a HPLC pump while the tracer solution is derived by a piston cylinder (syringe pump). The tracer solution is mixed into the carrier flow at the entrance to the column, the volumetric flow of distilled water is 0.1 mL/min and the volumetric flow of tracer solution is 0.002 mL/min. The carrier flow is heated inside the oven before it enters the column. A heat exchanger is used to cool the water to ambient temperature before depressurization and sampling. Samples are collected by a sampling unit and analysed for PFCs on a GC-ECD system while the reference tracer HTO is analysed by liquid scintillation.
Figure 7. Schematic of experimental setup for high temperature dynamic testing of selected tracer candidates.
HPLCpump
Syringepump
Water
Heater
Back Pressure
regulator
Samplecollector
Closed systemPFCs dissolved in Isobutyl
alcohol (IBA)+ HTO
Packed column
WaterPre-heater
Condenser
Doc.nr: Version: Classification: Page:
IMAGE-D4.5 2016.11.07 PU 9 of 15
Figure 8. Experimental setup for dynamic experiments with selected tracer candidates. The system consists of a piston cylinder containing the tracer mixture, a pump, a packed column inside a heating unit, a coil for cooling water prior to sampling, a backpressure regulator and a sampling unit.
Doc.nr: Version: Classification: Page:
IMAGE-D4.5 2016.11.07 PU 10 of 15
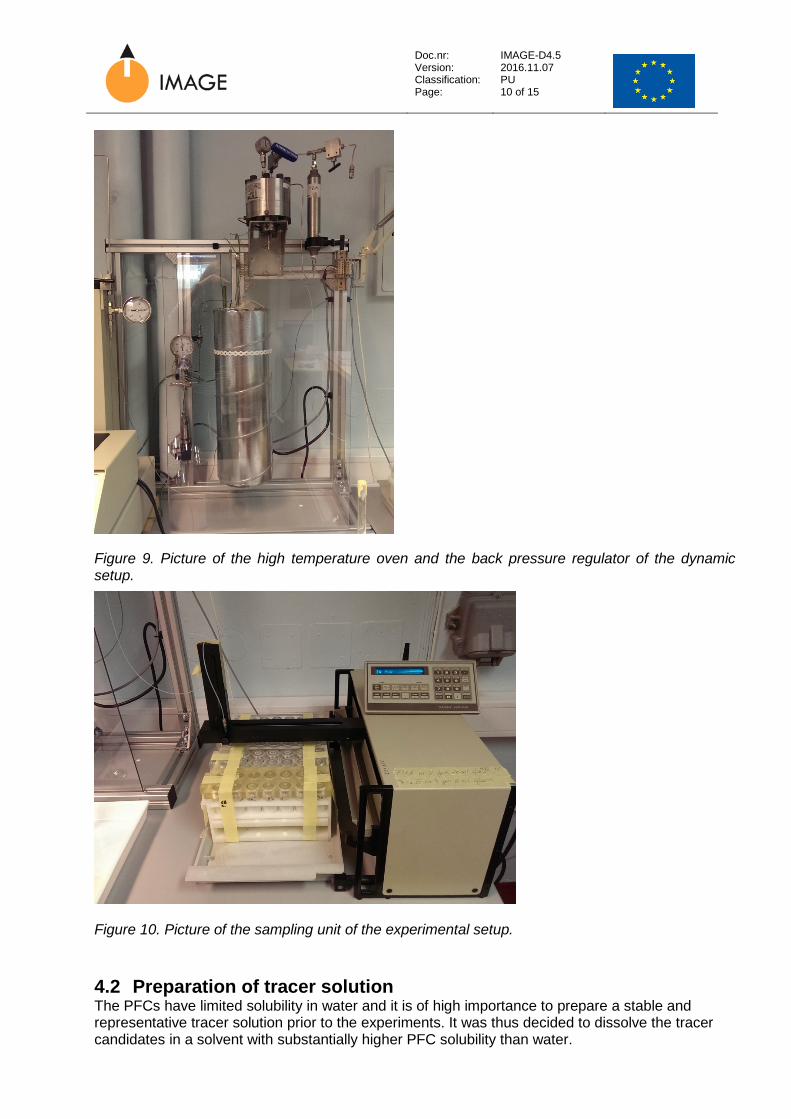
Figure 9. Picture of the high temperature oven and the back pressure regulator of the dynamic setup.
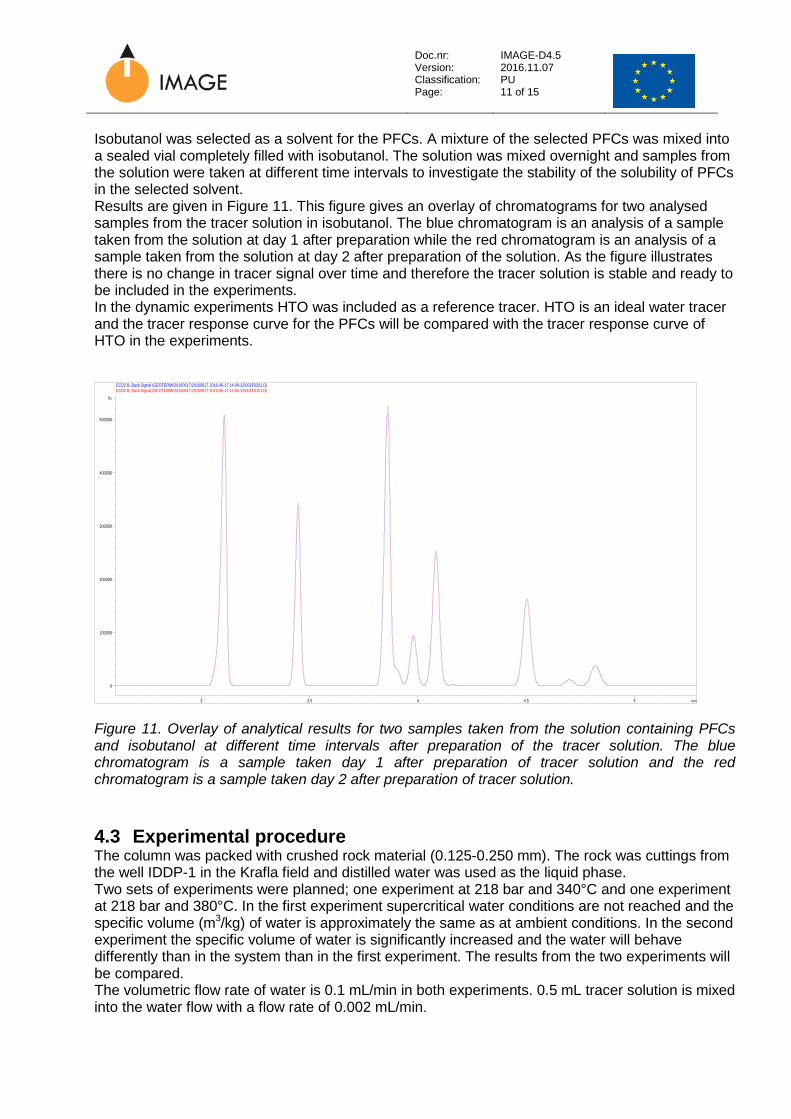
Figure 10. Picture of the sampling unit of the experimental setup.
4.2 Preparation of tracer solution The PFCs have limited solubility in water and it is of high importance to prepare a stable and representative tracer solution prior to the experiments. It was thus decided to dissolve the tracer candidates in a solvent with substantially higher PFC solubility than water.
Doc.nr: Version: Classification: Page:
IMAGE-D4.5 2016.11.07 PU 11 of 15
Isobutanol was selected as a solvent for the PFCs. A mixture of the selected PFCs was mixed into a sealed vial completely filled with isobutanol. The solution was mixed overnight and samples from the solution were taken at different time intervals to investigate the stability of the solubility of PFCs in the selected solvent. Results are given in Figure 11. This figure gives an overlay of chromatograms for two analysed samples from the tracer solution in isobutanol. The blue chromatogram is an analysis of a sample taken from the solution at day 1 after preparation while the red chromatogram is an analysis of a sample taken from the solution at day 2 after preparation of the solution. As the figure illustrates there is no change in tracer signal over time and therefore the tracer solution is stable and ready to be included in the experiments. In the dynamic experiments HTO was included as a reference tracer. HTO is an ideal water tracer and the tracer response curve for the PFCs will be compared with the tracer response curve of HTO in the experiments.
Figure 11. Overlay of analytical results for two samples taken from the solution containing PFCs and isobutanol at different time intervals after preparation of the tracer solution. The blue chromatogram is a sample taken day 1 after preparation of tracer solution and the red chromatogram is a sample taken day 2 after preparation of tracer solution.
4.3 Experimental procedure The column was packed with crushed rock material (0.125-0.250 mm). The rock was cuttings from the well IDDP-1 in the Krafla field and distilled water was used as the liquid phase. Two sets of experiments were planned; one experiment at 218 bar and 340°C and one experiment at 218 bar and 380°C. In the first experiment supercritical water conditions are not reached and the specific volume (m3/kg) of water is approximately the same as at ambient conditions. In the second experiment the specific volume of water is significantly increased and the water will behave differently than in the system than in the first experiment. The results from the two experiments will be compared. The volumetric flow rate of water is 0.1 mL/min in both experiments. 0.5 mL tracer solution is mixed into the water flow with a flow rate of 0.002 mL/min.
min3 3.5 4 4.5 5
Hz
0
100000
200000
300000
400000
500000
ECD2 B, Back Signal (GEOTERMI\20160617\20160617 2016-06-17 14-00-32\002F0201.D) ECD2 B, Back Signal (GEOTERMI\20160617\20160617 2016-06-17 14-00-32\001F0101.D)

Doc.nr: Version: Classification: Page:
IMAGE-D4.5 2016.11.07 PU 12 of 15
4.4 Experimental results The results from the experiment at 340°C and 218 bar are given in Figure 12. In this figure the tracer concentration for the reference tracer HTO and the PFCs are plotted as a function of eluted amount of water. It is shown that only the reference tracer HTO is detected in samples from this experiment.
Figure 12. Experimental results from dynamic experiment with HTO and PFCs at 340°C and 218 bar on a column packed with crushed stone from the Krafla field.
There might be several explanations to the fact that the tested PFCs are not detected in samples from the performed experiment. Several explanations can be proposed:
1) The tracer solution was not stable inside the piston cylinder used to introduce the tracer solution into the water flow.
2) The isobutanol solution containing PFC tracers is poorly miscible with water causing improper mixing of tracers into the water flow (however the reference tracer is detected in the samples).
3) The PFCs interact irreversibly with either the crushed rock material itself or compounds released from the rock material upon heating.
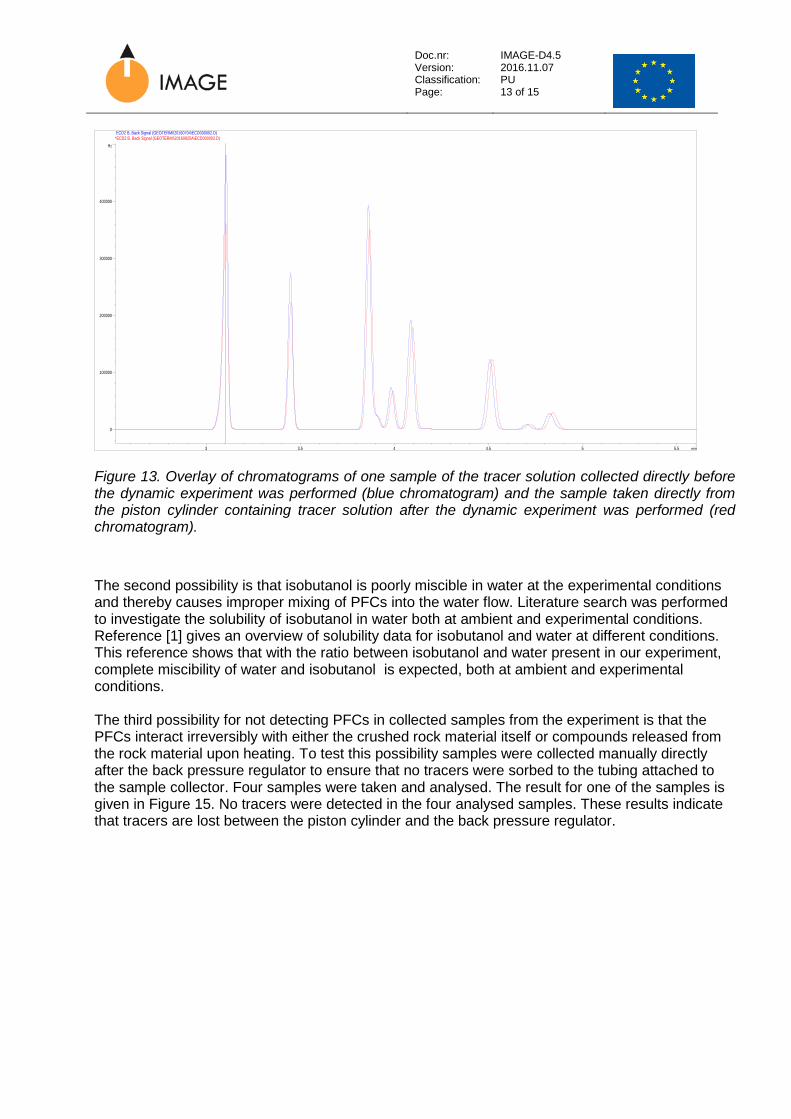
Several test experiments were performed to investigate the different possibilities. In the first experiment the stability of the tracer solution in the piston cylinder was examined. A sample of the tracer solution was collected directly from the outlet of the piston cylinder. The sample was analysed and compared with a sample taken from the cylinder before the start-up of the experiment at 340°C and 218 bar. An overlay of the chromatograms of both of the analysed samples is given in Figure 13. Only minor changes in the PFC concentrations are observed in the two samples. This minor difference cannot have induced the complete loss of PFCs in samples collected at the outlet of the sand packed column in the setup.
0
10000
20000
30000
40000
50000
60000
70000
80000
0
0,1
0,2
0,3
0,4
0,5
0,6
0,7
0,8
0,9
1
0 20 40 60 80 100
Con
cent
ratio
n H
TO (c
pm)
Con
cent
ratio
n PF
Cs
(µg/
L)
Eluted amounth H2O (g) PDMCB PMCH PECH 1.2-PDMCH 1.3.5-PTMCH HTO
Doc.nr: Version: Classification: Page:
IMAGE-D4.5 2016.11.07 PU 13 of 15
Figure 13. Overlay of chromatograms of one sample of the tracer solution collected directly before the dynamic experiment was performed (blue chromatogram) and the sample taken directly from the piston cylinder containing tracer solution after the dynamic experiment was performed (red chromatogram).
The second possibility is that isobutanol is poorly miscible in water at the experimental conditions and thereby causes improper mixing of PFCs into the water flow. Literature search was performed to investigate the solubility of isobutanol in water both at ambient and experimental conditions. Reference [1] gives an overview of solubility data for isobutanol and water at different conditions. This reference shows that with the ratio between isobutanol and water present in our experiment, complete miscibility of water and isobutanol is expected, both at ambient and experimental conditions. The third possibility for not detecting PFCs in collected samples from the experiment is that the PFCs interact irreversibly with either the crushed rock material itself or compounds released from the rock material upon heating. To test this possibility samples were collected manually directly after the back pressure regulator to ensure that no tracers were sorbed to the tubing attached to the sample collector. Four samples were taken and analysed. The result for one of the samples is given in Figure 15. No tracers were detected in the four analysed samples. These results indicate that tracers are lost between the piston cylinder and the back pressure regulator.
min3 3.5 4 4.5 5 5.5
Hz
0
100000
200000
300000
400000
ECD2 B, Back Signal (GEOTERMI\20160704\ECD000002.D)*ECD2 B, Back Signal (GEOTERMI\20160825A\ECD000002.D)
Doc.nr: Version: Classification: Page:
IMAGE-D4.5 2016.11.07 PU 14 of 15
Figure 14. Chromatogram of analysed sample collected directly from the back pressure regulator in experiment with experimental column packed with rock from the Krafla field.
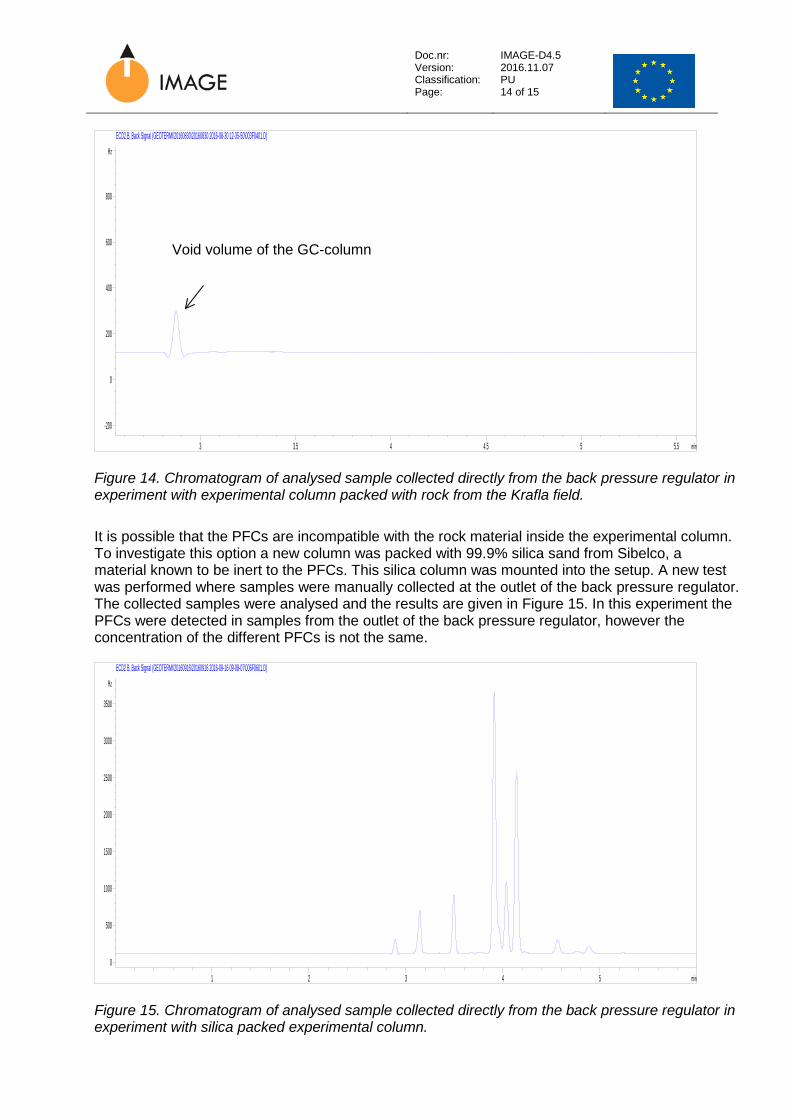
It is possible that the PFCs are incompatible with the rock material inside the experimental column. To investigate this option a new column was packed with 99.9% silica sand from Sibelco, a material known to be inert to the PFCs. This silica column was mounted into the setup. A new test was performed where samples were manually collected at the outlet of the back pressure regulator. The collected samples were analysed and the results are given in Figure 15. In this experiment the PFCs were detected in samples from the outlet of the back pressure regulator, however the concentration of the different PFCs is not the same.
Figure 15. Chromatogram of analysed sample collected directly from the back pressure regulator in experiment with silica packed experimental column.
min3 3.5 4 4.5 5 5.5
Hz
-200
0
200
400
600
800
ECD2 B, Back Signal (GEOTERMI\20160830\20160830 2016-08-30 12-35-50\003F0401.D)
min1 2 3 4 5
Hz
0
500
1000
1500
2000
2500
3000
3500
ECD2 B, Back Signal (GEOTERMI\20160916\20160916 2016-09-16 09-08-07\006F0601.D)
Void volume of the GC-column

Doc.nr: Version: Classification: Page:
IMAGE-D4.5 2016.11.07 PU 15 of 15
The testing performed with different packing materials in the experimental column indicates that there might be an interaction between the Iceland rock and the PFC tracer candidates. One hypothesis is that there can have been an interaction between the PFCs and sulphur present in the rock material. When flowing water through the column packed with rock from the well IDDP-1 at the Krafla field the water at the outlet of the column had a strong smell of sulphur. A possibility is the creation of SF6 inside the experimental column at the conditions of the experiments. However, this hypothesis will have to be further investigated to be able to draw any conclusions. PFCs have been included in field tests in geothermal reservoirs earlier and have been detected in production wells [3], however supercritical conditions were not reached during those tests.
5 Conclusions In this project we have built state-of-the-art equipment for combined high temperature and high pressure qualification of selected tracer candidates. Static stability testing indicates no rapid thermal degradation of the tested tracer candidates within the time frame of the performed stability test. This result is in accordance with known stability data for these compounds which states thermal stability to at least 400°C [1] at ambient pressure. In dynamic flooding experiments performed at 340°C and 218 bar on an experimental column packed with crushed rock from well IDDP-1 in the Krafla field the tracer candidates are not detected in samples from the outlet of the system, however the reference tracer HTO is detected in these samples. Extensive testing indicates that there might be interactions between the rock material and the tracer candidates. However, PFCs have been included in field tests in geothermal reservoirs earlier and have been detected in production wells [3], though supercritical conditions were not reached during those tests. This is largely due to the fact that the movement of tracers was dominated by flow through fractures. As our resources run out, we had to stop performing further experiments. Our conclusions from these limited experiments are following. If PFC tracers are going to be used in magmatic reservoirs such as Reykjanes of Krafla on Iceland, we have to have a greater knowledge on their behaviour at SC conditions This could be achieved by repeating static experiments for a longer period of time, including sorption investigations at different P and T and static tests with isobutanol - PFC blend. Furthermore we should perform systematic testing of flow performance of PFCs in order to understand their behaviour at different reservoir conditions (supercritical, superheated) with different rock materials and different fluid composition.
6 References [1] F2 Chemicals Ltd datasheet
[2] Solubility data series Volume 15, Alcohols with water, International Union of Pure and Applied Chemistry, Analytical Chemistry Division Commission on Solubility data.
[3] Juliusson E., Markusson S., Sigurdardottir A. (2015) Phase specific and phase-partitioning tracer experiment in the Krafla reservoir, Iceland. Proceedings World Geothermal Congress, Melbourne, Australia, 19-25 April 2015.

Doc.nr: Version: Classification: Page:
I MAGE-D4-5 1 confidential 1 of 36
Grant Agreement Number 608553
IMAGE Integrated Methods for Advanced Geothermal Exploration
IMAGE-D4.5: TRACERS TESTING AT KRAFLA HIGH TEMPERATURE GEOTHERMAL FIELD - JUNE 21ST – AUGUST 17TH 2016
Responsible SP2-leader: Gylfi Páll Hersir
ISOR (Iceland)
Responsible WP4-leader: Sæunn Halldórsdóttir
ISOR (Iceland)
Responsible author: Jiri Muller
IFE (Norway)
Contributions by: I. Nardini, A. Orlando, G.Ruggieri M.E. Ruben, E. Júlíusson R. St. Ásgeirsdóttir, S. R. Guðjónsdóttir, G. P. Hersir, F. Óskarsson, S. Halldórsdóttir, I. M. Gałeczka, E. I. Eyjólfsdóttir, S. I. Svavarsdóttir S. Opsahl Viig G. Braibant, E. Decouchon, A. Chevallier, T. Conte, K. Hadria, A. Gadalia
Name (Institution) CNR – Pisa (Italy) Landsvirkjun (Iceland) ISOR (Iceland) IFE (Norway) BRGM (France)
Doc.nr: Version: Classification: Page:
I MAGE-D4-5 1 confidential 2 of 36
Introduction & summary
One of the objectives of the IMAGE project (Grant Agreement n°608553 from EU Commission) was to develop exploration techniques of geothermal reservoirs reaching supercritical conditions, including tracing techniques. This study was first dedicated to the implementation of a tracer test in such conditions. This point had to be revised first due to the unavailability of geothermal fields where supercritical water conditions were supposed (such as Larderello, Reykjanes or Theistareykir) and to the evolution of Krafla geothermal reservoir itself. It was, therefore, unlikely to test “in the field” tracers in supercritical water conditions. Then, as some PFC molecules, which are vapour phase tracers, were tested in laboratory (and in supercritical water conditions) it would have been consistent to test them at Krafla. Due to (i) lack of time and budget of the operators, (ii) unclear injection protocol, (iii) difficulties to find and analyse reference tracers such as a noble gas and, thus, to perform an innovating test (PFC testing was already performed between the same wells at Krafla previously), the tracer tests were focused on liquid phase tracers.
The main objectives of tracing were preserved: assess the size of reservoir and geometry of the flow paths, but another objective was to compare a perfectly conservative “reference” tracer and tracers which were known to degrade at high temperatures. A supposed reference tracer of the liquid phase was selected (potassium iodide, KI) and the two most thermally stable naphthalene di-sulfonate molecules (2,6- and 2,7-NDS), liquid phase tracers as well, were injected together with KI in the Krafla re-injection well K-39. Utmost precautions were taken to minimize the contamination risks when preparing the injection blend. The monitoring operations were carried out from June, 21st to August, 17th through a scheduled sampling by collaborators coming from ISOR, CNR Pisa, Landsvirkjun and BRGM. The monitored production wells were located in various areas of the field and tapping different parts of the reservoir. As two (K-17 and K-19) out of the five wells produced a steam phase enriched fluid, the sampling procedure had to be adapted and, some corrections made in order to take into account the possible dilution resulting from the steam condensate mixing. ISOR and BRGM Laboratories analysed respectively NDS molecules and total iodine (including iodide ions).
The tracers were detected only in the well K-19 in which all three tracers were detected. The monitoring of the five wells displayed that the background of the NDS remained below the quantification threshold (0.1 µg/L) whereas the iodine background was relatively variable (from <0.9 to 6 µg/L), without disturbing the detection of tracing iodine. This variation may be interpreted as an artefact of the well-documented chemical heterogeneity of the Krafla field rather than a release of iodide resulting from previous tracer tests as this was already observed at least before the 2005-2007 test. The condensate mixing issue was corrected either using the chloride concentration or the conductivity measurement, both closely consistent. In K-19, the first detection of iodine occurred at less than 24 h after the injection time whereas the NDS molecules were detected (at >0.1 µg/L) about 72 h after it. An uncertainty remains on those breakthrough values due to the presence of condensate during this first period of sampling so that those values may be shorter. The occurrence of the tracer peaks is more constrained although the shapes of the peaks are not very sharp (especially for iodine). Unexpectedly the iodine peak has a lower amplitude (460 vs. 620 µg/L) and arrives later 15-20 vs. 14-18 days, respectively) than the NDS one. This could suggest a possible reactivity of tracing iodide in the Krafla reservoir context. The calculation of the restitution rate could only rely on a short period. It displays a lower (37% less) restitution of the iodide and more generally lower restitution than during the previous Krafla tracer tests. It could be an indication of a higher flow rate as the main direction of the faulted rift is concerned. Nevertheless, 2,6-NDS was not detected in 2013-2015, considering the same wells and the same liquid phase tracer. In 2009, particular behavior of tracers, including 2,6-NDS, in the well K-39 (productive at that time) was attributed to thermal degradation. No degradation of the injected NDS molecules can be inferred from the 2016 test. This may result from decreasing

Doc.nr: Version: Classification: Page:
I MAGE-D4-5 1 confidential 3 of 36
enthalpy of K-19 or the possible cooling of the K-39 part of the geothermal reservoir. Calculation of the apparent linear velocities (ALV) gives values of the same order than in the 2013-2015 test confirming a high flow rate within the Krafla geothermal reservoir. On a relatively short monitoring period, this tracer test brought information on tracers properties, on the evolution of the field conditions and on flow pathways.

Doc.nr: Version: Classification: Page:
I MAGE-D4-5 1 confidential 4 of 36
Table of Content
Introduction & summary ....................................................................................................... 2 Table of Content .................................................................................................................. 4 List of figures ....................................................................................................................... 4 List of Tables ....................................................................................................................... 5 List of appendices ................................................................................................................ 5 1. Introduction ................................................................................................................. 6
1.1 Aims of the W.P.4.5 in the IMAGE project .......................................................................... 6 1.2 Tracer field tests ................................................................................................................. 6 1.3 Tracers characteristics........................................................................................................ 7 1.4 Supercritical water conditions and current Krafla field ......................................................... 7 1.5 Previous tracer tests in Krafla ............................................................................................. 7
2. Selection of tracers .......................................................................................................... 8 2.1. Naphthalene sulfonates ...................................................................................................... 8 2.2. Potassium iodide ................................................................................................................ 9
3. Selection of injection and monitored wells ................................................................ 11 4. Tracers injection ....................................................................................................... 13
4.1. Mixing of the liquid phase tracers ..................................................................................... 13 4.2. Implementation of the mixing ............................................................................................ 13 4.3. Injection of the liquid phase tracers................................................................................... 13
5. Tracer sampling ........................................................................................................ 14 5.1. Schedule and Means ........................................................................................................ 14 5.2. Safety instructions ............................................................................................................ 15 5.3. Sampling method .............................................................................................................. 15 5.4. Tracer analysis ................................................................................................................. 17
6. Results and Interpretation ......................................................................................... 17 6.1. Program adaptations ........................................................................................................ 17 6.2. Correction process ........................................................................................................... 18 6.3. Wells without tracer return ................................................................................................ 19 6.4. Estimation of tracer background ....................................................................................... 23 6.5. Tracers return in well K-19 ................................................................................................ 24
7. Conclusions .............................................................................................................. 27 References ........................................................................................................................ 29
List of figures
Figure 1: Structural formula of 2,6-NDS (left) and 2,7-NDS (right) ................................................... 9 Figure 2: Iodide concentration monitored during the 2004-2007 tracer test ................................... 10 Figure 3: Map of Krafla indicating well tracks ................................................................................. 11 Figure 4: Cross section with injection and production wells in the Krafla 2016 tracer test .............. 12 Figure 5: Layout of the tracer injection skid. From Júlíusson et al. (2015)...................................... 14 Figure 6: Webre separator used to collect gas and liquid phase .................................................... 15 Figure 7: Sampling operation......................................................................................................... 16

Doc.nr: Version: Classification: Page:
I MAGE-D4-5 1 confidential 5 of 36
Figure 8: A comparison of Cl concentration and conductivity ......................................................... 18 Figure 9: Tracers restitution on well K-06 (uncorrected) ................................................................ 19 Figure 10: Iodine restitution on well K-06 (after correction) ............................................................ 19 Figure 11: Tracers restitution on well K-17 (uncorrected) .............................................................. 20 Figure 12: Iodine restitution on well K-17 (after correction) ............................................................ 20 Figure 13: Tracers restitution on well K-33 (uncorrected) .............................................................. 21 Figure 14: Iodine restitution on well K-33 (after correction) ............................................................ 21 Figure 15: Tracers restitution on well K-34 (uncorrected) .............................................................. 22 Figure 16: Iodine restitution on well K-33 (after correction) ............................................................ 22 Figure 17: Tracers restitution on well K-19 (uncorrected) .............................................................. 24 Figure 18: Tracers restitution on well K-19 (after correction) ......................................................... 25 Figure 19: Tracer (PMCH) returns in well K-19 from well K-39 ...................................................... 26 Figure 20: Layout of the tracers injection skid for 2013-2014 tests ................................................ 32
List of Tables
Table 1: Tracers injected into the wells selected in 2013-2015 tests................................................ 8 Table 2: Tracers injected quantity and level of purity ..................................................................... 10 Table 3: Tracers sampling schedule for the Krafla June-August 2016 tracer test........................... 14 Table 4: Comparison between tracers backgrounds and average values on the monitored wells .. 23 Table 5: Comparison of the apparent linear velocities (ALV) obtained during the last 3 tracer tests in Krafla ......................................................................................................................................... 27 Table 6: Interfering ions with Iodide specific electrode ................................................................... 33
List of appendices
Appendix 1: Gas phase tracers ..................................................................................................... 31 Appendix 2: Electrochemical analysis of iodide ............................................................................. 33 Appendix 3: Conductivity records .................................................................................................. 34
Doc.nr: Version: Classification: Page:
I MAGE-D4-5 1 confidential 6 of 36
1. Introduction
1.1 Aims of the W.P.4.5 in the IMAGE project The IMAGE project itself aims “to develop exploration techniques, to improve assessment of critical exploration parameters by data-acquisition and processing in:
- Passive and active seismic - Electro-magnetic methods - Temperature measurements, geo-thermometers and tracers” (DoW, 1.1. Concept and
objectives). “For magmatic systems, we, therefore need a) an improved understanding of the origin and preservation of supercritical conditions; b) to understand the processes determining the spatial scales of magma emplacement, in conjunction with structural controls; c) to improve our understanding of rock-fluid-fracture-stress interactions to predict fluid path ways and their control on reservoir temperature and quality” (DoW, 1.1. Concept and objectives). “IMAGE addresses development and characterization of geothermometers and tracers dedicated for the targets of the extended resource base. The lack of tracers that are stable under supercritical conditions in geothermal reservoirs, limits the use of tracer tests to detect the flow path of fluid within the roots of the high temperature systems. Such tracers are needed to assess the size of the reservoirs and geometry of the flow paths will be developed”. Task 4.5, “Tracer for supercritical conditions” aggregates IFE, ISOR, Landsvirkjun, CNR and BRGM aims to examine the behaviour of tracers, specifically developed and tested for supercritical water conditions both through laboratory experiments (static, dynamic) and field tests. Several geothermal fields may reach such conditions: Larderello, Reykjanes in SW-Iceland, Theistareykir in NE-Iceland and Krafla in NE-Iceland as well. The development of reliable tracers for supercritical water conditions would deliver useful tools for several geothermal areas that are greatly promising but could be better known.
1.2 Tracer field tests Tracer tests are routinely conducted in geothermal fields to map flow paths in the subsurface and the structure of the geothermal system. In such test an easily identifiable material is injected into the reinjection wells and the returns are monitored in the production wells over a period of several months. The results can be used to enhance the efficiency of energy extraction from the geothermal system and, thus, improve the economy of utilization of the resource and sustainability.
Tracer test data are classically used to improve geothermal resource management and operations: • If large portions of tracer return quickly to a production well, then the productivity of that well
is likely to decline quickly as a result of reinjection of cold water. • If only small amounts of the injected tracer are found in any of the production wells, then it
is relatively safe to use that well for reinjection of geothermal brine. The reinjection can then have positive impacts on production from the reservoir e.g. by maintaining pressure support and reducing the non-condensable gas fraction in the system.
• It may be possible to use the fraction of tracer recovered from superheated parts of the reservoir to estimate whether the reinjection water could neutralize the acidity of fluid in nearby production wells in Krafla.
In general, the tracer returns can give information about connectivity patterns that may add to the understanding of the geological and hydrological structure of the geothermal reservoir. Such information can be used to locate new production wells and refine reservoir modeling for a geothermal reservoir. Thus, the tracer test would in general have much practical value for future production plans and cost analysis for the geothermal areas.
Doc.nr: Version: Classification: Page:
I MAGE-D4-5 1 confidential 7 of 36
1.3 Tracers characteristics The requirements for using tracers adapted at high temperature conditions are generally the following: - environmentally safe, - thermally stable, - conservative (non-reactant, non-adsorptive compounds in the field conditions), - low cost (tracers themselves and their analyses), - easily soluble in hot water (or in another solvent that is, itself, soluble in water), - detectable at very low concentrations (< 5 ppb is generally recommended), - absent from the investigated geothermal fluids. Supercritical water conditions bring additional conditions that are supposed to demand the concentration of the tracers into the vapour phase. So, thermally stable vapour phase tracers as PFCs (perfluorinated cyclocarbons) or noble gases are supposed to better fit the supercritical water conditions.
1.4 Supercritical water conditions and current Krafla field Supercritical fluids have higher enthalpy than steam produced from two-phase systems. Large changes in physical properties (they have the density of a liquid and the viscosity of a gas) near the critical point can lead to extremely high flow rates, resulting in the projected ten-fold increase in turbine power production relative to conventional production (Elders et al., 2009). Although those conditions are one of the main new frontiers of geothermal, the classical geothermal tracer tools meet a thermal issue beyond 374°C and circa 218 bar (Muller, 2016). In 2012 the well IDDP-1 reached a temperature of 450°C during the drilling operations and, in 2008, a temperature of 385°C was recorded in well K-39 during a temperature logging (Juliusson et al., 2015). Nevertheless, those conditions are thought to be exceptional in Krafla. The part of the Krafla reservoir (liquid-dominated geothermal fluid) that will be tested is supposed to have temperatures not exceeding 300°C. Therefore, the liquid phase tracing remains of major importance at Krafla and although several tracer tests have been performed there, the combined use of a conservative tracer and potentially decomposing tracers, i.e. the injection into the same well and at the same time of a mixture of both types of tracer, was never attempted.
1.5 Previous tracer tests in Krafla Before starting a new tracer test it is necessary to know what were the quality and quantity of the injected compounds during the previous tests and to check the current baseline of new ones.
1.5.1. 1999-2000 liquid phase tracing (Axelsson, 2013) 200 kg of KI were injected in September 1999 into well K-22 in the Hvíthólar subfield; recovery rate reached 30% at well K-21 after 7 months of monitoring; the tracer peak was reached about 12 days after the injection.
1.5.2. 2005-2007 liquid phase tracing (Armannsson et al., 2009) 450 kg of KI were injected into K-26; as the monitoring lasted 21 months, a baseline (or locally a return) for iodide was obtained for each one of the 9 monitored wells; those baselines or returns lie between 1 and 15 ppb (including disordered values between 7.5 and 20 ppb for K-33 and values from 4 to 7.5 ppb for K-34) but no clear restitution peak could be observed. It may be assumed that some of the elevated values e.g. in K-33 may be due to injection.
1.5.3. 2009 liquid phase tracing (Asmundsson et al., 2014) For the first time organic poly-aromatic molecules were tested in Krafla as liquid phase tracers. 100 kg of 1,5-NDS (di-sodium naphthalene di-sulfonate) and 100 kg of 2,6-NDS were injected into well K-26 and 100 kg of 1,6-NDS in well IDDP-1; tracers injected from K-26 were first detected in wells K-15 and K-37 between 5h35 and 50h after injection and tracer peak after 50 to 70h (mainly on an E-W connection) giving an apparent linear velocity between 10 and 14 m/h. The restitution rate did
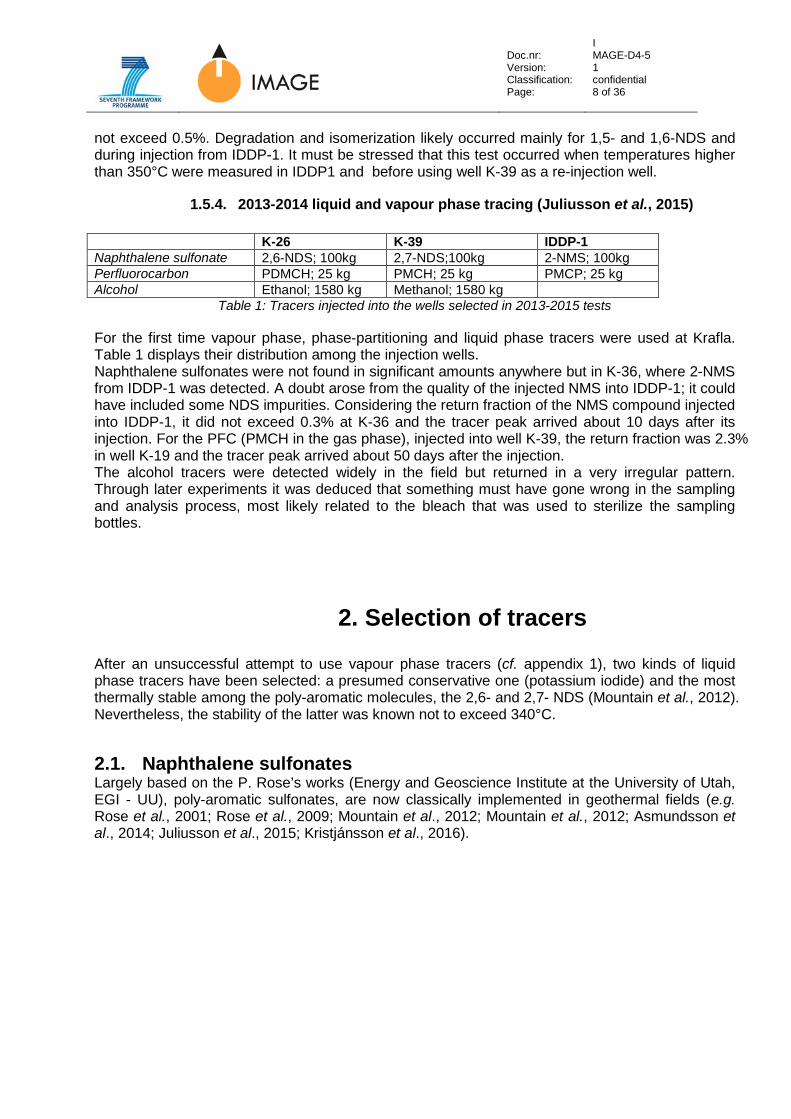
Doc.nr: Version: Classification: Page:
I MAGE-D4-5 1 confidential 8 of 36
not exceed 0.5%. Degradation and isomerization likely occurred mainly for 1,5- and 1,6-NDS and during injection from IDDP-1. It must be stressed that this test occurred when temperatures higher than 350°C were measured in IDDP1 and before using well K-39 as a re-injection well.
1.5.4. 2013-2014 liquid and vapour phase tracing (Juliusson et al., 2015) K-26 K-39 IDDP-1 Naphthalene sulfonate 2,6-NDS; 100kg 2,7-NDS;100kg 2-NMS; 100kg Perfluorocarbon PDMCH; 25 kg PMCH; 25 kg PMCP; 25 kg Alcohol Ethanol; 1580 kg Methanol; 1580 kg
Table 1: Tracers injected into the wells selected in 2013-2015 tests
For the first time vapour phase, phase-partitioning and liquid phase tracers were used at Krafla. Table 1 displays their distribution among the injection wells. Naphthalene sulfonates were not found in significant amounts anywhere but in K-36, where 2-NMS from IDDP-1 was detected. A doubt arose from the quality of the injected NMS into IDDP-1; it could have included some NDS impurities. Considering the return fraction of the NMS compound injected into IDDP-1, it did not exceed 0.3% at K-36 and the tracer peak arrived about 10 days after its injection. For the PFC (PMCH in the gas phase), injected into well K-39, the return fraction was 2.3% in well K-19 and the tracer peak arrived about 50 days after the injection. The alcohol tracers were detected widely in the field but returned in a very irregular pattern. Through later experiments it was deduced that something must have gone wrong in the sampling and analysis process, most likely related to the bleach that was used to sterilize the sampling bottles.
2. Selection of tracers
After an unsuccessful attempt to use vapour phase tracers (cf. appendix 1), two kinds of liquid phase tracers have been selected: a presumed conservative one (potassium iodide) and the most thermally stable among the poly-aromatic molecules, the 2,6- and 2,7- NDS (Mountain et al., 2012). Nevertheless, the stability of the latter was known not to exceed 340°C.
2.1. Naphthalene sulfonates Largely based on the P. Rose’s works (Energy and Geoscience Institute at the University of Utah, EGI - UU), poly-aromatic sulfonates, are now classically implemented in geothermal fields (e.g. Rose et al., 2001; Rose et al., 2009; Mountain et al., 2012; Mountain et al., 2012; Asmundsson et al., 2014; Juliusson et al., 2015; Kristjánsson et al., 2016).
Doc.nr: Version: Classification: Page:
I MAGE-D4-5 1 confidential 9 of 36
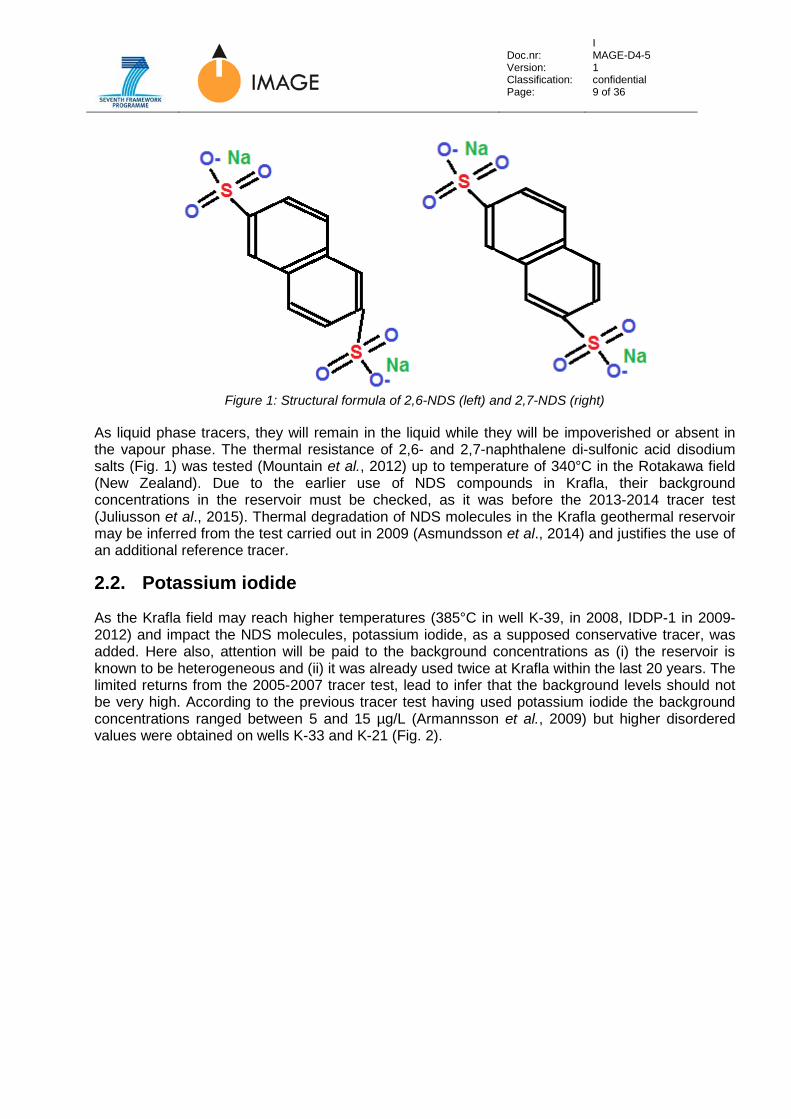
Figure 1: Structural formula of 2,6-NDS (left) and 2,7-NDS (right)
As liquid phase tracers, they will remain in the liquid while they will be impoverished or absent in the vapour phase. The thermal resistance of 2,6- and 2,7-naphthalene di-sulfonic acid disodium salts (Fig. 1) was tested (Mountain et al., 2012) up to temperature of 340°C in the Rotakawa field (New Zealand). Due to the earlier use of NDS compounds in Krafla, their background concentrations in the reservoir must be checked, as it was before the 2013-2014 tracer test (Juliusson et al., 2015). Thermal degradation of NDS molecules in the Krafla geothermal reservoir may be inferred from the test carried out in 2009 (Asmundsson et al., 2014) and justifies the use of an additional reference tracer.
2.2. Potassium iodide
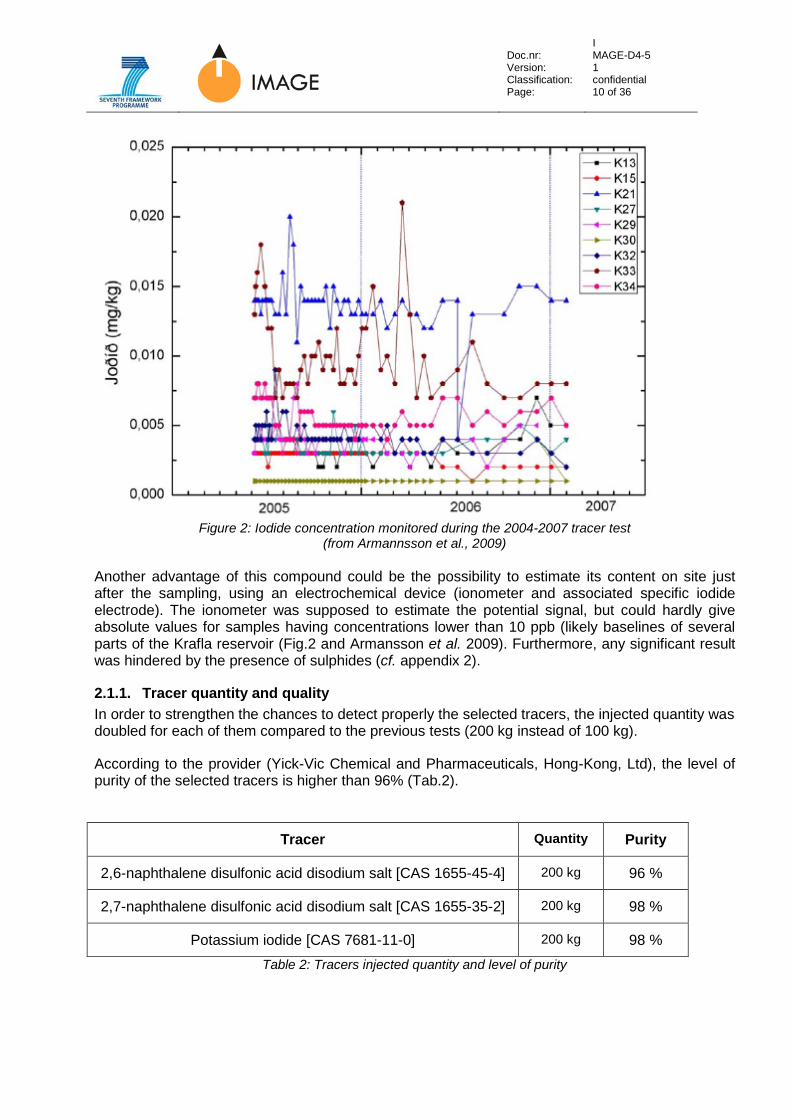
As the Krafla field may reach higher temperatures (385°C in well K-39, in 2008, IDDP-1 in 2009-2012) and impact the NDS molecules, potassium iodide, as a supposed conservative tracer, was added. Here also, attention will be paid to the background concentrations as (i) the reservoir is known to be heterogeneous and (ii) it was already used twice at Krafla within the last 20 years. The limited returns from the 2005-2007 tracer test, lead to infer that the background levels should not be very high. According to the previous tracer test having used potassium iodide the background concentrations ranged between 5 and 15 µg/L (Armannsson et al., 2009) but higher disordered values were obtained on wells K-33 and K-21 (Fig. 2).
Doc.nr: Version: Classification: Page:
I MAGE-D4-5 1 confidential 10 of 36
Figure 2: Iodide concentration monitored during the 2004-2007 tracer test
(from Armannsson et al., 2009) Another advantage of this compound could be the possibility to estimate its content on site just after the sampling, using an electrochemical device (ionometer and associated specific iodide electrode). The ionometer was supposed to estimate the potential signal, but could hardly give absolute values for samples having concentrations lower than 10 ppb (likely baselines of several parts of the Krafla reservoir (Fig.2 and Armansson et al. 2009). Furthermore, any significant result was hindered by the presence of sulphides (cf. appendix 2).
2.1.1. Tracer quantity and quality In order to strengthen the chances to detect properly the selected tracers, the injected quantity was doubled for each of them compared to the previous tests (200 kg instead of 100 kg).
According to the provider (Yick-Vic Chemical and Pharmaceuticals, Hong-Kong, Ltd), the level of purity of the selected tracers is higher than 96% (Tab.2).
Tracer Quantity Purity
2,6-naphthalene disulfonic acid disodium salt [CAS 1655-45-4] 200 kg 96 %
2,7-naphthalene disulfonic acid disodium salt [CAS 1655-35-2] 200 kg 98 %
Potassium iodide [CAS 7681-11-0] 200 kg 98 % Table 2: Tracers injected quantity and level of purity

Doc.nr: Version: Classification: Page:
I MAGE-D4-5 1 confidential 11 of 36
3. Selection of injection and monitored wells
Well K-39 was selected as the injection well. It was drilled in 2008 from Leirbotnar to the ESE and the bottom of which reaches the Suðurhlíðar area basement (Figure 3). Its initial depth was 2848 m, but a 240 m cement plug was placed in the bottom as it was believed to have hit a magma body. The initial temperature of the well, before plugging, exceeded 350°C but now the temperature of the well has significantly decreased as water at 126°C has been injected for several years.
Figure 3: Map of Krafla indicating well tracks
Wells location and feed zones as red dots (from Juliusson et al., 2015); selected injection and monitoring wells are surrounded in blue and red, respectively.

Doc.nr: Version: Classification: Page:
I MAGE-D4-5 1 confidential 12 of 36
Figure 4: Cross section with injection and production wells in the Krafla 2016 tracer test
The injection well was K-39 and the wells K-06, K-17, K-19, K-33 and K-34 are the sampling wells. Main feed zones are illustrated with red dots. Well casings are shown with grey boxes (from Juliusson et al., 2015).
The wells to be monitored were selected according to two main criteria: (i) their lower enthalpy in order to get a predominant liquid phase as only liquid tracers are
monitored; (ii) a wide geographical range to get a maximum of information on the path followed by the tracers.
K-39 crosses 3 feed zones: -800m, -1000m and -1320m. Among the nearest well feed zones from K-39 the following ones are found, according to the figure 4:
• K-06 (Leirbotnar area, enthalpy ~1100 kJ/kg), feed zone at about -1060m; • K-17 (Suðurhlíðar area, enthalpy ~2400 kJ/kg), feed zone at -500m; • K-19 (Suðurhlíðar area, enthalpy ~1700 kJ/kg), feed zone at -980m; • K-33 (Vesturhlíðar area, enthalpy ~2300 kJ/kg), feed zones at -820m and -1280m; • K-34 (Vesturhlíðar area, enthalpy ~2500 kJ/kg), feed zones at -1200 and -1360m.
Four out of the five selected wells (K-17, K-19, K-33, K-34) have excess enthalpy (Weisenberger et al., 2015), i.e. higher enthalpy than what corresponds to saturated liquid enthalpy at the reservoir temperature and therefore produce vapour-rich fluids (vapour fraction at sampling higher than 50%).
Doc.nr: Version: Classification: Page:
I MAGE-D4-5 1 confidential 13 of 36
4. Tracers injection
The injection used the Landsvirkjun equipment (injection skid, pump, etc…) which was also used during the tracer test in 2013-2014.
4.1. Mixing of the liquid phase tracers
In 2009, the laboratory solubility test at the room temperature gave 55.5 g/L for the 2,6-NDS. This would have required a 3,600 L tank to dissolve 200 kg of 2,6-NDS at 15-20°C. In the previous 2013-2014 test, a tank of 1,000 L was sufficient for 100 kg of 2,6-NDS and the same volume for 2,7-NDS with a dissolution at 10°C, 4 weeks before the injection. Nevertheless the blend was not analysed prior to injection and it could not be checked whether all the amount of tracer dissolved or not. As the solubility of NDS increases with temperature, it was recommended to use hot water (heated groundwater from the nearby Reykjahlíð district heating service) to increase the chance of a complete dissolution. The dissolution of KI is highly endothermic and, thus, it was recommended to dissolve KI after both the NDS compounds had been dissolved. Utmost precautions were taken in order to minimize the contamination risks. The general policy in Icelandic tracer testing is that the people who carry out the tracer mixing and injection should not be involved in sampling and/or analysis of the tracers. Contacts between mixing/injection people and sampling/analyzing people should be avoided as well.
4.2. Implementation of the mixing The mixing and injection operation were performed by Gylfi Páll Hersir (ISOR Reykjavik), and Arnar Már Vilhjálmsson (ISOR Akureyri) and described in a separate report (Hersir and Vilhjálmsson, 2016). Mixing took place on June 21st, in the nearby Bjarnarflag facilities (several km from Krafla). Both operations (mixing and injection) followed instructions from BRGM, after discussion with ISOR and LV personnel. The operators used disposable suits and gloves, boots being carefully cleaned after injection. Drums of liquid tracers (NDS and KI) were carefully opened above both the mixing tanks. First, 100 kg of 2,6-NDS and 100 kg of 2,7-NDS were dissolved in each 2,500 L tank containing hot tap water (>70°C). Then 100 kg of potassium iodide were dissolved into each of the same 2,500 L tanks. A paint electric stirrer was used to facilitate the mixing. The mixing, as a whole, lasted from 15:00 to 18:00. All the waste (disposal suits and gloves, drums) were packed into plastic waste bags. The trailer and outside of the tanks were thoroughly cleaned with water before leaving the mixing site. Then both the 2,500 L tracers blend tanks were moved near well K-39 together with two other 1,000 L tanks of tap water: one for a first injection volume to check if everything works well, another to clean the facilities which were used for the injection (tanks, pipes, pumps, valves) and to rinse down possible remaining tracer solids.
4.3. Injection of the liquid phase tracers The same injection skid (fig.5) as in 2013 Landsvirkjun testing was used albeit restricted to liquid tracers: they were injected from both the 2,500 L tanks through a centrifugal pump (Movitec, type: VSF6/26 bar). Injection of the liquid tracers blend started at 19:18 after an injection of 1,000 L of tap water. It ended at 20:22, i.e. 1 hour and 6 minutes later after injecting 5,085.4 L of tracer mix. The cleaning of the tanks, pipes, pumps, valves, followed with 1,500 L of tap water that were injected as well into well K-39. The operation was completed at 21:30.
Doc.nr: Version: Classification: Page:
I MAGE-D4-5 1 confidential 14 of 36
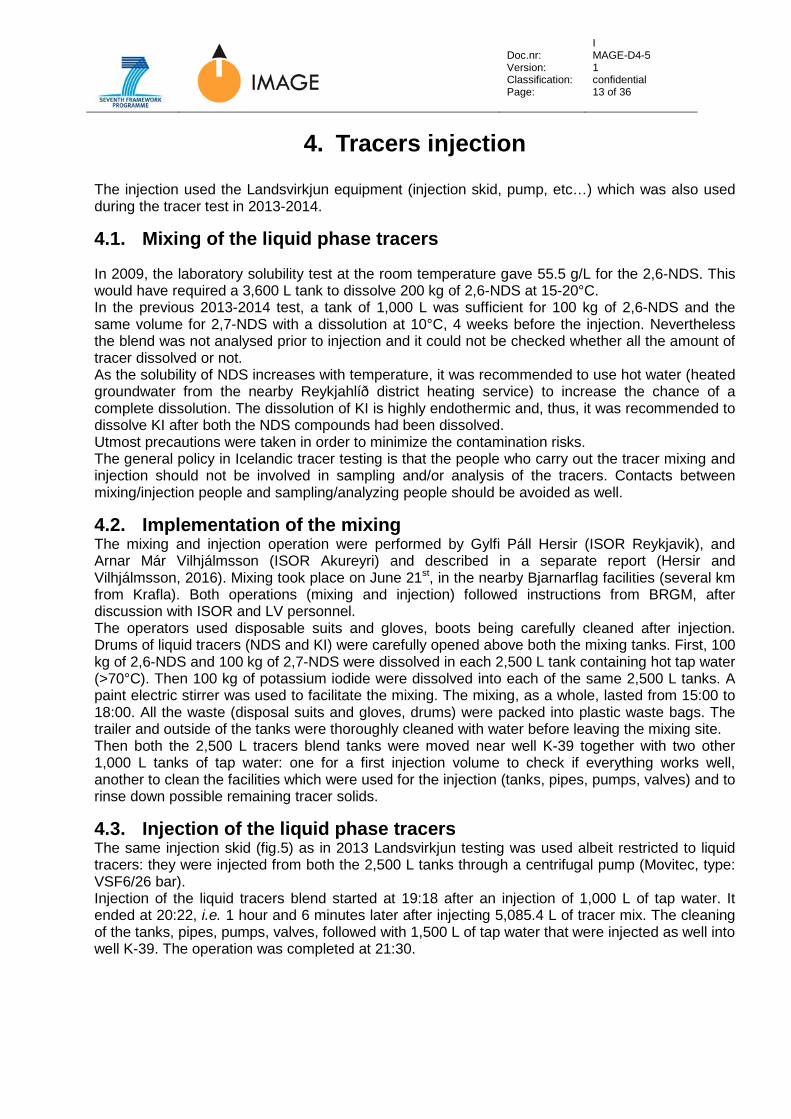
Figure 5: Layout of the tracer injection skid. From Júlíusson et al. (2015).
5. Tracer sampling
5.1. Schedule and Means The sampling consists of collecting liquid phase from 5 production wells: K-06, K17, K-19, K-33 and K-34 at a frequency lowering with time (Tab.3).
Sampling period Sampling rate Number of wells
Total water samples/period
Before injection 1 sample/well/day 5 5
Week 1 (from injection)
4 samples/well/day (1 days) + 3
samples/well/day (3 days) + 2
samples/well/day (3 days)
5 95
Week 2 2 samples/well/day (4
days)+1 sample/well/day (3 days)
5 55
Week 3 ≈1 sample/well/day 5 30 Weeks 4-5-6-7 ≈3 samples /well/week 5 65
Week 8 1 sample/well/week 5 20 Total samples 270
Table 3: Tracers sampling schedule for the Krafla June-August 2016 tracer test. The two-phase fluid is separated using a portable, custom made Webre separator (Arnorsson, 2006; Fig. 6) connected to sampling valves at the well head. The liquid and the vapour phases can then be sampled separately. A cooling system is installed downstream of the separator made of a metallic pipe twisted in spiral and immersed in a 200 L barrel of water (Fig.7). An exhaust hose was added to evacuate the vapour phase from the separator and to prevent H2S accumulation into the well head cabin.

Doc.nr: Version: Classification: Page:
I MAGE-D4-5 1 confidential 15 of 36
Figure 6: Webre separator used to collect gas and liquid phase
The samples are eventually collected into two 60 mL HDPE bottles according to standard geothermal sampling methods. They are sent to the laboratories for analysis (2,6-NDS + 2,7-NDS to the ISOR lab and KI to BRGM’s). Prior to injection of tracers, some samples were collected in order to estimate the baseline level of each tracer in the geothermal fluid, including the fluid injected into K-39 after passing the plant process. The sampling schedule is shown in table 3. It took about 1h45 for 2 persons to collect samples from the 5 selected wells (on a 13 km circuit). Additional time is required for measuring the conductivity, storing, packaging and shipping the HDPE bottles to both ISOR and BRGM laboratories. This additional time is estimated about 1 hour for 8 samples.
5.2. Safety instructions In the context of Krafla geothermal well heads, it is necessary to follow safety rules to minimize risks due to the hot well head facilities, hot steam and toxic H2S. They included the use of safety clothes (safety helmet, protective gloves, glasses, shoes, water proof clothing reflective vest and hearing protection headset). It is also mandatory to sample in pairs at the well head. One person being outside the shelter igloo-shaped covering the well head, when the second one is inside (at least while checking the H2S concentration). The detector (H2S - CO - O2) must be systematically charged, switched on and equilibrated before entering the well head shelter and during all the sampling operation.
5.3. Sampling method The Krafla geothermal wells tap geothermal reservoirs with different steam/liquid ratios. The June-August 2016 tracer test was focused on liquid phase tracers. The main issues when sampling would be thus (i) as in every tracer test monitoring, to avoid cross contamination from the previous sampling (need for a comprehensive rinsing of the sampling tools before and after sampling); (ii) to preserve the steam/liquid ratio of the well (need for a complete opening of the valve connecting the well head to the separator) and (iii) to prevent the introduction of vapour phase into the sample

Doc.nr: Version: Classification: Page:
I MAGE-D4-5 1 confidential 16 of 36
(need for a total elimination of the steam through the separator and to an appropriate cooling and flow rate of the liquid phase). During the first part of the tests (before the 1st of July) the sampling procedure missed the opening of the steam valve leading to some contamination by the condensate in the well fluids enriched in steam phase (wells K-17, K-19, K-33, K-34). Following ISOR’s advices, a more reliable procedure was followed from July, 1st. The following steps were then followed:
1 switch the gas detector on and wait for its equilibration in the atmosphere; 2 open both the doors of the shelter for a maximum ventilation and place the gas detector
inside; 3 turn the main valve connecting the separator to the well head (n°1, fig.6) completely on in
order not to alter the liquid/steam ratio in the separator from what it is in the well. Then turn the screw valve(s) near the bottom of the separator on (n°2, fig.6);
4 turn fully on the steam valve on the separator: ball valve at the bottom (n°2, fig.6) and needle valve (n°3, fig.6) to exhaust hose to ensure good separation and avoid the sampling of steam condensate; turning the valve(s) on must be careful to avoid possible steam blow at the pipe end and burning at the well head contact;
5 turn the water sampling ball valve on the separator (not fully) on (n°4, fig.6) to start rinsing the sampling line and cooling spiral;
6 record the time of opening the valves and the time of sampling (≈10’ later); 7 10 minutes after purging the sampling system, open the water barrel, immerse the spiral
pipe into the water to cool the fluid and get some liquid; 8 after 30-60 seconds of water flowing, rinse twice the sampling bottle (and its cap); 9 fill the 60 mL bottle up to the brim, one after another taking care to prevent any contact
between the bottle brim and the pipe end (where deposits may spoil the sample) ;
Figure 7: Sampling operation
10 once the bottles are filled and closed, remove the spiral pipe out of the water in order to let the steam purge the liquid out of the pipe;
11 as the liquid phase valve and the vapour phase one are still open, turn the main valve connecting the separator to the well head off (n°1, fig.6) in order to empty it and avoid any cross contamination of samples;

Doc.nr: Version: Classification: Page:
I MAGE-D4-5 1 confidential 17 of 36
12 when the steam and liquid do not flow anymore from the separator, turn the screw valve(s) (n°2, fig.6) off and then the liquid phase (n°4, fig.6) and gas phase (n°3, fig.6) valves as well; put the cap on the water barrel again and close both the shelter doors;
13 store the samples, if possible in order at the laboratory.
Concerning the wells K-17 and K-19, where a high vapour fraction is observed, pure liquid cannot be sampled directly after a 10 minute purge, so water must be allowed to collect in the separator in order to sample it. Even with 5-6 hours of collection into the separator at K-19, there is only enough water usually for 20-30 seconds of flow before gas bubbles start to appear. Therefore, sampling of this borehole must be done very quickly with only a quick purge of the water pipe before sampling.
It is thus recommended to proceed in two steps • turn the steam valve on (for instance after the breakfast time) following the points 1, 2, 3 and 5 • sample together with the other wells (after the lunch, i.e. around 5-6 h later) following the points
4, 6, 7, 8,…, 14 without waiting the usual 10’ for sampling.
5.4. Tracer analysis The objective was first to estimate, on site, iodide using a portable ionometer pH/ION 3310 equipped with a specific combined iodide electrode by potentiometric method (appendix 2). The detection limit could hardly be lower than 10-20 µg/L, which matches the upper limit of the baselines of several well waters. However matrix effects due to the high concentration of sulphides in the Krafla geothermal fluid (analysed sulphide concentration in the selected wells ranged from 80 to 130 mg/L) were found to mask the possible iodide content, making the field analyses of iodide unreliable. Analyses were carried out at BRGM laboratory with lower detection limit (1 µg/L) using ICP-MS analysing total iodine concentration. The naphthalene sulfonates were analysed at ISOR’s laboratory using HPLC with a fluorescence detector and an estimated detection limit of 0.1–0.2 ppb depending on the sample matrix.
6. Results and Interpretation
6.1. Program adaptations Before starting the interpretation of the results obtained in this field tracer testing, several remarks with respect to the project aims must be summarized.
• As the Krafla geothermal field has been harnessed for more than 30 years, the reservoirs characteristics may have changed. The presence of supercritical water conditions that could be inferred in 2008-2009 during the drilling of K-39 and of IDDP-1 may have changed. They must be re-located and such conditions are unlikely, now, at the bottom of the selected injection well K-39.
• The monitoring wells selected have either a high proportion of liquid (K-06) or a high proportion of steam phase (K-17 and K-19).
• PFC and gas phase tracing had to be cancelled due to lack of time, budget and unclear injection protocol. The tests were focused on the liquid phase tracers using a presumed conservative tracer (potassium iodide) and tracers possibly subject to degradation (NDS).
• Iodide on site measurement using electrochemical (specific electrode) was replaced by laboratory analyses, due to the high sulphide concentration of the Krafla geothermal fluid.
• Tracer (I-, 2,6- and 2,7-NDS) concentrations had to be corrected from a dilution effect due to the presence of condensate in vapour-rich well fluid such as K-19, using chloride concentration and / or conductivity measurement. This correction was especially useful on the first part of the test (before the 1st of July) when the sampling procedure was not consolidated.
Doc.nr: Version: Classification: Page:
I MAGE-D4-5 1 confidential 18 of 36
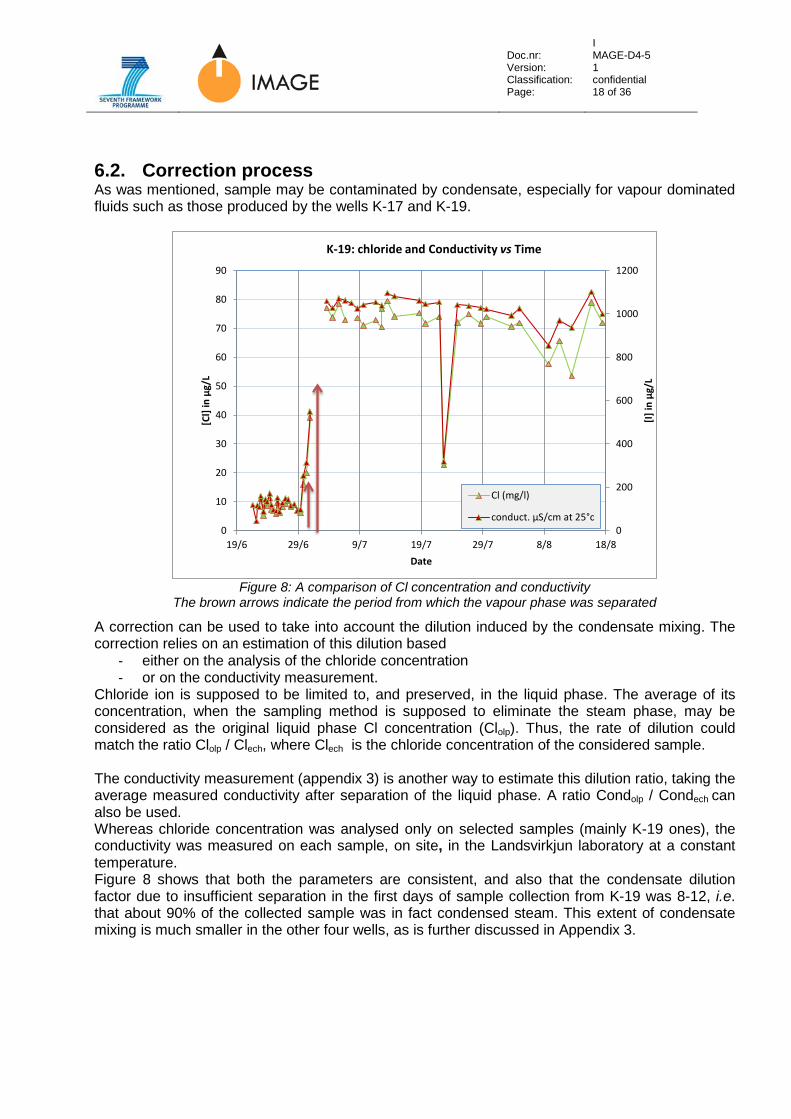
6.2. Correction process As was mentioned, sample may be contaminated by condensate, especially for vapour dominated fluids such as those produced by the wells K-17 and K-19.
Figure 8: A comparison of Cl concentration and conductivity
The brown arrows indicate the period from which the vapour phase was separated
A correction can be used to take into account the dilution induced by the condensate mixing. The correction relies on an estimation of this dilution based
- either on the analysis of the chloride concentration - or on the conductivity measurement.
Chloride ion is supposed to be limited to, and preserved, in the liquid phase. The average of its concentration, when the sampling method is supposed to eliminate the steam phase, may be considered as the original liquid phase Cl concentration (Clolp). Thus, the rate of dilution could match the ratio Clolp / Clech, where Clech is the chloride concentration of the considered sample. The conductivity measurement (appendix 3) is another way to estimate this dilution ratio, taking the average measured conductivity after separation of the liquid phase. A ratio Condolp / Condech can also be used. Whereas chloride concentration was analysed only on selected samples (mainly K-19 ones), the conductivity was measured on each sample, on site, in the Landsvirkjun laboratory at a constant temperature. Figure 8 shows that both the parameters are consistent, and also that the condensate dilution factor due to insufficient separation in the first days of sample collection from K-19 was 8-12, i.e. that about 90% of the collected sample was in fact condensed steam. This extent of condensate mixing is much smaller in the other four wells, as is further discussed in Appendix 3.
0
200
400
600
800
1000
1200
0
10
20
30
40
50
60
70
80
90
19/6 29/6 9/7 19/7 29/7 8/8 18/8
[I] in
µg/
L
[Cl]
in µ
g/L
Date
K-19: chloride and Conductivity vs Time
Cl (mg/l)
conduct. µS/cm at 25°c
Doc.nr: Version: Classification: Page:
I MAGE-D4-5 1 confidential 19 of 36
6.3. Wells without tracer return For all the following wells, correction relies on conductivity measurements. It may be referred to appendix 3.
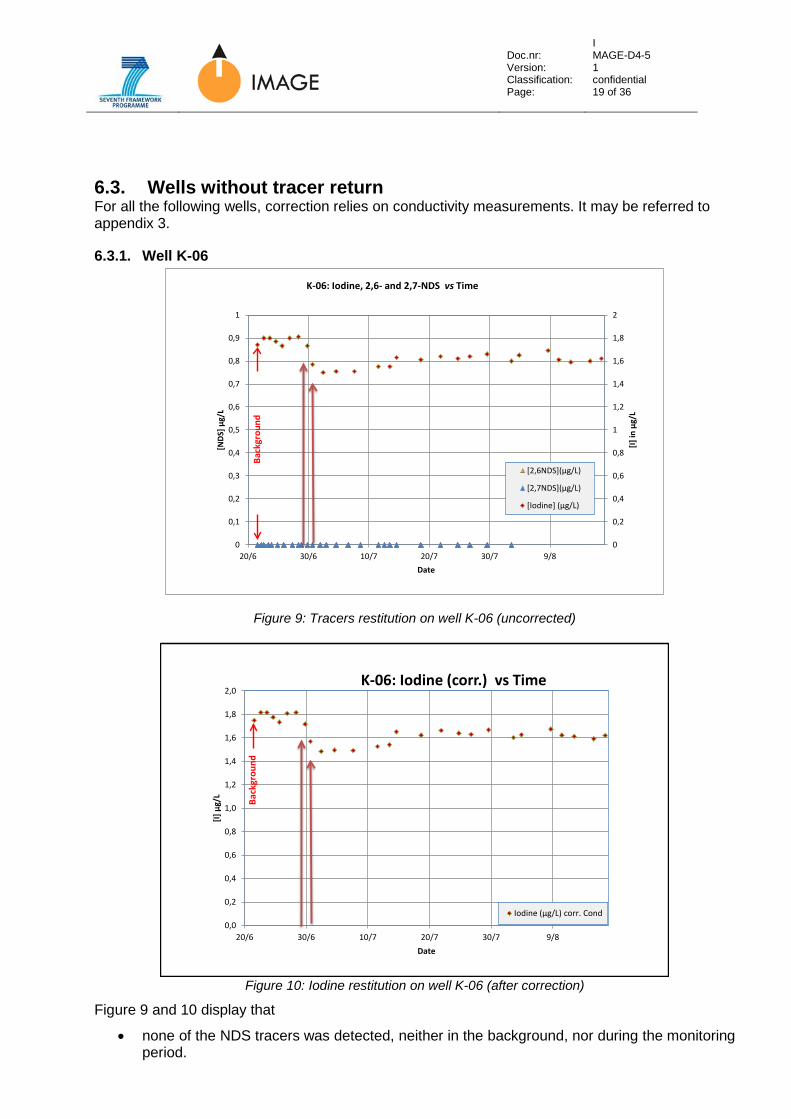
6.3.1. Well K-06
Figure 9: Tracers restitution on well K-06 (uncorrected)
Figure 10: Iodine restitution on well K-06 (after correction)
Figure 9 and 10 display that
• none of the NDS tracers was detected, neither in the background, nor during the monitoring period.
0
0,2
0,4
0,6
0,8
1
1,2
1,4
1,6
1,8
2
0
0,1
0,2
0,3
0,4
0,5
0,6
0,7
0,8
0,9
1
20/6 30/6 10/7 20/7 30/7 9/8
[I] in
µg/
L
[NDS
] µg/
L
Date
K-06: Iodine, 2,6- and 2,7-NDS vs Time
[2,6NDS](µg/L)
[2,7NDS](µg/L)
[Iodine] (µg/L)
Back
grou
nd
0,0
0,2
0,4
0,6
0,8
1,0
1,2
1,4
1,6
1,8
2,0
20/6 30/6 10/7 20/7 30/7 9/8
[I] µ
g/L
Date
K-06: Iodine (corr.) vs Time
Iodine (µg/L) corr. Cond
Back
grou
nd
Doc.nr: Version: Classification: Page:
I MAGE-D4-5 1 confidential 20 of 36
• iodine was detected but remained at the background level (1.5 - 1.7 µg/L). • separation of vapor, after the 29/06 -01/07, results in a decrease of the iodine content (-
11%).
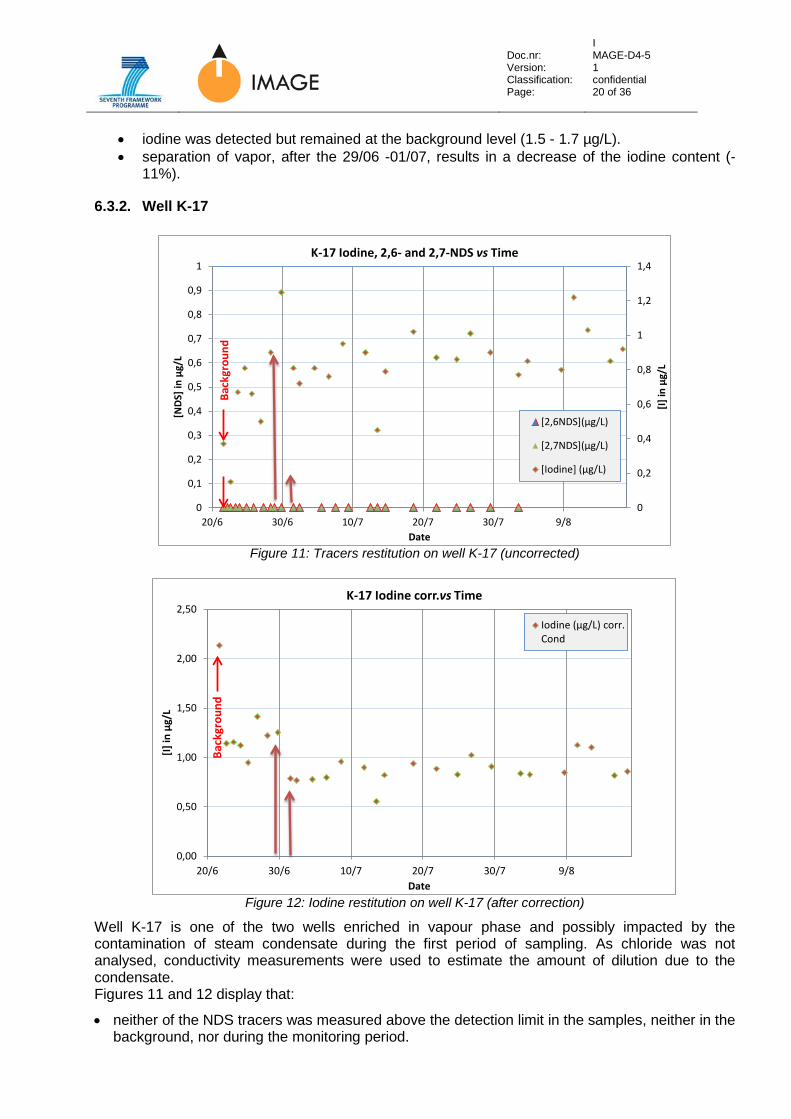
6.3.2. Well K-17
Figure 11: Tracers restitution on well K-17 (uncorrected)
Figure 12: Iodine restitution on well K-17 (after correction)
Well K-17 is one of the two wells enriched in vapour phase and possibly impacted by the contamination of steam condensate during the first period of sampling. As chloride was not analysed, conductivity measurements were used to estimate the amount of dilution due to the condensate. Figures 11 and 12 display that:
• neither of the NDS tracers was measured above the detection limit in the samples, neither in the background, nor during the monitoring period.
0
0,2
0,4
0,6
0,8
1
1,2
1,4
0
0,1
0,2
0,3
0,4
0,5
0,6
0,7
0,8
0,9
1
20/6 30/6 10/7 20/7 30/7 9/8
[I] in
µg/
L
[NDS
] in
µg/L
Date
K-17 Iodine, 2,6- and 2,7-NDS vs Time
[2,6NDS](µg/L)
[2,7NDS](µg/L)
[Iodine] (µg/L)
Back
grou
nd
0,00
0,50
1,00
1,50
2,00
2,50
20/6 30/6 10/7 20/7 30/7 9/8
[I] in
µg/
L
Date
K-17 Iodine corr.vs Time
Iodine (µg/L) corr.Cond
Back
grou
nd

Doc.nr: Version: Classification: Page:
I MAGE-D4-5 1 confidential 21 of 36
• iodine was detected and remained, after correction, almost constant (0.8 µg/L) but significantly lower than the first background value (2.1 µg/L, after correction).
• separation of vapour, after the 29/06 -01/07, results, after correction, in a decrease of the iodine.
6.3.3. Well K-33
Figure 13: Tracers restitution on well K-33 (uncorrected)
Figure 14: Iodine restitution on well K-33 (after correction)
Figures 13 and 14 display that:
• none of the NDS tracers was detected, neither in the background, nor during the monitoring period.
• iodine was detected at a higher level than in the other wells; it remained, after correction, almost at the same level (6 µg/L) as the background value (6.5 µg/L).
• separation of vapor, after the 29/06 -01/07, results, after correction, in a decrease of the iodine.
0
1
2
3
4
5
6
7
8
0
0,1
0,2
0,3
0,4
0,5
0,6
0,7
0,8
0,9
1
20/6 30/6 10/7 20/7 30/7 9/8
[I] in
µg/
L
[NDS
] in
µg/L
Date
K-33 Iodine, 2,6- and 2,7- NDS vs Time
[2,7NDS](µg/L)
[2,6NDS](µg/L)
[Iodine] (µg/L)
Back
grou
nd
0,0
1,0
2,0
3,0
4,0
5,0
6,0
7,0
20/6 30/6 10/7 20/7 30/7 9/8
[I] in
µg/
L
Date
K-33 Iodine (corr.) vs Time
Iodine (µg/L) corr. Cond
Back
grou
nd
Doc.nr: Version: Classification: Page:
I MAGE-D4-5 1 confidential 22 of 36
6.3.4. Well K-34
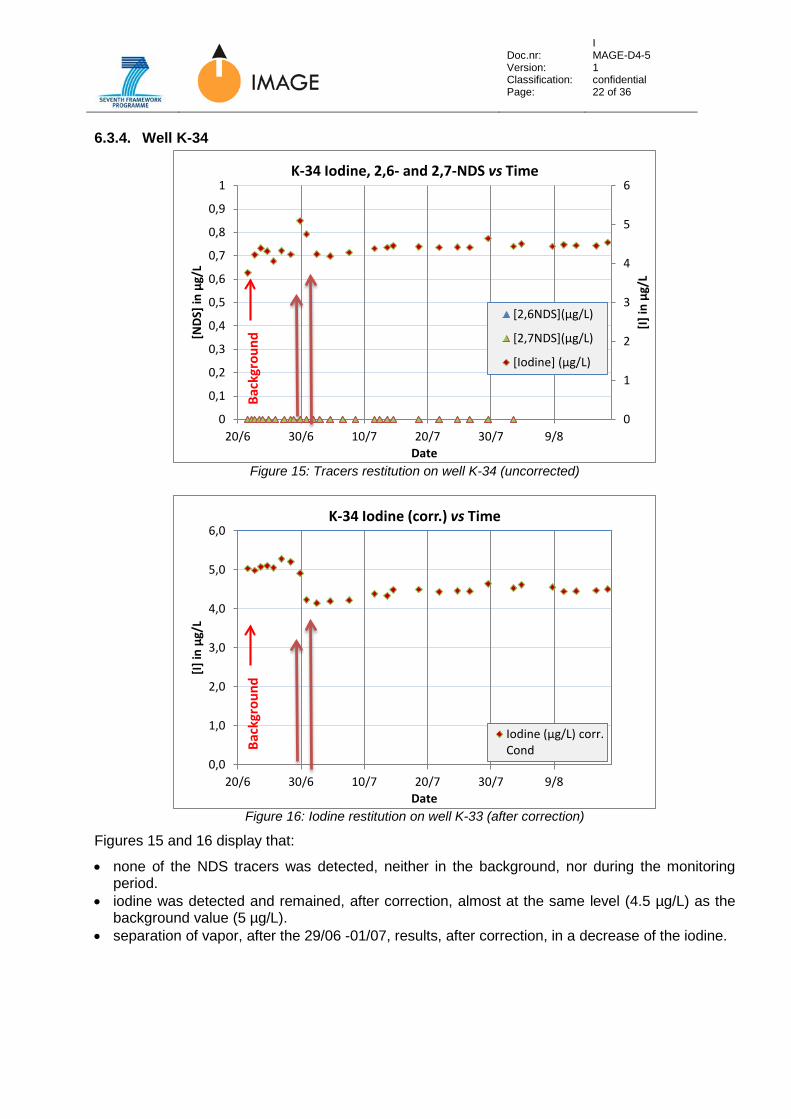
Figure 15: Tracers restitution on well K-34 (uncorrected)
Figure 16: Iodine restitution on well K-33 (after correction)
Figures 15 and 16 display that:
• none of the NDS tracers was detected, neither in the background, nor during the monitoring period.
• iodine was detected and remained, after correction, almost at the same level (4.5 µg/L) as the background value (5 µg/L).
• separation of vapor, after the 29/06 -01/07, results, after correction, in a decrease of the iodine.
0
1
2
3
4
5
6
0
0,1
0,2
0,3
0,4
0,5
0,6
0,7
0,8
0,9
1
20/6 30/6 10/7 20/7 30/7 9/8
[I] in
µg/
L
[NDS
] in
µg/L
Date
K-34 Iodine, 2,6- and 2,7-NDS vs Time
[2,6NDS](µg/L)
[2,7NDS](µg/L)
[Iodine] (µg/L)
Back
grou
nd
0,0
1,0
2,0
3,0
4,0
5,0
6,0
20/6 30/6 10/7 20/7 30/7 9/8
[I] in
µg/
L
Date
K-34 Iodine (corr.) vs Time
Iodine (µg/L) corr.CondBa
ckgr
ound

Doc.nr: Version: Classification: Page:
I MAGE-D4-5 1 confidential 23 of 36
6.4. Estimation of tracer background
6.4.1. Iodine background The background concentrations are represented by the analyses of samples collected from each well, before the tracer injection, Table 4 shows that the initial iodine background varies significantly from < 0.9 to 6.63 µg/L.
Another estimation can be provided from the iodine concentration of the re-injected fluid into K-39 before tracers injection (6.48 µg/L). This value does not need correction as it is done on a fluid where the steam phase has already been separated in the plant. However, the re-injected brine is gradually mixed with reservoir fluids once it enters the reservoir, so the concentration in the injection brine will not remain as the background concentration for the entire reservoir, which is very heterogeneous with regard to chemical composition (see e.g. Weisenberger et al., 2015).
A third, and most reasonable, estimation could come from the average value for iodide after correction (using conductivity values) of the possible dilution by condensate and before the breakthrough. For wells K-06, K-17, K-33 and K-34, which showed no returns, this can be the average of all values, but for well K-19 this would need to be estimated from the condensate dilution factor and the iodide detection limit (Table 4).
K39 K06 K17 K19 K33 K34 1) I- background, before tracer injection (µg/L)
6.48 1.75 2.13 < 0.9 6.63 5.03
2) I- average after correction (µg/L) - 1.60 0.87 < 0.9 6.03 4.43 Variation between 1) and 2) -8.6% -59.2% -9.0% -11.9% (I-) range during the 2005-2007 test 7.5 - 20 4 - 7.5 2,6-NDS background, before tracer injection (µg/L)
< 0.1 < 0.1 < 0.1 < 0.9 < 0.1 < 0.1
2,7- NDS background, before tracers injection (µg/L)
< 0.1 < 0.1 < 0.1 < 0.9 < 0.1 < 0.1
Table 4: Comparison between tracers backgrounds and average values on the monitored wells
The iodine variations from one well to another and their baselines can be compared to the iodide concentrations measured on the 2005-2007 tracer test (fig.2) (Armannsson et al., 2009), although only two of the wells sampled in 2016 were included in the 2005-2007 tracer test; K-33 and K-34.
Those baseline values are much lower than the iodine concentrations resulting from the tracer injection (K-19). The different baseline values are not surprising considering the heterogeneity of the reservoir (see e.g. Weisenberger et al., 2015; Darling and Ármannsson, 1989; Ármannsson et al., 1987).
The iodine concentration decreases after the implementation of gas/steam separation before sampling (tab. 4). One would have expected, on the opposite, an increase of (I) as there was no more dilution by pure water condensate. We suggest that it results, at least partly, from the correction using the conductivity value that is more impacted than iodine concentration by the possible initial dilution (appendix 3). This may explain the cases of K-33 and K-34 (or even K-17) where the variation (fig.13 vs. fig.14 and fig.15 vs. fig.16) was enhanced after correction. This might be checked by a comparison of the conductivity corrected values and values that are corrected using measured chloride concentrations, as the Cl- and I- concentrations are likely to be affected by dilution in a similar manner. The decrease of uncorrected iodine concentrations in K-06 (fig.9) may result from the insufficiently opened main valve (valve 1 in Fig. 6). A pressure drop between the two-phase pipeline and the separator would result in further boiling of the fluid as it entered the separator. This would lead to a concentration of all components in the liquid. This explanation might be checked by the measurement of conductivity that slightly decreases as well when the vapour phase is separated.
Doc.nr: Version: Classification: Page:
I MAGE-D4-5 1 confidential 24 of 36
6.4.2. 2,6- and 2,7-NDS backgrounds In all the monitored wells the measured NDS values were below the quantification threshold (<0.1 µg/L). Note that some of the background samples were diluted with condensate, for example K-19 would have a detection limit of about 1 ppb if the sample is diluted by 90% Only in the re-injected fluid (K-39), was this quantification threshold value reached, meaning that the possibility of finding some traces of NDS cannot be excluded.
6.5. Tracers return in well K-19
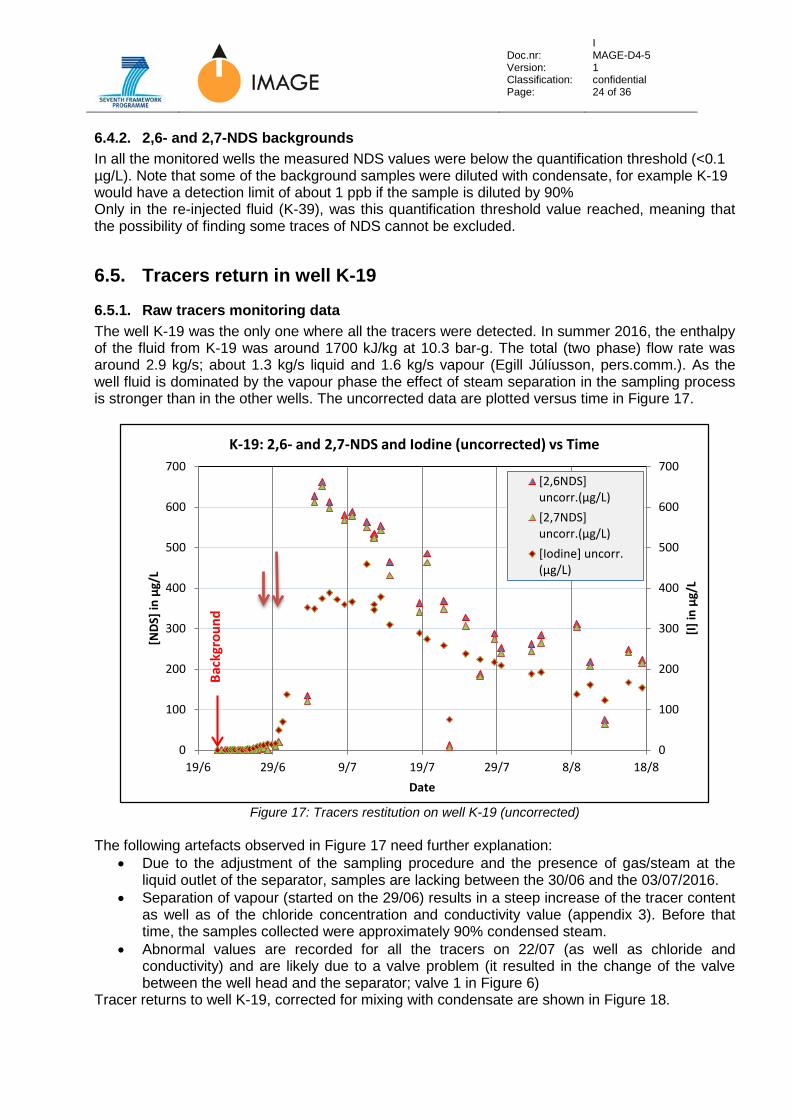
6.5.1. Raw tracers monitoring data The well K-19 was the only one where all the tracers were detected. In summer 2016, the enthalpy of the fluid from K-19 was around 1700 kJ/kg at 10.3 bar-g. The total (two phase) flow rate was around 2.9 kg/s; about 1.3 kg/s liquid and 1.6 kg/s vapour (Egill Júlíusson, pers.comm.). As the well fluid is dominated by the vapour phase the effect of steam separation in the sampling process is stronger than in the other wells. The uncorrected data are plotted versus time in Figure 17.
Figure 17: Tracers restitution on well K-19 (uncorrected)
The following artefacts observed in Figure 17 need further explanation:
• Due to the adjustment of the sampling procedure and the presence of gas/steam at the liquid outlet of the separator, samples are lacking between the 30/06 and the 03/07/2016.
• Separation of vapour (started on the 29/06) results in a steep increase of the tracer content as well as of the chloride concentration and conductivity value (appendix 3). Before that time, the samples collected were approximately 90% condensed steam.
• Abnormal values are recorded for all the tracers on 22/07 (as well as chloride and conductivity) and are likely due to a valve problem (it resulted in the change of the valve between the well head and the separator; valve 1 in Figure 6)
Tracer returns to well K-19, corrected for mixing with condensate are shown in Figure 18.
0
100
200
300
400
500
600
700
0
100
200
300
400
500
600
700
19/6 29/6 9/7 19/7 29/7 8/8 18/8
[I] in
µg/
L
[NDS
] in
µg/L
Date
K-19: 2,6- and 2,7-NDS and Iodine (uncorrected) vs Time
[2,6NDS]uncorr.(µg/L)[2,7NDS]uncorr.(µg/L)[Iodine] uncorr.(µg/L)
Back
grou
nd
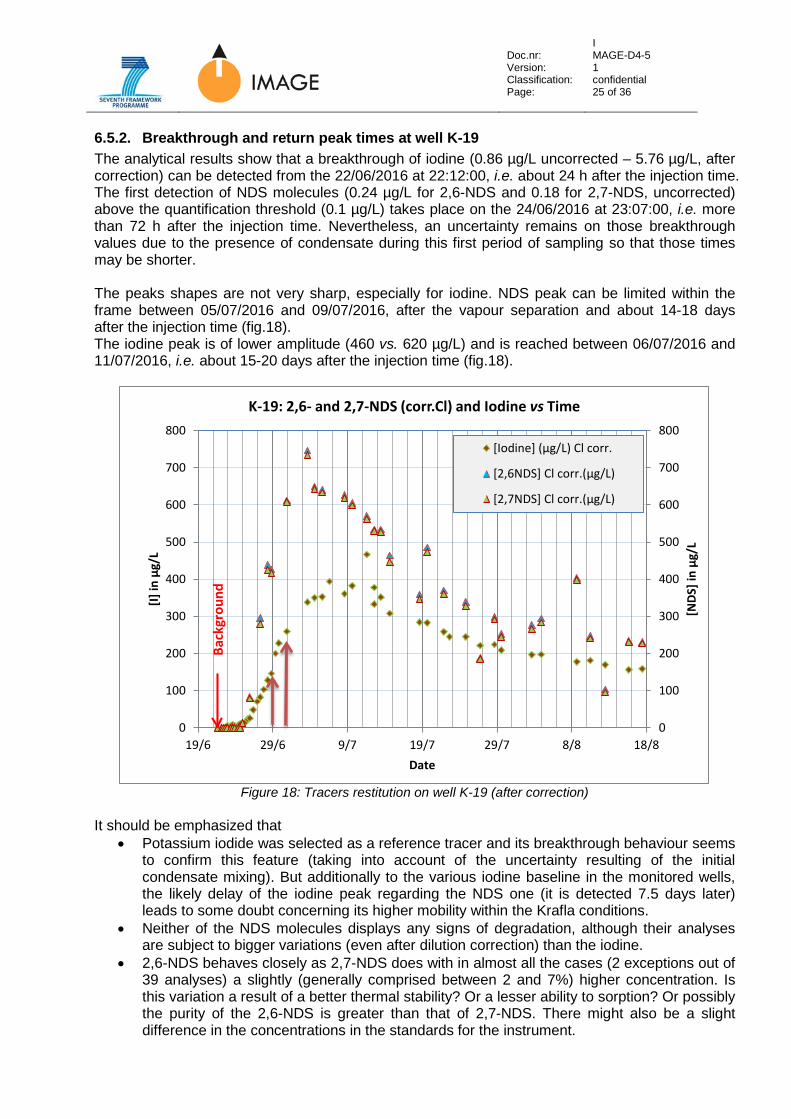
Doc.nr: Version: Classification: Page:
I MAGE-D4-5 1 confidential 25 of 36
6.5.2. Breakthrough and return peak times at well K-19 The analytical results show that a breakthrough of iodine (0.86 µg/L uncorrected – 5.76 µg/L, after correction) can be detected from the 22/06/2016 at 22:12:00, i.e. about 24 h after the injection time. The first detection of NDS molecules (0.24 µg/L for 2,6-NDS and 0.18 for 2,7-NDS, uncorrected) above the quantification threshold (0.1 µg/L) takes place on the 24/06/2016 at 23:07:00, i.e. more than 72 h after the injection time. Nevertheless, an uncertainty remains on those breakthrough values due to the presence of condensate during this first period of sampling so that those times may be shorter. The peaks shapes are not very sharp, especially for iodine. NDS peak can be limited within the frame between 05/07/2016 and 09/07/2016, after the vapour separation and about 14-18 days after the injection time (fig.18). The iodine peak is of lower amplitude (460 vs. 620 µg/L) and is reached between 06/07/2016 and 11/07/2016, i.e. about 15-20 days after the injection time (fig.18).
Figure 18: Tracers restitution on well K-19 (after correction)
It should be emphasized that
• Potassium iodide was selected as a reference tracer and its breakthrough behaviour seems to confirm this feature (taking into account of the uncertainty resulting of the initial condensate mixing). But additionally to the various iodine baseline in the monitored wells, the likely delay of the iodine peak regarding the NDS one (it is detected 7.5 days later) leads to some doubt concerning its higher mobility within the Krafla conditions.
• Neither of the NDS molecules displays any signs of degradation, although their analyses are subject to bigger variations (even after dilution correction) than the iodine.
• 2,6-NDS behaves closely as 2,7-NDS does with in almost all the cases (2 exceptions out of 39 analyses) a slightly (generally comprised between 2 and 7%) higher concentration. Is this variation a result of a better thermal stability? Or a lesser ability to sorption? Or possibly the purity of the 2,6-NDS is greater than that of 2,7-NDS. There might also be a slight difference in the concentrations in the standards for the instrument.
0
100
200
300
400
500
600
700
800
0
100
200
300
400
500
600
700
800
19/6 29/6 9/7 19/7 29/7 8/8 18/8
[NDS
] in
µg/L
[I] in
µg/
L
Date
K-19: 2,6- and 2,7-NDS (corr.Cl) and Iodine vs Time
[Iodine] (µg/L) Cl corr.
[2,6NDS] Cl corr.(µg/L)
[2,7NDS] Cl corr.(µg/L)
Back
grou
nd
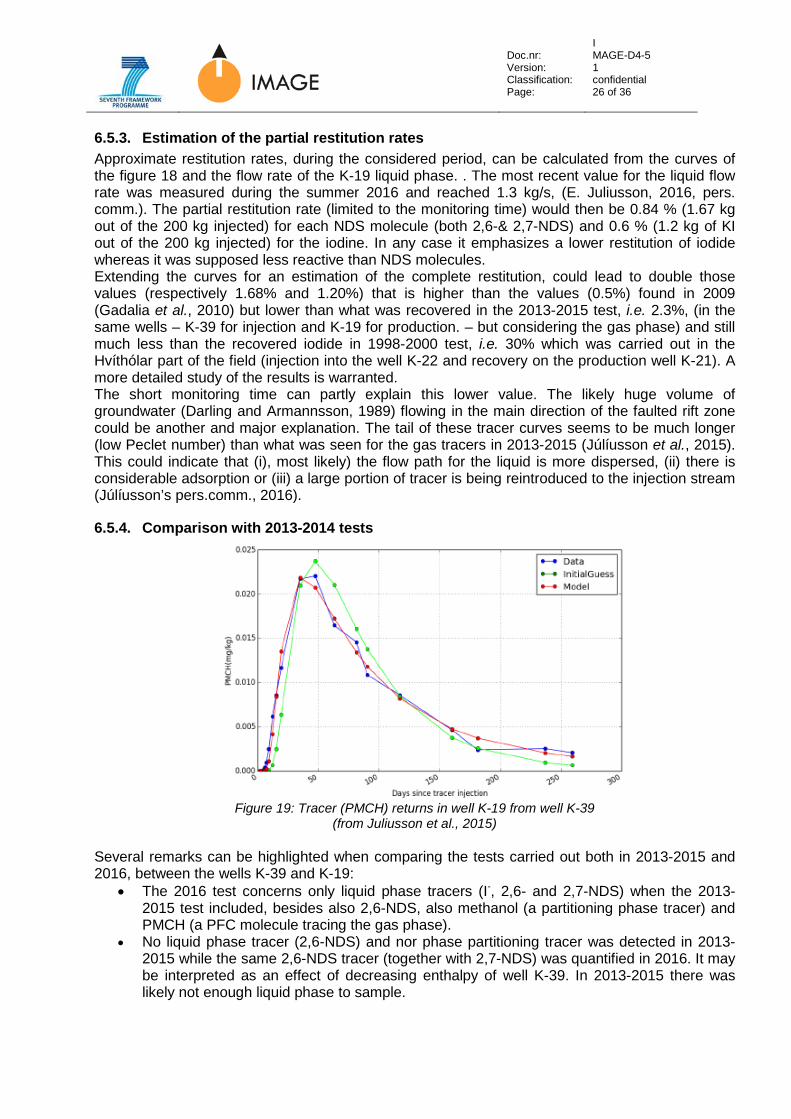
Doc.nr: Version: Classification: Page:
I MAGE-D4-5 1 confidential 26 of 36
6.5.3. Estimation of the partial restitution rates Approximate restitution rates, during the considered period, can be calculated from the curves of the figure 18 and the flow rate of the K-19 liquid phase. . The most recent value for the liquid flow rate was measured during the summer 2016 and reached 1.3 kg/s, (E. Juliusson, 2016, pers. comm.). The partial restitution rate (limited to the monitoring time) would then be 0.84 % (1.67 kg out of the 200 kg injected) for each NDS molecule (both 2,6-& 2,7-NDS) and 0.6 % (1.2 kg of KI out of the 200 kg injected) for the iodine. In any case it emphasizes a lower restitution of iodide whereas it was supposed less reactive than NDS molecules. Extending the curves for an estimation of the complete restitution, could lead to double those values (respectively 1.68% and 1.20%) that is higher than the values (0.5%) found in 2009 (Gadalia et al., 2010) but lower than what was recovered in the 2013-2015 test, i.e. 2.3%, (in the same wells – K-39 for injection and K-19 for production. – but considering the gas phase) and still much less than the recovered iodide in 1998-2000 test, i.e. 30% which was carried out in the Hvíthólar part of the field (injection into the well K-22 and recovery on the production well K-21). A more detailed study of the results is warranted. The short monitoring time can partly explain this lower value. The likely huge volume of groundwater (Darling and Armannsson, 1989) flowing in the main direction of the faulted rift zone could be another and major explanation. The tail of these tracer curves seems to be much longer (low Peclet number) than what was seen for the gas tracers in 2013-2015 (Júlíusson et al., 2015). This could indicate that (i), most likely) the flow path for the liquid is more dispersed, (ii) there is considerable adsorption or (iii) a large portion of tracer is being reintroduced to the injection stream (Júlíusson’s pers.comm., 2016).
6.5.4. Comparison with 2013-2014 tests
Figure 19: Tracer (PMCH) returns in well K-19 from well K-39
(from Juliusson et al., 2015) Several remarks can be highlighted when comparing the tests carried out both in 2013-2015 and 2016, between the wells K-39 and K-19:
• The 2016 test concerns only liquid phase tracers (I-, 2,6- and 2,7-NDS) when the 2013-2015 test included, besides also 2,6-NDS, also methanol (a partitioning phase tracer) and PMCH (a PFC molecule tracing the gas phase).
• No liquid phase tracer (2,6-NDS) and nor phase partitioning tracer was detected in 2013-2015 while the same 2,6-NDS tracer (together with 2,7-NDS) was quantified in 2016. It may be interpreted as an effect of decreasing enthalpy of well K-39. In 2013-2015 there was likely not enough liquid phase to sample.

Doc.nr: Version: Classification: Page:
I MAGE-D4-5 1 confidential 27 of 36
Table 5: Comparison of the apparent linear velocities (ALV) obtained during the last 3 tracer tests in
Krafla
• When comparing the apparent linear velocities (tab. 5) and extending the comparison to the 2009 test, the values obtained in 2016 are one order of magnitude lower than those estimated in 2009. On the other hand they are 2-4 times higher than the values obtained in 2013-2015 in the same wells but considering the vapour phase instead of the liquid phase.
• During the 2013-2015 test, PMCH injected into the well K-39 was detected in well K-19 according to the restitution curve shown on figure 19. It was inferred from the calculated joined curve that “one dimensional advection-dispersion … fits the return curve…indicating that there is one predominant flow path between the two wells” (Júlíusson et al., 2015). This conclusion can be preserved for the 2016 test and may correspond with the main rift faults N10 direction (fig.3). Since the return curve now looks more dispersed additional factors must be taken in consideration.
7. Conclusions
During a relatively short monitoring period (a little less than 2 months) and limited to liquid phase tracers, this tracer test brought new information on tracers properties, on the evolution of the geothermal field conditions and on flow path way of the reservoir fluid.
• Sampling / correction methods This test also displayed a consistent method of sampling allowing steam/gas separation and correction of the possible condensate mixing either using the chloride concentration or the conductivity measurement.
• Tracers properties The monitoring of the 5 wells displayed that the background of the NDS remained below the quantification threshold (0.1 µg/L) whereas the iodine background was relatively variable (from <0.9 to 6 µg/L). This did not disturb the tracing detection of iodine. However, those variations are interpreted as a result of the reservoir heterogeneity. In K-19, the first detection of iodine occurs at less than 24 h after the injection time whereas the NDS molecules are detected about 72 h after injection. An uncertainty remains on those breakthrough values due to significant (up to 90%) dilution of the samples with condensate during this first period of sampling so that those time periods may be shorter. The occurrence of the tracer peaks is more constrained although the shapes of the peaks are not very sharp (especially for iodine). Unexpectedly the iodine peak has a lower amplitude (460 vs. 620 µg/L) and arrives later 15-20 vs. 14-18 days) than the NDS one. This may be interpreted as a possible slight reactivity of iodide in the Krafla reservoir context.
Tracer test Tracer
Injection & production
wells
Inter-well distance
(m)
Break- through time (h)
Break- through
ALV (m/h)
Peak time (h)
Peak ALV (m/h)
K26 - K15 900 5h35 162,9 70 11,9K26-K15 1,167 50 23,3 80 14,6
1,2
PMCH
iodine
2,6- & 2,7- NDS 0,7
0,3
288K39-K19
K39-K19 350 3,3
72 468
1133105
350
350
14,6
4,9
2009
2013-2015
1,5- & 2,6- NDS
201624

Doc.nr: Version: Classification: Page:
I MAGE-D4-5 1 confidential 28 of 36
The calculation of the restitution rate could only rely on a short period but it displays a clearly lower (37% less) restitution of the iodide vs. the NDS molecules.
• Evolution of the geothermal field 2,6-NDS was not detected in the 2013-2015 tracer test, considering the same wells and the same liquid phase tracer. During the 2009 test, particular behavior of NDS tracers, including 2,6-NDS, in the well K-39 (productive at that time) was attributed to thermal degradation whereas no degradation of the injected NDS molecules can be inferred from the 2016 test. This may result from a possible cooling of the K-39 part of the geothermal reservoir.
• Flow pathway Although 5 wells were selected in various areas of Krafla geothermal field, the 3 tracers were detected only in the well K-19 within the limited time-frame of the tracer test. This is a strong indication of direction-constrained flow path.
The lower restitution rate than during the previous Krafla tracer tests could indicate a higher flow rate as the main direction of the faulted rift is concerned.
Additionally, the calculation of the apparent linear velocities (ALV) gives values of the same order as in the 2013-2015 test confirming a high flow rate within the Krafla geothermal reservoir with respect to tracer tests in other geothermal field.
Doc.nr: Version: Classification: Page:
I MAGE-D4-5 1 confidential 29 of 36
References
Armannsson H., Axelsson G. and Olafsson M. (2009) – Niðurdæling í KG-26. Ferilprófun með KI 2005-2007 – Lýsing og niðurstöður, ISOR report 2009/050. Ármannsson H., Guðmundsson Á. and Steingrímsson B. (1987). Exploration and development of the Krafla geothermal area. Jökull, 37, 13-30. Arnorsson S., Bjarnason J.Ö., Giroud N., Gunarsson I., Stefansson A. (2006) Sampling and analysis of geothermal fluids. Geofluids 6, 203-216. Axelsson G. (2013) Tracer tests in geothermal resource management. EPJ Web of Conferences 50, 02001. Ásmundsson R. Pezard P., Sanjuan B., Henninges J., Deltombe J. L., Halladay N., Lebert F., Gadalia A., Millot R., Gibert B., Violay M., Reinsch T., Naisse J.M., Massiot C., Azaïs P., Mainprice D., Karytsas C., Johnston C. (2014) High temperature instruments and methods developed for supercritical geothermal reservoir characterisation and exploitation – the HiTI project. Geothermics 49, 90-98. Darling W.G. and Armannsson H. (1989) – Stable isotopic aspects of fluid flow in the Krafla, Namafjall and Theistareykir geothermal systems. Water Resources Research, Vol. 20. N°11, 1531-1544. Elders W.A., Fridleifsson G.O. (2009) – The Iceland Deep Drillling Project (IDDP): Deep Drilling at Krafla to investigate supercritical geothermal resources. GRC Transactions, Vol. 33, 611-615.
Gadalia A., Braibant G., Touzelet S., Sanjuan B. (2010) Tracing tests using organic compounds in a very high temperature geothermal field (Krafla, Iceland), BRGM report n° RP 57661FR, 82 p., 15 fig., 1 tab., 4 app.
Hauksson T. and Benjaminsson J. (2006) Krafla og Bjarnarflag Afköst borhola og efnainnihald vatns og gufu í borholum og vinnslurás árið 2005, Landsvirkjun, Kröflustöð report, 80 p.
Hersir G.P. and Vilhjámsson A.M. (2016) Mixing and injecting tracers in well K-39 in Krafla, NE-Iceland. ÍSOR short report ÍSOR-16058. Juliusson E., Markusson S., Sigurdardottir A. (2015) Phase specific and phase-partitioning tracer experiment in the Krafla reservoir, Iceland. Proceedings World Geothermal Congress, Melbourne, Australia, 19-25 April 2015. Kristjánsson B.R., Axelsson G., Gunnarsson G., Gunnarsson I. and Óskarsson F. (2016) Comprehensive tracer testing in the Hellisheiði geothermal field in SW-Iceland 2013-2014. Proceedings Stanford Geothermal Workshop, Stanford USA, 22-24 February 2016. Mountain B.W., Winick J.A. (2012) The thermal stability of the naphthalene sulfonic and naphthalene disulfonic acids under geothermal conditions: experimental results and a field-base
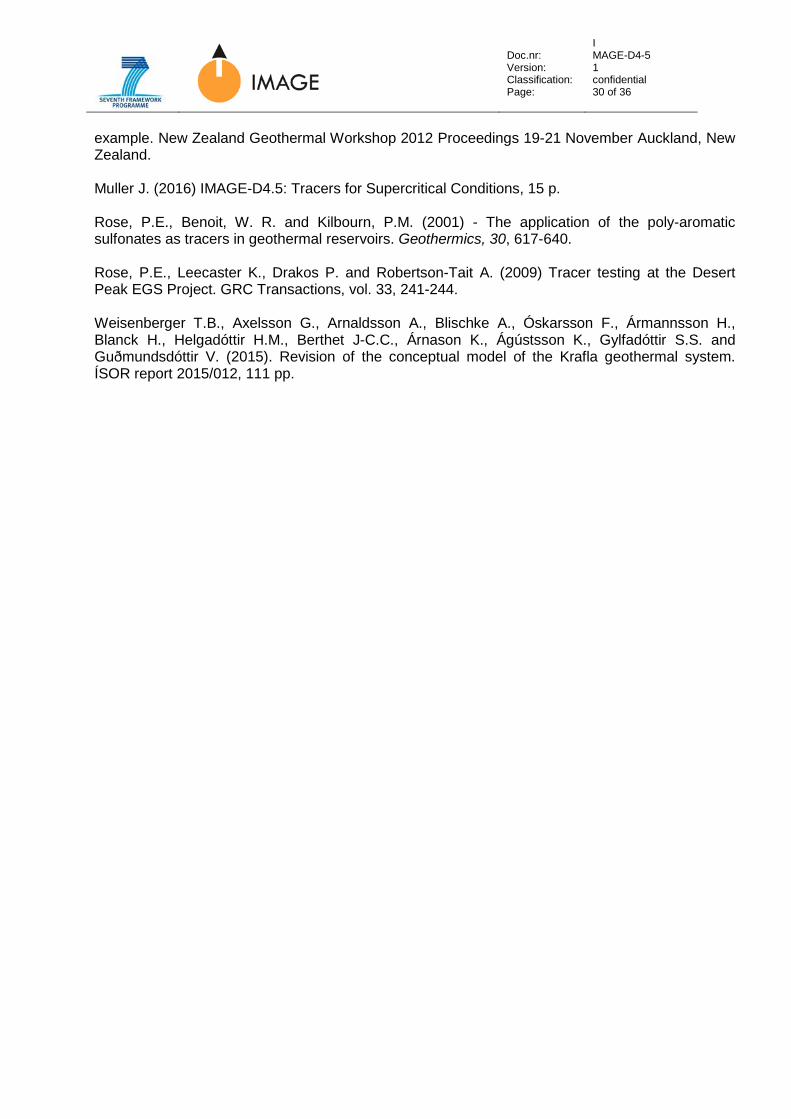
Doc.nr: Version: Classification: Page:
I MAGE-D4-5 1 confidential 30 of 36
example. New Zealand Geothermal Workshop 2012 Proceedings 19-21 November Auckland, New Zealand. Muller J. (2016) IMAGE-D4.5: Tracers for Supercritical Conditions, 15 p. Rose, P.E., Benoit, W. R. and Kilbourn, P.M. (2001) - The application of the poly-aromatic sulfonates as tracers in geothermal reservoirs. Geothermics, 30, 617-640. Rose, P.E., Leecaster K., Drakos P. and Robertson-Tait A. (2009) Tracer testing at the Desert Peak EGS Project. GRC Transactions, vol. 33, 241-244. Weisenberger T.B., Axelsson G., Arnaldsson A., Blischke A., Óskarsson F., Ármannsson H., Blanck H., Helgadóttir H.M., Berthet J-C.C., Árnason K., Ágústsson K., Gylfadóttir S.S. and Guðmundsdóttir V. (2015). Revision of the conceptual model of the Krafla geothermal system. ÍSOR report 2015/012, 111 pp.

Doc.nr: Version: Classification: Page:
I MAGE-D4-5 1 confidential 31 of 36
Appendix 1: Gas phase tracers Investigation on tracer behaviour under supercritical water conditions were focused on gas phase tracers. Selection of gas phase tracers Two kinds of gas phase tracers were considered: the PFC compounds (perfluorinated cyclocarbons) the thermal stability of which was tested at the IFE laboratory (Muller, 2016) and a noble gas as a conservative gas tracer.
1. Noble gas Helium was first considered as it could have been analysed on site with a portable dedicated 4He mass spectrometer. As Krafla is located on a mantle derived magmatic zone, the helium flow rate and concentration are high (e.g. 135 ppmV in the vapour phase of the K-8 production well). This high concentration of naturally occurring helium prevented us using it as a reference tracer of the vapour phase. Argon is abundant in the atmosphere that could contaminate the samples. Xenon is difficult to sample due to its heavy atomic mass and its adsorption property on glass. Neon and krypton seemed the most interesting candidates as tracers. Both noble gases were sought during the preparation of the field trip; no neon cylinder was found whereas a 200 L cylinder of Kr was available within the required time. However the costs of the cylinder and the subsequent analyses exceeded the WP budget.
2. Perfluorocarbons Testing the stability of tracers under supercritical water conditions both in laboratory and field conditions, was one of the main objectives of IMAGE WP 4.5 project. As PFC were already studied in the IFE laboratory with such an aim, it would have been consistent to test them as well in the field. 2.1. PFC laboratory tests (IFE) Five cyclic perfluorocarbons (PFCs) have been selected for testing at supercritical water conditions in the IFE laboratory (Muller, 2016): PDMCB (Perfluoro-dimethyl-cyclobutane), PMCH (Perfluoro-methyl-cyclohexane), PECH (Perfluoro-ethyl-cyclohexane), 1,2-PDMCH (1,2-Perfluoro-dimethyl-cyclohexane), 1,3,5-PTMCH (1,3,5-Perfluoro-trimethyl-cyclohexane). In 2015 an experimental setup for testing the thermal stability of the selected tracer candidates at relevant conditions was designed and tested with special focus on development of representative sampling techniques and HSE. After ending the test experiment a new experiment at 380°C and 100 bars was started. In this experiment 3H-labelled H2O or tritiated water (HTO) was included as an internal standard in addition to the PFCs. This experiment has been running for two months and samples from the setup have been collected and analysed weekly. Simultaneously, construction and testing of experimental equipment for dynamic laboratory experiments with the tracer candidates have been performed. Different injection and sampling methods have been tested to optimize the system. In the dynamic experiments HTO will be added as a reference tracer. HTO and PFCs will be co-injected into the system and their production curves will be compared and evaluated. 2.2. PFC preliminary selection for field test Although regarding their thermal stability all the five compounds were relevant for the field tests in the Krafla reservoir conditions, practical issues arose and limited the PFC test implementation.
• First, our tracers provider (Yick-Vic company, Hong-Kong, China) could not deliver the PDMCB (Perfluoro-dimethyl-cyclobutane).
• Then, as the ISOR laboratory was the most relevant one to carry out this operation, their analytical constraints were taken into account. They were not able to distinguish 1,2-
Doc.nr: Version: Classification: Page:
I MAGE-D4-5 1 confidential 32 of 36
PDMCH and PECH, the molecules of which have the same molecular weight. So the only remaining PFC were then 1,3,5-PTMCH, PMCH and PECH.
• Then, taking into account all the charges (time for sampling on site, time for analyses, shipping costs from the site through Akureyri airport and then from Reykjavik airport to the ISOR lab, etc.) it was decided to limit the PFC injection at the PMCH (Perfluoro-methyl-cyclohexane).
Figure 20: Layout of the tracers injection skid for 2013-2014 tests
(from Juliusson et al., 2015)
2.3. PFC issues The PFC (PMCH) was supposed to be injected (fig.20) from a 25 L tank through a small digitally controlled direct-drive diaphragm at a flow rate ranging from 0.2 to 150 L/h (needing at least 10 minutes of injection time) through a diaphragm pump (IWAKI, type IX-C150TCR-RF1-E with PVDF/FKM/CE) at a pressure lower than 4 bar. This option was cancelled after a discussion between BRGM and ISOR for the following reasons:
• no available conservative tracer (e.g. krypton) to estimate the possible decay of the PFC; • lack of supercritical water conditions in the current conditions of the K-39 injection well; • doubts about the injection method (use of solvent or not? And if this use is required, which
solvent(s) and in which amount?); advancement was obtained on this issue after the dynamic laboratory experiments (Muller, 2016) displaying that isobutanol could be a relevant solvent for PFC at supercritical water conditions;
• time consumption of the gas phase sampling and PFC analyses and no corresponding budget;
• redundancy with the previous Krafla tracer test (the same PFC was already injected into the same well K-39 in the 2013 tracer test);
• lack of sampling (Giggenbach) bottles within the testing period to get a comprehensive monitoring.
The study of tracer behaviour in supercritical water conditions would preferably be performed in a place where such conditions are effective. A noble gas such as neon or krypton could then be added in order to compare the behaviour of PFC with a conservative tracer.
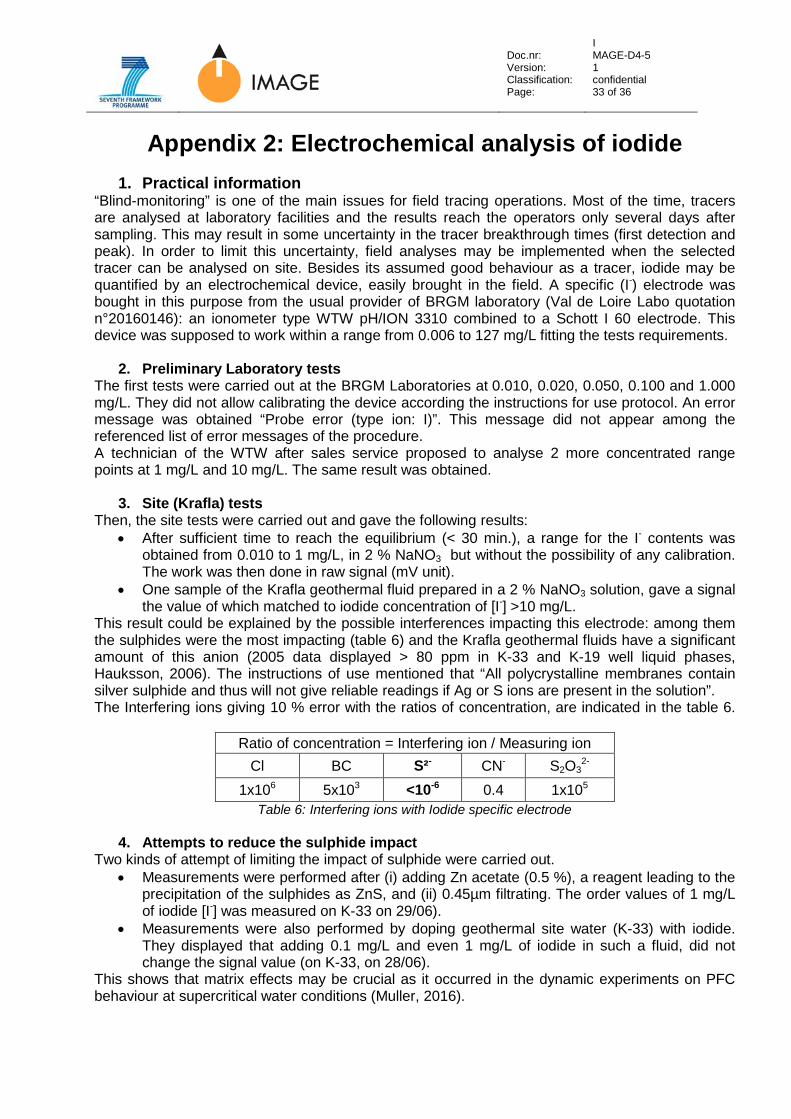
Doc.nr: Version: Classification: Page:
I MAGE-D4-5 1 confidential 33 of 36
Appendix 2: Electrochemical analysis of iodide
1. Practical information “Blind-monitoring” is one of the main issues for field tracing operations. Most of the time, tracers are analysed at laboratory facilities and the results reach the operators only several days after sampling. This may result in some uncertainty in the tracer breakthrough times (first detection and peak). In order to limit this uncertainty, field analyses may be implemented when the selected tracer can be analysed on site. Besides its assumed good behaviour as a tracer, iodide may be quantified by an electrochemical device, easily brought in the field. A specific (I-) electrode was bought in this purpose from the usual provider of BRGM laboratory (Val de Loire Labo quotation n°20160146): an ionometer type WTW pH/ION 3310 combined to a Schott I 60 electrode. This device was supposed to work within a range from 0.006 to 127 mg/L fitting the tests requirements.
2. Preliminary Laboratory tests The first tests were carried out at the BRGM Laboratories at 0.010, 0.020, 0.050, 0.100 and 1.000 mg/L. They did not allow calibrating the device according the instructions for use protocol. An error message was obtained “Probe error (type ion: I)”. This message did not appear among the referenced list of error messages of the procedure. A technician of the WTW after sales service proposed to analyse 2 more concentrated range points at 1 mg/L and 10 mg/L. The same result was obtained.
3. Site (Krafla) tests Then, the site tests were carried out and gave the following results:
• After sufficient time to reach the equilibrium (< 30 min.), a range for the I- contents was obtained from 0.010 to 1 mg/L, in 2 % NaNO3 but without the possibility of any calibration. The work was then done in raw signal (mV unit).
• One sample of the Krafla geothermal fluid prepared in a 2 % NaNO3 solution, gave a signal the value of which matched to iodide concentration of [I-] >10 mg/L.
This result could be explained by the possible interferences impacting this electrode: among them the sulphides were the most impacting (table 6) and the Krafla geothermal fluids have a significant amount of this anion (2005 data displayed > 80 ppm in K-33 and K-19 well liquid phases, Hauksson, 2006). The instructions of use mentioned that “All polycrystalline membranes contain silver sulphide and thus will not give reliable readings if Ag or S ions are present in the solution”. The Interfering ions giving 10 % error with the ratios of concentration, are indicated in the table 6.
Ratio of concentration = Interfering ion / Measuring ion Cl BC S²- CN- S2O3
2- 1x10⁶ 5x10³ <10-6 0.4 1x10⁵
Table 6: Interfering ions with Iodide specific electrode
4. Attempts to reduce the sulphide impact Two kinds of attempt of limiting the impact of sulphide were carried out.
• Measurements were performed after (i) adding Zn acetate (0.5 %), a reagent leading to the precipitation of the sulphides as ZnS, and (ii) 0.45µm filtrating. The order values of 1 mg/L of iodide [I-] was measured on K-33 on 29/06).
• Measurements were also performed by doping geothermal site water (K-33) with iodide. They displayed that adding 0.1 mg/L and even 1 mg/L of iodide in such a fluid, did not change the signal value (on K-33, on 28/06).
This shows that matrix effects may be crucial as it occurred in the dynamic experiments on PFC behaviour at supercritical water conditions (Muller, 2016).
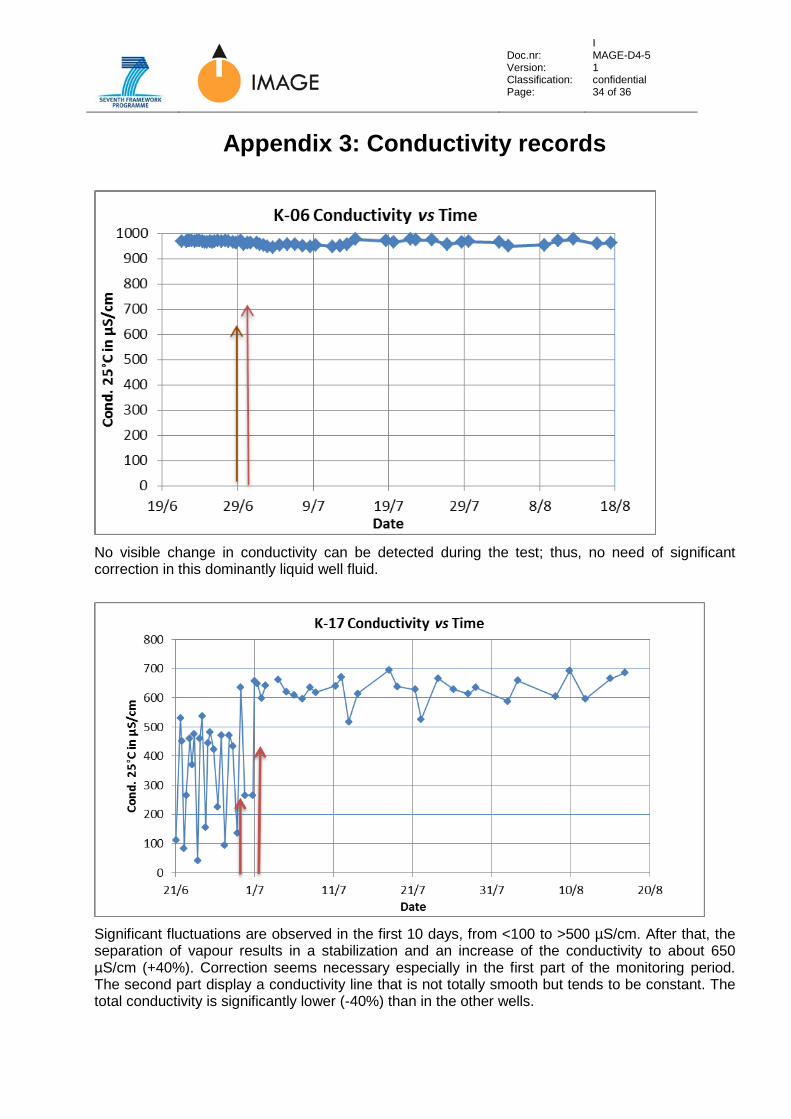
Doc.nr: Version: Classification: Page:
I MAGE-D4-5 1 confidential 34 of 36
Appendix 3: Conductivity records
No visible change in conductivity can be detected during the test; thus, no need of significant correction in this dominantly liquid well fluid.
Significant fluctuations are observed in the first 10 days, from <100 to >500 µS/cm. After that, the separation of vapour results in a stabilization and an increase of the conductivity to about 650 µS/cm (+40%). Correction seems necessary especially in the first part of the monitoring period. The second part display a conductivity line that is not totally smooth but tends to be constant. The total conductivity is significantly lower (-40%) than in the other wells.
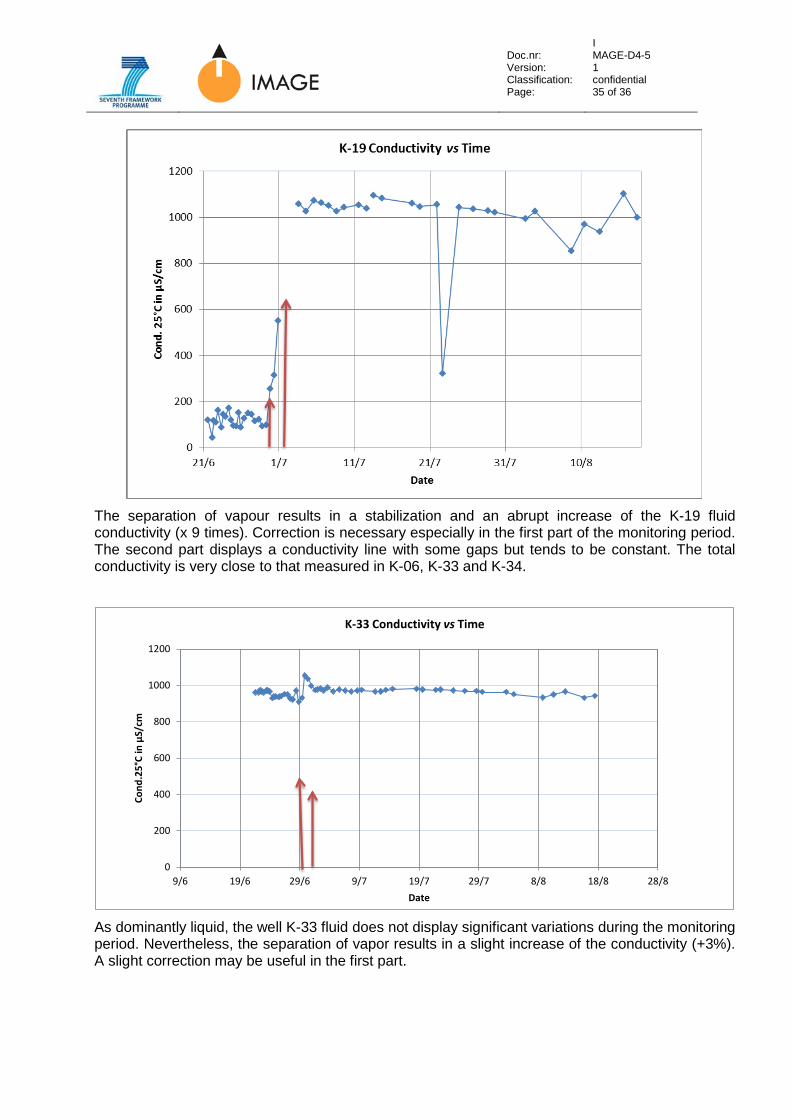
Doc.nr: Version: Classification: Page:
I MAGE-D4-5 1 confidential 35 of 36
The separation of vapour results in a stabilization and an abrupt increase of the K-19 fluid conductivity (x 9 times). Correction is necessary especially in the first part of the monitoring period. The second part displays a conductivity line with some gaps but tends to be constant. The total conductivity is very close to that measured in K-06, K-33 and K-34.
As dominantly liquid, the well K-33 fluid does not display significant variations during the monitoring period. Nevertheless, the separation of vapor results in a slight increase of the conductivity (+3%). A slight correction may be useful in the first part.
0
200
400
600
800
1000
1200
9/6 19/6 29/6 9/7 19/7 29/7 8/8 18/8 28/8
Cond
.25°
C in
µS/
cm
Date
K-33 Conductivity vs Time

Doc.nr: Version: Classification: Page:
I MAGE-D4-5 1 confidential 36 of 36
The separation of vapor results in a clear increase of the conductivity (+23%). A correction would therefore be useful in the first part.

Mixing and Injecting Tracers in Well KJ-39 in Krafla, NE-Iceland
Gylfi Páll Hersir Arnar Már Vilhjálmsson Prepared for IMAGE
Short report ÍSOR-16058 Project no.: 13-0388 05.07.2016

ICELAND GEOSURVEY Reykjavík: Orkugarður, Grensásvegur 9, 108 Rvk. – Tel: 528 1500 – Fax: 528 1699 Akureyri: Rangárvellir, Hlíðarfjallsvegur, 603 Ak. – Tel: 528 1500 – Fax: 528 1599
[email protected] – www.isor.is
Project manager’s signature Reviewed by
Daði Þorbjörnsson
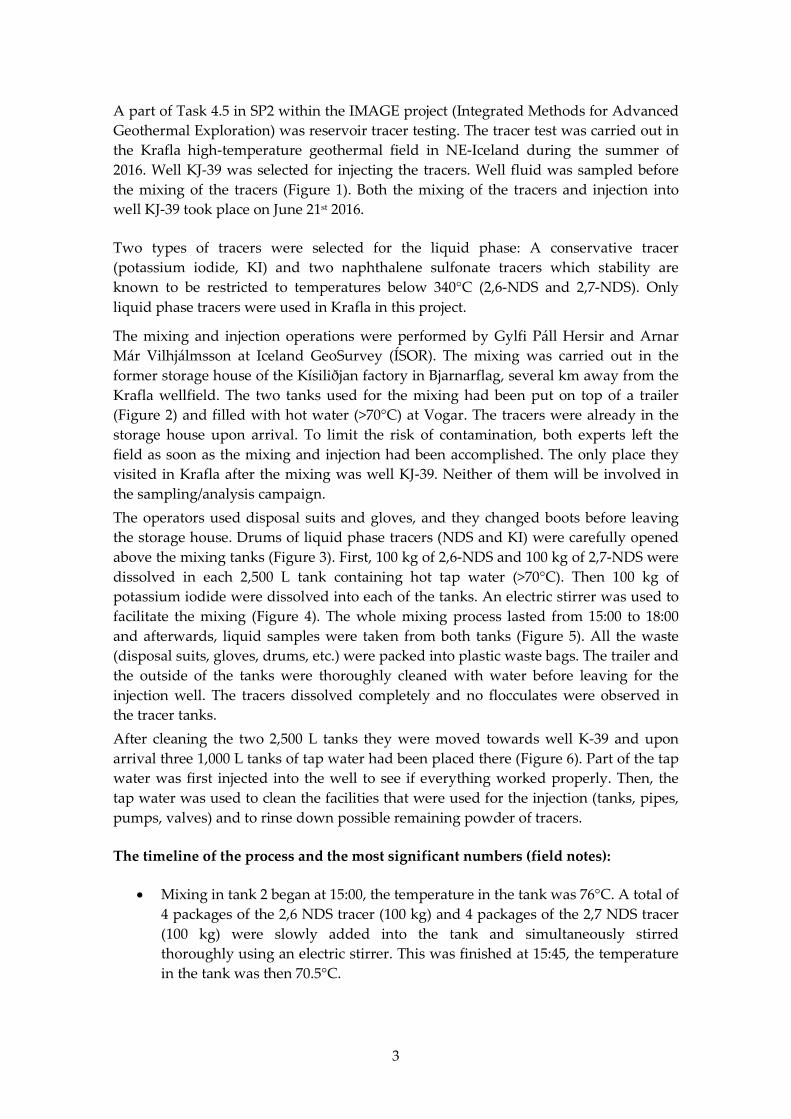
3
A part of Task 4.5 in SP2 within the IMAGE project (Integrated Methods for Advanced Geothermal Exploration) was reservoir tracer testing. The tracer test was carried out in the Krafla high-temperature geothermal field in NE-Iceland during the summer of 2016. Well KJ-39 was selected for injecting the tracers. Well fluid was sampled before the mixing of the tracers (Figure 1). Both the mixing of the tracers and injection into well KJ-39 took place on June 21st 2016.
Two types of tracers were selected for the liquid phase: A conservative tracer (potassium iodide, KI) and two naphthalene sulfonate tracers which stability are known to be restricted to temperatures below 340°C (2,6-NDS and 2,7-NDS). Only liquid phase tracers were used in Krafla in this project.
The mixing and injection operations were performed by Gylfi Páll Hersir and Arnar Már Vilhjálmsson at Iceland GeoSurvey (ÍSOR). The mixing was carried out in the former storage house of the Kísiliðjan factory in Bjarnarflag, several km away from the Krafla wellfield. The two tanks used for the mixing had been put on top of a trailer (Figure 2) and filled with hot water (>70°C) at Vogar. The tracers were already in the storage house upon arrival. To limit the risk of contamination, both experts left the field as soon as the mixing and injection had been accomplished. The only place they visited in Krafla after the mixing was well KJ-39. Neither of them will be involved in the sampling/analysis campaign. The operators used disposal suits and gloves, and they changed boots before leaving the storage house. Drums of liquid phase tracers (NDS and KI) were carefully opened above the mixing tanks (Figure 3). First, 100 kg of 2,6-NDS and 100 kg of 2,7-NDS were dissolved in each 2,500 L tank containing hot tap water (>70°C). Then 100 kg of potassium iodide were dissolved into each of the tanks. An electric stirrer was used to facilitate the mixing (Figure 4). The whole mixing process lasted from 15:00 to 18:00 and afterwards, liquid samples were taken from both tanks (Figure 5). All the waste (disposal suits, gloves, drums, etc.) were packed into plastic waste bags. The trailer and the outside of the tanks were thoroughly cleaned with water before leaving for the injection well. The tracers dissolved completely and no flocculates were observed in the tracer tanks. After cleaning the two 2,500 L tanks they were moved towards well K-39 and upon arrival three 1,000 L tanks of tap water had been placed there (Figure 6). Part of the tap water was first injected into the well to see if everything worked properly. Then, the tap water was used to clean the facilities that were used for the injection (tanks, pipes, pumps, valves) and to rinse down possible remaining powder of tracers.
The timeline of the process and the most significant numbers (field notes):
• Mixing in tank 2 began at 15:00, the temperature in the tank was 76°C. A total of 4 packages of the 2,6 NDS tracer (100 kg) and 4 packages of the 2,7 NDS tracer (100 kg) were slowly added into the tank and simultaneously stirred thoroughly using an electric stirrer. This was finished at 15:45, the temperature in the tank was then 70.5°C.
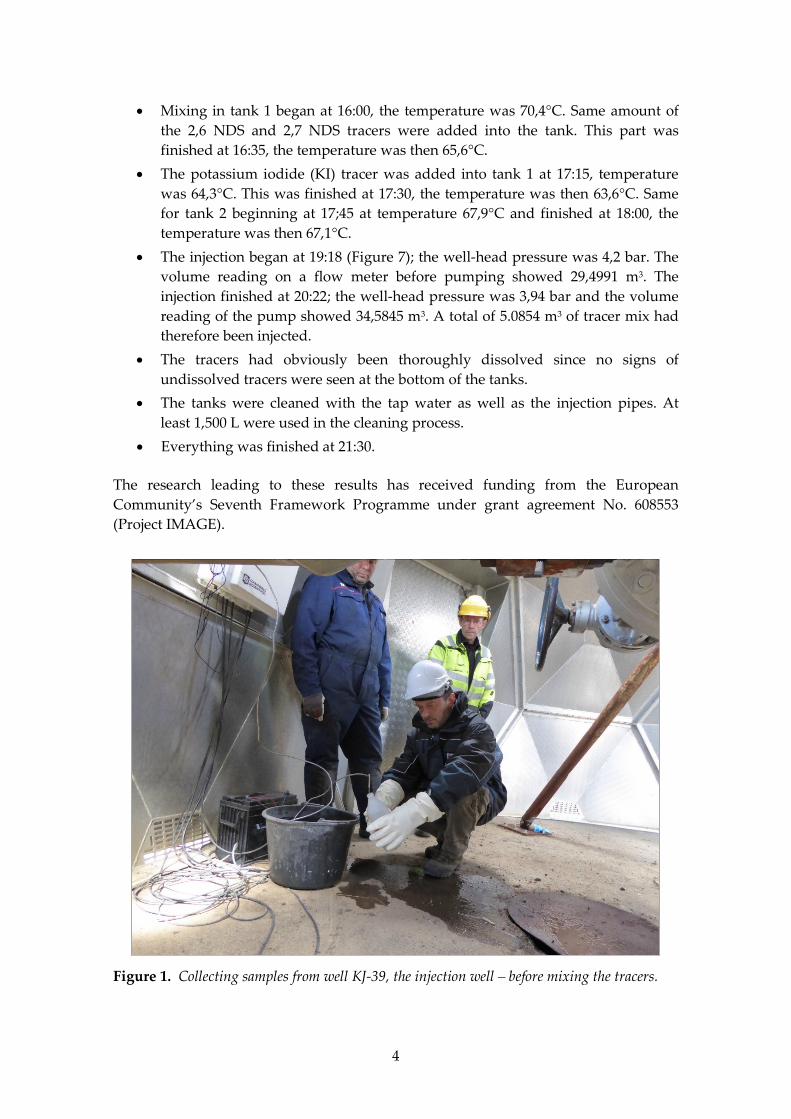
4
• Mixing in tank 1 began at 16:00, the temperature was 70,4°C. Same amount of the 2,6 NDS and 2,7 NDS tracers were added into the tank. This part was finished at 16:35, the temperature was then 65,6°C.
• The potassium iodide (KI) tracer was added into tank 1 at 17:15, temperature was 64,3°C. This was finished at 17:30, the temperature was then 63,6°C. Same for tank 2 beginning at 17;45 at temperature 67,9°C and finished at 18:00, the temperature was then 67,1°C.
• The injection began at 19:18 (Figure 7); the well-head pressure was 4,2 bar. The volume reading on a flow meter before pumping showed 29,4991 m3. The injection finished at 20:22; the well-head pressure was 3,94 bar and the volume reading of the pump showed 34,5845 m3. A total of 5.0854 m3 of tracer mix had therefore been injected.
• The tracers had obviously been thoroughly dissolved since no signs of undissolved tracers were seen at the bottom of the tanks.
• The tanks were cleaned with the tap water as well as the injection pipes. At least 1,500 L were used in the cleaning process.
• Everything was finished at 21:30.
The research leading to these results has received funding from the European Community’s Seventh Framework Programme under grant agreement No. 608553 (Project IMAGE).
Figure 1. Collecting samples from well KJ-39, the injection well – before mixing the tracers.

5
Figure 2. The two tanks (tank 2 is the one closer to the truck) and the tracers on the trailer, the
electric stirrer and the mixing crew.
Figure 3. Preparing to add the tracers gently into the tanks.
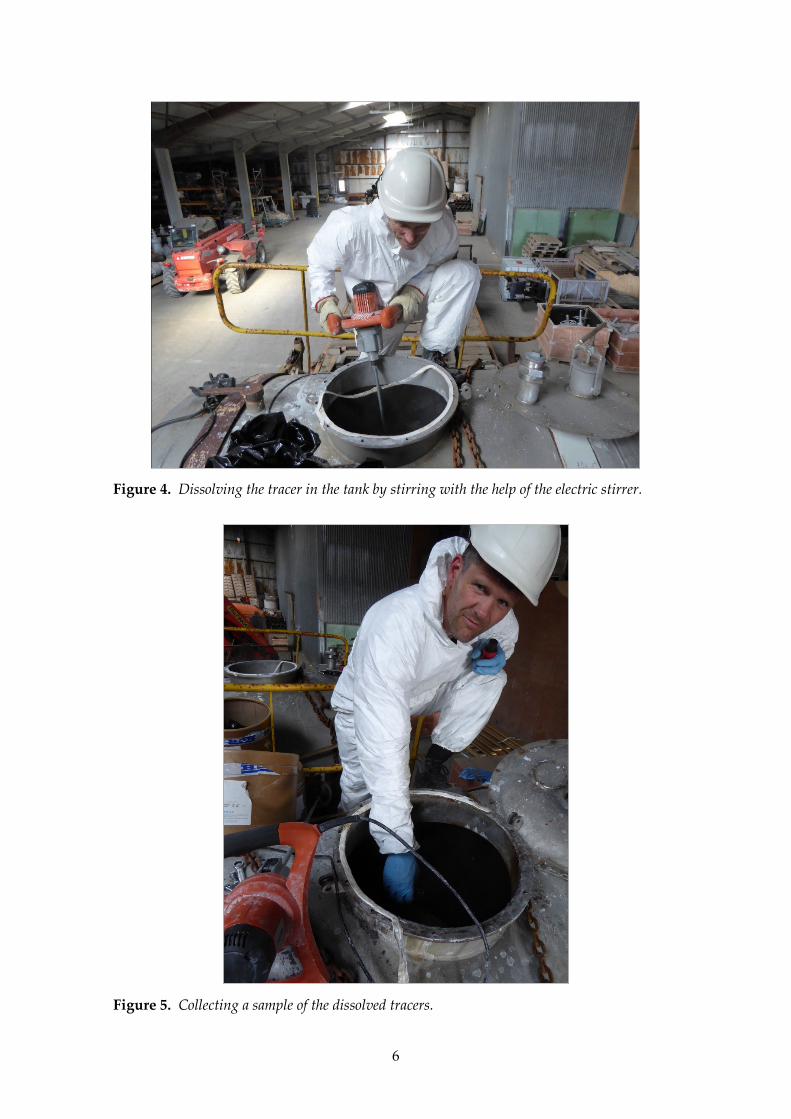
6
Figure 4. Dissolving the tracer in the tank by stirring with the help of the electric stirrer.
Figure 5. Collecting a sample of the dissolved tracers.

7
Figure 6. The pump and the trailer with the tanks and clean water in front of well KJ-39.
Figure 7. Injection of the tracer through the black pipe into well KJ-39 using the pump.