Embed Size (px)
Citation preview
ALJ/DUG/hkr Date of Issuance 10/29/2010
Decision 10-10-035 October 28, 2010
BEFORE THE PUBLIC UTILITIES COMMISSION OF THE STATE OF CALIFORNIA
In the Matter of the Application of San Jose Water Company (U168W) for Authority to Determine its Cost of Capital and to Apply that Cost of Capital in Rates for the Period From January 1, 2010 through December 31, 2012.
Application 09-05-001(Filed May 1, 2009)
And Related Matters.Application 09-05-002Application 09-05-003Application 09-05-004Application 09-05-005
DECISION ON BASE YEAR 2010 COST OF CAPITAL AND SUBSEQUENT YEARS’ ADJUSTMENT MECHANISM
FOR SAN JOSE WATER COMPANY, VALENCIA WATER COMPANY, PARK WATER COMPANY AND APPLE VALLEY RANCHOS WATER
COMPANY, SAN GABRIEL VALLEY WATER COMPANY, AND SUBURBAN WATER SYSTEMS
436524 - 1 -
A.09-05-001 et al. ALJ/DUG/hkr
TABLE OF CONTENTS (continued)
Title Page
DECISION ON BASE YEAR 2010 COST OF CAPITAL AND SUBSEQUENT YEARS’ ADJUSTMENT MECHANISM FOR SAN JOSE WATER COMPANY, VALENCIA WATER COMPANY, PARK WATER COMPANY AND APPLE VALLEY RANCHOS WATER COMPANY, SAN GABRIEL VALLEY WATER COMPANY, AND SUBURBAN WATER SYSTEMS...............................................................................................2
1. Summary............................................................................................22. Jurisdiction and Background..............................................................53. Regulatory Environment....................................................................54. Summary of Applicants’ Requests......................................................65. Summary of DRA’s Recommendations...............................................76. Today’s Capital Markets.....................................................................7
6.1. 2008-2010 Financial Markets Environment.............................76.2. Government Action in the Financial Markets...........................96.3. Current Capital Conditions and the Volatility between
Stocks and Bonds.......................................................................96.4. Water and Gas Distribution Stocks Compared
to Stocks in General.................................................................116.5. Conclusion..............................................................................12
7. Proxy Groups for Modeling..............................................................127.1. Prior Commission Decisions on Proxy Groups........................127.2. Proxy Groups..........................................................................147.3. Discussion...............................................................................157.4. San Jose..................................................................................167.5. Valencia..................................................................................177.6. Park/Apple..............................................................................177.7. San Gabriel.............................................................................177.8. Suburban................................................................................18
8. Cost of Debt and Capital Structure..................................................198.1. Costs of Long-Term Debt and Preferred Stock.......................23
8.1.1. DRA’s Proposed Cost of Debt........................................248.2. Discussion...............................................................................268.3. Actual and Imputed Capital Structures..................................26
9. The Cost of Equity............................................................................279.1. Caution When Using Financial Models...................................279.2. Legal Standard.......................................................................30
10. Return on Equity and Market to Book Ratio..................................3110.1. Utility Investment Risk Compared to Other Industries........32
- i -
A.09-05-001 et al. ALJ/DUG/hkr
TABLE OF CONTENTS (continued)
Title Page
11. DRA’s Discounted Cash Flow Model..............................................3311.1. DRA’s Use of the Dividend Discount Model Version
of Discounted Cash Flow..........................................................3311.2. DRA Used a Discounted Cash Flow Model to Establish
Stockholders’ Expected or Required Return............................3411.3. Factors That Affect Discounted Cash Flow...........................3411.4. Use of Historical Earnings Growth, Dividends,
and Internal Growth.................................................................3411.5. DRA’s Analysis for Its Two Proxy Groups.............................3511.6. DRA Used Wall Street Analysts’ Earnings per
Share Growth...........................................................................3611.7. Historical Growth for DRA’s Proxy Groups...........................3611.8. Projected Growth Rates for DRA’s Two Proxy Groups.........3711.9. DRA’s Use of Analysts’ Forecasts of Expected 5-year
Earnings per Share Growth for Proxy Groups.........................3811.10. Summary of DRA’s Analysis................................................3911.11. DRA’s Return on Equity Using the Discounted
Cash Flow Model for the Two Proxy Groups............................4012. Applicants’ Discounted Cash Flow Analysis...................................40
12.1. San Jose................................................................................4012.2. Valencia................................................................................4112.3. Park/Apple............................................................................4112.4. San Gabriel...........................................................................4212.5. Suburban..............................................................................42
13. Capital Asset Pricing Model and Other Risk Premium Models......4313.1. The Risk-Free Interest Rate..................................................4413.2. DRA’s Capital Asset Pricing Model Risk-Free Interest Rate.4513.3. Capital Asset Pricing Model Betas........................................4513.4. Alternative Views on Equity Risk Premium..........................4513.5. DRA’s Capital Asset Pricing Models Results........................46
14. DRA’s Base Return on Equity Recommendation............................4615. Adopted Return on Equity..............................................................4716. Relative Risks and Company Specific Risks...................................48
16.1. Overview...............................................................................4816.2. DRA’s Relative Risk Analysis................................................49
16.2.1. DRA’s Relative Risk Study...........................................5016.2.2. DRA’s Risk Premium Adjustments to Its
Proposed 9.75% Benchmark Return on Equity.............51
- ii -
A.09-05-001 et al. ALJ/DUG/hkr
TABLE OF CONTENTS (continued)
Title Page
16.3. The Relevance of Size...........................................................5216.4. Park/Apple’s Firm Specific Risk Adjustment........................5416.5. Discussion.............................................................................5516.6. Suburban’s Risk Premium....................................................5716.7. Regulatory Risk....................................................................5716.8. Contamination Risk...............................................................5816.9. Summary of Risk Premium...................................................59
17. Schedule for Subsequent Cost of Capital Proceedings..................5917.1. Background...........................................................................5917.2. DRA’s Position......................................................................5917.3. Discussion.............................................................................61
18. Water Cost of Capital Adjustment Mechanism...............................6218.1. Summary...............................................................................6218.2. DRA.......................................................................................6218.3. San Gabriel...........................................................................6418.4. Suburban..............................................................................6418.5. Discussion.............................................................................64
19. Procedural Matters........................................................................6620. Comments on Proposed Decision...................................................6621. Assignment of Proceeding..............................................................68Findings of Fact....................................................................................69Conclusions of Law...............................................................................72ORDER..................................................................................................73
- iii -
A.09-05-001 et al. ALJ/DUG/hkr
DECISION ON BASE YEAR 2010 COST OF CAPITAL AND SUBSEQUENT YEARS’ ADJUSTMENT MECHANISM
FOR SAN JOSE WATER COMPANY, VALENCIA WATER COMPANY, PARK WATER COMPANY AND APPLE VALLEY RANCHOS WATER
COMPANY, SAN GABRIEL VALLEY WATER COMPANY, AND SUBURBAN WATER SYSTEMS
1. SummaryThis decision establishes the base year 2010 ratemaking return
on common equity for San Jose Water Company (San Jose), Valencia Water Company (Valencia), Park Water Company and its affiliate Apple Valley Ranchos Water Company (Park/Apple), San Gabriel Valley Water Company (San Gabriel), and Suburban Water Systems (Suburban). This is the first proceeding for these six companies where the sole subject is cost of capital, separated from a general rate case, pursuant to Decision (D.) 07-05-062, the most recent rate case plan for the Class A water utilities. The rate case plan established that return on equity would be addressed for these companies in a consolidated proceeding, considering company-specific factors, rather than the past practice of treating cost of capital as one other cost item in the general rate cases.
In this decision, we adopt a base return on equity of 10.20% for all six applicants along with an individual capital structure and weighted cost of capital for each company. We take note of the financial markets’ dislocation and therefore consider whether there are any extenuating circumstances of sufficient importance to warrant a departure from our normal procedures. The base return reflects the risk reductions inherent in all of the outstanding balancing accounts available to these companies including those with a Water Revenue Adjustment Mechanism and Modified Cost Balancing Account,
- 2 -

A.09-05-001 et al. ALJ/DUG/hkr
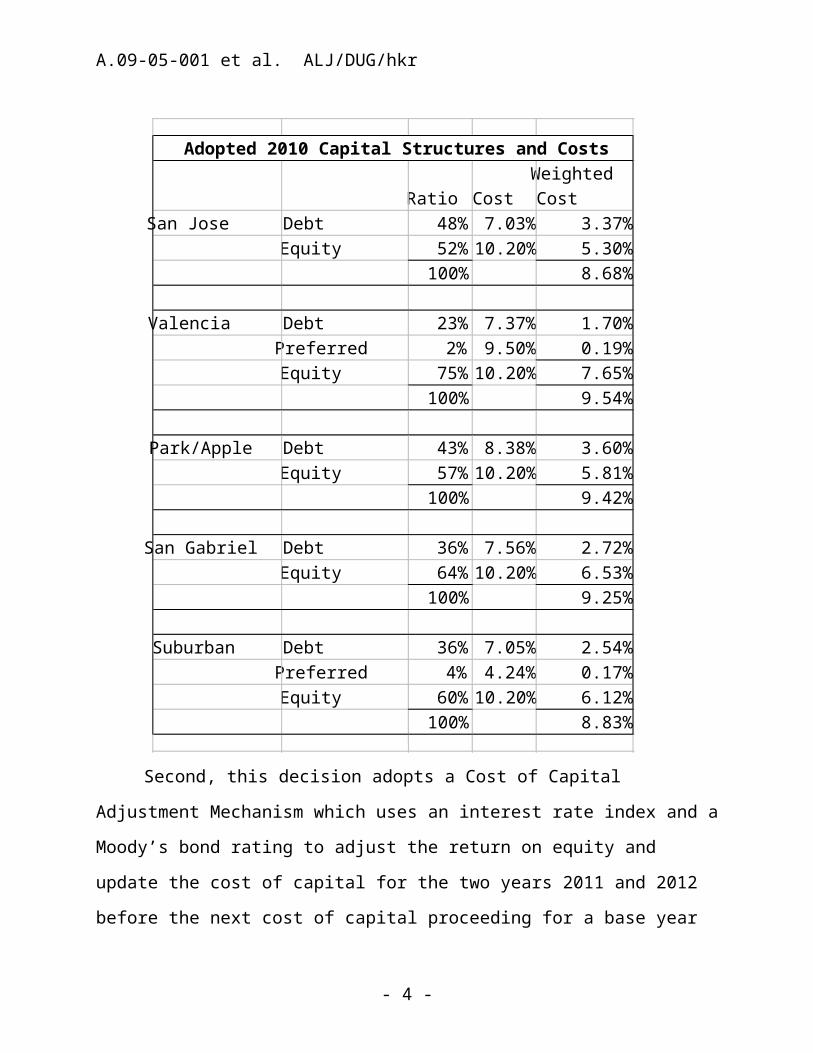
although consideration of these risk reductions is not reflected in the results of any financial modeling to date. Based on our consideration of all circumstances, we will adopt a base return of 10.20% which is between the recommendations made by intervenors and the requests by the utilities and is after considering individual risk profiles, which include relative size of operations, capital ratios, and location. We adopt the following company-specific ratios and equity returns:
- 3 -
A.09-05-001 et al. ALJ/DUG/hkr
Second, this decision adopts a Cost of Capital Adjustment Mechanism which uses an interest rate index and a Moody’s bond rating to adjust the return on equity and update the cost of capital for the two years 2011 and 2012 before the next cost of capital proceeding for a base year of 2013. This is the same mechanism recently adopted in D.09-07-051. For Valencia, we adopt a separate 2011 cost of capital to reflect a significant change in its capital ratio
- 4 -
Ratio CostWeighted Cost
San Jose Debt 48% 7.03% 3.37%Equity 52%10.20% 5.30%
100% 8.68%
Valencia Debt 23% 7.37% 1.70%Preferred 2% 9.50% 0.19%Equity 75%10.20% 7.65%
100% 9.54%
Park/Apple Debt 43% 8.38% 3.60%Equity 57%10.20% 5.81%
100% 9.42%
San Gabriel Debt 36% 7.56% 2.72%Equity 64%10.20% 6.53%
100% 9.25%
Suburban Debt 36% 7.05% 2.54%Preferred 4% 4.24% 0.17%Equity 60%10.20% 6.12%
100% 8.83%
Adopted 2010 Capital Structures and Costs
A.09-05-001 et al. ALJ/DUG/hkr
after this proceeding was submitted. We set aside submission for the purpose of modifying 2011 cost of capital for Valencia.1 We adjust the trigger mechanism otherwise used in D.09-07-051 to avoid an unintended reduction in return which may result from a high cost base year for the bond index which otherwise captures the unusual recent market instabilities.
Finally, this decision determines that San Jose shall file an application for a new 2012 base year cost of capital concurrent with the three large multi-district Class A water companies because it is much closer in size to those companies and much bigger than several of the other companies in this group. Additionally, Valencia shall file a separate cost of capital application concurrent with its next general rate case application so that its next base year for cost of capital coincides with its test year for the general rate case.
The specific cost impacts of this decision are not quantified and depend upon any other changes to revenue requirement scheduled for January 1, 2010. These proceedings are closed.
2. Jurisdiction and BackgroundApplicants are public utilities subject to the jurisdiction of this
Commission as defined in Section 218 of the Public Utilities Code.2 Applicants seek adoption of a base year 2010 cost of capital which will apply to all of their California-jurisdictional operations.
The applications were consolidated pursuant to Rule 7.4 of the Commission’s Rules of Practice and Procedure. The consolidation of
1 Valencia’s June 16, 2010 motion was unopposed, DRA supports using the more recent data in its reply comments on the proposed decision. This results in a substantial change to 2011’s cost of capital.2 All statutory references are to the Public Utilities Code unless otherwise stated.
- 5 -

A.09-05-001 et al. ALJ/DUG/hkr
these applications does not necessarily mean that a uniform return on equity should be applied to each of the utilities. This is because each of these utilities needs to be considered both individually and as part of an industry before arriving at a reasonable return.
3. Regulatory EnvironmentOur regulatory framework for the Class A water utilities in
California, including these six companies,3 is a strong and responsive framework and is recognized as such. It provides stable and predictable reviews in the form of general rate cases where we examine in detail and adopt a revenue requirement sufficient to provide an opportunity to recover reasonable operating costs. Additionally, we carefully review and determine an appropriate cost of capital and return on equity. This consolidated proceeding is a specific regulatory enhancement adopted in the latest rate case plan for water utilities. Finally, we provide individually for each company based upon reasonable showing of need a comprehensive array of balancing accounts and memorandum accounts which assure recovery of reasonably incurred costs and provide an opportunity to address numerous unpredictable events ill-suited to inclusion in general rate cases. Thus, the regulatory framework provides timely reasonableness reviews of these numerous balancing and memorandum accounts that recover significant portions of the companies’ costs free of the forecast risk inherent in general rate cases.3 We refer to six companies because Park Water Company (Park) and Apple Valley Ranchos Water Company (Apple Valley) are otherwise separately regulated with independent revenue requirements and rates. Because of their common ownership, we can set a single cost of capital for both companies. We note that the application asked for a single capital structure and cost of capital and did not distinguish the two operations.
- 6 -

A.09-05-001 et al. ALJ/DUG/hkr
We know that California depends on having financially viable public utilities, and therefore all of our decisions must ensure that these regulated entities have a reliable process to recover just and reasonable costs and an opportunity to earn a fair return.
4. Summary of Applicants’ Requests For 2010, San Jose Water Company (San Jose) requests a
12.12% return on equity and a 51.81% common equity ratio; Valencia Water Company (Valencia) requests a 12.10% return on equity and a 74.60% common equity ratio; Park Water Company and Apple Valley Ranchos Water Company (Park/Apple) requests an 11.90% return on equity and a 56.89% common equity ratio; San Gabriel Valley Water Company (San Gabriel) requests a 12.95% return on equity and a 62.10% common equity ratio; and Suburban Water Systems (Suburban) requests an 11.75% return on equity and a 59.51% common equity ratio.
5. Summary of DRA’s Recommendations Division of Ratepayer Advocates’ (DRA) recommended returns
on equity for Applicants are derived from a base return of 9.75% and then adjusted based on DRA’s evaluation of individual risk which raises one company, Valencia, to 10%, and lowers Suburban to 9.5%. Thus, its final 2010 recommendations are: San Jose a 9.75% return on equity; Valencia a 10% return on equity; Park/Apple a 9.75% return on equity; San Gabriel a 9.75% return on equity; and Suburban a 9.5% return on equity.
- 7 -
A.09-05-001 et al. ALJ/DUG/hkr
Additionally, DRA developed imputed capital structures and cost of debt based on its proxy company analysis, i.e., adjusting the capital structure to fit its recommended range for return on equity. Finally, DRA supported the adoption of a Water Cost of Capital Adjustment Mechanism based on the mechanism recently adopted in Decision (D.) 09-05-051.
6. Today’s Capital MarketsIn general, companies’ long-term capital cost rates for debt and
equity are equal to required returns on risk-free securities plus a risk premium associated with each company. For a public utility, other factors may affect the appropriate return on equity such as the regulatory environment and the specific operations of the individual company.
6.1. 2008-2010 Financial Markets EnvironmentThe financial markets in the United States are suffering a
significant and prolonged dislocation in large part due to the home mortgage lending market and other credit market problems, which directly led to the failures or mergers of many long-standing financial institutions. The economy has since entered a stage of recession and slow recovery. In response, there has been the federal government’s intervention including the “Emergency Economic Stabilization Act of 2008,’’ H.R. 1424 (Public Law 110 343), with a stated purpose, amongst others, “to immediately provide authority and facilities that the Secretary of the Treasury can use to restore liquidity and stability to the financial system of the United States.”4 This followed closely on
4 http://frwebgate.access.gpo.gov/cgi-bin/getdoc.cgi?dbname=110_cong_bills&docid=f:h1424enr.txt.pdf. See Section 2(1); and also:
- 8 -

A.09-05-001 et al. ALJ/DUG/hkr
the heels of the earlier “Housing and Economic Recovery Act of 2008,” H.R. 3221 (Public Law 110 289).5 And, in early 2009, the new administration enacted the American Recovery and Reinvestment Act of 2009 (Public Law 111-5).6 This act was intended to make “supplemental appropriations for job preservation and creation, infrastructure investment, energy efficiency and science, assistance to the unemployed, and State and local fiscal stabilization, for the fiscal year ending September 30, 2009, and for other purposes.” Although we are more than a year into the recovery process, we still face a confused and uncertain financial environment as we consider a base year 2010 cost of capital for these six companies.
6.2. Government Action in the Financial Markets DRA asserts that the massive government spending and Federal
Reserve actions have successfully affected the credit markets and that the worst of the credit crisis is over. Additionally, the short-term credit market has loosened up considerably. LIBOR7 rates peaked in the fall of 2008 and have declined. Likewise, the long-term credit market appears to be loosening up, as credit spreads have declined.
SEC. 101. PURCHASES OF TROUBLED ASSETS. (a) Offices; Authority (1) AUTHORITY - The Secretary is authorized to establish the Troubled Asset Relief Program (or ‘TARP’) to purchase, and to make and fund commitments to purchase, troubled assets from any financial institution, on such terms and conditions as are determined by the Secretary, and in accordance with this Act and the policies and procedures developed and published by the Secretary.5 http://frwebgate.access.gpo.gov/cgi-bin/getdoc.cgi?dbname=110_cong_public_laws&docid=f:publ289.110.pdf.6 http://frwebgate.access.gpo.gov/cgi-bin/getdoc.cgi?dbname=111_cong_bills&docid=f:h1enr.txt.pdf.7 The London Interbank Offered Rate (LIBOR) is a daily reference rate based on the interest rates at which banks borrow unsecured funds from other banks in the London wholesale money market (or interbank market).
- 9 -

A.09-05-001 et al. ALJ/DUG/hkr
In addition, the stock market has rebounded significantly from its lows in March of 2009.
Applicants on the other hand assert that there is significant risk to them. Park for example argues there will be a slow recovery and that equity costs reflect this (Park Opening Brief at 4) and we note that to date it has been a slow but steady recovery.
As we have moved into 2010, we continue to see an economy which is only slowly recovering; unemployment remains high and the stock market overall has seen slow improvements while still having many “down days.” We believe that we must continue to provide a stable foundation, a consistent return on equity, which allows the utilities to provide safe and reliable service to ratepayers and attract and retain investors.
6.3. Current Capital Conditions and the Volatility between Stocks and Bonds
To assess the effect of recent capital market volatility on the equity risk premium and the equity cost rate, DRA argues we must look at the volatility of stocks relative to bonds in the recent timeframe.
DRA offered in its testimony that a McKinsey & Co. (McKinsey) study entitled “Why the Crisis Hasn’t Shaken the Cost of Capital” demonstrates that the financial crisis has not significantly changed the firm’s long-term estimate of the equity risk premium, which DRA believes remains in the 3.5 to 4 percent range. According to DRA, McKinsey developed an equity risk premium based on the price level of the Standard & Poor’s 500, Gross Domestic Product growth, and corporate profits. DRA argues the McKinsey study shows that “[t]aking all these factors into account, we think there has been no
- 10 -

A.09-05-001 et al. ALJ/DUG/hkr
significant change in the long-term cost of equity capital.”8 (Exhibit DRA-1 at 12.)
Valencia argues, relying on testimony offered jointly for Park/Apple and San Gabriel, that although a recovery has begun, because “[interest rate] spreads continue to be much higher than in the past”—indicating that “we are not out of the woods with respect to financial markets” (citing to Ex. SG-5 at 48) and that “a brighter employment picture and stabilizing home prices are still missing from the recovery puzzle.” (Valencia Opening Brief at 4–5.)
We agree with Applicants that the “employment picture” is still very worrisome, and we take note that the current California unemployment rates reported in the press are in the 10% range, which is quite high. We otherwise note that in May 2009 (when these applications were filed), the Dow Jones Industrial Average started and ended the month at approximately 8,500 points and by October 2009 (after submission and during our deliberative process) it started at 9,500 and ended at 9,700 points. This current value is still far below the Dow Jones Industrial Average values in May 2008, which started at 13,000 points and ended at 12,500 points.9 Thus a certain degree of recovery has occurred considering the March 6, 2009 low value of 6,600 points for the Dow Jones Industrial Average. So while we may not be “out of the woods,” we think we see a workable pathway. (The Dow Jones Industrial Average was at 9,774 points on June 30, 2010.)
8 Richard Dobbs, Bin Jang, and Timothy Koeller, “Why the Crisis Hasn’t Shaken the Cost of Capital,” McKinsey Quarterly (December 2008) at 6. 9 Dow Jones Industrial Average values were derived from charts available on line at finance/yahoo.com and numerous other sources.
- 11 -

A.09-05-001 et al. ALJ/DUG/hkr
6.4. Water and Gas Distribution Stocks Compared to Stocks in General
DRA compared the water utility and gas distribution stocks’ performance relative to the Standard & Poor’s 500 over the past year. (Exhibit DRA-1, Page 6 of Attachment JRW-3.) DRA claims that it compared the average stock price performance of its water utility and gas distribution proxy group versus the Standard & Poor’s 500’s price performance over the past year.
DRA asserts that over the year, the Standard & Poor’s 500 has declined 25.6%, while the water utility stocks have declined only 0.1% and gas distribution companies’ stocks have declined only 7.0%. Thus, DRA asserts the stocks of both water utilities and gas distribution companies have vastly outperformed the market and have held up extremely well in the current market. Further, according to DRA, the Standard & Poor’s 500 was over 3.5 times more risky than the Water Proxy Group stocks and was over 2.5 times more risky than the Gas Proxy Group stocks as measured by the coefficient of variation. Thus, water utility and gas distribution company stocks have been low risk investments in this down market.
Finally, DRA notes: . . . It is important to be mindful of how the industry has performed in the wake of the financial crisis that began in September of 2008. Water utility stocks have performed substantially better than the Standard and Poor’s 500 since that time. (Citation omitted.) Thus, the Applicants cannot make the case that their stock performance justifies an upward adjustment of their [cost of capital]. (DRA Reply Brief at 13.)
We are mindful that we must take the long view and not over-react to short-term fluctuations, even ones which span portions of several years.
- 12 -
A.09-05-001 et al. ALJ/DUG/hkr
6.5. ConclusionWe find that the debt markets and interest rates are still at near
all-time low rates, provided willing lenders are found. By our authorizing a continued and stable return on equity, thus assuring the opportunity for a prudently managed utility to be profitable, the utilities should be able to borrow to meet their reasonable needs for capital. We agree with DRA that the utility sector has been more stable than the market as a whole, and thus we do not see any significant increase in risk to California Class A water utilities due to the broader market problems.
7. Proxy Groups for Modeling
7.1. Prior Commission Decisions on Proxy GroupsThe Commission has been more than reluctant to apply a natural
gas proxy group to water utilities citing a belief that the industries are sufficiently different to distinguish the returns in one from the other. A proxy is a substitute. Companies selected as a proxy for a particular utility (or group of utilities) should have characteristics similar to the targeted utilities that the proxy companies are selected to represent. In order to assess comparability and reasonableness of financial model results, there should be no deviation from financial model to financial model of the companies selected for a proxy group. For each model, Applicants and DRA used data from the particular proxy groups they rely on as input to the model to derive their proposed return on equity.
In this proceeding, we had a mix of proxy groups and, as we discuss here, still find significant problems with the use of gas distribution companies as a proxy for water utilities—consistent with our very recent concerns for the three large multi-district water
- 13 -

A.09-05-001 et al. ALJ/DUG/hkr
companies. (D.09-05-019 at 15.) In that proceeding, we rejected the attempt in the absence of any new arguments or demonstration of any change of fact or condition: “Accordingly, we assigned no weight to the testimony that relies on the natural gas distribution companies as a proxy.” (D.09-05-019 at 16.)
In this proceeding, Applicants and DRA heeded our admonition in D.09-05-01910 and attempted to provide new arguments that would warrant our re-examining natural gas distribution companies as a reasonable proxy for water companies. Our concern here is that these Class A companies, except for San Jose, are significantly smaller than the three applicants in A.08-05-002 et al. Therefore, although we will review the arguments for natural gas proxy, we do so with great caution, because we believe the comparison likely has a greater size disparity (the size of the gas distribution companies) between the applicants here and the applicants in A.08-05-002 et al., and our habitual conclusion that water and gas utilities are not directly comparable.
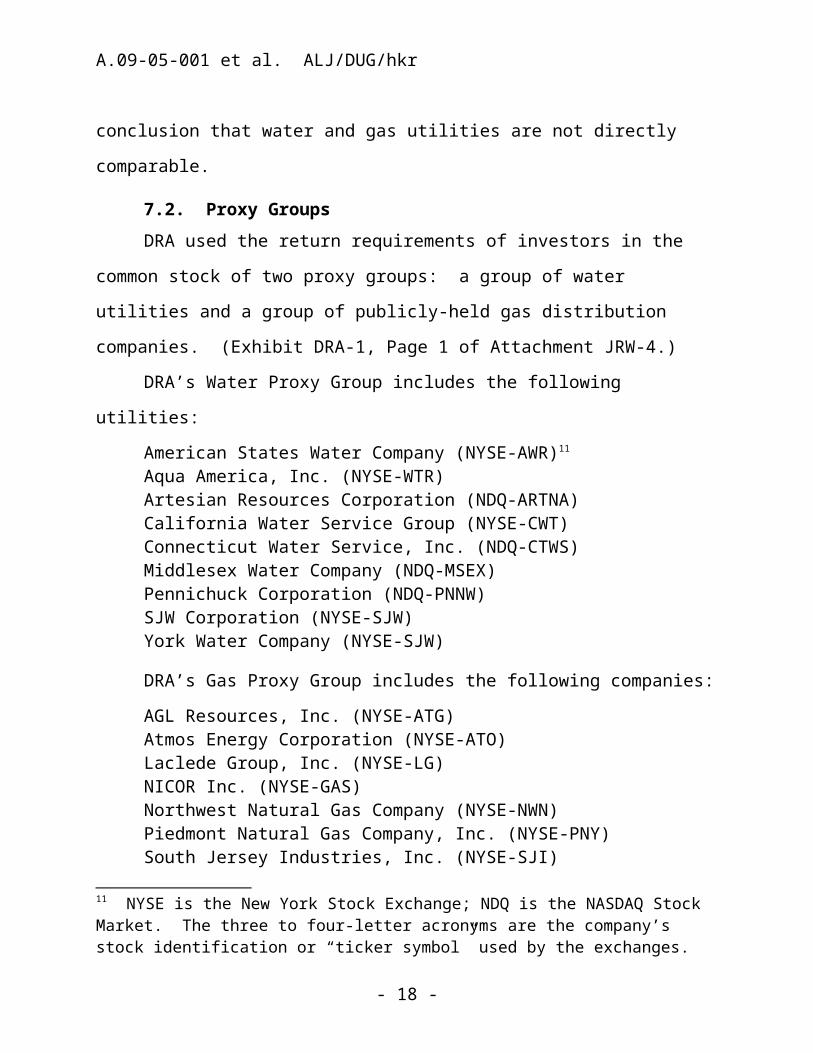
7.2. Proxy GroupsDRA used the return requirements of investors in the common
stock of two proxy groups: a group of water utilities and a group of publicly-held gas distribution companies. (Exhibit DRA-1, Page 1 of Attachment JRW-4.)
DRA’s Water Proxy Group includes the following utilities:American States Water Company (NYSE-AWR)11
Aqua America, Inc. (NYSE-WTR)10 Although D.09-05-019 was not adopted until May 7, 2009 (published May 8, 2009), the proposed decision was first served on December 19, 2008. Thus we presume parties, DRA in particular, were aware of the proposed decision and the continuation of the policy to exclude natural gas proxies for water companies.
- 14 -
A.09-05-001 et al. ALJ/DUG/hkr
Artesian Resources Corporation (NDQ-ARTNA)California Water Service Group (NYSE-CWT)Connecticut Water Service, Inc. (NDQ-CTWS)Middlesex Water Company (NDQ-MSEX)Pennichuck Corporation (NDQ-PNNW)SJW Corporation (NYSE-SJW)York Water Company (NYSE-SJW)
DRA’s Gas Proxy Group includes the following companies:AGL Resources, Inc. (NYSE-ATG)Atmos Energy Corporation (NYSE-ATO)Laclede Group, Inc. (NYSE-LG)NICOR Inc. (NYSE-GAS)Northwest Natural Gas Company (NYSE-NWN)Piedmont Natural Gas Company, Inc. (NYSE-PNY)South Jersey Industries, Inc. (NYSE-SJI)Southwest Gas Corporation (NYSE-SWX)WGL Holdings, Inc. (NYSE-WGL)
DRA included an analysis for the Gas Proxy Group in estimating an equity cost rate for the water companies for two reasons. First, it believes the financial data needed to perform a Discounted Cash Flow analysis for the Water Proxy Group is limited. For example, the Value Line Investment Survey provides projections for only three companies in the Water Proxy Group.12 In addition, DRA believes that financial analysts’ coverage of the water companies is also limited. In contrast, DRA argues that “better data” is available for the Gas Proxy Group to perform a Discounted Cash Flow equity cost rate study. Second, DRA believes the return requirements for investors in gas companies should be similar to the requirements of water company investors. DRA notes that both industries are capital intensive and heavily 11 NYSE is the New York Stock Exchange; NDQ is the NASDAQ Stock Market. The three to four-letter acronyms are the company’s stock identification or “ticker symbol” used by the exchanges.12 Value Line is a stock analysis service with various publications. http://www.valueline.com/.
- 15 -
A.09-05-001 et al. ALJ/DUG/hkr
regulated, are characterized by a lack of competition, and provide distribution and delivery of an essential commodity where both retail rates and return on equity are set by state regulatory commissions.
DRA assessed risk of the two groups using six different risk measures published by Value Line. These measures include Beta, Safety, Financial Strength, Stock Price Stability, Price Growth Persistence, and Earnings Predictability. According to DRA, the two groups have similar risks as indicated by comparing their respective Price Growth Persistence and Earnings Predictability. However, Beta, Safety, Financial Strength, and Stock Price Stability measures indicate the Gas Proxy Group is slightly less risky than the Water Proxy Group. Overall, DRA believes the Gas Proxy Group is less risky than the Water Proxy Group based on the Value Line risk metrics.
7.3. DiscussionWe discount DRA’s first reason to use gas utilities as irrelevant:
the availability of “better data” does not matter when that better data is for a different industry. Because the fact that there is better data for natural gas utilities is irrelevant, the conclusion that the Value Line risk measures show the water companies (using presumably bad data) are more risky than the gas utilities is irrelevant as well. Therefore, as in the past, we must remain highly skeptical of any direct risk comparison of water and natural gas distribution companies.
7.4. San JoseSan Jose used two proxy groups, water utilities and natural gas
utilities. It applied seven criteria for its selection: (1) the companies were included in the AUS Utility Reports; (2) there were five-year earnings per share growth rate projections; (3) they had a positive
- 16 -
A.09-05-001 et al. ALJ/DUG/hkr
five-year dividends per share growth projection; (4) Value Line determined an adjusted beta for them; (5) there was no cut or omission of dividends in common dividends for the five years ending in 2008; (6) the companies derived 60% or more income from, and 60% or more assets were devoted to, water service; and (7) the companies were not involved publicly in any merger or acquisition. We note that these criteria would have an upward bias in the modeling results by excluding less successful companies from the group.13 San Jose applied the same criteria to select nine successful natural gas utilities.14 We similarly reject San Jose’s use of gas proxies.
7.5. ValenciaValencia’s sample group was: American States Water Company,
Aqua America, Inc., California Water Service Group, Connecticut Water Services, Inc., Middlesex Water Company, and SJW Corporation. (Exhibit VWC-1 at 18-20.) Thus, its proxy group differed slightly from San Jose’s and its financial modeling results varied because of the different proxy-related input data and other modeling inputs.
7.6. Park/ApplePark/Apple argues that DRA should not include Pennichuck
Corporation, arguing that although DRA’s witness now believes the
13 The water companies in this group were: American States Water Company, Aqua America, Inc., California Water Service Group, Middlesex Water Company, SJW Corporation, and York Water Company.14 The natural gas companies in this group were: AGL Resources, Inc., Atmos Energy Corporation, Chesapeake Utilities, Delta Natural Gas Company, Laclede Group, Inc., Northwest Natural Gas Company, Piedmont Natural Gas Company, Inc., Southwest Gas Corporation, and WGL Holdings, Inc.
- 17 -

A.09-05-001 et al. ALJ/DUG/hkr
company’s condemnation was not active, it should be excluded. Park/Apple argues that DRA is systematically trying to bias downward the results of its analysis. (Park Opening Brief at 7.) Park/Apple has concerns about including York Water Company and Artesian Resources Corporation in Capital Asset Pricing Model estimates arguing the “beta” is biased for York Water Company and unavailable for Artesian Resources Corporation. (Park Opening Brief at 7.) Park/Apple further argues that if gas utilities are used at all, there should be an upward adjustment because gas companies are less risky. The company argues that DRA is off by “no less than 74 basis points” (Park Opening Brief at 8) in its misuse of gas utilities.
7.7. San GabrielSan Gabriel’s witness Zepp used a proxy group composed of
American States Water Company, American Water Works, Aqua America, Inc., California Water Service Group, Connecticut Water Service, Inc., Middlesex Water Company, and SJW Corporation. Again Pennichuck Corporation was excluded because of ongoing eminent domain litigation. (San Gabriel Opening Brief at 5–7 and citing Ex. SG-5 at 3-4.) San Gabriel and others argue DRA’s proxy group, including Pennichuck Corporation, “skews” the modeling results downward.
7.8. SuburbanSuburban’s proxy group was similar to the others, including
DRA, but did not include Artesian Resources Corporation and Pennichuck Corporation which were included in DRA’s proxy group. These companies’ inclusion has been problematic in other proceedings. (Suburban Opening Brief at 3–4.)
- 18 -
A.09-05-001 et al. ALJ/DUG/hkr
Suburban is very opposed to DRA’s use of the gas proxy group, arguing DRA’s inclusion of a gas proxy group is inappropriate:
In many ways, the water industry is significantly more risky than the gas industry. For example, because water is the only utility service that customers ingest, water utilities face unique health concerns. Also, the water utility industry is significantly more capital intensive than the gas distribution industry, and each new customer requires significant new investment, unlike the gas distribution industry, which can obtain additional load with minimal, if any, investment. Finally, unlike the gas distributors that have an abundance of supply, source of supply issues for water utilities are a significant concern, especially in California. (Suburban Opening Brief at 4, citing to Ex. SUB-3 at 10.)
We find these arguments are not supported by any analysis. For example, while it is true people drink water and there is an associated health risk, natural gas is extremely explosive and can also suffocate people. So there are other “unique” concerns with gas where we would have to analytically determine which risk is greater—death by water or death by gas. We also note that Suburban does not prove its assertion that water is more capital intensive or requires more new investment per customer.
8. Cost of Debt and Capital Structure Ratemaking capital structure is long-term debt, preferred stock,
and common equity.15 Because the level of financial risk that the utilities face is determined in part by the proportion of their debt to equity capital, or the degree of financial leverage, we must ensure that the utilities’ adopted equity ratios are sufficient to maintain reasonable credit ratings and to attract capital without incurring unnecessary costs for an excessive amount of expensive equity.15 Short-term debt due within one year is excluded.
- 19 -

A.09-05-001 et al. ALJ/DUG/hkr
Generally, long-term debt is the least expensive form of capital but the utility must ensure that it timely meets every interest payment and maintains any required terms or conditions of the loan agreements or mortgage indentures, and that it can refinance or refund the debt when it matures. Preferred stock is generally more expensive than debt and may or may not have a maturity or refund provision. Interest may usually be deferred but it then accumulates and takes preference over payment of dividends to common equity owners. Thus, equity owners assume more risk than either debt holders or preferred stock owners, including the risk of losing their entire investment, and therefore equity investors require the highest return over the long run.
The equity returns adopted in this proceeding are summarized below and discussed later. We are not persuaded to use an average capital structure to reflect the proxy groups as proposed by DRA (DRA Opening Brief at 45) nor will we be beguiled by a false precision of four decimal places. Therefore, we adopt and round to the nearest full percentage the proportion of debt requested by each applicant. As also noted in this decision, the proportion of equity has a direct bearing on risk, and we consider the assertions of company-specific risk (and requests for as much as a 90 basis point “adder” by Park/Apple16) in determining the fair return on equity for each company. We do find that the companies reasonably calculated their actual and 2010 forecast embedded costs of debt and preferred stock and therefore we adopt (after rounding) Applicants’ 2010 capital structures and embedded cost. In adopting these costs and ratios, we note, as discussed elsewhere, our long-term concern over the
16 Park/Apple Opening Brief at 1.
- 20 -

A.09-05-001 et al. ALJ/DUG/hkr
appropriate range of equity ratios for regulated Class A water utilities.
We noted our concern recently when a company has a high equity ratio:
We find equity components [for large Class A water companies] in excess of 50% to be problematic and have concerns about equity ratios less than 45%. It is this
- 21 -
Ratio CostWeighted Cost
San Jose Debt 48% 7.03% 3.37%Equity 52%10.20% 5.30%
100% 8.68%
Valencia Debt 23% 7.37% 1.70%Preferred 2% 9.50% 0.19%Equity 75%10.20% 7.65%
100% 9.54%
Park/Apple Debt 43% 8.38% 3.60%Equity 57%10.20% 5.81%
100% 9.42%
San Gabriel Debt 36% 7.56% 2.72%Equity 64%10.20% 6.53%
100% 9.25%
Suburban Debt 36% 7.05% 2.54%Preferred 4% 4.24% 0.17%Equity 60%10.20% 6.12%
100% 8.83%
Adopted 2010 Capital Structures and Costs

A.09-05-001 et al. ALJ/DUG/hkr
Commission’s responsibility to establish a safe range within which a company’s capital ratio may move and against which the cost of capital may be measured. In [A.08-05-002 et al.], there is a significant cost differential, compounded by the tax consequences of equity. (D.09-05-019 at 9.)
We again address the issue, noting in particular that San Jose is much larger than the other companies in this consolidated proceeding and closer in size to the three companies addressed in D.09-05-019. Further, Valencia, Park/Apple, and Suburban are very much smaller than San Jose while San Gabriel, is in-between in size. However, as a general rule, as the companies become smaller, we are more likely to find persuasive financially sound cost-based justifications for a higher equity ratio, as discussed in more detail below.
DRA argues that we should adopt an adjusted capital structure to reflect the return on equity derived from its proxy groups—that is, fit Applicants to the proxy rather than adapt the proxy results to Applicants. DRA proposed:
DRA has developed capital structures for the water companies that reflect both the individual company capitalizations as well as those of the proxy group of publicly-held water companies. This is necessary since the capitalizations of the water companies have higher common equity ratios than the companies in the proxy group which are used to determine [DRA’s proposed baseline] equity cost rate of 9.75%. (DRA Opening Brief at 45.)
We believe that the companies do have a significant control over the mix of debt and equity and that ratepayers should not bear unnecessary costs as a result of management discretion—the equity return is a market return for the assumption of like-risk in comparable
- 22 -
A.09-05-001 et al. ALJ/DUG/hkr
investment choices. Thus, even if, for the sake of argument, a smaller water company as a matter of course has a higher transaction cost and even a higher interest cost for debt, debt is almost always cheaper than equity and does not carry the added loading of an income tax allowance in rates. Therefore, if a company carries a high equity ratio, we should necessarily consider adjusting the return on equity. We are concerned here, however, that DRA is adjusting capital structure to fit its proxy group equity return recommendation rather than adjusting the study result to the companies’ capital structures. DRA does not argue that the companies’ proposed structures are inherently wrong, but explicitly argues for the change to fit its equity return recommendation. We reject such an adjustment here for all of the companies. As discussed elsewhere, we will, however, consider the actual equity ratios as a part of adopting a final return on equity.
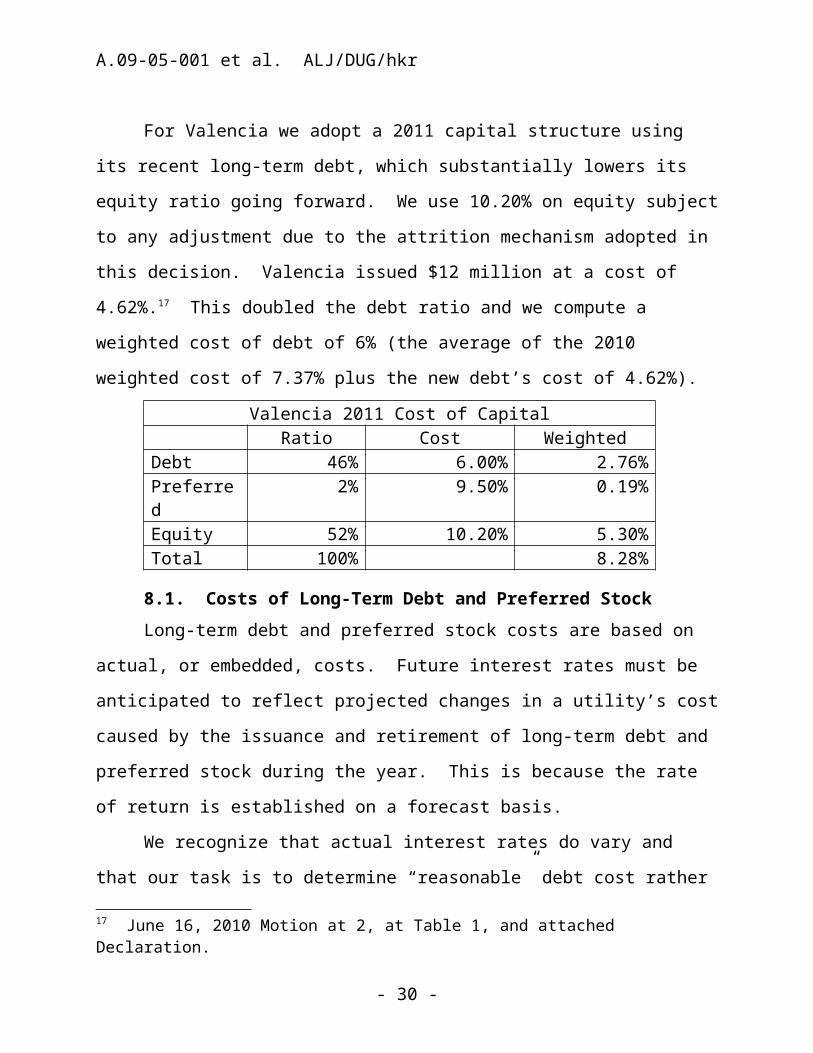
For Valencia we adopt a 2011 capital structure using its recent long-term debt, which substantially lowers its equity ratio going forward. We use 10.20% on equity subject to any adjustment due to the attrition mechanism adopted in this decision. Valencia issued $12 million at a cost of 4.62%.17 This doubled the debt ratio and we compute a weighted cost of debt of 6% (the average of the 2010 weighted cost of 7.37% plus the new debt’s cost of 4.62%).
Valencia 2011 Cost of CapitalRatio Cost Weighted
Debt 46% 6.00% 2.76%Preferred 2% 9.50% 0.19%Equity 52% 10.20% 5.30%Total 100% 8.28%
17 June 16, 2010 Motion at 2, at Table 1, and attached Declaration.
- 23 -

A.09-05-001 et al. ALJ/DUG/hkr
8.1. Costs of Long-Term Debt and Preferred StockLong-term debt and preferred stock costs are based on actual, or
embedded, costs. Future interest rates must be anticipated to reflect projected changes in a utility’s cost caused by the issuance and retirement of long-term debt and preferred stock during the year. This is because the rate of return is established on a forecast basis.
We recognize that actual interest rates do vary and that our task is to determine “reasonable” debt cost rather than actual cost based on an arbitrary selection of a past figure.18 In this regard, we conclude that the latest available interest rate forecast should be used to determine the forecast of additional debt included in the embedded debt for the forecast period. (See recently, D.07-12-049, and 38 CPUC2d 233, where 18 years ago, the Commission definitively discussed the need for, and use of, a reliable forecast of future interest costs.)
8.1.1. DRA’s Proposed Cost of Debt DRA used the proposed debt cost rates from Applicants for the
rate year 2010. It argued that to a large extent, forecasts of future interest rates are not accurate, and therefore the projected debt cost rates beyond 2010 are not useful. Thus, it would be improper to rely on the utilities’ proposed debt cost beyond 2010. For example, DRA indicates that San Gabriel did not have any bids at the time it served testimony or quotes for pricing out its anticipated debt issues. (Ex. SG-3, Table B, at 2 and 4.) DRA also notes that San Gabriel historically used a spread of 246 basis points to forecast its long-term debt rates for anticipated issues.19 DRA notes that San Gabriel
18 38 CPUC2d 233 at 242 and 243 (1990).19 DRA citing to Ex. SG-3 at 5.
- 24 -

A.09-05-001 et al. ALJ/DUG/hkr
imputed 492 basis points in forecasting the interest rate for the mortgage bonds it plans to issue in 2010 and 2012.
DRA argues that its testimony (Exhibit DRA-1, Page 2 of Attachment JRW-3) shows the spread for Utility BBB rated bonds peaked at 450 basis points in December 2008 and as of July 2009 were 250 basis points above treasury rates. DRA argues the financial markets have stabilized since the peak of the crisis and spreads are continuing to move downward towards historical trends.
DRA’s review of the 2010 through 2012 forecasted spreads between Baa Corporate Bonds and 30-Year Treasury Bonds is based on the May 2009 Global Insight Forecast. As shown in Exhibit DRA-1, Attachment JRW-22, the average spread over the three-year period (2010-2012) is 334 basis points based on the most recent Global Insight forecast. Also, the most recent Federal Reserve data shows that as of June 2009, the spread between Baa Corporate Bonds and 30-Year Treasury Bonds reached 300 basis points. (Attachment JRW-23.) This is a 256 basis point drop since its peak of 556 basis points reached in December 2008. This spread has continued to drop. As of August 2009, the spread between the Baa Corporate Bonds and 30-Year Treasury Bonds yields was 221 basis points. DRA requests, and we grant, that the Commission take notice of this information.
Other utilities have recently issued secured debt issues with spreads significantly lower than San Gabriel’s proposed 492 basis points. For example, in June 2009, Valencia issued $12 million in 30-year Senior Secured Notes at a rate of 7.73%,20 a spread of 321 basis points based on the historical June 2009, 30-Year Treasury Bonds
20 Exhibit VW-1 at 3.
- 25 -

A.09-05-001 et al. ALJ/DUG/hkr
yield of 4.5%. Also, Park issued two new first mortgage bonds in June 2008 with spreads of 285 and 300 basis points.
Thus, if San Gabriel’s spread is just slightly higher than its historical 246 basis points, recalculating the company’s weighted debt cost results in an average debt cost of 7.55% over the three-year period (Attachment JRW-24), compared to San Gabriel’s 7.81%. Therefore, DRA continues to assert that the weighted average debt cost for the utilities should be based in this case on 2010 projections rather than relying on forecasts beyond this period, which are inaccurate and will change substantially.
8.2. DiscussionWe agree with DRA that the utilities’ projected interest rate
spreads beyond 2010 are very high and rely on the early impacts of the financial market crisis. As noted elsewhere, we grant Valencia’s motion to use its large 2010 debt issuance to adjust its weighted cost and debt ratio for 2011.
8.3. Actual and Imputed Capital StructuresDRA proposed capital structures for the water companies that it
argued reflected both the individual company capitalizations as well as those of the proxy group of publicly-held water companies. This is necessary according to DRA because the capitalizations of the water companies have higher common equity ratios than the companies in the proxy group used to determine DRA’s recommended equity cost rate of 9.75%.
The companies used their existing capital structures and forecast likely retirements, refinancing, and new debt issues for 2010 through 2012. We find the Applicants’ forecasts of debt and preferred costs for 2010 to be reasonable.
- 26 -

A.09-05-001 et al. ALJ/DUG/hkr
We are concerned, however, that Valencia has a very high 2010 equity ratio over 70% and San Gabriel comes in over 60%. These high equity ratios significantly drive total cost to ratepayers higher because of both the higher return applied to equity over debt and the required allowance for income taxes. We have noted this before when we stated that we “find equity components in excess of 50% to be problematic and have concerns about equity ratios less than 45%.” (D.09-05-019 at 9.) We therefore expect these two companies to actively look for ways to lower their equity ratio before their next cost of capital proceeding and for all of the applicants to make a substantial showing to justify their proposed capital structures in their next cost of capital proceeding. In fact, Valencia has lowered its equity ratio by a large debt issuance and we use this to reflect the actual structure and cost on 2011. (See June 10, 2010 Motion.) We will not impute a different capital structure at this time and we will not impute DRA’s proxy structure based on the very limited justifications offered in this record.
9. The Cost of EquityIn competitive markets for goods, the return on common equity
is determined by the relative risks of alternative investments and the willingness of individual investors to accept varying degrees of risk. In a closely regulated market, regulation substitutes for competition and the regulator, acting as a substitute for the market, provides investors an opportunity to earn a fair and reasonable return for accepting the degree of risk presented by the regulated business.
Because DRA essentially responded to the five separate analyses for cost of equity, we tend to use DRA’s analysis and critique of Applicants as an outline of our review of the whole record. This
- 27 -

A.09-05-001 et al. ALJ/DUG/hkr
decision does, however, rely on the entire record (all served and filed documents and pleadings, all exhibits and testimony) but it is not necessary for us to spend hundreds of pages to review and critique every statement, figure, or calculation in the body of this decision.
9.1. Caution When Using Financial ModelsThe parties have shown that the seemingly academic and
rigorous financial models for deriving cost of capital can be “played like a fiddle,” producing significantly different tunes depending on whose fingers are on the strings and bow. Thus, the Commission must, as always, exercise extreme caution and critically review the wide range of results seemingly rendered from the same models held in different hands. Recently for San Gabriel, one of the current applicants, we noted:
What stands out in a comparison of the testimony of the experts is the inevitable and pervasive use of [their] judgment, which colors all results. (D.07-04-046 at 58.)
We also noted at that time:Although the parties agree that the models are objective, the results are dependent on subjective inputs. For example, each party used different proxy groups, growth rates, and calculations of market returns. (Id. at 57.)
The financial models commonly used in water utility cost of capital proceedings21 are the usual suspects: Discounted Cash Flow Analysis and Capital Asset Pricing Model, both of which are highly susceptible to subjective inputs. Various other models and measures of risk premium analysis have also been proposed by the parties. None of the models are independently reliable—in terms of measuring return without subjective input and interpretation22—or persuasive on 21 And previously as a part of general rate cases.22 For example, proxy groups, growth rate, or earnings assumptions.
- 28 -
A.09-05-001 et al. ALJ/DUG/hkr
their own. Therefore, the Commission has historically reviewed an array of models with varied assumptions before exercising its judgment in adopting a return on equity.
Even though the parties argue that the result from their particular use of the financial models is objective, the results for every party are actually completely dependent on the subjective selection of inputs. From the financial models’ varying results, the parties advance arguments in support of their respective analyses and criticize the input assumptions used by the opposing parties. It should be noted here that none of the parties agreed with the financial model results of the others. For example, using a seemingly academic and rigorous financial model for Discounted Cash Flow, we are offered the following recommendations for a return on equity depending on who plays the fiddle: San Jose’s model derives 11.87%,23 Valencia derives 12.0%,24 Park/Apple derives 13.7%,25 San Gabriel derives 12.8%,26 Suburban derives 11.15%,27 and DRA derives a very different result of 9.81%.28
In the final analysis, it is the application of informed judgment by the Commission, not the so-called precision of financial models, which is the key to adopting a fair return on equity and overall cost of capital. We affirmed this view in D.89-10-031, noting that all models have flaws and, as we have routinely stated in past decisions, the models should not be used rigidly or as definitive proxies for the 23 Exhibit DRA-1 at Appendix B-51.24 Exhibit DRA-1 at Appendix B-55.25 Exhibit DRA-1 at Appendix B-53.26 Exhibit DRA-1 at Appendix B-53.27 Exhibit DRA-1 at Appendix B-50.28 Exhibit DRA-1 at 34.
- 29 -
A.09-05-001 et al. ALJ/DUG/hkr
determination of the investor-required return on equity. Consistent with that skepticism, we find no reason to adopt or endorse the financial modeling of any single party. The models are only helpful as rough gauges of the range of reasonable outcomes.
9.2. Legal StandardThe legal standard for setting the fair rate of return has been
established by the United States Supreme Court in the Bluefield and Hope cases.29 The Bluefield decision states that a public utility is entitled to earn a return upon the value of its property employed for the convenience of the public, and sets forth parameters to assess a reasonable return. Such return should be equal to that generally being made at the same time and in the same general part of the country on investments in other business undertakings attended by corresponding risks and uncertainties. That return should also be reasonably sufficient to ensure confidence in the financial soundness of the utility, and adequate, under efficient management, to maintain and support its credit and to enable it to raise the money necessary for the proper discharge of its public duties.
Hope held that the value of a utility’s property could be calculated based on the amount of prudent investment minus depreciation, which we call rate base. Hope reinforces the Bluefield decision and emphasizes that the returns should be sufficient to cover operating expenses and capital costs of the business. The capital cost of business includes debt service and stock dividends. The return should also be commensurate with returns available on alternative investments of comparable risks. However, in applying these 29 Federal Power Commission v. Hope Natural Gas Company, 320 U.S. 591 (1944) and Bluefield Water Works & Improvement Company v. Public Service Commission of the State of Virginia, 262 U.S. 679 (1923).
- 30 -
A.09-05-001 et al. ALJ/DUG/hkr
parameters, we must not lose sight of our duty to utility ratepayers to protect them from unreasonable risks including risks of imprudent management.
We attempt to set the return on equity at a level of return commensurate with market returns on investments having corresponding risks, and adequate to enable a utility to attract investors to finance the replacement and expansion of a utility’s facilities to fulfill its public utility service obligation. To accomplish this objective, we have consistently evaluated analytical financial models as a starting point to arrive at a fair return on equity.
10. Return on Equity and Market to Book Ratio DRA cites a Harvard Business School case study entitled “A Note
on Value Drivers”: “For a given industry, more profitable firms—those able to generate higher returns per dollar of equity—should have higher market-to-book ratios. Conversely, firms which are unable to generate returns in excess of their cost of equity should sell for less than book value.”
DRA performed a regression study between estimated return on equity and market-to-book ratios using natural gas distribution, electric utility, and water utility companies. DRA used all companies in these three industries which are covered by Value Line and that have estimated return on equity and market-to-book ratio data. (Exhibit DRA-1, Panels A-C of Attachment JRW-6.) The average R-squares for the electric, gas, and water companies are 0.65, 0.60, and 0.92.30 DRA argues that its study demonstrates the strong positive
30 R-square measures the percentage of variation in one variable (e.g., market-to-book ratios) explained by another variable (e.g., expected return on equity). R-squares vary between zero and 1.0, with values closer to 1.0 indicating a higher relationship between two variables.
- 31 -
A.09-05-001 et al. ALJ/DUG/hkr
relationship between the return on equity and market-to-book ratios for public utilities.
We do not find this analysis helpful to quantify the reasonable return on equity now.
10.1. Utility Investment Risk Compared to Other IndustriesDRA argues that due to the essential nature of their service as
well as their regulated status, public utilities are exposed to less business risk than non-regulated businesses. The relatively low business risk allows public utilities to meet much of their capital requirements through borrowing in the financial markets, thereby incurring greater than average financial risk. (This is a liquidity risk—having the cash flow to timely pay interest and refund debt.) Nonetheless, the overall investment risk of public utilities is below most other industries because of the stable stream of revenues in a regulated environment.
Exhibit DRA-1, Attachment JRW-8 provides DRA’s assessment of investment risk for 100 industries as measured by beta, which according to modern capital market theory is the only relevant measure of investment risk. DRA argues that the study shows the investment risk of water utility and gas distribution companies is very low. The average beta for water companies is 0.86 and for gas distribution companies is 0.69. These figures rank these two industries in the bottom 10 percent of the 100 industries related to investment risk and well below the Value Line average of 1.19. Therefore, DRA concludes the cost of equity for water utility and gas distribution companies should reflect this low level of risk.
We tend to agree to the extent that the protections afforded a regulated monopoly service provider should lower liquidity risks and
- 32 -

A.09-05-001 et al. ALJ/DUG/hkr
hence the investment risk generally. While DRA may be able to provide indications of these reductions of risk, those indicators do not translate into quantifiable adjustments to a market return on equity.
- 33 -

A.09-05-001 et al. ALJ/DUG/hkr
11. DRA’s Discounted Cash Flow Model
11.1. DRA’s Use of the Dividend Discount Model Version of Discounted Cash Flow
A majority of investment firms use some form of the Discounted Cash Flow model as a valuation technique.31 DRA proposes the use of a three-stage Discounted Cash Flow or dividend discount model. (Exhibit DRA-1, Attachment JRW-9 presents the stages in a three-stage Discounted Cash Flow model.) This model presumes that a company’s dividend payout progresses initially through a growth stage, then proceeds through a transition stage, and finally assumes a steady-state stage.32 The dividend-payment stage of a firm depends on the profitability of its internal investments, which, in turn, is largely a function of the life cycle of the product or service.33 (Exhibit DRA-1 at 22-23.)31 In the Discounted Cash Flow model, the current stock price equals the discounted value of all future dividends. Thus, stockholders’ returns result from current as well as future dividends. The Discounted Cash Flow model presumes that any earnings not paid as dividends are reinvested in the firm to provide for future growth in earnings and dividends. The investors’ discount rate for future dividends reflects the timing and riskiness of the expected cash flows, and is therefore the market’s expected or required return on the common stock. Therefore, this discount rate represents the cost of common equity. Algebraically, the Discounted Cash Flow model is:
D1 D2 DnP = ------ + ------ + ------
(1+k)1 (1+k)2 (1+k)n
(P = the current stock price, Dn = year n dividend, and k = the cost of common equity.)32 Maturity (steady-state) stage: Eventually the company reaches a position where its new investment opportunities offer, on average, only slightly attractive returns on equity. At that time its earnings growth rate, payout ratio, and return on equity stabilize for the remainder of its life. The constant-growth Discounted Cash Flow model is appropriate when a firm is in the maturity stage of the life cycle.33 This description comes from William F. Sharp, Gordon J. Alexander, and Jeffrey V. Bailey, Investments (Prentice-Hall, 1995) at 590-91, as cited by DRA.
- 34 -
A.09-05-001 et al. ALJ/DUG/hkr
DRA relied primarily on the Discounted Cash Flow model to estimate the cost of equity capital. DRA argues that due to the investment valuation process and the relative stability of the utility business, the Discounted Cash Flow model is the best measure of equity cost for public utilities. DRA also performed a Capital Asset Pricing Model study (discussed below), but placed less weight on this measure of risk because it contends that risk premium studies, like the Capital Asset Pricing Model, are a less reliable indication of equity cost rates for public utilities.
11.2. DRA Used a Discounted Cash Flow Model to Establish Stockholders’ Expected or Required Return
DRA argues that the economics of public utilities show the industry to be in the steady-state or constant-growth stage of a three-stage Discounted Cash Flow due to the relative stability of the utility business, the maturity of the demand for public utility services, and the regulated status of public utilities (especially the return on equity).
11.3. Factors That Affect Discounted Cash Flow Discounted Cash Flow models require a forecast of dividend
yield and expected growth rate. The dividend yield can be measured at any point in time, but estimating expected growth is harder because it requires consideration of investors’ expectations.
11.4. Use of Historical Earnings Growth, Dividends, and Internal Growth
Both DRA and Applicants use historical earnings per share, dividend per share, and book value per share growth rates to develop growth expectations. The Discounted Cash Flow model’s expected return on a security is the sum of the dividend yield and the expected
- 35 -
A.09-05-001 et al. ALJ/DUG/hkr
long-term growth in dividends. Therefore, the conventional Discounted Cash Flow model uses long-term growth rate expectations to estimate the cost of common equity.
Internally generated growth is a function of the percentage of earnings retained within the firm (the earnings retention rate) and the rate of return earned on those earnings (the return on equity). The internal growth rate is computed as the retention rate times the return on equity. Internal growth is significant in determining long-run earnings and, therefore, dividends. Investors recognize the importance of internally generated growth and pay premiums for stocks of companies that retain earnings and earn high returns on internal investments. (DRA Opening Brief at 29.)
11.5. DRA’s Analysis for Its Two Proxy Groups DRA presented its Discounted Cash Flow analysis in Exhibit
DRA-1, Attachment JRW-10. For the Discounted Cash Flow dividend yields for the groups, DRA used the average of the six-month and July 2009 dividend yields. The table below shows these dividend yields.
Six-Month Average Dividend Yield
July 2009 Dividend Yield
Discounted Cash Flow Dividend Yield
Water Proxy 3.7% 3.7% 3.7%Gas Proxy 4.6% 4.4% 4.5%
DRA adjusted the dividend yield by one-half (1/2) the expected growth to reflect growth over the coming year.
DRA analyzed various measures of growth for the companies in the proxy groups including historical growth rates in earnings per share, dividends per share, and book value per share.
DRA reviewed Value Line’s historical and projected growth rate estimates for earnings per share, dividends per share, and book value
- 36 -

A.09-05-001 et al. ALJ/DUG/hkr
per share. Additionally, DRA utilized Zacks,34 Reuters,35 and First Call’s36 average earnings per share growth rate forecasts of Wall Street analysts. According to DRA, these services solicit five-year earning growth rate projections for securities analysts and compile and publish the averages of these forecasts on the Internet. Lastly, DRA assessed prospective growth as measured by prospective earnings retention rates and earned returns on common equity.
11.6. DRA Used Wall Street Analysts’ Earnings per Share GrowthDRA argues the appropriate Discounted Cash Flow model
growth rate is the dividend growth rate, not the earnings growth rate. However, DRA believes over the very long-term dividends and earnings will have to grow at a similar rate (eventually earnings will become dividends rather than always being fully reinvested). DRA asserts one must consider other indicators of growth, including prospective dividend growth, internal growth, as well as projected earnings growth. DRA also argues the earnings per share growth rate forecasts of Wall Street securities analysts are overly optimistic and upwardly biased. Thus, using their growth rates as a Discounted Cash Flow growth rate will provide an overstated equity cost. (Exhibit DRA-1 at 30.)
34 Zacks is a publicly available investment information source. http://www.zacks.com/.35 Reuters is a wide range source of news and information. http://www.reuters.com/.36 First Call is a publicly available investment information source. http://thomsonreuters.com/products_services/financial/financial_products/products_az/first_call.
- 37 -
A.09-05-001 et al. ALJ/DUG/hkr
11.7. Historical Growth for DRA’s Proxy GroupsExhibit DRA-1, Page 3 of Attachment JRW-10 provides the 5- and
10-year compounded annual growth rates for the companies in the two proxy groups. Due to the presence of outliers, DRA used the median as well as the mean as a measure of central tendency.37 Historical earnings per share growth for DRA’s Water Proxy Group is volatile, with a mean/median range of 2.74% - 6.92%. Historical dividends per share growth is steadier, with a range of 2.36% - 4.00%. Historical book value per share growth is higher, with a range of 4.42% - 5.21%. Overall, the average of the 5- and 10-year means and medians of historical earnings per share, dividends per share, and book value per share growth rates is 3.9%. (DRA Opening Brief at 19.)
For DRA’s Gas Proxy Group, earnings per share growth is the most volatile, with a 5- and 10-year mean/median range of 4.20%-4.96%. Dividends per share growth is much steadier and much lower, with a mean/median range of 1.99%-3.11%. The range for book value per share growth is above that of earnings per share and dividends per share growth, with a mean/median range of 4.17%-5.57%. Overall, the average of the 5- and 10-year means and medians of historical earnings per share, dividends per share, and book value per share growth rates is 3.9%. (Id. at 30-31.) Although we discuss DRA’s Gas Proxy Group here, as noted elsewhere, we are not persuaded that any gas proxy is an appropriate proxy for water utilities.
37 Outliers are observations that are much larger or smaller than the majority of the observations.
- 38 -
A.09-05-001 et al. ALJ/DUG/hkr
11.8. Projected Growth Rates for DRA’s Two Proxy Groups DRA used Value Line’s projections of earnings per share,
dividends per share, and book value per share growth for the proxy groups. (Exhibit DRA-1, Page 5 of Attachment JRW-10.) DRA argues that due to the presence of outliers, both the means and medians should be used in the analysis. The projected Value Line data for the water companies is limited because there are only three water companies with Value Line projections. For these three companies, the central tendency measures range from 3.0% to 9.5%, with an average of 5.6%. For the Gas Proxy Group, the central tendency measures range from 2.5% to 4.5%, and an average of 3.8%.
Also Exhibit DRA-1, Page 5 of Attachment JRW-10 contains prospective internal growth for the proxy groups as measured by Value Line’s average projected retention rate and return on shareholders’ equity. As noted above, DRA believes internal growth is a primary driver of long-run earnings growth. For the Water Proxy Group, the average prospective internal growth rate for the three companies with data is 6.1%. The average prospective internal growth rate for the Gas Proxy Group is 4.8%.
11.9. DRA’s Use of Analysts’ Forecasts of Expected 5-year Earnings per Share Growth for Proxy Groups
Zacks, First Call, and Reuters collect, summarize, and publish Wall Street analysts’ 5-year earnings per share growth rate forecasts for the companies in DRA’s proxy groups. These forecasts for the companies in the proxy groups are in Exhibit DRA-1, Page 6 of Attachment JRW-10. The average of analysts’ projected earnings per share growth rates for the Water Proxy Group is 8.1%.38 The average 38 DRA’s witness averaged the expected five-year earnings per share growth rates from the three services for each company to arrive at an expected
- 39 -
A.09-05-001 et al. ALJ/DUG/hkr
of the analysts’ projected earnings per share growth rates for the Gas Proxy Group is 5.4%.
11.10. Summary of DRA’s AnalysisDRA argues that the data for the Gas Proxy Group is more
complete and provides a much better indication of expected growth than the water data. The historical growth rate figures suggest to DRA a baseline growth rate in the 4.0%-5.0% range for the gas companies. The internal and projected earnings per share growth rates indicate to DRA higher growth of 4.8% and 5.4%, respectively. The average of the growth rates of the various indicators is 4.5%. (Exhibit DRA-1, Page 7 of Attachment JRW-10.) DRA argues it is reasonable to give more weight to the projected growth rate indicators and to prospective internal growth, and therefore an expected Discounted Cash Flow growth rate in the 5.0% range is reasonable for the group.39 DRA uses this 5% figure as the Discounted Cash Flow growth rate for its Gas Proxy Group. (Exhibit DRA-1, Page 7 of Attachment JRW-10.)
The DRA Water Proxy Group’s Discounted Cash Flow growth rate indicators are also included in DRA’s analysis, but DRA argues that the data is very limited and that the data for the Gas Proxy Group is more complete and provides a better indicator of prospective growth. The historical growth rate indicators for DRA’s Water Proxy Group show a baseline growth rate of 4.0%, which is slightly below DRA’s Gas Proxy Group.
earnings per share growth rate by company.39 This number is rounded up to 5% based on the 4.67% average of the various forward indicators listed in Exhibit DRA-1, Page 7 of Attachment JRW-10.
- 40 -
A.09-05-001 et al. ALJ/DUG/hkr
DRA’s projected growth rate indicators for the Water Proxy Group, while very limited in number and highly variable, are higher than those of the Gas Proxy Group. The average of the growth rate indicators is 5.7%. DRA uses a growth rate for the Water Proxy Group that is 100 basis points above that of the Gas Proxy Group—a 6.00% Discounted Cash Flow growth rate for the Water Proxy Group.40 (Id. at 33.)
11.11. DRA’s Return on Equity Using the Discounted Cash Flow Model for the Two Proxy Groups
DRA derived an equity cost range for the two proxy groups using the sum of the dividend yield, plus one-half the growth adjustment, plus the discounted cash flow growth rate. DRA summarized these results in Exhibit DRA-1, Page 1 of Attachment JRW-10, as follows:
Dividend Yield ½ Growth Adjustment
Discounted Cash Flow Growth Rate
Equity Cost
Water Proxy Group 3.7% 1.0300 6.00% 9.81%41
Gas Proxy Group 4.5% 1.0250 5.00% 9.61%42
12. Applicants’ Discounted Cash Flow Analysis
12.1. San JoseSan Jose used a single stage constant growth discounted cash
flow model because its witness believed it to be the most widely used method, and San Jose is not a company transitioning between stages. San Jose notes we should not rely on a single financial model because 40 DRA did not rely on the 6.6% average ((5.6% + 6.2% + 7.9%) ÷ 3= 6.57%)of the Water Proxy Group forward indicators due to the limited data and upward bias. Instead, DRA used the proposed forward average growth rate of the Gas Proxy Group of 5% and added 120 basis points. DRA believes applying a 6% growth rate is more reasonable for the Discounted Cash Flow growth rates for the Water Proxy Group.41 ((3.7% x 1.03) + 6.00% = 9.81%.)42 ((4.5% x 1.025) + 5.00% = 9.61%.)
- 41 -

A.09-05-001 et al. ALJ/DUG/hkr
each has weaknesses and in particular the discounted cash flow model is susceptible to distortion when book value and market value differ. (San Jose Opening Brief at 13-16.)
12.2. ValenciaValencia argues that the Discounted Cash Flow model “requires
estimates of growth that investors expect in the future, rather than past estimates of growth that already has occurred” and therefore its witness Bourassa “relied on analysts forecasts of growth and gave no weight to historical measures of growth,” and that it is “logical to presume that financial institutions and analysts have taken into account all relevant historical information on a company, so that analysts’ forecasts will incorporate useful indications of future growth indicated by past results.” (Valencia Opening Brief at 8.) Valencia therefore argues the Discounted Cash Flow model for its proxy group of six publicly traded water utilities results in a range from 10.8% to 13.3%, with a midpoint of 12.0%. (Ex. VWC-11 at 43 and Tables 10-12.) Valencia disputes DRA’s position that analysts’ results are overly optimistic and argues instead that investors rely on analysts’ forecasts and therefore they should be included on our determination of a reasonable return. (Valencia Opening Brief at 10.)
12.3. Park/ApplePark/Apple calculated a Discounted Cash Flow range of 13.0% to
14.30% after adding a 90 basis point premium for risk. (Park Opening Brief at 11.) Thus its modeling actually yields a range of 12.1% to 13.4%, still substantially higher than DRA’s calculation or any recently adopted return on equity for a California Class A water utility.
- 42 -

A.09-05-001 et al. ALJ/DUG/hkr
As discussed elsewhere, we find each of the Applicants’ determinations of risk premiums to be unpersuasive. Thus, looking only at the company’s own data inputs for Discounted Cash Flow, the unadjusted Park/Apple return range would be 12.10% to 13.40%. This forecast is higher than DRA’s in part because of the company’s use of an arithmetic annual average for past growth whereas DRA used geometric annual averages which Park/Apple argues biases the forecast downwards. The company also argues that DRA under-weighted the value of analysts’ forecasts (down from 50% to 20%) again resulting in a downward bias. (Park Opening Brief at 11-13.)
After making the above and various other adjustments to DRA’s analysis, Park/Apple calculated a “corrected” DRA Discounted Cash Flow forecast of 11.7%. (Park Opening Brief at 16 citing Ex. PWAV-3 Rebuttal Table 3.) Park/Apple would add its 90 point risk premium to this “corrected” DRA forecast resulting in a 12.6% return on equity which is still below its own modeling results plus premium.
12.4. San GabrielFor San Gabriel, Dr. Zepp generated Discounted Cash Flow
return on equity estimates for his proxy group of 13.3% to 13.4%. (Ex. SG-1 at 17.) Dr. Zepp also appeared on behalf of Park/Apple and offered similar testimony for both companies, with some distinctions.
12.5. Suburban Suburban acknowledges that it, as well as DRA, used the
constant growth form of the Discounted Cash Flow model, but points to several examples where it believes that DRA’s witness Dr. Woolridge was using data and assumptions which biased his results downwards. (Suburban Opening Brief at 5-6.) Instead, Suburban’s modeling resulted in a return of 11.15% (id. at 10).
- 43 -
A.09-05-001 et al. ALJ/DUG/hkr
13. Capital Asset Pricing Model and Other Risk Premium ModelsThe Capital Asset Pricing Model is a risk premium approach to
gauging a firm’s cost of equity capital.43 The yield on long-term Treasury securities is normally used as Rf.
Risk premiums are measured in different ways. The Capital Asset Pricing Model is a theory of the risk and expected returns of common stocks. In the Capital Asset Pricing Model, two types of risk are associated with a stock: firm-specific risk or unsystematic risk, and market or systematic risk, which is measured by a firm’s beta. The only risk that investors receive a return for bearing is systematic risk.
According to the Capital Asset Pricing Model, the expected return on a company’s stock, which is also the equity cost rate (K), is equal to:
K = (Rf) + ß * [E(Rm) - (Rf)]
Where:K = the estimated rate of return on the stock;E(Rm) = the expected return on the overall stock market (Often the Standard & Poor’s 500);(Rf) =the risk-free rate of interest (Usually Long-term U.S. Treasury Notes);[E(Rm) - (Rf)] = the expected equity or market risk premium—the excess return that an investor expects to receive above the risk-free rate for investing in risky stocks; andBeta (ß) = the systematic risk of an asset.
To estimate the required return or cost of equity using the Capital Asset Pricing Model requires three inputs: the risk-free rate of interest (Rf), the beta (ß), and the expected equity or market risk premium [E(Rm) - (Rf)]. Rf is the easiest of the inputs to measure—it is 43 In the risk premium model, the cost of equity is the sum of the interest rate on a risk-free bond (Rf) and a risk premium (RP): K = Rf + RP.
- 44 -

A.09-05-001 et al. ALJ/DUG/hkr
the yield on long-term Treasury bonds. Beta, the measure of systematic risk, is a little more difficult to measure because there are different opinions about what adjustments, if any, should be made to historical betas due to their tendency to regress to 1.0 over time. And finally, an even more difficult input to measure is the expected equity or market risk premium (E(Rm) - (Rf)).
Exhibit DRA-1, Attachment JRW-11 provides DRA’s Capital Asset Pricing Model study results.
13.1. The Risk-Free Interest RateThe yield on long-term U.S. Treasury bonds has usually been
viewed as the risk-free rate of interest in the Capital Asset Pricing Model44 in response to a strong economy and increases in energy, commodity, and consumer prices.
According to DRA, in late 2006, long-term interest rates declined to 4.5% as commodity and energy prices declined and inflationary pressures subsided. These rates rebounded to the 5.0% level in the first half of 2007. Ten-year Treasury yields began to decline in mid-2007 at the beginning of the financial crisis, and fell below 3.0% as the housing and sub-prime mortgage crises led to an overall credit crisis and economic recession. These rates bottomed out in December of 2008 and have increased steadily since that time as prospects for an economic recovery have increased.
44 The 10-year U.S. Treasury yields over the past five years are in Exhibit DRA-1, Page 2 of Attachment JRW-11. These rates hit a 60-year low in the summer of 2003 at 3.33%. They increased with the rebounding economy and fluctuated in the 4.0-4.50 percent range in recent years until advancing to 5.0% in early 2006.
- 45 -

A.09-05-001 et al. ALJ/DUG/hkr
13.2. DRA’s Capital Asset Pricing Model Risk-Free Interest RateThe U.S. Treasury began to issue the 30-year bond in the early
2000s as the U.S. budget deficit increased. As such, the market has once again focused on its yield as the benchmark for long-term capital costs in the United States. As of June 9, 2009, as shown in Exhibit DRA-1, Page 2 of Attachment JRW-11, the rates on 10- and 30-year U.S. Treasury Bonds were 3.83% and 4.61%, respectively. Given this recent trend of increasing 30-year Treasury yields, DRA asserts that a long-term Treasury rate of 4.75% is reasonable for the future and thus it is its risk-free rate, or Rf, for the Capital Asset Pricing Model.
13.3. Capital Asset Pricing Model Betas Beta is a measure of the systematic risk of a stock. The market,
usually taken to be the Standard & Poor’s 500, has a beta of 1.0. A stock with the same price movement as the market also has a beta of 1.0.45 A stock’s beta is calculated by a linear regression of a stock’s return compared to the market’s return.
In estimating an equity cost rate for the proxy group, DRA used the betas from the Value Line Investment Survey. Exhibit DRA-1, Page 3 of Attachment JRW-11 shows that the average beta for the companies in Water and Gas Proxy Groups is 0.78 and 0.67, respectively.
13.4. Alternative Views on Equity Risk PremiumThe equity or market risk premium—(E(Rm) - (Rf))—is equal to
the expected return on the stock market (e.g., the expected return on
45 A stock whose price movement is greater than that of the market, such as a technology stock, is riskier than the market and has a beta greater than 1.0. A stock with below average price movement, such as that of a regulated public utility, is less risky than the market and has a beta less than 1.0.
- 46 -
A.09-05-001 et al. ALJ/DUG/hkr
the Standard & Poor’s 500 (E(Rm)) minus the risk-free rate of interest (Rf). The equity premium is the difference in the expected total return between investing in equities and investing in “safe” fixed-income assets, such as long-term government bonds. However, while the equity risk premium is easy to define conceptually, it is difficult to measure because it requires an estimate of the expected return on the market. None of the Applicants or DRA derived a “risk premium” in the same manner.
DRA argues that its ex ante equity risk premium is appropriate because it is consistent with the expectations of chief financial officers (CFO) as found in a June 2009 CFO survey conducted by CFO Magazine and Duke University, where the expected 10-year equity risk premium was 4.11%. DRA argues its equity risk premium is also consistent with professional forecasters and leading consulting firms, such as McKinsey. (Exhibit DRA-1 at 46-47.)
13.5. DRA’s Capital Asset Pricing Models ResultsThe results of DRA’s Capital Asset Pricing Model study46 are:
K = (Rf) + ß * [E(Rm) - (Rf)]Risk-Free Rate Beta Equity Risk PremiumEquity Cost Rate
Water Proxy Group 4.75% 0.78 4.33% 8.13%Gas Proxy Group 4.75% 0.67 4.33% 7.65%
14. DRA’s Base Return on Equity RecommendationDRA’s Discounted Cash Flow and Capital Asset Pricing Model
analyses’ results for the two proxy groups are below:
Discounted Cash Flow Capital Asset Pricing ModelWater Proxy
Group9.81% 8.13%
Gas Proxy Group 9.61% 7.65%
46 Exhibit DRA-1, Page 1 of Attachment JRW-11.
- 47 -

A.09-05-001 et al. ALJ/DUG/hkr
Given the results for the two proxy groups, DRA concludes that the appropriate equity cost rate for the two proxy groups is between the 7.65% to 9.81% range. This wide range reflects, according to DRA, the uncertainty and volatility in today’s capital markets. Due to the lower level of risk, the equity cost rates for the Gas Proxy Group are lower than those for the Water Proxy Group. In recognition of this uncertainty and volatility, DRA asserts that an equity cost in the upper end of the range is appropriate. Thus, DRA recommends an equity cost of 9.75% as its benchmark return on equity for all Applicants.
DRA argues its 9.75% recommendation is consistent with the authorized returns on equity for water companies because the average authorized return as reported by AUS Utilities Reports is 10.08%. (Exhibit DRA-1, Panel A of Attachment JRW-12.) Additionally, yield spreads and rates have declined and therefore show further why DRA’s 9.75% recommendation is reasonable.
DRA also notes that 9.9% is the most recent authorized average return on equity reported by the National Association of Water Companies in its recent Financial and Operating Data Report.47 (Exhibit DRA-1, Panel B of Attachment JRW-12.)
15. Adopted Return on EquityNo one can precisely determine a perfectly correct return: we
rely on the wide ranges of the models and our own best judgment to fulfill our regulatory obligation of adopting a just and reasonable return. After considering the evidence on the ongoing uncertainty of market conditions and trends, creditworthiness, interest rate forecasts, quantitative financial models, additional risk factors, and
47 The National Association of Water Companies provides authorized returns on equity for a broader group of small water companies.
- 48 -

A.09-05-001 et al. ALJ/DUG/hkr
size and access to the financial markets, as presented by the parties and by applying our informed judgment, we could adopt a return on equity within the range of 10.00% and 10.40%. We find that 10.20% is a reasonable return on equity for these companies in these times. We find that the variations in size, equity ratio, and operational differences amongst Applicants cannot be precisely calculated to derive a numeric adjustment to this return. As discussed in Section 16 below, none of the Applicants was persuasive that they had derived a reasonable measurement of unique risk warranting any additional premium over a market rate of return. We have not previously quantified the impact of a Water Revenue Adjustment Mechanism and we again find that the only recommended adjustments in the record are arbitrary—25 basis points by DRA and none by Applicants.
San Jose is by far the largest of the group and the only one listed on a major stock exchange. As discussed in Section 17 below, we move it into the group of the large three multi-district Class A companies for its next review of rate of return. Valencia is the smallest in the group, but up to now, it has a much larger equity ratio which substantially raises the cost of capital imposed on ratepayers although it provided Valencia with the least liquidity risk. As discussed in Section 17, we allow Valencia to file its next cost of capital proceeding concurrently with its next general rate case.
16. Relative Risks and Company Specific Risks
16.1. Overview The Commission is always wary of adopting risk premiums
added beyond the results derived from the financial models. Even
- 49 -
A.09-05-001 et al. ALJ/DUG/hkr
when we adopt a premium, we do so cautiously, as we did for Apple Valley:
We stress that the inclusion of a risk premium is not automatic, and in Apple Valley’s next general rate case, it must continue to meet its full burden of proof for its proposed return on equity and any request for a risk premium addition. (D.05-12-020 at 20.)
DRA makes several adjustments to its base return on equity recommendation—25 basis points upwards for Valencia, and 25 basis points downwards for Suburban. DRA also proposes a 25 basis point adjustment upward for risk to Park/Apple but then offsets it with a further 25 basis point adjustment due to an adopted Water Revenue Adjustment Mechanism.
16.2. DRA’s Relative Risk AnalysisExhibit DRA-1, Page 2 of Attachment JRW-13 shows the
operating revenues, net plant, pre-tax interest coverage, common equity ratio, and return on equity for the Water Proxy Group and the California water companies. On average, the California water companies are smaller in terms of operating revenues and net plant and have higher pre-tax interest coverage, common equity ratio, and return on equity. These indicators suggest to DRA that whereas size may indicate the California water companies are riskier than the Water Proxy Group, the other indicators—especially the much higher pre-tax interest coverage and common equity ratios—suggest they are less risky than the Water Proxy Group.
DRA argues the companies’ assertions of risk are “overblown” and that:
None of the applicants performed [a] systematic risk study, but rather emphasized such subjective factors as alleged
- 50 -
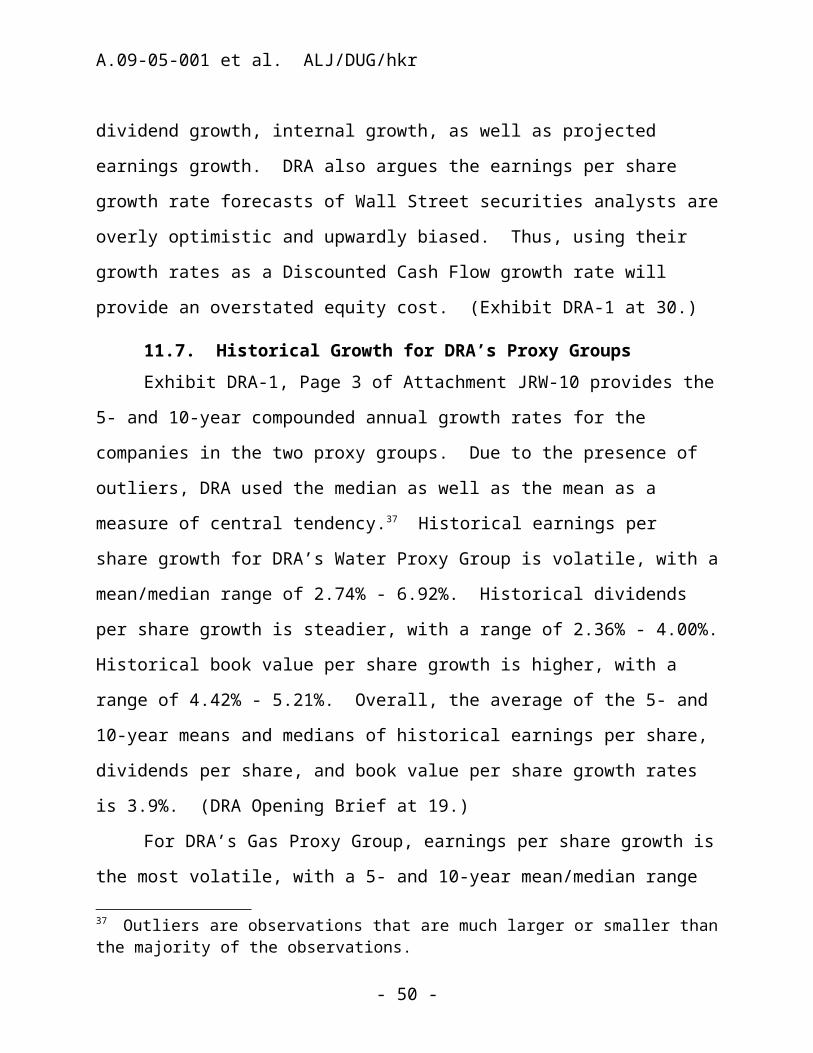
A.09-05-001 et al. ALJ/DUG/hkr
threats to their water supply and alleged regulatory risk. Thus, the Applicants’ claims of peril as justification for a substantial risk premium should be dismissed as little more than rhetoric. Moreover, what is notably lacking in the record of this case is any concrete evidence that any of the Applicants have experienced challenges in obtaining financing in recent years, despite the fact that all of them have existing authorized [returns on equity] that are far below what they are seeking in this proceeding. (DRA Reply Brief at 5.)
16.2.1. DRA’s Relative Risk StudyTo gauge the relative riskiness of the California water
companies, DRA performed a study of the authorized versus earned return on equity for the five California water companies and its Water Proxy Group. DRA performed two risk assessments. First, DRA compared the earned versus the authorized return on equity over the past five years. In this test, under-earning an authorized return on equity indicates higher risk. Second, DRA computed the Coefficient of Variation48 (coefficient) of the earned return on equity over the past five years. As such, it allows for comparison between observations. In this test, a higher coefficient indicates higher risk.
DRA used the median as a measure of central tendency because it argues that the California water companies are significantly affected by Suburban’s current high return on equity. Over the past five years, Applicants under-earned their authorized return on equity, with a median level of underperformance of -0.67%. The range is from +8.35% for Suburban to -1.25% for Valencia.
By comparison, the median level of underperformance for the Water Proxy Group is -1.70%. The range for the Water Proxy Group is
48 The coefficient, computed as the standard deviation return on equity/mean return on equity, is a standardized measure of volatility.
- 51 -
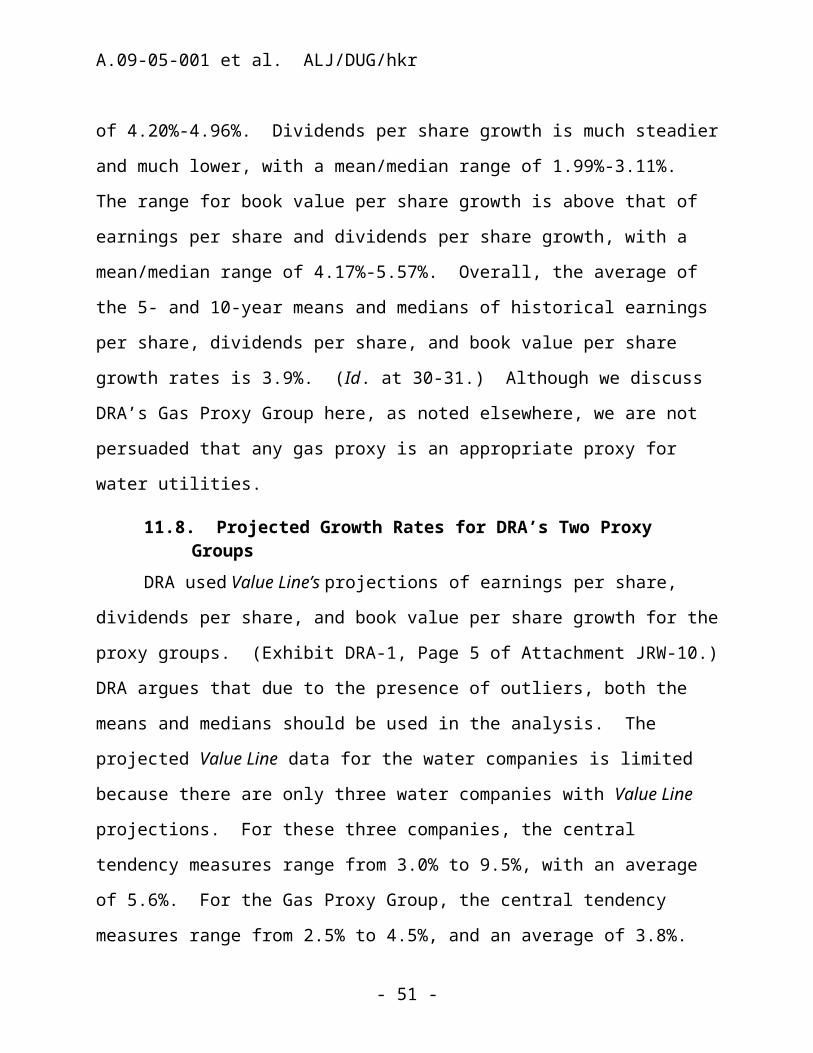
A.09-05-001 et al. ALJ/DUG/hkr
from +2.07% for SJW Corporation to -5.03% for Southwest Water Company.49 As such, the level of underperformance is greater for the Water Proxy Group than for Applicants. In the second test, the average coefficient for the five California water companies is 0.17, with a range from 0.06 (Suburban) to 0.30 (Park /Apple). The average coefficient for the Water Proxy Group is 0.28, with a range from 0.08 (Aqua America, Inc.) to 0.67 (Pennichuck Corporation). The coefficient test also indicates greater riskiness for the Water Proxy Group than Applicants.
DRA argues its results indicate that, on average, Applicants are less risky than the Water Proxy Group. As such, the equity cost rate results for the Water Proxy Group are applicable to Applicants. DRA argues the Commission has traditionally provided for a premium for smaller water companies. DRA’s relative risk studies indicate that no such premium is needed.
DRA averaged the results of its two risk studies to assess the relative risk of Applicants. (Exhibit DRA-1, Panel A, Page 5 of Attachment JRW-13.) According to DRA, Suburban (the middle-sized of the five50) is the least risky of the five companies. San Jose and San Gabriel are in the middle in terms of risk, whereas Park/Apple and Valencia (the two smallest) are the riskiest of the five.
49 Exhibit DRA-1, Page 4 of Attachment JRW-13, which includes a ninth proxy company, Southwest Water Company.50 San Jose has the highest operating revenues (over $200 million), roughly twice those of San Gabriel (over $100 million), with Suburban only half as big as San Gabriel (about $50 million) trailed by Park/Apple and Valencia (about $20 million each).
- 52 -

A.09-05-001 et al. ALJ/DUG/hkr
16.2.2. DRA’s Risk Premium Adjustments to Its Proposed 9.75% Benchmark Return on Equity
DRA believes Applicants are, overall, a little less risky than its Water Proxy Group, and could argue that no risk adjustment is necessary. However, the range of the risk premium study results indicates that some of the Applicants are somewhat riskier than the average of the Water Proxy Group, and some are somewhat less riskier than the average of the Water Proxy Group. Therefore, DRA believes some adjustment may be necessary.
According to DRA, Park/Apple and Valencia are rated the riskiest based on the average relative risk ranking. (Exhibit DRA-1, Panel B, Page 5 of Attachment JRW-13.) DRA recommends a 25 basis point risk premium for these companies. However, because Park/Apple has a risk-reducing decoupling mechanism—a Water Revenue Adjustment Mechanism, the 25 basis point risk adjustment for Park/Apple is unnecessary. DRA argues that a full decoupling reduces significantly the water utilities risk by protecting them from the downside of loss sales. (Tr.Vol. 3, Sanchez/ll. 19-23.)
The average relative risk ranking results place San Jose and San Gabriel in the middle, therefore DRA did not recommend a return on equity adjustment for those two companies.
Finally, Suburban’s average relative risk ranking demonstrates a low risk profile. Therefore, DRA recommended a 25 basis point reduction to the benchmark return on equity to reflect the low level of risk for Suburban.
Thus, in summary, DRA’s recommended returns on equity are: Suburban—9.50%; San Jose—9.75%; San Gabriel—9.75%; Park/Apple—9.75%; and Valencia—10.00%.
- 53 -

A.09-05-001 et al. ALJ/DUG/hkr
16.3. The Relevance of Size Applicants’ witnesses provide risk adjustments intended to
account for differences in size or unique risks of the individual water companies. DRA disagreed entirely arguing size does not matter and is not a quantifiable risk for Applicants. DRA also argues that none of the Applicants performs any type of company-specific quantitative risk analysis. Each applicant primarily quantifies its recommended firm-specific risk premiums by citing the study by Ibbotson Associates (now Morningstar) which indicates that the stock returns provided by small firms are higher than the returns of large firms.
DRA opposed this justification for a firm-specific risk premium for several reasons. First, for the Ibbotson study of historical stock returns of small firms, one-half of the historical return premium is not properly computed.51 Second, DRA argues the Ibbotson study’s size premium is based on the companies’ stock returns with betas which are much higher than those of water utilities. Thus, DRA argues this use of a size premium is incorrect because the included premium is for industries that are much riskier (i.e., with higher betas) than the water utility industry. Third, DRA argues that utility stocks do not exhibit a significant size premium.52
A number of factors, according to DRA, account for this phenomenon. Utilities are regulated closely by state and federal agencies and commissions and hence their financial performance is monitored on an ongoing basis by both the state and federal
51 DRA cites to Richard Roll, “On Computing Mean Returns and the Small Firm Premium,” Journal of Financial Economics (1983) at 371-86.52 DRA cites to Annie Wong, “Utility Stocks and the Size Effect: An Empirical Analysis,” Journal of the Midwest Finance Association, 1993 at 95-101.
- 54 -

A.09-05-001 et al. ALJ/DUG/hkr
governments. In addition, public utilities must gain approval by government entities for common financial transactions, such as the sale of securities. Also, unlike other industries, public utilities’ accounting standards and reporting are standardized. Finally, a utility’s earnings are determined through the ratemaking process where regulators review performance.
DRA objects to Dr. Zepp’s study on risk. First, the method to estimate Discounted Cash Flow growth and equity cost rates is not consistent with the Discounted Cash Flow approach he used in this proceeding. Second, Dr. Zepp has made no separate assessment of the riskiness of the large and small water companies and so he cannot conclude that size alone—relative to other risk factors such as weather, economy, water source, etc.—is the determining risk factor.
Third, DRA argues Zepp relies on two large and two small water companies and thus the study is statistically unreliable.
Lastly, DRA argues that smaller water utilities are not necessarily more risky than larger water utilities, citing a recent Standard & Poor’s article:53
Our criteria revision reflects our view that for general obligation ratings, a small and/or rural issuer does not necessarily have what we consider weaker credit quality than a larger or more-urban issuer. Although we assess these factors in our credit analysis for some revenue bond ratings, we believe many municipal systems still exhibit, in our view, strong and stable credit quality despite size or location constraints.
16.4. Park/Apple’s Firm Specific Risk AdjustmentPark/Apple argues it should have a risk adjustment of 90 basis
points and it cites to a study comparing Park’s last eight bond issues 53 Standard & Poor’s, “26 Western Water and Sewer Issuers are Upgraded on Revised Criteria,” January 12, 2009.
- 55 -
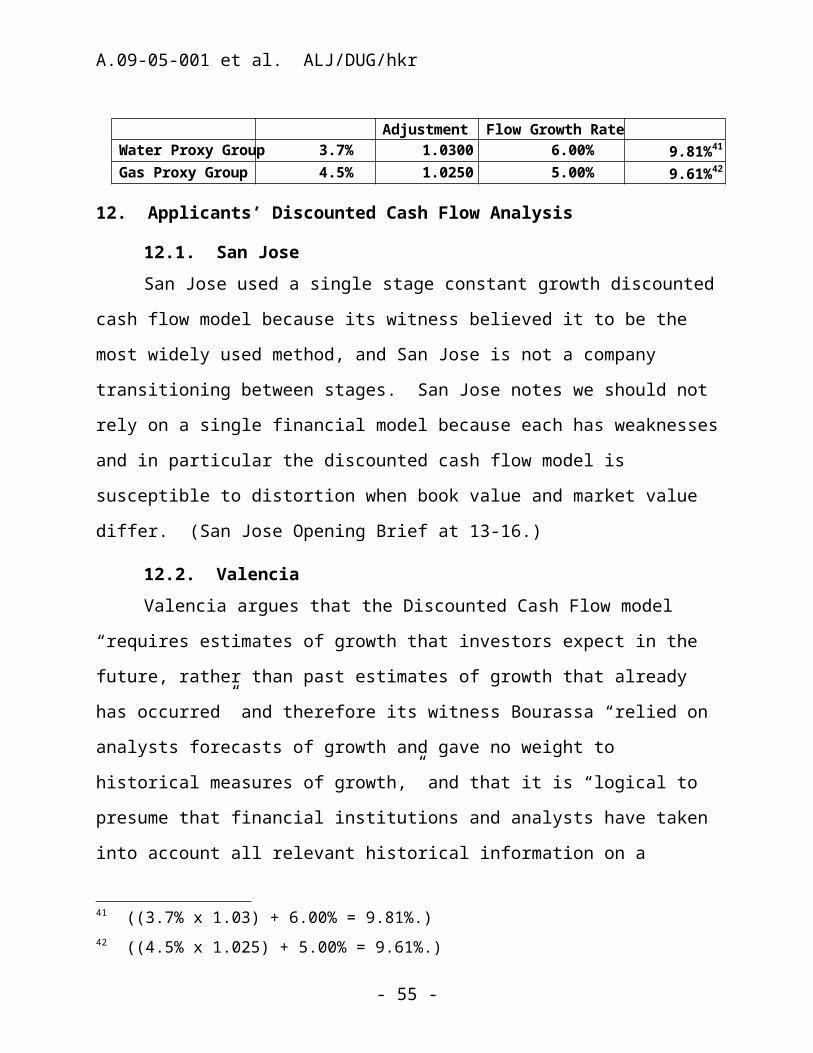
A.09-05-001 et al. ALJ/DUG/hkr
and a hypothetical rate for its proxy group’s credit rating. (Park Opening Brief at 22 et seq.) The company argues it also faces increased risk attributed to the newest rate case plan and its relatively small size compared to other larger water companies that are publicly traded. (Park Opening Brief at 25 and 28.) Park/Apple claims it would be a “micro-cap” company at 8% the size of the average proxy group company. But Park/Apple is not publicly traded on a major exchange and thus attracts different investors. The studies cited support size risk premium of 127-135 basis points. (Park Opening Brief at 29.)
Park/Apple alleges that its Water Revenue Adjustment Mechanism and Modified Cost Balancing Account mechanism provide only a minimal risk reduction.54
DRA does not propose making a specific risk factor adjustment for the Water Revenue Adjustment Mechanism and Modified Cost Balancing Account. DRA argues the record here provides no basis for continuing to add a risk premium to Park/Apple’s adopted return on equity. Thus, DRA argues that Park/Apple failed to meet its burden of proof that the Commission should authorize a risk premium. DRA argues that the existing Water Revenue Adjustment Mechanism and Modified Cost Balancing Account reduce Park/Apple’s business risk. (Exhibit DRA-1 at 61-62.)
16.5. DiscussionIn fact, the Commission has found that the Water Revenue
Adjustment Mechanism and Modified Cost Balancing Account are too new and therefore are not reflected in the market data and thus
54 Exhibit PWAV-1 at 27-35.
- 56 -

A.09-05-001 et al. ALJ/DUG/hkr
provide some un-captured risk reduction.55 We believe that, other things being equal, the Water Revenue Adjustment Mechanism makes a water utility’s future earnings more predictable with lower risk because of the assured revenue stream when coupled with a Modified Cost Balancing Account which provides an assurance of recovering reasonable includable costs. Another applicant, Suburban, contradicts Park/Apple and acknowledges that a Water Revenue Adjustment Mechanism substantially reduces financial risk and assures recovery of revenues.56
These mechanisms tend to shift Park/Apple’s risk (and the other applicants’ with these mechanisms) in the variability of its revenues and production expenses from shareholders to ratepayers, nor does Park/Apple acknowledge that its Water Revenue Adjustment Mechanism and Modified Cost Balancing Account protect from more than just reductions in sales due to water conservation. Park/Apple’s Water Revenue Adjustment Mechanism protects Park/Apple from all variations in revenues regardless of what causes a drop in sales. Additionally, the Modified Cost Balancing Account ensures predictable cost recovery, even when quantities fluctuate for key includable expense items, such as purchased water, pump tax, and purchase power.
In a recent water cost of capital proceeding, the Commission did not make a specific return on equity adjustment for the Water Revenue Adjustment Mechanism and Modified Cost Balancing Account, but it did recognize these mechanisms reduce utility risk.57
55 D.09-05-019, mimeo. at 35.56 Exhibit SUB-1 at 4.57 D.09-05-019, mimeo. at 34-35.
- 57 -

A.09-05-001 et al. ALJ/DUG/hkr
Prior to the adoption of the Water Revenue Adjustment Mechanism and Modified Cost Balancing Account for Park/Apple, the Commission included a 30 basis point adder to its authorized return on equity. The Commission noted in the last litigated return on equity proceeding for Apple Valley (separate from Park) that the allowed 30 basis point risk premium was not guaranteed and that in a future proceeding, the company would have to justify any request for a risk premium.
It is clear that with Park/Apple’s Water Revenue Adjustment Mechanism and Modified Cost Balancing Account decoupling mechanism in place, the Commission has decreased Park/Apple’s business risk and we need not continue the 30 basis point risk premium.
16.6. Suburban’s Risk PremiumSuburban presents its results of three analyses: its Risk
Premium analysis results in an 11.97% return, its Capital Asset Pricing Model suggests 13.30%, and a Comparable Earnings Average results in 13.95% return on equity. When considered with its Discounted Cash Flow result of 11.15%, Suburban argues that its request of 11.75% is reasonable. It argues too that it does not have a Water Revenue Adjustment Mechanism (thus implicitly acknowledging that the mechanism would otherwise reduce its risk by some factor) and that it is a relatively small company (San Jose and San Gabriel are bigger and Valencia and Park/Apple are smaller). (Suburban Opening Brief at 10.)
16.7. Regulatory RiskAlthough mentioned in other sections (see, for example,
Section 3: Regulatory Environment), we reject all of the Applicants’
- 58 -
A.09-05-001 et al. ALJ/DUG/hkr
arguments that California utilities face an extra or high level of risk due to regulation. San Gabriel incorrectly argues, for example, that the rate case plan with regular general rate cases harms the company by precluding a filing “when [San Gabriel] determine(s) such filings are required and seriously restricts San Gabriel from presenting the best available evidence” by using an attrition mechanism rather than serial rate cases. (San Gabriel Opening Brief at 23-24.) In fact, one of the benefits of a regular rate case cycle is that companies can (and are expected to) have a substantial business plan and forecast construction and operations in a thorough and competent fashion. The regulatory process is not an open wallet. San Gabriel ignores on the other hand the protections of balancing and memorandum accounts which facilitate the full recovery of prudently incurred costs without forecast risk or timing risks.
16.8. Contamination Risk Applicants, San Gabriel in particular, argue that they face
“unique” operating risks for contamination. (San Gabriel Opening Brief at 24.) They failed to offer any evidence either that their water sources are uniquely more contaminated (or at greater risk) than the proxy group used by DRA (or themselves) that would justify an enhanced return, or that another similarly highly contaminated (or at great risk) proxy group is authorized an enhanced return on equity due to contamination. San Gabriel does show that it has contamination problems, but does not show that these problems uniquely affect its cost of capital. We therefore accord no weight to the unsupported rhetoric. In contradistinction, the Commission specifically allows the jurisdictional water utilities to make
- 59 -

A.09-05-001 et al. ALJ/DUG/hkr
appropriate rate filings and recover prudently incurred costs when addressing specific water contamination in addition to the ongoing costs of mandated water treatment generally.58 San Gabriel argues any proceeding for contamination cost recovery raises its cost due to delay—but does not show that its cost of debt (or equity) is uniquely high because of contamination issues.
We therefore find that there is no evidence to support any specific enhancement to the return on equity for any identifiably unique risks of water contamination.
16.9. Summary of Risk PremiumWe find that the risks which allegedly warrant a premium over
the results of any of the models, Discounted Cash Flow or Capital Asset Pricing Model, are very much risks in the eyes of the individual companies and thus elude verifiable and accurate measurement. We therefore do not have a record which would permit us to adopt any individual adjustments for risk.
17. Schedule for Subsequent Cost of Capital Proceedings
17.1. BackgroundThe Commission adopted a revised rate case plan in D.07-05-
062, requiring the Class A water utilities to file cost of capital applications to be considered in two consolidated proceedings.59 The three larger multi-district Class A companies, Golden State Water Company, California-American Water Company, and California Water Service Company, filed in May 2008, and the remaining six Class A
58 For example, after dealing with contamination issues piecemeal, Rulemaking 09-03-014 is our current effort to bring some systematic process to bear on water contamination issues. 59 D.07-05-062 at 13-16.
- 60 -
A.09-05-001 et al. ALJ/DUG/hkr
water companies filed in May 2009 and five of them are consolidated here. Consideration of the application of Great Oaks Water Company (Great Oaks) was deferred to litigate concurrently with its general rate case.
17.2. DRA’s PositionDRA proposed that the Commission consider readjusting the
number of utilities handled in the consolidated cost of capital proceeding for the six utilities that are currently included in this second grouping (San Gabriel, San Jose, Park/Apple, Valencia, Suburban, and Great Oaks).
DRA believes a rebalancing of the consolidated filings is necessary due to the increased workload associated with consolidating the filings and simultaneously dealing with multiple utilities. Although DRA stated it was able to handle the three large utility filings in May 2008, the current consolidated filing of five utilities has put a significant burden on DRA’s resources.60 DRA relies on an expert witness to review the utilities rate of return proposal. DRA argues the current schedule makes it more difficult for scheduling hearings and reviewing the testimony of the multiple utility witnesses.
During evidentiary hearing, DRA agreed with the judge’s observation that the current group of companies in the consolidated proceeding has a much wider range in size and scope of operations than the three large publicly traded companies. (Tr. Vol. 3 at 160, Sanchez/DRA.) The judge suggested that, instead of creating a third
60 Great Oaks was given a one-time waiver from participation in the cost of capital consolidated proceeding. Its cost of capital application, A.09-05-007 was consolidated with its September 2009 general rate case. See Assigned Commissioner’s Scoping Memo and Ruling, June 23, 2009.
- 61 -

A.09-05-001 et al. ALJ/DUG/hkr
consolidated proceeding, perhaps it would make sense to move San Jose, the largest company of the current group, with the three large multi-district companies. DRA agrees with the judge’s suggestion to shift San Jose to the three large multi-district utilities. However, DRA notes that the work load issue remains in the second grouping since moving San Jose will only reduce the group by one utility, and therefore there would be a total of five of the smaller companies requiring one witness to rebutting multiple company and expert witnesses’ testimony. (Id. at 161.)
DRA is agreeable to the judge’s proposal to maintain two groups of consolidated proceedings, with a minor change to further balance the workload. DRA recommends that the two smallest single district utilities (Valencia and Great Oaks) file their cost of capital in their general rate cases (id. at 162) leaving a more manageable grouping for the two consolidated cost of capital proceedings of the four largest publicly traded utilities in group one and the three smaller companies in group two.
17.3. DiscussionWe affirm our intention to continue with the policy of separating
cost of capital from general rate cases, and to consolidate that review for relatively similar companies. Therefore, we will reassign San Jose to file with the three multi-district companies in 2011 for a new 2012 base year and we will allow Valencia and Great Oaks to file separate cost of capital proceedings to litigate concurrently with their subsequent general rate cases. The Commission can decide at that time whether to consolidate the cost of capital and general rate case for each company or whether to litigate concurrently but in separate dockets. This would allow for the most efficient and economical
- 62 -
A.09-05-001 et al. ALJ/DUG/hkr
litigation process while preserving the independence of the two different but critical ratemaking proceedings. The next group filing for Park/Apple, San Gabriel, and Suburban will be in 2012 for a base year 2013.
San Jose asked for a regulatory account to reflect the earlier than anticipated cost of participating in a cost of capital proceeding. We will allow San Jose to record one-third of its costs of its next cost of capital proceeding and may seek recovery in its subsequent general rate case. The underlying assumption is that San Jose would accumulate on average one-third of the cost of its participation in rates in each of the three years between proceedings. Because we are accelerating its next cost of capital proceeding by one year, there is a reasonable assumption that there would be a one-third short-fall. San Jose must meet its burden of proof for reasonableness before any rate recovery.
18. Water Cost of Capital Adjustment Mechanism
18.1. SummaryWe will adopt the same cost of capital adjustment mechanism
adopted in D.09-07-051 with two modifications: we increase both boundaries of the dead band to 200 basis points to reduce the potential for a large adjustments to the authorized return on equity caused by the economic recovery which may significantly change the Moody’s bond indices. Secondly, we will make the base period October 1, 2009 to September 31, 2010.
18.2. DRA DRA recommends that the same water cost of capital adjustment
mechanism be adopted here as was adopted in D.09-07-051 for the
- 63 -
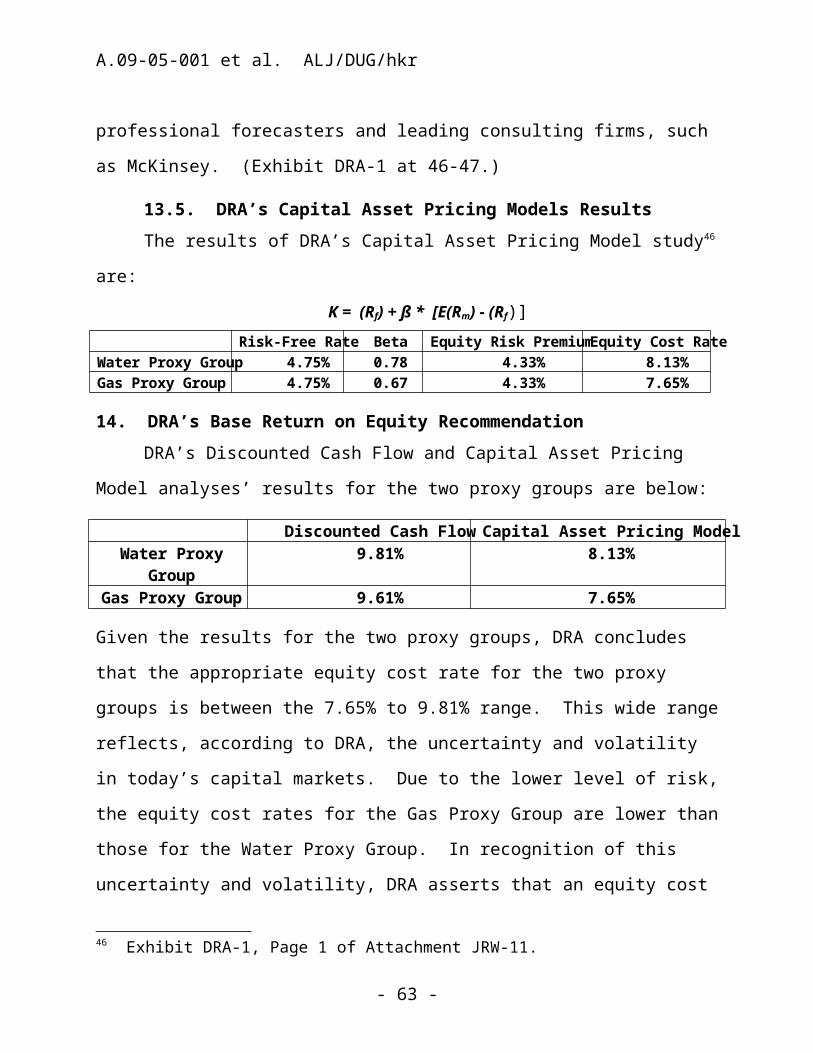
A.09-05-001 et al. ALJ/DUG/hkr
three multi-district companies. (Tr. Vol. 3 at 143, Sanchez/DRA.) DRA also recommends that the appropriate benchmark/index that should be applied to the various utilities’ water cost of capital adjustment mechanism in this proceeding should be based on the Moody’s Aa and Baa utility bonds.61 (Exhibit DRA-2 at 2.) If the utility’s rating was AA, A or higher, the Moody’s Aa bond index would apply; if the utility bonds are rated BBB+ or lower, the utility would apply Moody’s Baa.
DRA recognizes that Applicants do not have their bond issues rated by Moody’s or other rating agencies. Thus, an approximation must be made as to which of the Moody’s bond ratings would be applicable to Applicants as an index and for setting the benchmark. According to San Jose, the closest bond rating to the company’s debt profile is a Moody’s A public utility bond yield. Therefore, for setting up the water cost of capital adjustment mechanism for San Jose, the appropriate index for establishing the benchmark is Moody’s Aa utility bond yield. Park/Apple’s position is that the most comparable credit rating proxy for the company would be BBB, which in this case should be set using Moody’s Baa utility bonds. DRA believes that the remaining utilities have similar pricing structures to Park/Apple’s long-term bond yields. Thus, DRA recommends that Moody’s Baa utility bond yield index be applied to Suburban, San Gabriel, and Valencia.
61 Moody’s is one of several independent, unaffiliated research companies that rate fixed income securities. Moody’s assigns ratings on the basis of risk and the borrower’s ability to make interest payments. Moody’s ratings are ranked as follows: Aaa = highest grade, best quality issuer, lowest risk. This is followed progressively lower in grade, quality and risk with ratings of Aa, A, Baa (which reflects medium grade, moderate risk) and then Ba, B, Caa (which reflects poor grade, high risk), Ca, and C.
- 64 -
A.09-05-001 et al. ALJ/DUG/hkr
On February 27, 2009, DRA reached a settlement agreement with Golden State Water Company, California-American Water Company, and California Water Service Company on a water cost of capital adjustment mechanism. DRA proposes that this mechanism be used to adjust the return on equity and update long-term debt and preferred stock costs in the years between filings. DRA proposes the same adjustment trigger when the average 12-month index exceeds the established benchmark. DRA testified to how the mechanics will operate and apply to Applicants during cross-examination. (Tr. Vol. 3 at 144-145.) DRA noted that there is no major difference on how the adjustment would be applied to the various water utilities, except for the utility bond index rating to be used to set the benchmark.
18.3. San GabrielSan Gabriel argues that the upheaval in the financial markets
adversely affects where the benchmark should be set, and that the Commission should not deviate from its long-standing approach in forecasting cost of capital. (Transcript at 137.) It argues instead to use the forecasts for 2011 and 2012 included in its May 2009 application and testimony.
18.4. SuburbanSuburban raises an important problem: that the mechanism,
with a base year using the 2009 impacts of the financial crisis, could result in an unintended adjustment.
Suburban is more concerned, however, with the impact of the changes in the financial markets on the assumptions contained in the cost of capital adjustment mechanism that the Commission approved in D.09-07-051. The Commission must ensure that the water utilities in this proceeding are not unfairly subjected to downward adjustments to its returns as the markets recover from the period of poor
- 65 -
A.09-05-001 et al. ALJ/DUG/hkr
performance during which the adjustment mechanism was developed. (Suburban Opening Brief at 18.)
DRA also notes that the Commission has already determined that the water utilities generally have not been significantly harmed during the financial crisis. (D.09-07-051 at 10.) DRA also argues (Exhibit PWAV-8) the yields for AA and Baa utility bonds have dropped significantly from the highs at the peak of the financial crises, and DRA expects that they will continue to drop back to normal historical levels since the financial markets have begun to stabilize.
18.5. DiscussionWe find San Gabriel’s proposal to use its out-of-date forecasts
for 2011 and 2012 to be unreasonable—a forecast made in 2009 is clearly stale and does not reflect the real market condition changes by 2011 and 2012. We do agree, however, that the mechanism for the current applicants may have a likely bias towards a reduction in 2011. We believe this to be the case because, as we hope to see a continuing economic recovery in 2010 and later, we expect the Moody’s index to fall as market interest rates fall from the unusual highs included in the base year. San Gabriel notes that the index is likely to trigger increases for the three multi-district companies in 2010 based on the 2009-2010 market conditions. This is based on the projected impacts for BBB-rated companies in 2010 when adjusting their 2009 base year. Thus, if the economy improves, this could likely result in a decrease which would likely trigger a decrease in 2011 for San Gabriel and the other applicants assigned a BBB rating.
We believe the adjustment mechanism, in principle, is superior to stale forecasts. Therefore, we propose to modify the trigger this one time. Currently the trigger mechanism has a 100 basis point dead
- 66 -
A.09-05-001 et al. ALJ/DUG/hkr
band, plus and minus, before an adjustment occurs. We do not want an anomaly of the 2009-2010 index to likely result in a decrease simply because the economy returns to a more stable condition. Therefore, we will double the boundaries of the mechanism to 200 basis points. We will also use the base period October 1, 2009 through September 31, 2010 as the base period for these companies to offset prior market anomalies.
Moody’s Bond Rating Proxy
Applicant DRA AdoptedSan Jose A A AValencia Baa BaaPark/Apple BBB62 Baa BaaSan Gabriel No Baa BaaSuburban Baa Baa
19. Procedural MattersBy Resolution ALJ 176-3234, the Commission preliminarily
determined that the applications were ratesetting proceedings and that hearings were expected. This ratesetting classification was subsequently affirmed in the Assigned Commissioner’s Scoping Memo and Ruling. The Scoping Memo and Ruling designated Administrative Law Judge (ALJ) Long as the principal hearing officer, established an evidentiary hearing schedule and determined the issues in this proceeding.
20. Comments on Proposed DecisionThe proposed decision of the ALJ in this matter was mailed to
the parties in accordance with Pub. Util. Code § 311 and comments were allowed under Rule 14.3 of the Commission’s Rules of Practice 62 A rating of BBB by Standard & Poor’s is approximately the same as a Moody’s rating of Baa, a lower-medium investment grade rating.
- 67 -
A.09-05-001 et al. ALJ/DUG/hkr
and Procedure (Rules). Timely comments and replies were filed by all parties. To the extent parties reargued their previous position, we accord the comments no weight. Changes have otherwise been made to reflect reasonable corrections or clarifications. Some specific comments are addressed below. DRA in its comments supported the proposed return on equity but raised questions concerning the proper capital structures and the cost of new debt. Corrections and clarifications have been made to address these concerns.
Suburban proposes that the cost of capital adjustment mechanism’s deadband should be symmetrical and the deadband should be widened to 250 basis points before the return adjusts upwards or downwards, citing the smaller size, and therefore access to the financial markets, of the applicants compared to the large multi-district companies in A. 08-05-002 et al. (We note San Jose would fit the size range of those other companies.) We have modified the mechanism to be symmetrical because we are adopting the mechanism to stabilize the cost of capital from unanticipated or unintended decreases and we also intend to adjust the return should economic conditions require a higher return. Park/Apple also comment that the deadband for the cost of capital adjustment mechanism may still result in unintended reductions and therefore proposes either a larger deadband (as did Suburban) or the use of a benchmark that does not rely on the problematic 2008-09 time period. San Gabriel proposes that the Deadband should remain at 100 points but that the benchmark should change to the 12-months ending September 30, 2010 and that this would avoid the effects of the earlier market dislocations. We agree and this change was made to the base period. Corrections and
- 68 -
A.09-05-001 et al. ALJ/DUG/hkr
changes have been made to reflect these concerns with the proposed decision.
The proposed decision is revised to grant Valencia’s late-filed motion63 to adopt a 2011 and 2012 capital structure that recognizes a new $12 million, 12-year long term loan at a low cost of only 4.62%. DRA supports this specific adjustment in its Reply Comments (at 6).
San Gabriel chose not to establish a 2010 Cost of Capital Memorandum Account authorized by D. 09-12-019 and therefore it need not make any rate adjustments before the effective date of this decision, and appropriate changes have been made in this decision.
Applicants argue that the proposed decision failed to recognize and adjust the return on equity for a perceived risk that the companies borrow debt at higher interest rates than the proxy group of companies. (See Park/Apple Comments at 11.) In fact, the proposed decision fully addresses and compensates for this perceived risk by deferring extensively to the companies proposed capital structures and adopting the applicants’ embedded and forecast cost of debt. Thus, if Park/Apple or others historically borrowed at higher rates those rates are embedded in their cost of capital, and, despite DRA’s objections, we adopted the applicants’ rate forecasts for new debt. We believe that using the actual cost of debt offsets any other risk related to size.
21. Assignment of ProceedingJohn A. Bohn is the assigned Commissioner and Douglas M. Long
is the assigned ALJ in this proceeding.
63 Filed June 16, 2010, to set aside submission and consider new information. No party otherwise . . . timely commented on the motion.
- 69 -

A.09-05-001 et al. ALJ/DUG/hkr
Findings of Fact1. Applicants are public utilities subject to the jurisdiction of this Commission.2. The applications were consolidated pursuant to Rule 7.4.3. The financial markets and the economy in general have been in a recession from 2008 to present and the continued recovery appears to be slow. 4. The federal government has taken unusual and extensive steps to restore the economy.5. The utility industry generally, and water utilities specifically, have outperformed the overall equity market. 6. Applicants and DRA used similar proxy groups to model the water industry. Subjective as well as objective factors were used to select the different proxy groups resulting in different modeling outcomes.7. The natural gas proxy group is not a reasonable proxy for the water industry. 8. The Applicants’ selection of modeling input may tend to bias the results of the Discounted Cash Flow model upwards. Applicants did not use identical inputs and thus derived different recommended returns on equity from similar models.9. DRA’s selection of modeling input may tend to bias the results of the Discounted Cash Flow model downwards.
10. Pennichuck Corporation has been the subject of eminent domain proceedings. We can consider the inclusion of Pennichuck Corporation in a water proxy group because eminent domain is always a risk for any non-governmental, private utility.
- 70 -
A.09-05-001 et al. ALJ/DUG/hkr
11. The Capital Asset Pricing Model is dependent upon the population used to measure beta (risk).
12. The Capital Asset Pricing Model uses a subject “Risk Premium.” 13. The Applicants’ 2010 forecast of the cost of new debt is the most
reasonable evidence.14. DRA imputed a capital structure as a part of its
recommendations.15. High equity ratios can be more costly to ratepayers because the
income tax revenue requirement attached to equity returns may outweigh any higher issuance costs associated with debt for smaller companies.
16. None of the Applicants accurately or reliably quantified an excess risk which would warrant a premium over a general return on equity for Class A water utilities.
17. DRA’s 25 basis point risk adjustment up or down for Valencia and Suburban, respectively, is subjective and not verifiable.
18. The Commission has authorized a wide array of balancing and memorandum accounts which reduce the risk of recovering reasonable costs prudently incurred.
19. The parties cannot calculate an accurate impact on the required return for smaller Class A water companies compared to the larger Class A companies.
20. The parties cannot calculate an accurate impact on the required return for those companies which have a Water Revenue Adjustment Mechanism and a Modified Cost Balancing Account and those which do not.
- 71 -

A.09-05-001 et al. ALJ/DUG/hkr
21. The Commission has allowed utilities to recover prudently incurred water treatment costs and other costs associated with contamination abatement.
22. San Gabriel did not accurately quantify its risk premium request for contamination risks.
23. Park/Apple did not accurately calculate its risk premium based upon its small size compared to other Class A water companies.
24. San Jose is substantially similar in size to the multi-district Class A companies, including Golden State Water Company, California-American Water Company, and California Water Service Company.
25. Requiring San Jose to file its next cost of capital application in 2011 for a base year 2012 with the three multi-district companies would tend to balance the size of the proceedings and group San Jose with other larger, publicly traded, Class A water utilities.
26. A Water Cost of Capital Adjustment Mechanism will allow for an accurate adjustment based on the market interest rates between base year proceedings, rather than an inaccurate adjustment based on out-of-date forecasts of debt costs.
27. Adjusting the boundaries of the dead band may avoid unintended adjustments caused by recent poor market performance.
28. Adjusting the base period to October 1, 2009 to September 31, 2010 will offset prior market anomalies.
29. San Jose has a Moody’s bond rating of A which should be used for the Water Cost of Capital Adjustment Mechanism.
30. Valencia, Park/Apple, San Gabriel, and Suburban have the equivalent of a Moody’s bond rating of Baa which should be used for the Water Cost of Capital Adjustment Mechanism.
- 72 -
A.09-05-001 et al. ALJ/DUG/hkr
31. Valencia issued substantial debt totaling $12 million, doubling its debt ratio for 2011.
Conclusions of Law1. The consolidation of these applications does not imply that a uniform return on equity should automatically be applied to each of the utilities; however a uniform return may be applied if it is consistent with the record.2. The legal standard for setting the fair return on equity has been established by the United States Supreme Court in the Bluefield and Hope cases. (Federal Power Commission v. Hope Natural Gas Company, 320 U.S. 591 (1944) and Bluefield Water Works & Improvement Company v. Public Service Commission of the State of Virginia, 262 U.S. 679 1923).)3. The proxy companies in financial models must be a reasonable approximation of Applicants.4. Financial models are dependent on subjective inputs; therefore, it is reasonable to apply informed judgment when considering financial modeling results.5. The Commission should recognize the continuing financial dislocation in setting the return on equity to set a return that provides stability and attracts capital in times of economic uncertainty.6. This decision reasonably relies on the entire record of the proceeding and accords weight based upon the evidence’s relevance and the persuasiveness of the parties’ arguments. 7. It is reasonable to set aside submission and use Valencia’s latest financial information which materially affects 2011.
- 73 -
A.09-05-001 et al. ALJ/DUG/hkr
8. It is reasonable to consider the inclusion of Pennichuck Corporation in the water proxy groups because eminent domain is always a risk for any non-governmental, private utility.9. It is reasonable to adopt a return on equity within the ranges proposed by Applicants and DRA because the financial modeling results are susceptible to subjective input selections.
10. It is reasonable to require the utilities to justify in detail their specific capital structures in their next cost of capital proceeding.
11. A Water Cost of Capital Adjustment Mechanism based on changes in actual interest rates is superior to using out-of-date forecasts of debt costs.
12. This decision should be effective today.13. These proceedings should be closed.
O R D E R
IT IS ORDERED that:1. San Jose Water Company’s cost of capital for its base year 2010 operations is as follows:
San Jose Water Company Adopted Base Year 2010—A.09-05-001
Ratio Cost Weighted CostDebt 48% 7.03% 3.37%Equity 52% 10.20% 5.30% Rate of return 100% 8.68%
2. San Jose Water Company must file a Tier 1 advice letter to implement the rate changes to reflect the change in the 2010 cost of capital of 8.55%.
- 74 -

A.09-05-001 et al. ALJ/DUG/hkr
3. San Jose Water Company must file its next cost of capital application on or before May 1, 2011 for a new 2012 base year.4. Valencia Water Company’s cost of capital for its base year 2010 operations is as follows:
Valencia Water Company Adopted Base Year 2010—A.09-05-002
Ratio Cost Weighted CostDebt 23% 7.37% 1.70%Preferred 2% 9.50% 0.19%Equity 75% 10.20% 7.65% Rate of Return 100% 9.54%
5. Valencia Water Company’s cost of capital for attrition year 2011 operations is as follows:
Valencia 2011 Cost of CapitalRatio Cost Weighted
Debt 46% 6.00% 2.76%Preferred 2% 9.50% 0.19%Equity 52% 10.20% 5.30%Total 100% 8.28%
6. Valencia Water Company must file a Tier 1 advice letter to implement the rate changes to reflect the change in the 2010 cost of capital of 9.54% and 2011 cost of capital of 8.28%.
7. Valencia Water Company must file its next cost of capital application concurrent, but separately, with its next general rate case application.
8. Valencia Water Company must justify in detail its proposed capital structure in its next cost of capital application.
- 75 -
A.09-05-001 et al. ALJ/DUG/hkr
9. Park Water Company and Apple Valley Ranchos Water Company’s cost of capital for their base year 2010 operations is as follows:
Park Water Company and Apple Valley Ranchos Water Company Adopted Base Year 2010—A.09-05-003
Ratio Cost Weighted CostDebt 43% 8.38% 3.60%Equity 57% 10.20% 5.81% Rate of Return 100% 9.42%
10. Park Water Company and Apple Valley Ranchos Water Company must file a Tier 1 advice letter to implement the rate changes to reflect the change in the 2010 cost of capital of 9.42%.
11. Park Water Company and Apple Valley Ranchos Water Company must file a new cost of capital application on or before May 1, 2012 for a new 2013 base year.
12. San Gabriel Water Company’s cost of capital for its base year 2010 operations is as follows:
San Gabriel Water Company Adopted Base Year 2010—A.09-05-004
Ratio Cost Weighted CostDebt 36% 7.56% 2.72%Equity 64% 10.20% 6.53% 100% 9.25%
13. San Gabriel Water Company must file a Tier 1 advice letter to implement the rate changes to reflect the change in the 2010 cost of capital of 9.25%.
14. San Gabriel Water Company must file a new cost of capital application on or before May 1, 2012 for a new 2013 base year.
- 76 -

A.09-05-001 et al. ALJ/DUG/hkr
15. Suburban Water Systems’ cost of capital for its base year 2010 operations is as follows:
Suburban Water Systems Adopted Base Year 2010—A.09-05-005
Ratio Cost Weighted CostDebt 36% 7.05% 2.54%Preferred 4% 4.24% 0.17%Equity 60% 10.20% 6.12% 100% 8.83%
16. Suburban Water Systems must file a Tier 1 advice letter to implement the rate changes to reflect the change in the 2010 cost of capital of 8.83%.
17. Suburban Water Systems must file a new cost of capital application on or before May 1, 2012 for a new 2013 base year.
18. All advice letters required to implement the 2010 base year rate of return adopted in this decision must be filed within 30 days of the date of this order. The rate changes to reflect the change in the cost of capital shall be effective on January 1, 2010, as authorized by Decision 09-12-019, subject to the individual determination by the Commission’s Division of Water and Audits that the advice letters are in compliance with this decision.
- 77 -

A.09-05-001 et al. ALJ/DUG/hkr
19. Application (A.) 09-05-001, A.09-05-002, A.09-05-003, A.09-05-004, and A.09-05-005 are closed.
This order is effective today.Dated October 28, 2010, at San Francisco, California.
MICHAEL R. PEEVEY PresidentJOHN A. BOHNTIMOTHY ALAN SIMONNANCY E. RYAN
Commissioners
Commissioner Dian M. Grueneich, being necessarily absent, did not participate.
- 78 -