Embed Size (px)
Citation preview
DOCUMENT RESUME
ED 413 368 UD 031 956
AUTHOR Watanabe, Paul; Jennings, James; Melendez, Edwin; Liu,Michael; Remy, Gemima; Gomez, Christina; Williams, Russell
TITLE Changing Demographics, Challenges, & New Opportunities forBoston. A Dream Deferred.
INSTITUTION Massachusetts Univ., Boston. Inst. for Asian AmericanStudies.
SPONS AGENCY Ford Foundation, New York, NY.PUB DATE 1996-01-00NOTE 56p.; A Special Study commissioned by the Boston Foundation
as part of "The Changing Communities, Diverse Needs."PUB TYPE Reports Evaluative (142)EDRS PRICE MF01/PC03 Plus Postage.DESCRIPTORS *Asian Americans; *Blacks; *Demography; Ethnicity; *Hispanic
Americans; Minority Groups; Social Change; *Social Problems;Socioeconomic Status; *Urban Problems; Urban Youth
IDENTIFIERS *Massachusetts (Boston)
ABSTRACTMany minorities in Boston (Massachusetts) do not feel part
of the entire community because the city does not work for people in minoritygroups in fundamental ways. This report analyzes the content and consequencesof Boston's many contradictions and the challenges these contradictions posefor the city's three major communities of color: Blacks, Hispanic Americans,and Asian Americans. It begins with a demographic overview of Boston,comparing ethnic and racial groups and stressing importalat populationcharacteristics, such as size, racial and 'ethnic makeup, age, and residencypatterns. Also examined are selected socioeconomic variables of income,employment, education, and housing. The second part of the report is ahistorical and institutional portrait of Boston's Black, Asian American, andLatino communities. The report concludes by exploring the challenges andopportunities for all who care about the health and vitality of the city.(Contains 4 maps, 16 figures, and 29 references.) (SLD)
********************************************************************************
Reproductions supplied by EDRS are the best that can be madefrom the original document.
********************************************************************************
A IP Pen II" I
J
..J
L L B J _J i 9
U S DEPARTMENT OF EDUCATIONOffice of Educational Research and improvementEDUCATIONAL RESOURCES INFORMATION
CENTER (ERIC)XiTnrs document has peen reproduced asrecetved from the person or organizationoriginating ,I0 Minor changes nave been made to improve
reProducliOn Quality
Points 01 new or Opinions stated in this COCuelect CO not necessarily reoreSerif officialOERI position or policy
2
t
PERMISSION TO REPRODUCE ADISSEMINATE THIS MATERIAI
HAS BEEN GRANTED BY
as CUaloa_L______D&
h1.5/ Iv,- &co Mr,51? i
TO THE EDUCATIONAL RESOURINFORMATION CENTER (ERIC
BEsT COPy
A Dream Deferred
Changing Demographics,Challenges & New Opportunities
for Boston
3
CHA
CHALLEN
A Dream Deferred
GING DEMOGRAP
ES, & NEW OPPO
FOR BOSTON
ICS,
TUNITIES
Paul Watanabe, Ph.D.Co-director, Institute for Asian American Studies
with
James Jennings, Ph.D., Director, William Monroe Trotter Institute
Edwin Melendez, Ph.D., Director, Mauricio Gaston Institute
Michael Liu, Research Assistant, Institute for Asian American Studies
Gemima Remy, Research Assistant, William Monroe Trotter Institute
Christina Gomez, Research Assistant, Mauricio Gaston Institute
Russell Williams, Research Associate, William Monroe Trotter Institute
UNIVERSITY OF MASSACHUSETTS BOSTON
A SPECIAL STUDY COMMISSIONED BY THE BOSTON FOUNDATION
AS PART OF "THE CHANGING COMMUNITIES, DIVERSE NEEDS" INITIATIVE
FUNDED BY THE FORD FOUNDATION
JANUARY 1996
4
For further information:
Institute for Asian American StudiesUniversity of Massachusetts BostonHealey 10-7100 Morrissey BoulevardBoston, Massachusetts 02125(617) 287-5650
Or
The Boston FoundationOne Boston Place, 24th FloorBoston, MA 02108(617) 723-7415
5
vii
Contents
List of Figures and Maps ix
Preface xi
Acknowledgments
I. Introduction:
Two Sides of the City and the Search for Community 1
H. Demographic & Socioeconomic Profile of Boston 5
Population Characteristics 5
Size and Growth 5
Recent Immigration 6
Residency Patterns 9
Age 15
Household Size 16
Socioeconomic Characteristics 17
Income and Poverty 17
Employment and Unemployment 19
Education 20
Housing 21
Ill. Recent History & Institutional Overview:Blacks, Asian Americans and Latinos in Boston 23
History and Development to 1960 23
The 1960s and Beyond 24
The Changing Boston Economy 24
Consequences of Change 25
Urban Renewal 26
The Changing Political Culture 26
Migration and Immigration 26
6
viii
Ill. Recent History & Institutional Overview (continued)Responses 27
Local Economic Development 29
Employment Impacts 30
Minority Businesses 31
Institutions 32
Politics 32
Culture 34
Community Organizations 35
The Old and the New 36
IV. Challenges & Opportunities 39
Building a Diverse and Workable Community 39
Political Power 39
Economic Empowerment 40
Community-based Structures 41
Unity with Diversity 41
A New Boston 42
References 45
7
ix
List of Figures and Maps
Figure
1. Population by Race and Ethnicity, 1980 6
2. Population by Race and Ethnicity, 1990 6
3. Change in Population by Race and Ethnicity, 1980-1990 7
4. Newcomers as a Percent of Population, 1990 7
5. Latino Population by National Origin, 1990 8
6. Asian American Population by National Origin, 1990 8
7. Neighborhoods by Race and Ethnicity, 1990 9
8. Change in White Population by Neighborhood, 1980-1990 14
9. Median Age by Race and Ethnicity, 1990 16
10. Average Number of Persons and Children per Householdby Race and Ethnicity, 1990 16
11. Families and Children in Poverty by Race and Ethnicity, 1990 17
12. Per Capita Income by Race and Ethnicity, 1990 18
13. Unemployment Rate by Race and Ethnicity, 1990 19
14. Educational Attainment by Race and Ethnicity, 1990 20
15. Owner Occupancy Rates by Race and Ethnicity, 1990 21
16. Change in Population by Race and Ethnicity, 1960-1990 25
Map
1. Blacks by 1990 Census Tracts 10
2. Latinos by 1990 Census Tracts 11
3. Asian Americans by 1990 Census Tracts 12
4. Whites by 1990 Census Tracts 13
S
XI
Preface
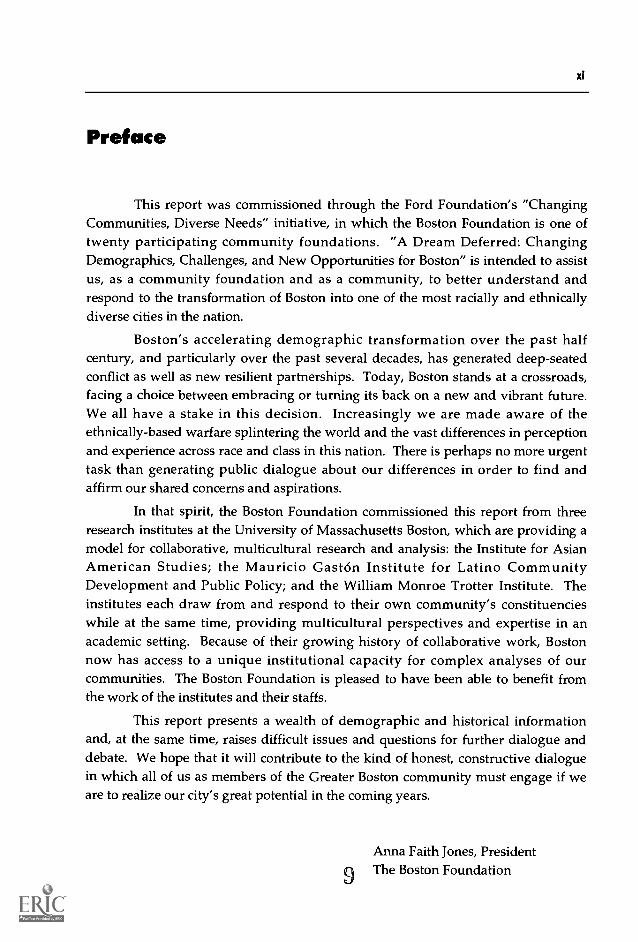
This report was commissioned through the Ford Foundation's "ChangingCommunities, Diverse Needs" initiative, in which the Boston Foundation is one oftwenty participating community foundations. "A Dream Deferred: ChangingDemographics, Challenges, and New Opportunities for Boston" is intended to assistus, as a community foundation and as a community, to better understand andrespond to the transformation of Boston into one of the most racially and ethnicallydiverse cities in the nation.
Boston's accelerating demographic transformation over the past halfcentury, and particularly over the past several decades, has generated deep-seatedconflict as well as new resilient partnerships. Today, Boston stands at a crossroads,facing a choice between embracing or turning its back on a new and vibrant future.We all have a stake in this decision. Increasingly we are made aware of theethnically-based warfare splintering the world and the vast differences in perceptionand experience across race and class in this nation. There is perhaps no more urgenttask than generating public dialogue about our differences in order to find andaffirm our shared concerns and aspirations.
In that spirit, the Boston Foundation commissioned this report from threeresearch institutes at the University of Massachusetts Boston, which are providing amodel for collaborative, multicultural research and analysis: the Institute for AsianAmerican Studies; the Mauricio Gaston Institute for Latino CommunityDevelopment and Public Policy; and the William Monroe Trotter Institute. Theinstitutes each draw from and respond to their own community's constituencieswhile at the same time, providing multicultural perspectives and expertise in anacademic setting. Because of their growing history of collaborative work, Bostonnow has access to a unique institutional capacity for complex analyses of ourcommunities. The Boston Foundation is pleased to have been able to benefit fromthe work of the institutes and their staffs.
This report presents a wealth of demographic and historical informationand, at the same time, raises difficult issues and questions for further dialogue anddebate. We hope that it will contribute to the kind of honest, constructive dialoguein which all of us as members of the Greater Boston community must engage if weare to realize our city's great potential in the coming years.
Anna Faith Jones, President
9 The Boston Foundation
Acknowledgments
A dominant theme of this study is the search for communitya collectivitycommitted to common pursuits that supports and builds upon the individualstrengths and proclivities of diverse sectors. Readers of this study will find that forBoston, despite some notable advances, the full realization of community remainsproblematic. Fortunately the writers and researchers that prepared this report aredrawn from a genuine community of scholars at the University of MassachusettsBoston. The Institute for Asian American Studies, the Mauricio Gaston Institute forLatino Community Development and Public Policy, and the William Monroe TrotterInstitute contribute to the university's unique, collaborative multicultural researchcapacity. In addition to my co-authors, I want to thank Connie Chan, Peter Kiang,and Shirley Mark for their insightful comments and contributions. Michelle Janmeyprovided valuable editorial assistance. Marilyn Wu was responsible for design andlayout. Finally, I am grateful to the Boston Foundation and the Ford Foundation fortheir support of this project. In particular, I want to acknowledge the BostonFoundation for its belief that "the vitality of the Greater Boston community dependsupon the ability of people to be responsible for themselves and concerned about oneanother."
Paul WatanabeUniversity of Massachusetts Boston
10
CHANGING DEMOGRAPHICS, CHALLENGES, 8 NEW OPPORTUNITIES FOR BOSTON 1
Introthiction
Two Sides of the City and the Search for Community
Bostonians love celebrations.Fireworks on the Esplanade, TallShips sailing majestically in the
harbor, the Boston Marathon, and achampionship for the Celtics elicit exu-berance and pride in the hearts of thecity's residents. Civic spirit is one ofBoston's most endearing qualities.
There is another side to Boston thatis less recognized. While large numbersof residents may come together to cele-brate, too often there is a feeling, partic-ularly in the Black, Latino, and AsianAmerican communities, that seriousproblems are hidden and they are leftto deal with them alone. For some eth-nic minorities, it is difficult to create atrue sense of civic pride beyond theirown communities. The city does notwork for a large proportion of thesepeople in fundamental wayseconom-ically, socially, culturally, educational-ly, or politically. Instead of uplifting
the spirit, a sense of alienation and theracial differences that often feed it areenduring.
This report analyzes the contentand consequences of Boston's manycontradictions. These contradictionsare evident everywhere. For example,Boston has been called the "Athens ofAmerica," a magnet drawing the bestminds and intellectual talent fromacross the nation and even the world.Yet, at the time this report was written,more than one-fourth of Boston's fifteenhigh schools are in danger of losingaccreditation. Boston is a tourist mecca,welcoming thousands of visitors fromevery corner of the globe. Yet certainareas of the city are regarded as inhos-pitable and "off-limits" to certain groups.
This report is more than a tale oftwo sides of the city. It also examinesthe challenges that these troubling con-tradictions pose for the city's three
2 INTRODUCTION
major communities of color. Will aprivileged few continue to enjoy pros-perity while many others remain inpoverty? Will some participate enthu-siastically while others remain uninter-ested in or locked-out of the politicalprocess? Will the city continue its tra-dition of relying on top-notch examschools to serve a select few or begininstead to implement excellencethroughout the school system to serveall its students?
The discussion of the city's contra-dictions and challenges is intimatelylinked to the dramatic changes thatBoston has experienced in the last fewdecades. Data from a variety ofsources, most notably the 1990 U.S.Census,1 is presented and the implica-tions of the city's on-going demograph-ic and socioeconomic transformationsare considered. Boston's population isbecoming more diverse with an increas-ing percentage of persons of color. Thegrowing Black, Latino, and AsianAmerican populations are also experi-encing expanded diversity within theirown membership. Gaps in income,poverty, and unemployment are evi-dent and in some cases widening.
In addition to addressing the chal-lenges that accompany change, it is cru-cial to take account of the considerableopportunities that are offered as well.In many ways, through economicdevelopment, community organizing,
and boosting personal pride and initia-tive, Boston's Blacks, Latinos, andAsian Americans are fostering ambitionand building strength in themselves,their families, their neighborhoods, andthe city as a whole. As described in therecently published book, New Migrantsin the Marketplace: Boston's EthnicEntrepreneurs (Halter, 1995), a range ofnew immigrant groups are encouragingfresh and innovative small businessactivity and a unique economic culturein areas of Boston. Community devel-opment initiatives in the city's minorityneighborhoods often go unrecognizedand unheralded. They have struggledto hold their communities together, butthe resources made available to themcannot for much longer remain inade-quate.
This report also explores the elusivesearch for a sense of community. Theprocess of change and the persistence ofdivisive contradictions make it difficultto find ways of binding people togeth-er. Indeed at times centrifugal forcesseem to hold sway over forces thatunite. In Boston, as in many cities thathave undergone dramatic demographicand related transformations, relationsbetween racial and ethnic groups havebeen marred on occasion by misunder-standings, suspicion, and violence. Thetroubled dimensions of change have ledsome individuals to denounce theemphasis on differences and to decry
1The 1990 U.S. Census allows for the examination of the situation of Blacks, Latinos, and Asian Americans and providesthe most comprehensive available information on these groups. It should be recognized, however, that there are somelimitations in the data. In particular, linguistic, cultural, and other barriers contribute to undercounting. Aggregation anderrors in coding also limit the reliability of some census data. In addition, it should be noted that Latinos are generallynot treated as a distinct racial category. Consequently, they may be of any race.
12
CHANGING DEMOGRAPHICS, CHALLENGES, It NEW OPPORTUNITIES FOR BOSTON 3
pluralism and multiculturalism. Theirbelief is that separateness must bereplaced by sameness, heterogeneity byhomogeneity. Other individuals wantto maintain the distance between ethnicgroups, believing distinctive destiniesshould take precedence over commonpurpose.
Based on past experiences andfuture aspirations, neither viewpointalone is adequate. A true communityin Boston cannot exist without diversi-ty, and diversity cannot flourish with-out a sense of community. Pluralismmust be allowed to prosper in the cityas long as it is manifested without hier-archy. Otherwise Boston risks beingtorn asunder by intolerant racial andethnic chauvinism masquerading ashealthy racial and ethnic pride. If thisattitude prevails, the city will be onewhere, paraphrasing George Orwell, allgroups are equal, but some groups aremore equal than others.
Contradictions, challenges, changes,opportunities, and the desire to build asense of community with diversity are
the themes of this report. All of thesesuggest that important decisions lieahead for those struggling to hold on topower in Boston and those desiring tohave it shared more equitably. Formany individuals in Boston's racial andethnic communities, the choices avail-able are fraught with uncertainty.Should people be guided by their ownassessment of the harsh, troubling, andprolonged realities they face daily or bythe hope that things can and willchange for the better? The noted poetPhillis Wheatley, a Black slave,accounted for the inner power and sus-taining vision of women caught inwretched slavery and starving for free-dom by stating, "She feeds on truthsand uncreated things." How muchlonger can those in the city relegated tothe sidelines be expected to gain suste-nance not from what is but from whatcan be? The unconfronted challenge, asLangston Hughes so eloquently posedit, is: "What happens to a dreamdeferred?"2
2Harlem
What happens to a dream deferred?
Does it dry uplike a raisin in the sun?Or fester like a soreAnd then run?Does it stink like rotten meat?Or crust and sugar overlike a syrupy sweet?
Maybe it just sagslike a heavy load.
Or does it explode? (1951)
'3
4 INTRODUCTION
Those who wish to take totaladvantage of what Boston has to offerhope that all of its residents will feelfree to tread safely wherever they wantto go, to educate children in qualityschools, and to participate fully andfairly in the economic, political, andsocial life of the city. The reality is thatmany in each of Boston's racial groupshave neighborhoods where they fearthey are not welcome and schools des-perately in need of attention. Thosewho care about all of the city's resi-dents hope that change will promoteprogress. Perhaps the city that comestogether so easily in celebration canaddress in a constructive and collectiveway, and with equal zeal, economichardship wherever it exists, the despairand cynicism that accentuate politicalalienation, and the persistent racismthat damages individual dignity anddivides Boston.
This report, arranged in severalparts, begins with a demographicoverview of Boston, comparing ethnic
and racial groups and stressing impor-tant population characteristicssize,racial and ethnic makeup, age, and resi-dency patterns. Also examined areselected socioeconomic variablesincome, employment, education, andhousing. The second part of the reportis an historical and institutional portraitof Boston's Black, Asian American, andLatino communities. The report con-cludes by exploring the resulting chal-lenges and opportunities for Boston'sresidents, leaders and for those whocare about the health and vitality of thecity.
The report is intended to catalyzeserious discussion, especially in broadand participatory community forums,about Boston and its future. What mustbe addressed is bettering the lives anddestinies of the diverse individuals thatmake up Boston's current population.With the world watching what JohnWinthrop extolled as "the city on ahill," the quality of life of all itsresidents is the true measure ofBoston's success and failure.
14
CHANGING DEMOGRAPHICS, CHALLENGES, & NEW OPPORTUNITIES FOR BOSTON 5
DemographicProfiilo
Population Characteristics
Size and Growth
ioeconomicston
Studies of the 1990 U.S. Censusand other data have chronicledBoston's rapid demographic
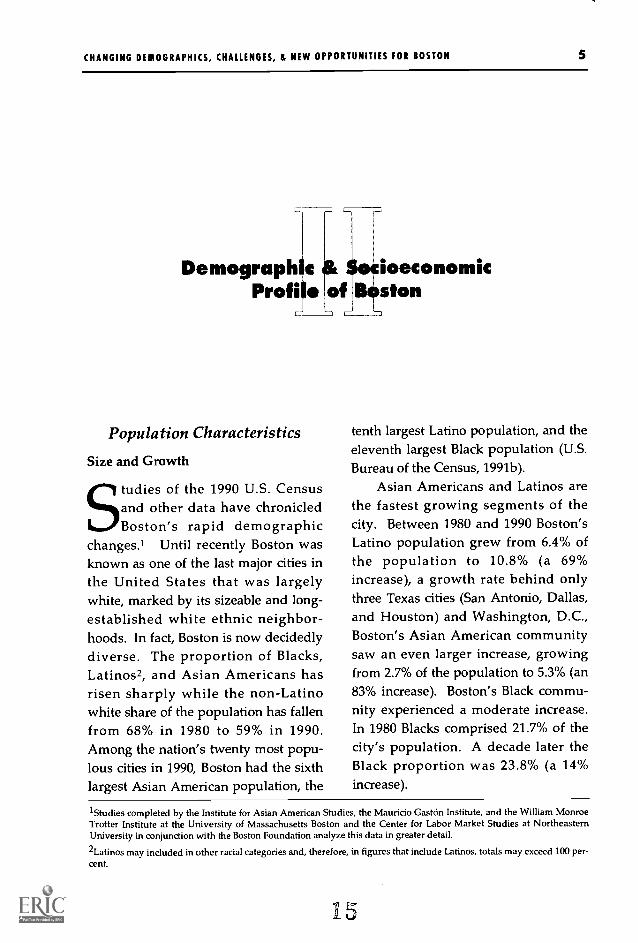
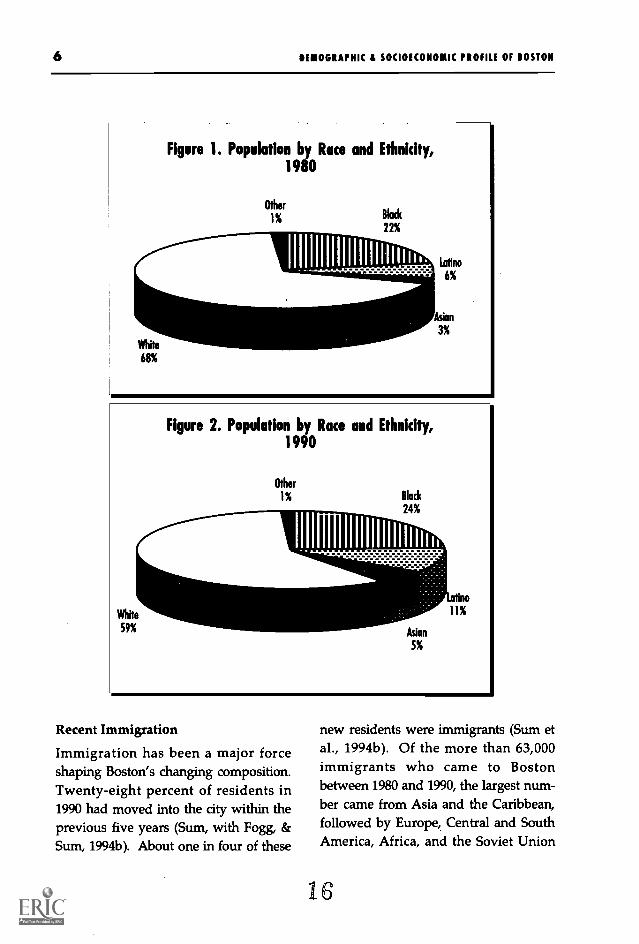
changes.1 Until recently Boston wasknown as one of the last major cities inthe United States that was largelywhite, marked by its sizeable and long-established white ethnic neighbor-hoods. In fact, Boston is now decidedlydiverse. The proportion of Blacks,Latinos2, and Asian Americans hasrisen sharply while the non-Latinowhite share of the population has fallenfrom 68% in 1980 to 59% in 1990.Among the nation's twenty most popu-lous cities in 1990, Boston had the sixthlargest Asian American population, the
tenth largest Latino population, and theeleventh largest Black population (U.S.Bureau of the Census, 1991b).
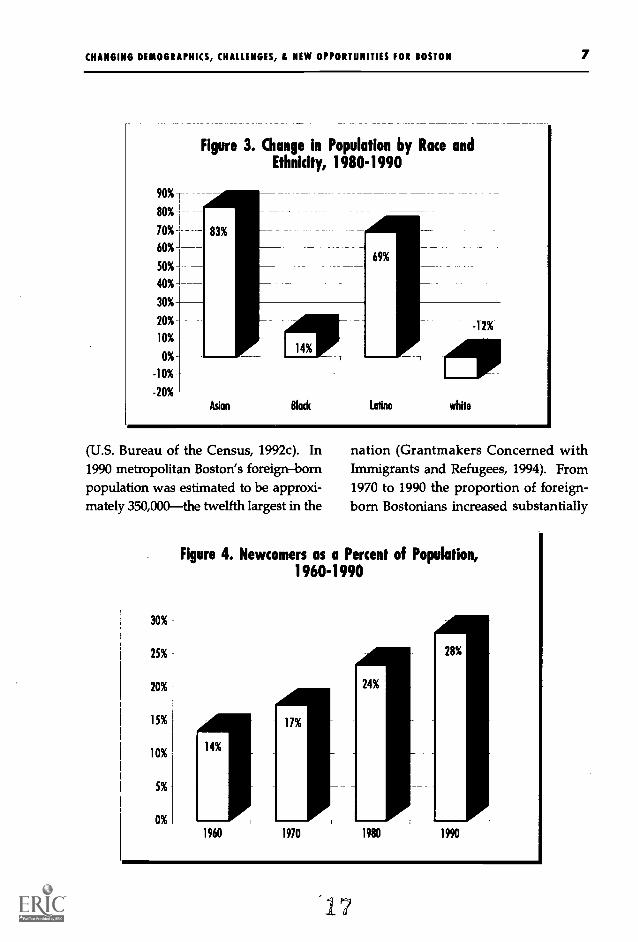
Asian Americans and Latinos arethe fastest growing segments of thecity. Between 1980 and 1990 Boston'sLatino population grew from 6.4% ofthe population to 10.8% (a 69%increase), a growth rate behind onlythree Texas cities (San Antonio, Dallas,and Houston) and Washington, D.C.,Boston's Asian American communitysaw an even larger increase, growingfrom 2.7% of the population to 5.3% (an83% increase). Boston's Black commu-nity experienced a moderate increase.In 1980 Blacks comprised 21.7% of thecity's population. A decade later theBlack proportion was 23.8% (a 14%increase).
1Studies completed by the Institute for Asian American Studies, the Mauricio Gaston Institute, and the William MonroeTrotter Institute at the University of Massachusetts Boston and the Center for Labor Market Studies at NortheasternUniversity in conjunction with the Boston Foundation analyze this data in greater detail.
2Latinos may included in other racial categories and, therefore, in figures that include Latinos, totals may exceed 100 per-cent.
I5
6 DEMOGRAPHIC & SOCIOECONOMIC PROFILE OF IOSTON
White
68%
Figure 1. Population by Race and Ethnicity,1980
Other
1% Black
22%
1111111111111111111111111 Latino
6%
Asian
3%
Figure 2. Population by Race and Ethnicity,1990
Recent Immigration
Immigration has been a major forceshaping Boston's changing composition.Twenty-eight percent of residents in1990 had moved into the city within theprevious five years (Sum, with Fogg, &Sum, 1994b). About one in four of these
new residents were immigrants (Sum etal., 1994b). Of the more than 63,000immigrants who came to Bostonbetween 1980 and 1990, the largest num-ber came from Asia and the Caribbean,followed by Europe, Central and SouthAmerica, Africa, and the Soviet Union
16
CHANGING DEMOGRAPHICS, CHALLENGES, A NEW OPPORTUNITIES FOR IOSTON 7
90%
80%-
70%-
60%-
50%-
40%-
30%
20 %-
10%
0%
-10%
-20%
Figure 3. Change in Population by Race andEthnicity, 1980-1990
Asian 81a& Latino white
(U.S. Bureau of the Census, 1992c). In1990 metropolitan Boston's foreign-bornpopulation was estimated to be approxi-mately 350,000the twelfth largest in the
30%
25%
20%
15%
10%
5%
0%
nation (Grantmakers Concerned withImmigrants and Refugees, 1994). From1970 to 1990 the proportion of foreign-born Bostonians increased substantially
Figure 4. Newcomers as a Percent of Population,1960-1990
14%
I
1960 1970 1980 1990
17
8 DEMOGRAPHIC & SOCIOECONOMIC PROFILE OF BOSTON
Cuban
4%
Guatemalan
4%
Mexican
4%
Figure 5. Latino Population by National Origin,1990
Other
22%
Salvadoran
5% Colombian
5%Dominican
13%
Puerto Rican
43%
Figure 6. Asian American Population by NationalOrigin, 1990
Korean
4%
Japanese
5%
Asian Indian
6%
Other
4
Filipino
%
Cam
3%
Cambodian7%
Vietnamese
17%
Chinese
54%
from about 13% to 20% (Sum et al.,1994a).
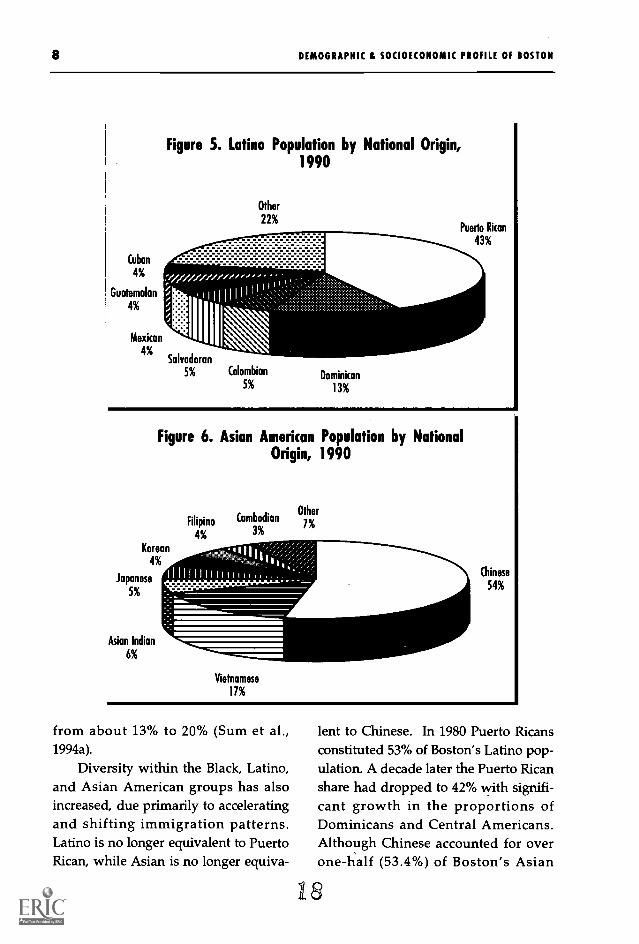
Diversity within the Black, Latino,and Asian American groups has alsoincreased, due primarily to acceleratingand shifting immigration patterns.Latino is no longer equivalent to PuertoRican, while Asian is no longer equiva-
lent to Chinese. In 1980 Puerto Ricansconstituted 53% of Boston's Latino pop-ulation. A decade later the Puerto Ricanshare had dropped to 42% with signifi-cant growth in the proportions ofDominicans and Central Americans.Although Chinese accounted for overone-half (53.4%) of Boston's Asian
l8
CHANGING DEMOGRAPHICS, CHALLENGES, & NEW OPPORTUNITIES FOR BOSTON 9
American population in 1990, a decadeearlier the Chinese share of the AsianAmerican population was nearly three-quarters (74%). The most rapid growthamong Asian Americans in Boston hasbeen recorded by Southeast Asians.The number of Vietnamese in Boston,for example, expanded by nearly 500%during the 1980s (Institute for AsianAmerican Studies, 1994). Similarly,within the Black community, Haitiansand other Caribbean Islanders, CapeVerdeans, Ethiopians, Somalians, andNigerians constitute growing segments.By the early 1990s Boston's Haitian
population was behind only Miami andNew York in size (MassachusettsDepartment of Health, 1993). A newinflux of Irish, Eastern Europeans, andRussians and other former residents ofthe Soviet Union has added to Boston'swhite ethnic populations.
Residency Patterns
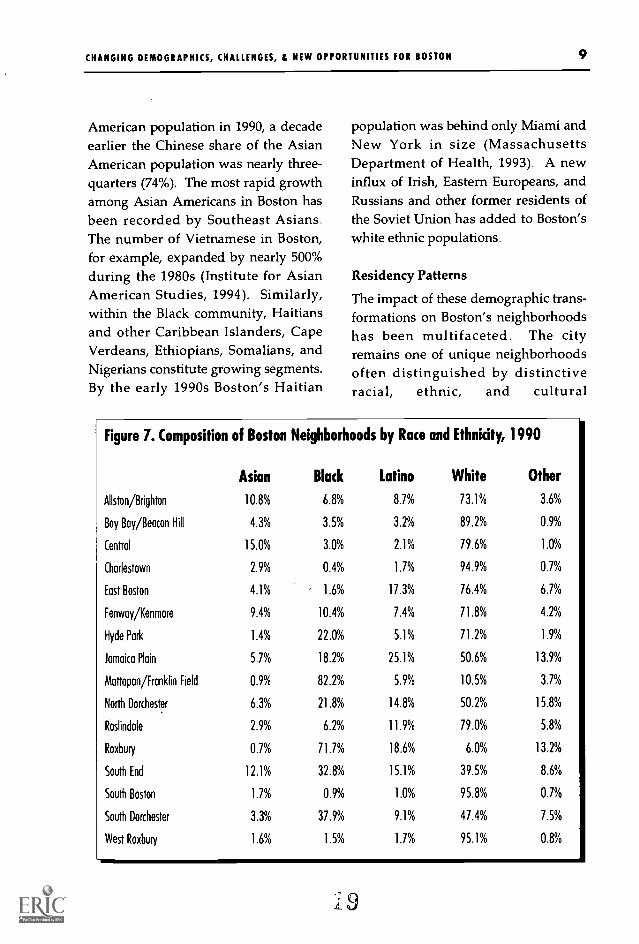
The impact of these demographic trans-formations on Boston's neighborhoodshas been multifaceted. The cityremains one of unique neighborhoodsoften distinguished by distinctiveracial, ethnic, and cultural
Figure 7. Composition of Boston Neighborhoods by Race and Ethnicity, 1990
Asian Black Latino White Other
Allston/Brighton 10.8% 6.8% 8.7% 73.1% 3.6%
Bay Bay/Beacon Hill 4.3% 3.5% 3.2% 89.2% 0.9%
Central 15.0% 3.0% 2.1% 79.6% 1.0%
Charlestown 2.9% 0.4% 1.7% 94.9% 0.7%
East Boston 4.1% 1.6% 17.3% 76.4% 6.1%
Fenway/Kenmore 9.4% 10.4% 7.4% 71.8% 4.2%
Hyde Park 1.4% 22.0% 5.1% 71.2% 1.9%
Jamaica Plain 5.7% 18.2% 25.1% 50.6% 13.9%
Mattapan/Franklin Field 0.9% 82.2% 5.9% 10.5% 3.7%
North Dorchester 6.3% 21.8% 14.8% 50.2% 15.8%
Roslindale 2.9% 6.2% 11.9% 79.0% 5.8%
Roxbury 0.7% 71.7% 18.6% 6.0% 13.2%
South End 12.1% 32.8% 15.1% 39.5% 8.6%
South Boston 1.7% 0.9% 1.0% 95.8% 0.7%
South Dorchester 3.3% 37.9% 9.1% 47.4% 7.5%
West Roxbury 1.6% 1.5% 1.7% 95.1% 0.8%
10 DEMOGRAPHIC & SOCIOECONOMIC PROFILE OF BOSTON
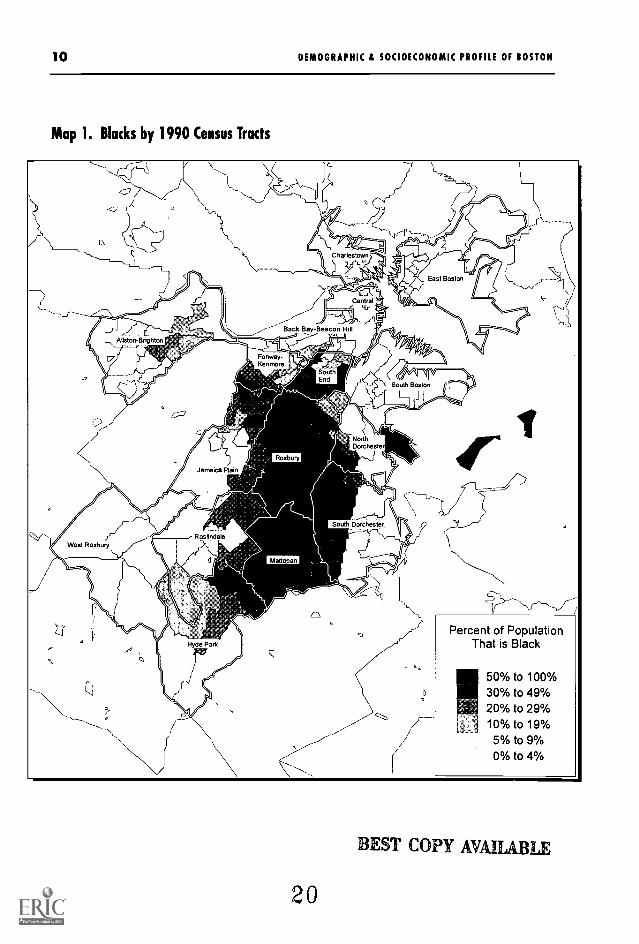
Map 1. Blacks by 1990 Census Tracts
Charlestown
Central`1?
Back Bay-Beacon Hill
FenwayKenmore
South Boston
NorthDorcheste
Jamaica Plain
West RoxburyRoslindale
Roxbury
AL
Matta an
LI
OHyde Park
20
Percent of PopulationThat is Black
50% to 100%30% to 49%20% to 29%10% to 19%
5% to 9%0% to 4%
BEST COPY AVAILABLE
CHANGING DEMOGRAPHICS, CHALLENGES, & NEW OPPORTUNITIES FOR BOSTON 11
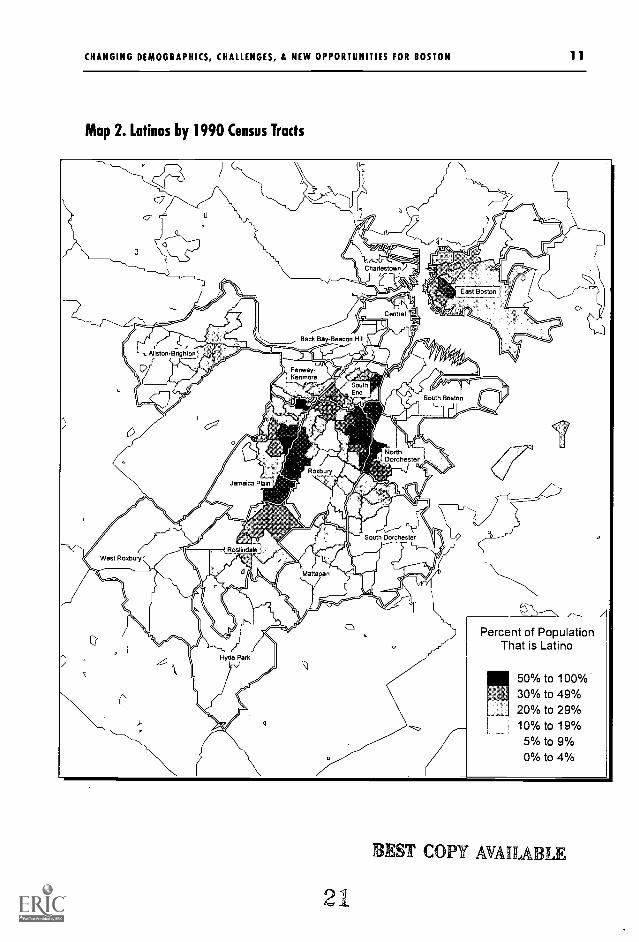
Map 2. Latinos by 1990 Census Tracts
South Dorchester
Percent of PopulationThat is Latino
50% to 100%.30% to 49%
1 20% to 29%10% to 19%5% to 9%0% to 4%
BEST COPY AVAILA,.,LE
21
12 DEMOGRAPHIC & SOCIOECONOMIC PROFILE OF BOSTON
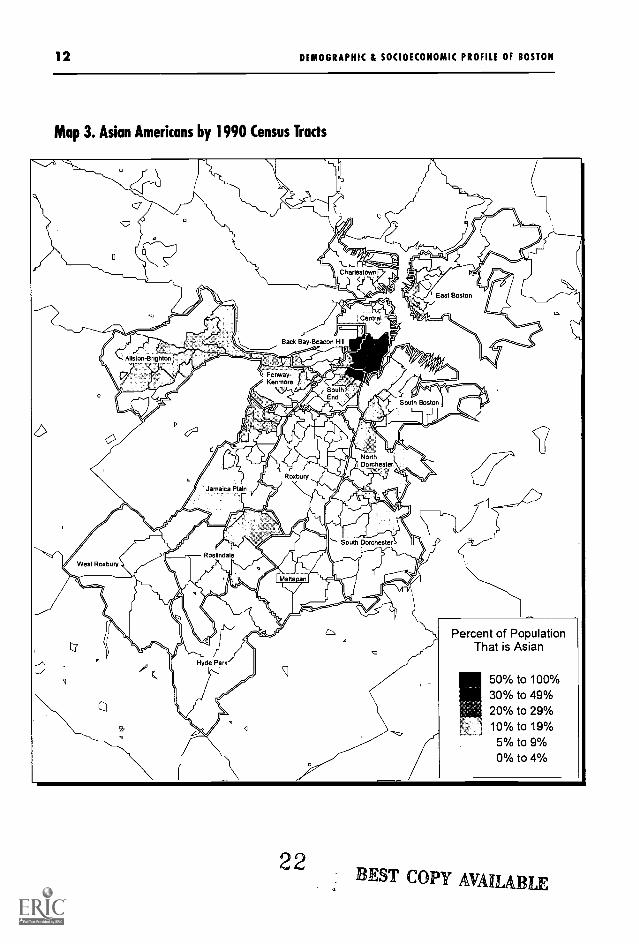
Map 3. Asian Americans by 1990 Census Tracts
Back Bay Beacon Hill
Allston-Brighton
Fenway-Kenmore
NorthDorchester;
111°South Dorchester
41.11.611111W.'/
Percent of PopulationThat is Asian
50% to 100%30% to 49%20% to 29%10% to 19%5% to 9%0% to 4%
22EST COPY AVAIIABLE
CHANGING DEMOGRAPHICS, CHALLENGES, & NEW OPPORTUNITIES FOR BOSTON 13
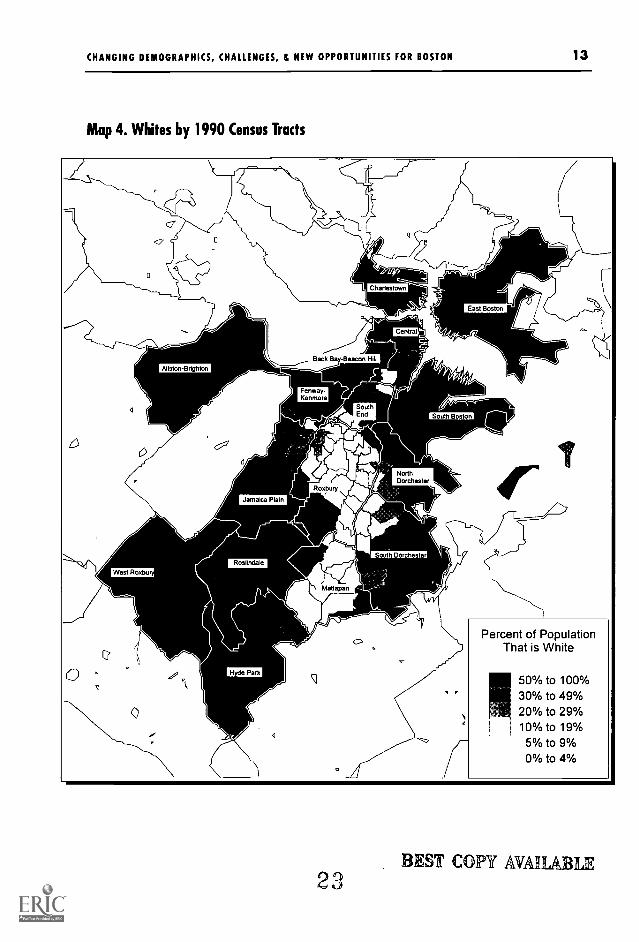
Map 4. Whites by 1990 Census Tracts
Allston-Bnghton
_/Back Bay-Beacon Hill
Fenway-Kenmore
Jamaica Plain OrRoxbury
SouthN. End
Roslindale
H e Park
P-sZMattapan
Central
or
14,
IreSouth Boston
South Dorchester_li
23
Percent of PopulationThat is White
50% to 100%30% to 49%20% to 29%10% to 19%5% to 9%0% to 4%
BEST COPY AVAILABLE
14 DEMOGRAPHIC IL SOCIOECONOMIC PROFILE OF BOSTON
20%
10%
0%
-10%
-20%
-30%
-40%
-50%
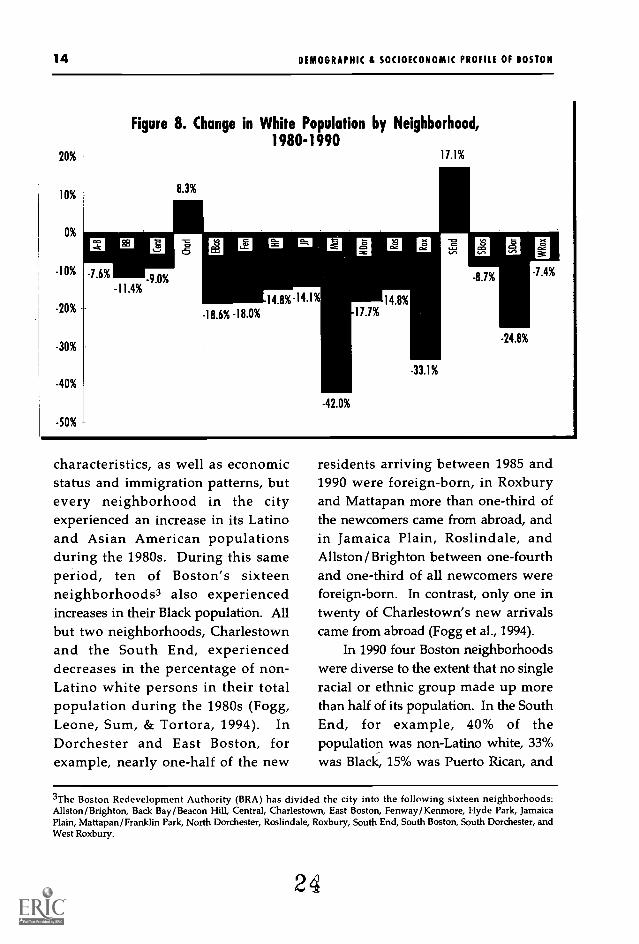
Figure 8. Change in White Population by Neighborhood,1980-1990
17.1%
8.3%
-42.0%
-33.1%
-24.8%
characteristics, as well as economicstatus and immigration patterns, butevery neighborhood in the cityexperienced an increase in its Latinoand Asian American populationsduring the 1980s. During this sameperiod, ten of Boston's sixteenneighborhoods3 also experiencedincreases in their Black population. Allbut two neighborhoods, Charlestownand the South End, experienceddecreases in the percentage of non-Latino white persons in their totalpopulation during the 1980s (Fogg,Leone, Sum, & Tortora, 1994). InDorchester and East Boston, forexample, nearly one-half of the new
residents arriving between 1985 and1990 were foreign-born, in Roxburyand Mattapan more than one-third ofthe newcomers came from abroad, andin Jamaica Plain, Roslindale, andAllston/Brighton between one-fourthand one-third of all newcomers wereforeign-born. In contrast, only one intwenty of Charlestown's new arrivalscame from abroad (Fogg et al., 1994).
In 1990 four Boston neighborhoodswere diverse to the extent that no singleracial or ethnic group made up morethan half of its population. In the SouthEnd, for example, 40% of thepopulation was non-Latino white, 33%was Black, 15% was Puerto Rican, and
3The Boston Redevelopment Authority (BRA) has divided the city into the following sixteen neighborhoods:Allston/Brighton, Back Bay/Beacon Hill, Central, Charlestown, East Boston, Fenway /Kenmore, Hyde Park, JamaicaPlain, Mattapan /Franklin Park, North Dorchester, Roslindale, Roxbury, South End, South Boston, South Dorchester, andWest Roxbury.
24
CHANGING DEMOGRAPHICS, CHALLENGES, & NEW OPPORTUNITIES FOR BOSTON 15
12% was Asian American. North andSouth Dorchester and Jamaica Plainhad similarly diverse populations (Fogget al., 1994).
Even though in 1990 slightly morethan 40% of the city's residents wereBlack, Latino, or Asian American,several Boston neighborhoods still hadpopulations that were approximately90% white: Back Bay/Beacon Hill 89%,Charlestown and West Roxbury 95%,and South Boston 96%. Twotraditionally white neighborhoods, onthe other hand, experienced relativelysignificant changes in their makeup.In East Boston, the Latino populationincreased from 3.1% of the populationin 1980 to 17.3% in 1990. Roslindale'sLatino population also grewsignificantly, from 3% in 1980 to almost12% in 1990 (Fogg et al., 1994).
Blacks are the only non-whitegroup that constitute a majority in anyBoston neighborhood. In 1990 theBlack population in Mattapan/FranklinPark and Roxbury was respectively82% and 72% of the total population(Fogg et al., 1994). Latinos and AsianAmericans are less concentrated thanBlacks, and, despite their substantialgrowth in certain areas, neither groupconstitutes a majority in any neighbor-hood.
The residency patterns of Bostonindicate the prevalence of a consider-able degree of geographic separation.A pattern has emerged of a large corearea comprised of a high percentage ofBlacks, Latinos, and Asian Americans
surrounded by a largely white outerring. Latinos are located on the north-ern peripheries of the Black concentra-tions. Although there are neighbor-hoods where considerable mixing takesplace, East Boston and Allston/Brighton for example, the populationcenters of communities of color arenotably separate from those of the pre-dominantly white communities.
Age
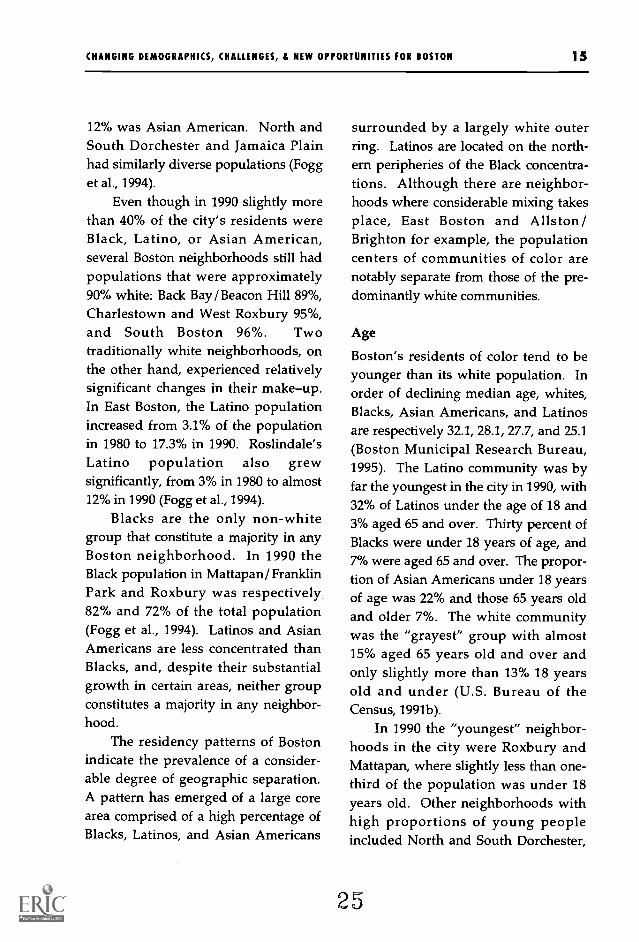
Boston's residents of color tend to beyounger than its white population. Inorder of declining median age, whites,Blacks, Asian Americans, and Latinosare respectively 32.1, 28.1, 27.7, and 25.1(Boston Municipal Research Bureau,1995). The Latino community was byfar the youngest in the city in 1990, with32% of Latinos under the age of 18 and3% aged 65 and over. Thirty percent ofBlacks were under 18 years of age, and7% were aged 65 and over. The propor-tion of Asian Americans under 18 yearsof age was 22% and those 65 years oldand older 7%. The white communitywas the "grayest" group with almost15% aged 65 years old and over andonly slightly more than 13% 18 yearsold and under (U.S. Bureau of theCensus, 1991b).
In 1990 the "youngest" neighbor-hoods in the city were Roxbury andMattapan, where slightly less than one-third of the population was under 18years old. Other neighborhoods withhigh proportions of young peopleincluded North and South Dorchester,
25
16 DEMOGRAPHIC & SOCIOECONOMIC PROFILE OF BOSTON
35-
30-
25-
20
15
10
5
0
Figure 9. Median Age by Race and Ethnicity, 1990
Asian Black Latino White
Hyde Park, Roslindale, East Boston,and Jamaica Plain (Fogg et al., 1994).
Household Size
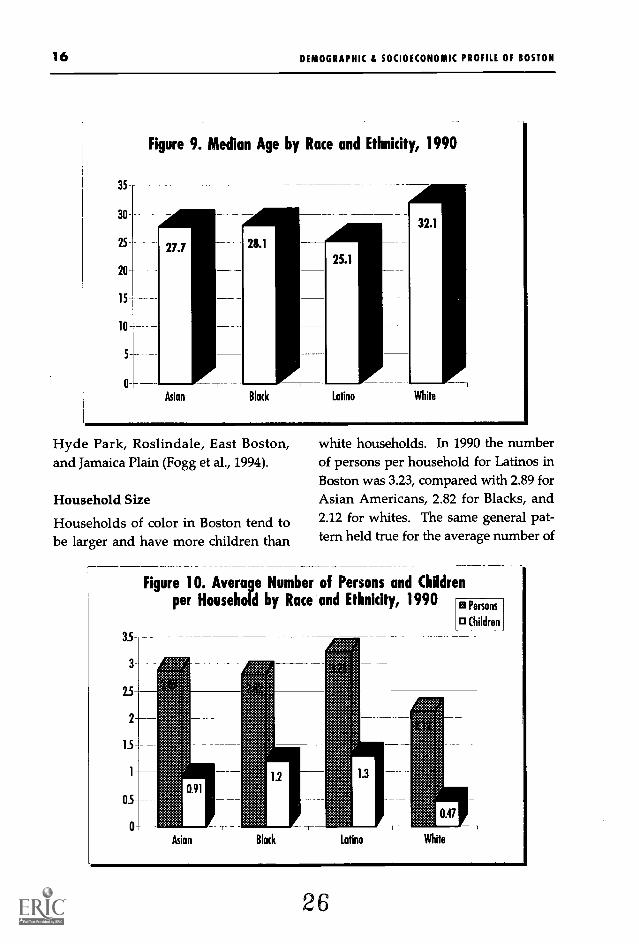
Households of color in Boston tend tobe larger and have more children than
35
3
2.5
2
15
1
0.5
0
white households. In 1990 the numberof persons per household for Latinos inBoston was 3.23, compared with 2.89 forAsian Americans, 2.82 for Blacks, and2.12 for whites. The same general pat-tern held true for the average number of
Figure 10. Average Number of Persons and Childrenper Household by Race and Ethnicity, 1990
m Persons
o Children
091
Asian
26
CHANGING DEMOGRAPHICS, CHALLENGES, & NEW OPPORTUNITIES FOR BOSTON 17
children per household, for Latinohouseholds 1.3 children, for Blackhouseholds 1.2, for Asian Americanhouseholds 0.91, and for whites 0.47. Inother words, households of color had atleast twice as many children on averagethan white households (U.S. Bureau ofthe Census, 1992b).
Approximately one-half of all fami-lies in Mattapan, Roxbury, North andSouth Dorchester, and Jamaica Plainhave children. Neighborhoods with rel-atively low numbers of families withchildren were the Back Bay/BeaconHill, Central, Fenway / Kenmore, andWest Roxbury (Fogg et al., 1994), whichalso tended to be largely white.
45.0%
40.0%
35.0%
30.0%
25.0%
20.0%
15.0%
10.0%
5.0%
0.0%
Socioeconomic Characteristics
Income and Poverty
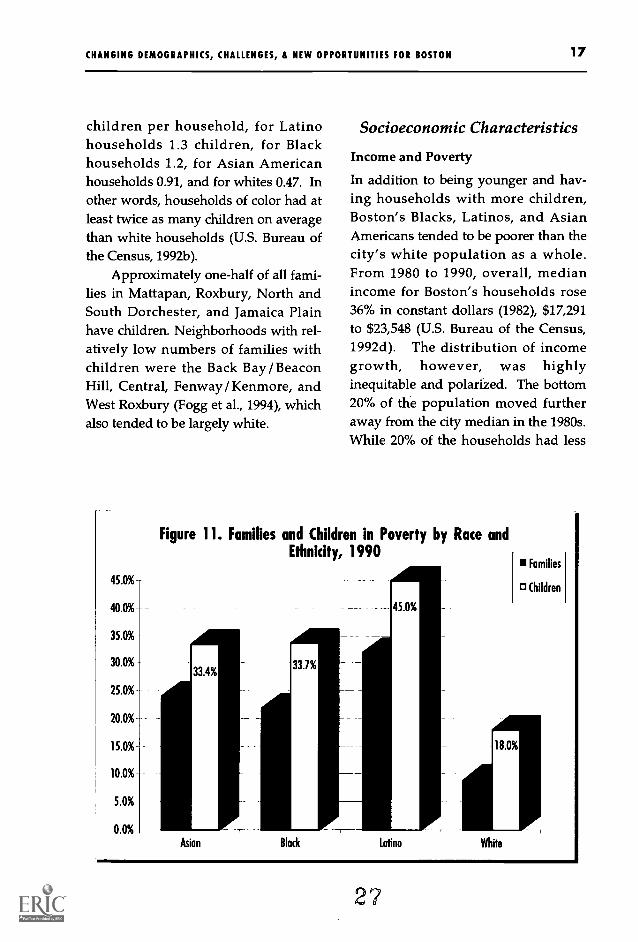
In addition to being younger and hav-ing households with more children,Boston's Blacks, Latinos, and AsianAmericans tended to be poorer than thecity's white population as a whole.From 1980 to 1990, overall, medianincome for Boston's households rose36% in constant dollars (1982), $17,291to $23,548 (U.S. Bureau of the Census,1992d). The distribution of incomegrowth, however, was highlyinequitable and polarized. The bottom20% of the population moved furtheraway from the city median in the 1980s.While 20% of the households had less
Figure 11. Families and Children in Poverty by Race andEthnicity, 1990
33 4%33 7%
Asian Black
45 0%
18 0%
Families
0 Children
Latino White
27
18 DEMOGRAPHIC & SOCIOECONOMIC PROFILE OF BOSTON
Figure 12. Per Capita Income by Race and Ethnicity,1990
$20,000 T
S18,000
$16,000
S14,000
$12,000
$10,000
$8,000
$6,000
$4,000
$2,000
$0Asian Black Latino White
than 40% of the median income in 1980,20% of the households had less than34% of the median income in 1990. Theproportion of households that madefour times the median income or morein 1980 was less than 2.8% (U.S. Bureauof the Census, 1983). In 1990 house-holds making four and one-quartertimes the median income or more hadslipped to just over 2.5% (U.S. Bureauof the Census, 1993).
Neighborhoods with the highestnumbers of persons of color and withthe largest percentage of families withchildren tended to have the lowestmean family incomes. Roxbury, forexample, with 94% of its populationbeing persons of color and over 52% ofits households having children, had thelowest mean family income of all
Boston neighborhoods in 1990: $28,979for all families, and $23,239 for familieswith children. Back Bay/Beacon Hill,West Roxbury, and Charlestown, incontrast, were among those neighbor-hoods with the highest mean familyincomes. Mean incomes, for familieswith children, in these neighborhoodswere $136,764 Back Bay/Beacon Hill,$57,162 West Roxbury, and $42,227Charlestown (Fogg et al., 1994).
Fifteen percent of all families inBoston lived below the poverty level in1990. Thirty-two percent of Latino fam-ilies, 24% of Asian American families,22% of Black families, and 9% of whitefamilies were below the poverty line(U.S. Bureau of the Census, 1992a).Roxbury (28.1%), Fenway /Kenmore(22.7%), the South End (21.9%), and
28
CHANGING DEMOGRAPHICS, CHALLENGES, & NEW OPPORTUNITIES FOR BOSTON 19
Figure 13. Unemployment Rate by Race and Ethnicity,1990
14%
12%-
10%
8%
6%-
4%
2%
0%
Asian Black Latino White
Mattapan/Franklin Park (19.8%) hadthe highest family poverty rates. WestRoxbury (3.2%) and Back Bay/BeaconHill (3.9%) had the lowest rates (Fogg etal., 1994).
Children were especially victimizedby poverty, and the gap between whiteand non-white children was consider-able. For the population as a whole,28% of children lived in poverty. Over45% of Latino children lived in poverty,as well as 33.7% of Black children, and33.4% of Asian American children. Forwhite children the poverty rate wasconsiderably lower, 18.1%, and concen-trated for the most part in census tractswith public housing developments(Sum with Bonacci, Fogg, Goicoechea,& Sum, 1994a).
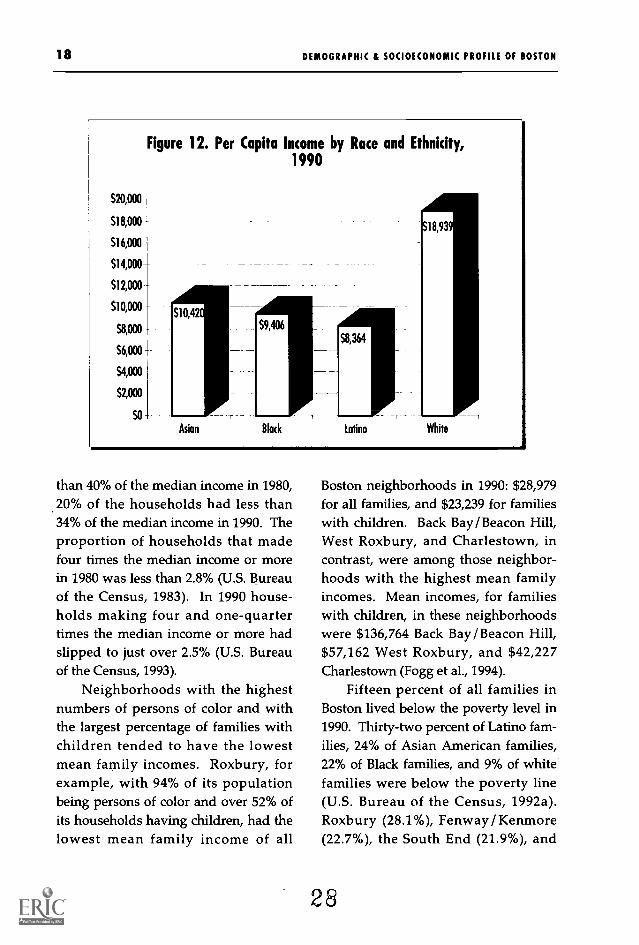
Per capita income levels reflectedsimilar inequalities. According to the
1990 U.S. Census (1992b), Latino percapita income was the lowest at $8,364,Blacks at $9,406, and Asian Americansat $10,420. Whites had the highest percapita income by a wide margin at$18,939.
Employment and Unemployment
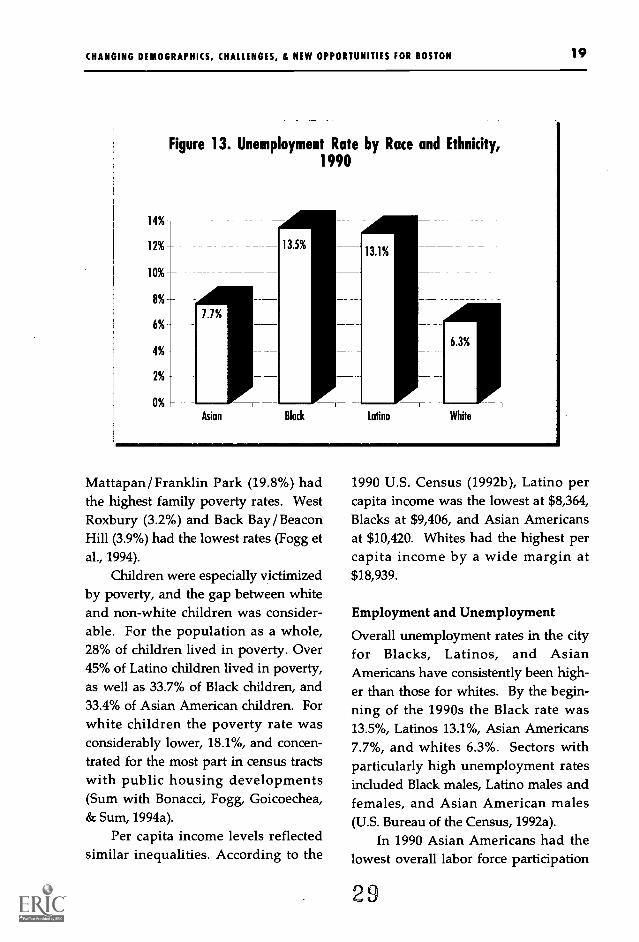
Overall unemployment rates in the cityfor Blacks, Latinos, and AsianAmericans have consistently been high-er than those for whites. By the begin-ning of the 1990s the Black rate was13.5%, Latinos 13.1%, Asian Americans7.7%, and whites 6.3%. Sectors withparticularly high unemployment ratesincluded Black males, Latino males andfemales, and Asian American males(U.S. Bureau of the Census, 1992a).
In 1990 Asian Americans had thelowest overall labor force participation
29
20 DEMOGRAPHIC & SOCIOECONOMIC PROFILE OF BOSTON
rates of any group, 63.5% for men and54.7% for women. Latino rates weremixed. Latino males had the highestparticipation rate of any segment,74.1%, while Latino females had thelowest rate of any segment, 54.1%.Black labor force participation rateswere comparable to those of whites:Black males, 71.5%; white males, 73.3%;Black females, 61.1%; and whitefemales, 62% (Institute for AsianAmerican Studies, 1994).
Education
One of the consequences of the relativeyouthfulness of Boston's non-whitecommunities is that a higher per-centage of people from these communi-ties attend school compared to whites.For Asian Americans, 45.7% wereenrolled in school in 1990; for Latinos,36.6%; for Blacks, 34.7%; and for
White 1 1
Latino
Black 33%
Asian
whites, only 26.2% (Institute for AsianAmerican Studies, 1994).
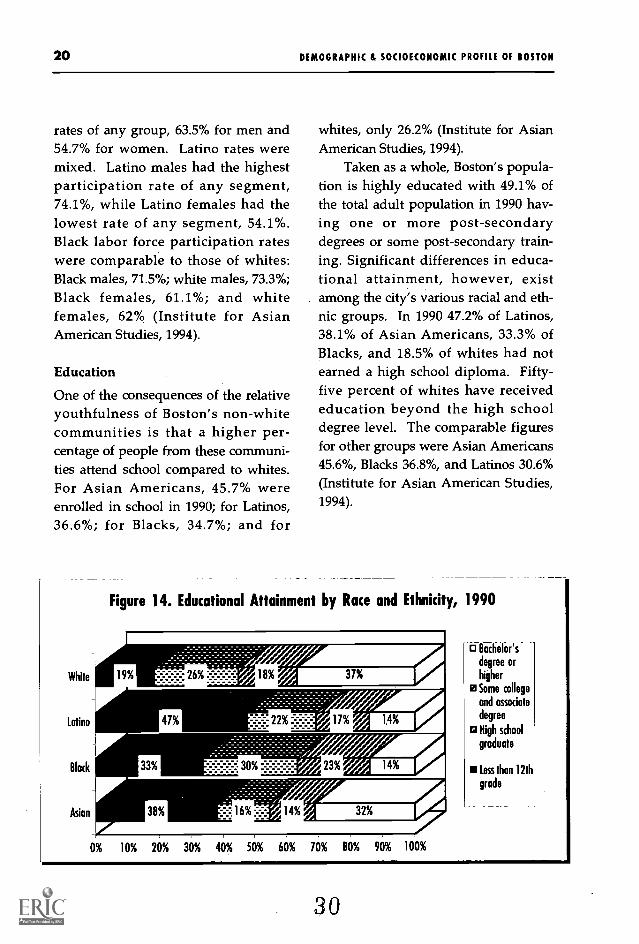
Taken as a whole, Boston's popula-tion is highly educated with 49.1% ofthe total adult population in 1990 hav-ing one or more post-secondarydegrees or some post-secondary train-ing. Significant differences in educa-tional attainment, however, existamong the city's various racial and eth-nic groups. In 1990 47.2% of Latinos,38.1% of Asian Americans, 33.3% ofBlacks, and 18.5% of whites had notearned a high school diploma. Fifty-five percent of whites have receivededucation beyond the high schooldegree level. The comparable figuresfor other groups were Asian Americans45.6%, Blacks 36.8%, and Latinos 30.6%(Institute for Asian American Studies,1994).
Figure 14. Educational Attainment by Race and Ethnicity, 1990
9% 2 /7 18% 37%
'r 23% 14%
38% 41 2'14% 32%
0% 10% 20% 30% 40% 50% 60% 70% 80% 90% 100%
o Bachelor's
degree or
higher
Some college
and associate
degree
High school
graduate
Less than 12th
grade
30
CHANGING DEMOGRAPHICS, CHALLENGES, L NEW OPPORTUNITIES FOR BOSTON 21
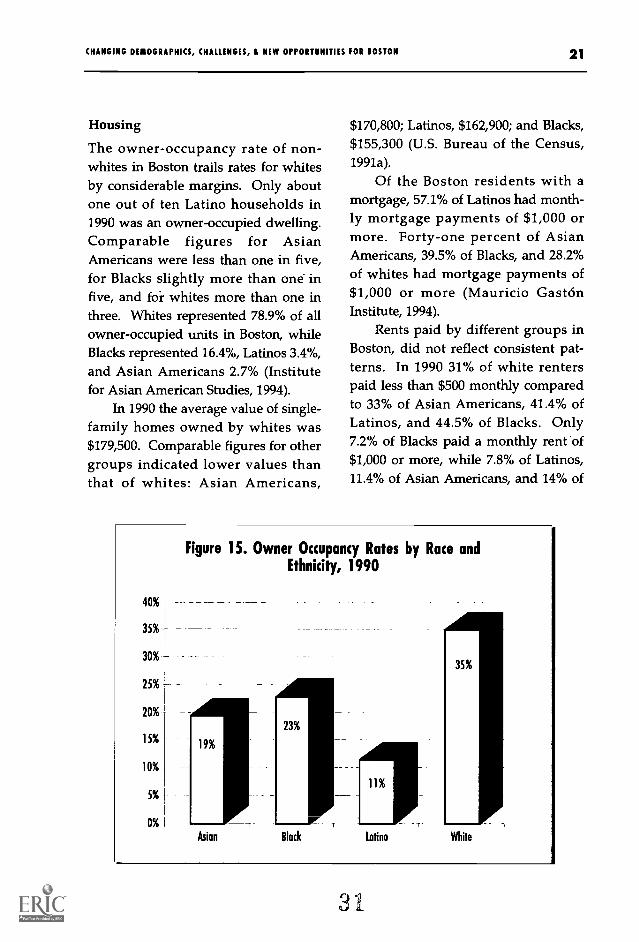
Housing
The owner-occupancy rate of non-whites in Boston trails rates for whitesby considerable margins. Only aboutone out of ten Latino households in1990 was an owner-occupied dwelling.Comparable figures for AsianAmericans were less than one in five,for Blacks slightly more than one infive, and foi whites more than one inthree. Whites represented 78.9% of allowner-occupied units in Boston, whileBlacks represented 16.4%, Latinos 3.4%,and Asian Americans 2.7% (Institutefor Asian American Studies, 1994).
In 1990 the average value of single-family homes owned by whites was$179,500. Comparable figures for othergroups indicated lower values thanthat of whites: Asian Americans,
$170,800; Latinos, $162,900; and Blacks,$155,300 (U.S. Bureau of the Census,1991a).
Of the Boston residents with amortgage, 57.1% of Latinos had month-ly mortgage payments of $1,000 ormore. Forty-one percent of AsianAmericans, 39.5% of Blacks, and 28.2%of whites had mortgage payments of$1,000 or more (Mauricio GastonInstitute, 1994).
Rents paid by different groups inBoston, did not reflect consistent pat-terns. In 1990 31% of white renterspaid less than $500 monthly comparedto 33% of Asian Americans, 41.4% ofLatinos, and 44.5% of Blacks. Only7.2% of Blacks paid a monthly rent of$1,000 or more, while 7.8% of Latinos,11.4% of Asian Americans, and 14% of
40%
35%
30%
25%
20%
15%
10%
5%
0% t
Figure 15. Owner Occupancy Rates by Race andEthnicity, 1990
Asian Block Latino
35%
White
31
22 DEMOGRAPHIC t SOCIOECONOMIC PROFILE OF BOSTON
whites paid $1,000 or more (MauricioGaston Institute, 1994).
In summary, the portrait of Bostondescribed above indicates a city under-going dramatic changes that have notaltered and often exacerbated somelongstanding inequities. The next sec-tion of this report chronicles the devel-opment of Boston's communities ofcolor emphasizing the interplay of tra-ditional structures with transforma-tions in several domainseconomic,political, social and cultural.
32
CHANGING DEMOGRAPHICS, CHALLENGES, & NEW OPPORTUNITIES FOR BOSTON 23
Recent History nal Overview
Blacks, Asian Americans, and Latinos in Boston
History and Development to1960
Blacks, Asians, and Latinos havebeen present in Boston for cen-turies. Blacks lived in Boston
since the early days of its founding andthroughout the colonial, revolutionary,and early federal periods. In 1729, forexample, Blacks comprised approxi-mately 8% of the city's population.West Indians began to immigrate toBoston in the early 19th century,although they did not come in sizablenumbers until the first quarter of the20th century. New England's vigoroustrade with China and India meant thatAsian sailors, merchants, servants, andstudents were present in Boston begin-ning in the early 1800s. The firstnotable Asian American communitywas established in the 1870s by Chineseworkers who settled in the South Covearea of the city near the South Stationrailroad yards. Records of the strugglefor the independence of Cuba and
Puerto Rico from Spain show the pres-ence of Latinos in Boston as early as1892 (Uriarte, 1992).
Following the Civil War, Blacksarrived in Boston through variousavenues and for various reasons.Blacks moved to Boston from northernand southern states drawn by theprospect of economic gain. Thepromise of economic advancement alsodrew immigrants from the West Indiesearly in the 19th century and in sizablenumbers during the first quarter of the20th century. The pace of Black arrivalsto Boston rose and fell in accordancewith shifting economic conditions inother parts of the country and the WestIndies. Additionally, Black migrantswere drawn to the city to join family orfriends who had settled in the area. By1940 Blacks constituted 3% of Boston'stotal population, which was over 95%white. In the next two decades, theBlack share of Boston's population grewto 5% in 1950 and 9% in 1960, largelydue to two factors: the continued
33
24 RECENT HISTORY IL INSTITUTIONAL OVERVIEW
growth of the Black population, fedespecially by migration from the Southand immigration from the Caribbean;and the movement of many whiteBostonians to the suburbs. By 1960 thewhite proportion of the population haddropped to 90%.
Despite many barriers, includingrestrictiive immigration laws aimed atChinese and other Asians in the late19th and early 20th centuries, Boston'sChinese population remained anenduring and stable community. In thefirst half of the 20th century growth ofthe Chinese population, which for themost part constituted Boston's AsianAmerican community, was limited, andthe Chinese population was largelymale. In this period as well, relativelyfew Chinese in Boston did not reside inChinatown. Between 1910 and 1950four out of five Chinese in Boston livedin Chinatown. The repeal of discrimi-natory immigration exclusion acts ledto the establishment of Chinese familiesin Boston and the steady growth of thepopulation from 1,600 in 1940 to 5,200in 1960 (The Chinatown Coalition,1994).
The recruitment of Puerto Ricanfarm workers in the 1940s began a cir-culation of that population betweenPuerto Rico and the Boston area(Uriarte, 1992). The South End becamea favorite destination of these Latinos.In 1960 Boston's Latino populationnumbered 2,000.
The 1960s and Beyond
The Changing Boston Economy
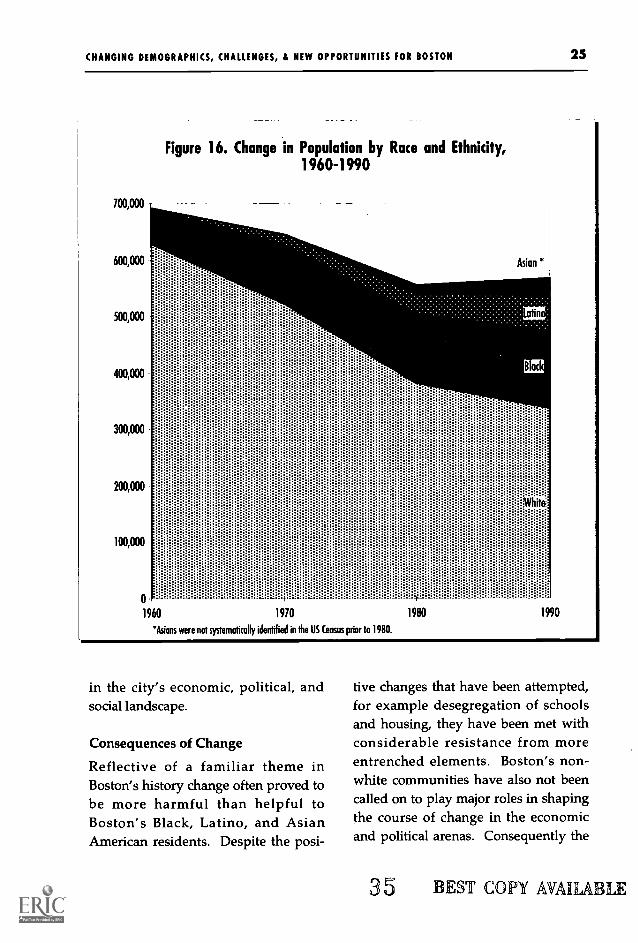
By the 1960s Blacks, Asians, andLatinos constituted a growing share ofBoston's population. At this time,Boston's economic base was stagnantand preparing to undergo great change.After the end of World War II, Bostonwas ill-prepared financially for a peace-time economy. Employment in NewEngland's textile plants dropped from280,000 in 1947 to 90,000 in 1965.Unemployment was high in the work-ing class neighborhoods ofCharlestown, South Boston, the WestEnd, and Roxbury. The financial cloutof Boston Brahmins had begun to focuson development of the Route 128 elec-tronics industry and to withdraw fromthe city's manufacturing base of tex-tiles, shoes, and leather goods and itsshipping and fishing industries.Following their investments, manywhite Bostonians moved out of the city.
The one bright spot in the city'seconomic picture, seldom mentioned atthe time, was the growth of the busi-ness service sector, including financial,insurance, and legal services, concen-trated in the downtown area (Kennedy,1992).
During the 1960s, the shift from amanufacturing to a service-based econ-omy accelerated dramatically. Thistrend along with a changing politicalculture in the city and significantdemographic transformations con-verged to create substantial alterations
34
CHANGING DEMOGRAPHICS, CHALLENGES, & NEW OPPORTUNITIES FOR BOSTON 25
700,000
600,000
500,000
400,000
300,000
200,000
100,000
Figure 16. Change in Population by Race and Ethnicity,1960-1990
1960 1970
"Asians were not systematically identified in the US Census prior to 1980.
1980 1990
in the city's economic, political, andsocial landscape.
Consequences of Change
Reflective of a familiar theme inBoston's history change often proved tobe more harmful than helpful toBoston's Black, Latino, and AsianAmerican residents. Despite the posi-
five changes that have been attempted,for example desegregation of schoolsand housing, they have been met withconsiderable resistance from moreentrenched elements. Boston's non-white communities have also not beencalled on to play major roles in shapingthe course of change in the economicand political arenas. Consequently the
35 BEST COPY AVAILABLE
26 RECENT HISTORY & INSTITUTIONAL OVERVIEW
Black, Latino, and Asian Americancommunities have relied heavily ondeveloping their own community-based structures and institutions toserve their needs and to advocate fortheir often neglected interests.
Urban Renewal
Boston's movement away from a man-ufacturing-based economy was accom-panied by the decision of many cities,catalyzed by national policies under the1949 and 1954 U.S. Housing Acts, torevitalize downtown business areas. InBoston this urban strategy was articu-lated by a succession of growth-orient-ed city administrations, commencingwith Mayor John Hynes, and a businesscommunity intent on accessing and uti-lizing federal funds to carry out ambi-tious new construction plans. Thestrategy was most dramatically imple-mented by Mayor John Collins, whotook office in 1960, and his director ofthe then recently created BostonRedevelopment Authority (BRA), EdLogue. Mayor Kevin White in the1970s continued urban renewal plans,remaking the skyline of Boston and for-ever changing many neighborhoods.
The Changing Political Culture
Stirrings of change in the city's politicalculture also manifested themselves inthe 1960s. For much of the post-WorldWar II period, Boston's Black commu-nity was in what Mel King, a promi-nent Black community activist, politi-cian, and educator, called "the service
stage," where they bartered their lever-age for a portion of city services (King,1981). This stage was typified by Shagand Bal Taylor, who formed the firstsignificant Black political organization.Their "machine" approach to politicsachieved somewhat improved servicesfor the Black community and a limitednumber of patronage jobs in exchangefor Black support.
The civil rights movement bred agrowing attitude first among Blacksand then other communities that open-ly questioned authority and empha-sized mass organizing. This approachwas basically adversarial and called forthe equitable distribution of resourcesand power. For decades thosedemands have defined the politicalaspirations of many of the city's non-white residents and of white allies anx-ious for change.
Migration and Immigration
The racial and ethnic complexion ofBoston was altered considerably in the1960s and 1970s. Black migration fromvarious locales in the United States andespecially immigration from the WestIndies to Boston increased in thatdecade. The Black portion of the popu-lation grew dramatically from 9% in1960 to 16% in 1970 to 30% in 1980.Events in the international arena andchanges in immigration laws resultedin an enhanced and exceedinglydiverse flow of immigrants from non-European countries. Cubans, for exam-ple, came in large numbers as part of
36
CHANGING DEMOGRAPHICS, CHALLENGES, & NEW OPPORTUNITIES FOR BOSTON 27
the resettlement program organizedthrough the federally funded CubanRefugee Program established in 1961 toreceive Cuban exiles. Puerto Ricans,from both the island and other parts ofthe United States, came in large num-bers in the 1960s and early 1970s.
The 1965 Immigration andNationality Act amendments liftedmany restrictions on immigration fromthe Third World and resulted in astartling increase of immigrants toBoston. Dominicans began to arrive inthe mid-1960s. Educational andmedical institutions in the Boston areaattracted a significant number of SouthAmerican immigrants, and smallcolonies of Colombians, Argentineans,and Chileans have lived in the city.Central American immigration,exacerbated by wars and economic andpolitical conflicts, increased steadily inthe 1970s and boomed in the 1980s.Large numbers of new Chineseimmigrants came to Boston in the 1960sand 1970s. South Asian Indians andKoreans, often with high levels ofeducation and professional skills,settled in the Boston area. Communistvictories in Vietnam, Cambodia, andLaos set off successive waves ofrefugees from Southeast Asia alsosettling in Boston. The first wave oflargely well-educated Cambodian, Lao,and predominantly Vietnameseprofessionals and former governmentofficials arrived soon after 1975. Asecond wave from 1979 to 1983included large numbers of ethnicChinese "boat people" from merchant
backgrounds in Vietnam, Cambodiansescaping Khmer Rouge killing fields,fishermen and farmers with littleformal education, and unaccompanied"anchor" children sent by theirfamilies.
The total effect of migration andimmigration of people of color toBoston from 1960 to 1980 was extraor-dinary. In 1970 the non-white share(20%) of the city's total population rep-resented a doubling of its 1960 share,and by 1980 the non-white proportionhad expanded to 32%. As detailed inthe preceding section of this report, by1990 Blacks, Latinos, and AsianAmericans constituted over 40% ofBoston's population.
The interaction of change on thesethree frontsthe Boston economy, thepolitical culture, and the racial and eth-nic make-up of the cityhad an explo-sive impact in myriad ways, influenc-ing residential patterns, the composi-tion of neighborhoods, and the culturallife of the city.
Responses
The emphasis placed on urban renewalby political and business decisionmak-ers created a scenario for confrontationand the specter of urban developmentat the expense of poorer neighbor-hoods. The drive to focus on incomeand tax revenue-producing projectsincreased the vulnerability of poor sec-tions near downtown. Among thesewere areas newly settled by less politi-cally influential non-white populations.
3?
28 RECENT HISTORY L INSTITUTIONAL OVERVIEW
Initial development plans not onlychanged the downtown area but alsodismantled the low-income communi-ties of the multicultural West End andthe New York streets of the South End.Other areas that were threatened orcleared away included Chinatown,Roxbury, East Boston, the North End,Charlestown, other parts of the SouthEnd, Jamaica Plain, Dorchester, andBrighton.
After a passive beginning and theloss of much low-income housing,many locales (the South End,Chinatown, East Boston, Roxbury,Charlestown, and Brighton) began towage determined battles over theeffects of urban renewal actions andpolicies. Popular mobilization against"top-down" urban construction culmi-nated in the stoppage in 1973 of the 1-95construction segment known as theSouthwest Highway and the Inner Beltby a coalition led by African Americancommunity organizations. This coali-tion was also able to influence the dis-pensation of federal highway trustfunds for public transit.
The interplay of urban renewal andpeople of color moving into the cityhad at least two notable effects on theexisting white population, which led toincreased white out-migration. First,the destruction of areas like the WestEnd drove some whites out of the city.Little provision had been made for theirdisplacement, and the substitution ofluxury housing, such as Charles RiverPark in the West End and HarborTowers in the North End, did not pro-
vide an affordable housing option formost residents.
A second effect was that thedestruction of minority neighborhoodscreated a migration into previouslywhite enclaves. When Blacks firstmigrated into the city, they wereessentially confined to its inner core ofRoxbury and the South End. Thedestruction of the New York streetshousing and the construction ofWashington Park in the heart ofRoxbury forced Blacks into areas likeWest Dorchester, where Boston'sJewish community was then centered.With the continuing influx of Blacksfrom southern states and the WestIndies, many Blacks began to movefurther into Dorchester. In a similarfashion, many Chinese displaced by theerosion of Chinatown moved into otherareas such as Allston/Brighton. Therenewal of the South End andincreasing Latino migration led PuertoRicans and Cubans to settle in JamaicaPlain; Puerto Ricans and Dominicans toreside in Dorchester around UphamsCorner, Dudley Street, and ColumbiaPoint; and Cubans and SouthAmericans to live in Brighton. In the1970s Central Americans andCambodians settled in East Boston, andVietnamese refugees began to moveinto the Fields Corner section ofDorchester and Allston/Brighton.While some Blacks, Latinos, and AsianAmericans moved to the suburbs, formost, low incomes, the relativeinaccessibility of mass transportation,the absence of supportive ethnic
38
CHANGING DEMOGRAPHICS, CHALLENGES, & NEW OPPORTUNITIES FOR BOSTON 29
infrastructures, language barriers, andracial discrimination limited theviability of the suburban option.
As the racial and ethnic composi-tion of many former largely whiteneighborhoods changed, some whiteBostonians, fearful of alleged propertydevaluation, crime, and racial tensions,left the city. Furthermore, whites withthe resources and the inclination to doso often exercised the option of aban-doning a deteriorating urban infrastruc-ture and seeking economic opportuni-ties in suburban industries and offices.In contrast, the dilemma for many non-whites was that this same option offleeing the city was not open to them,and as they stayed, they generallylacked the political and economic cloutnecessary to fight the changes thatdamaged their well-being.
In this often highly charged andvolatile atmosphere, some of the moreestablished residents reacted with hos-tility toward the newcomers. In EastBoston and Dorchester, for example,Southeast Asians were subjected tophysical assaults, arson of their resi-dences, and vandalization of their cars.The integration of public housing inneighborhoods such as South Bostonand Charlestown often spawned anumber of racial incidents and protests.
Despite the fact that many Blacks,Latinos, and Asian Americans havemade relatively smooth transitions intoformerly homogeneous areas and thatthere have been successful efforts tointegrate public housing projects inwhite-dominated areas in Boston,
geographical separation has continuedto a considerable degree.
The impact of changing demo-graphics on the social and economicfabric of many neighborhoods has beena mixed blessing. Instability and tran-sient populations in some neighbor-hoods caused both by the recentarrivals of people of color and the sub-urban fixation of many older residentsundermined interest and participationin established civic associations andother neighborhood institutions. Onthe other hand, the new populationsoften catalyzed or formed many newcommunity organizations.
Local Economic Development
Neighborhoods have made significantprogress in attempting to control earlierunchecked community development.Early organizing efforts in the SouthEnd and Roxbury against gentrification,for example, resulted in formal recogni-tion of community processes to influ-ence community development.Through the South End Planning AreaCommittee and other organizations, thecommunity in the South End was ableto influence neighborhood develop-ment. In Roxbury the Dudley StreetNeighborhood Initiative became anational community developmentmodel as it gained control, includingsuccessfully obtaining eminent domainrights, and exercised veto power overconstruction and land use within theDudley Square area. These and otherendeavors have forced city hall to be
39
30 RECENT HISTORY & INSTITUTIONAL OVERVIEW
more inclusive in its approach to neigh-borhood development.
The new populations also havebegun to reverse the decline of neigh-borhood centers as shopping areas.Neighborhoods such as Fields Corner,Allston/Brighton, Jamaica Plain, andChinatown are now centers of immi-grant commerce, respectively drawingin Vietnamese, Brazilians, PuertoRicans and Dominicans, and Chinesefrom the entire Boston metropolitanarea.
Many of Boston's non-white newarrivals have found themselves inneighborhoods with established com-munity structures primarily built byand serving the dominant white popu-lation. Rotary Clubs, civic associations,churches, social clubs, and merchantsassociations traditionally have serveduseful purposes including bringing res-idents together. Although some ofthese structures have adapted to wel-come newcomers, many individualshave not fit in easily, leading to alien-ation or the creation of new structures.
Employment Impacts
Urban development strategies weredesigned to serve a post-industrialBoston of expanded financial and busi-ness services and a declining manufac-turing sector. The construction of theCentral Artery and the proposedSouthwest Highway catered to subur-ban professionals employed in newdowntown edifices. The hollowing outof what had been Boston's industriallabor force was symbolized by fleeing
white middle-class residents. Highwage, professional jobs that requiredadvanced education degrees attractedchildless "yuppies" into the city.
Many of Boston's Latinos, AsianAmericans, and Blacks with low levelsof education filled the low-wage andlow-benefit secondary labor marketthat serviced downtown office build-ings and firms. A recent study ofLatino employment, for example,found that in the late 1980s 25% of low-income Latinos were employed incleaning service occupations(Osterman, 1992). Overall, the propor-tion of the Latino population in serviceoccupations grew to one-third(Jennings, Baker, Williams, Evereteze,& Napier, 1993). Many Vietnamesefound employment in light manufac-turing and services, along with Chinesewho also were heavily represented inthe restaurant industry and garmentsweatshops. Blacks tended to be con-centrated in service occupations in pro-portions comparable to Latinos andAsian Americans. In summary, in mostcases new populations of color havebecome the low-wage workforce in thecity, occupying lower level serviceoccupations and working in theremaining small manufacturing firms,which often survive on low-wageworkers.
In the nation and in Massachusetts,there have been indications that non-whites have steadily improved theirshare of highly educated professionals.Within Boston, however, the non-whiteprofessional community remains rather
40
CHANGING DEMOGRAPHICS, CHALLENGES, & NEW OPPORTUNITIES FOR BOSTON 31
small. By the early 1990s slightly morethan one out of seven (14.3%) of Bostonarea Blacks held high-income profes-sional positions, for Latinos it wasapproximately one out of ten (9.6%).These shares were below the 20.9% ofthe total population in professionalpositions (U.S. Bureau of the Census,1992a). Especially frustrating has beenthe fact that many well-educatedBlacks, Latinos, and Asian Americanshave not been able to translate theireducational achievements into higherlevels of professional advancement.
Minority Businesses
The picture for minority businesses inBoston, with some exceptions, has beendisappointing. Businesses owned bythe new populations are disproportion-ately fewer, smaller, and earn signifi-cantly lower revenues than mainstreambusinesses (Williams & Kim, 1995). In1987 Blacks owned only 2% of all pro-prietorships; partnerships, and 1120Scorporations; for Asian Americans thefigure was 1.5%; and for Latinos thefigure was 0.8%. Of the existing minor-ity businesses, the distribution isskewed toward services and retailtrade and away from construction,finance, insurance, wholesale trade,and real estate. Even the participationin services, which would seem to beone positive piece of an otherwisegloomy picture, is tempered by theobservation reported by RussellWilliams and Sue Kim (1995) that, "theparticular sources of growth [forBoston] are not services as a whole but
rather knowledge based services....minority-owned firms may be concen-trated in the lower skilled areas of theservice sector" (p. 53).
An alternative economic strategyof the new populations has been thegeneration of active "enclaveeconomies" within the city. An enclaveeconomy is a form of market segmenta-tion where businesses established andmanaged by members of a certain eth-nic or racial group also employ andmarket to other members of that group.It offers to ethnic businesspeopleopportunities unavailable in the largereconomy. Boston's Chinatown is agood example with 176 businesses con-centrated within that area. The mediannumber of years of operation is only sixyears, and 75% of these businesses havefewer than ten employees (Williams &Kim, 1995). Enclave economies inBoston have also been created by theVietnamese, Dominican, Russian, CapeVerdean, and Brazilian communities.Immigrants and newcomers have alsoestablished themselves in niche mar-kets serving larger mainstream clien-tele. The recent sharp increase inVietnamese ownership of nail salons inthe city is a good example of this.
Although enclave businessesenhance economic activity in manycommunities, there have been somedrawbacks. Many workers employedin these businesses have experiencedlower wages, fewer benefits and oppor-tunities for advancement, harsherworking conditions, and less job securi-ty than in the general labor market.
41
32 RECENT HISTORY IL INSTITUTIONAL OVERVIEW
In short, it can be said that Boston'spost-manufacturing economy has notbeen substantially directed toward orshared with the new populations. Thecity's economy still primarily benefitsthe long-standing business structureand a workforce that does not live inthe city. Economic progress that hasbeen made has been largely attribut-able to the newcomers' own efforts,either through the creation of some-what separate economies or throughpersonal investments in education.
Institutions
Politics
Although the difficulties of Blacks,Latinos, and Asian Americans to breakinto the city's mainstream economyhave been substantial, they pale incomparison to the resistance encoun-tered by these groups as they haveattempted to penetrate the political sys-tem. For decades the city's changingdemographics have held out the poten-tial of creating more diverse govern-mental representation. The expandingBlack political base and the legacy ofthe civil rights and Black power move-ments led to some Black political repre-sentation and the integration of moreBlack workers into the public sectorworkforce. The inroads, however,made by Blacks, Latinos, and AsianAmericans either through electiveoffice or through major appointmentshave been limited.
Before direct representation inBoston in 1981, the Boston CityCouncil, with two exceptions, had notseated a Black. In 1995 there were twoBlacks on the city council and fiveBlacks in the state legislature, includingone state senator. Prior to the elimina-tion of the elected school committee in1990, only five Blacks had ever sat onthe Boston School Committee. TheBlack community has searched forways to expand its role, principally bychallenging the mechanics of the elec-toral processdistrict representationrather than at-large representation,redistricting, voting registration proce-dures, and so forth. Since the successfulreferendum restoring district represen-tation, however, no major victorieshave been won.
One notable Black achievementthat embraced other communities ofcolor was the "rainbow" politics devel-oped from the electoral activities asso-ciated with Mel King's 1983 campaignfor mayor. While King's candidacymet eventual defeat, several ideasraised during the campaign, includingBoston jobs for Boston residents, neigh-borhood development funds collectedfrom downtown development projects,and neighborhood councils linked tothe city administration, were eventual-ly developed during the subsequentadministrations of Mayor RaymondFlynn. The formation of Black politicalinstitutions, such as the MassachusettsBlack Legislative Caucus and the BlackPolitical Task Force, which influences
42
CHANGING DEMOGRAPHICS, CHALLENGES, & NEW OPPORTUNITIES FOR BOSTON 33
elections and legislation, has also beena positive step.
The rapid ascendancy of Latinoshas not resulted in extensive politicalrepresentation. Unlike the Black popu-lation that has been more concentratedin inner Boston, Latinos have been dis-persed into various neighborhoods.Latinos have also been limited by hav-ing the lowest percentage of adultsamong the communities of color. Onlyrecently has there been sporadic successin electing Latinos to political office.Grace Romero was elected to theBoston School Committee in the mid-1980s. In 1990 Nelson Merced becamethe first Latino elected to the state legis-lature. His success was followed by theelection of Marta Rosa in neighboringChelsea as the first Latino official inthat city. In order to organize andenhance its clout, the Latino communi-ty has formed institutions such as theLatino Political Action Committee.
Despite the 120-year presence ofsignificant numbers of Asians inBoston, no Asian American has heldelective office in state government or inthe city. Political structures in theAsian American community have beenlimited. Although an Asian PacificCaucus has existed in theMassachusetts Democratic Party, therehas been no Asian political action com-mittee or endorsement mechanism. Arecent attempt to improve the politicalinfluence of Asian Americans has beenthe formation of an Asian PacificAmerican Agenda Coalition (APAAC)made up of individuals and organiza-tions drawn extensively from the
Boston area.Communities of color have partici-
pated in the political process at levelsbelow that of the rest of the population.Historically and at present, institutionalbarriers, and citizenship status have allplayed important roles in limiting theirpolitical participation. The immigrantcharacter of much of the Latino andAsian American communities and theHaitian and Cape Verdean and otherisland populations in the Black commu-nities has meant that many residents donot have the citizenship status neces-sary to vote in Boston. Difficult andrestrictive voter registration proceduresand the periodic and large-scaleremoval of voters from the rolls werestandard procedures in some parts ofthe city until reforms in the 1980s and1990s.
While the percentage of whites 18years old and over hovers close to 90%,the percentages for Blacks, Latinos, andAsian Americans range from 68% to78.4%. Certain sections of the city haveparticularly dismal registration andvoting rates. Surveys of Chinatown, forexample, have found that about 75% ofeligible voters were unregistered (AsianAmerican Resource Workshop, 1991).Voter turnout in sample precincts hasshown that the turnout of registeredvoters of color has lagged behind whitevoters by about ten percentage points.In the 1992 election, for example, onlyabout two-thirds of registered non-whites turned out, compared with near-ly 80% of registered whites (Powers,1993).
43
34 RECENT HISTORY & INSTITUTIONAL OVERVIEW
Determined efforts to overcomemany of the obstacles that stand in theway of full political participation havebeen undertaken. Recently the Latinoand Asian American communities havefollowed the lead of the Black commu-nity in organizing voter registrationefforts. A volunteer effort in the early1980s evolved into a chapter of thenational organization Operation BigVote, leading to the registration of30,000 new voters. Another program,Part of the Solution, has carried on thisregistration work. The Latino commu-nity has launched a large-scale effort toregister voters, reflected in theMassachusetts Hispanic VoterRegistration and Education Projectwhich registered thousands of voters inhalf a decade.
No doubt many in the non-whitepopulation feel distant and removedfrom the political system. The lack ofprogress in developing integrated polit-ical structures fuels frustration. Thisfrustration has manifested itself inappeals by some for the total autonomyof Boston's Black community throughthe secession of Roxbury from Boston.
Culture
Boston's changing population hashelped stimulate efforts at multicultur-alism. The appropriate recognition ofdiverse cultures has been utilized as animportant criterion to judge school cur-ricula. Public recognition of non-whitecultures has expanded, resulting in par-
ticular in Black History Month and anincrease in events such as the PuertoRican and Caribbean festivals andnumerous multicultural days in sec-tions of the city, includingAllston/Brighton and Dorchester.Community-based efforts to producesuch cultural events as those at theJorge Hernandez Cultural Center andthe Strand Theater in Uphams Cornerhave been well-received.
Local media have included moreprogramming and coverage of commu-nities of color. Television programssuch as Urban Update, Mosaic, andAsian Focus have been developed.Boston cable television has also madesome strides in better covering thecity's diverse population. Negativeimages of communities of color, howev-er, have been prominent in the newsmedia. Recent studies have indicated,for example, that one-third of all storiesin major print and electronic mediaconcerning non-whites revolvedaround crime and violence (Johnson,1987; The Media Project, 1992).
Cultural groups, such as the DanceUmbrella, and theaters and moviehouses have held cultural events orweeks with Black, Latino, and AsianAmerican themes. However, recentsurveys of some of Boston's most ven-erable arts institutions, the Museum ofFine Arts, the Boston Ballet, and theBoston Symphony for example, havefound widespread neglect of communi-ties of color in both representation and
44
CHANGING DEMOGRAPHICS, CHALLENGES, & NEW OPPORTUNITIES FOR BOSTON 35
programming (Hartigan & Lewis,1991). A 1991 review of the region'smajor art and cultural institutionsfound that only 5% of their board mem-bers were persons of color. The boardsof the Museum of Fine Arts, the BostonSymphony, and the Boston Ballet, witha combined total of 148 members, hadonly three persons of color (Hartigan &Lewis, 1991). Boston's professionalsports teams have traditionally not hada front office nor a fan clientele thatmirrors to any degree the racial andethnic diversity presented on the fieldof play and in the city at large.
In summary, the transition fromrecognition to the integration of diversecultures in the Boston area hasremained largely unfulfilled. The cul-tural range has been broadened but stillhas not been reflective of the city'sdiversity. Media attention has contin-ued to be rather infrequent and oftendistorted. Thus new residents haveoften had to construct their own struc-tures to showcase their cultures.
Community Organizations
Community-based institutions inBoston's non-white sectors have devel-oped in response to a number of fac-tors, including a feeling that manyexisting institutions had been unre-sponsive, inappropriate, or antagonisticto non-white sectors. In the 1960s theBlack community developed a neworganizational structure out of the pre-vailing framework represented by theNAACP, the Urban League, and a net-
work of settlement houses to battlemore aggressively for civil rights.Educational and economic and urbandevelopment issues led to the forma-tion of new organizations, such as theBoston Action Group, the CommunityAssembly for a United South End,Operation Exodus, and the revitaliza-tion of older organizations. The ThirdWorld Workers Association foughtpitched battles on construction sites forjobs, and the decades-long pursuit ofequal education led to the creation of anumber of organizations. Attempts tostrengthen the Black community haveled to the formation of organizationssuch as the Black Agenda Coalition, theGreater Roxbury NeighborhoodAuthority, and the William MonroeTrotter Institute at the University ofMassachusetts Boston.
The goal of equal treatment hasinspired activists in the Latino andAsian American communities. Oftenthese communities have attempted toreplicate the strategies of the moreexperienced Black community. Theinstitution building of the Latino com-munity in the South End and the fiercetwenty-year opposition to institutionalexpansion in Chinatown have built onideas and tactics honed in the Blackcommunity. Latinos occupied theoffices of Action for BostonCommunity Development (ABCD) tostart the first service organization inBoston for Latinos, Association ProConstitutional Rights of the SpanishSpeaking (APCROSS). In the South
45
36 RECENT HISTORY & INSTITUTIONAL OVERVIEW
End, Latino efforts were focused oncontrolling gentrification and redevel-opment. The Emergency TenantsCommittee (ETC) won control over thedevelopment of a disputed parcel ofland. Growing out of the ETC wasInquilinos Boricuas en Accion (IBA),which developed over thirty acres ofland and 800 units of housing in thearea and became the largest communitycontrolled development in the country.
The Chinatown community uti-lized demonstrations, marches, andgrassroots mobilizationsfamiliar tac-tics in the civil rights movementtooppose the New England MedicalCenter's expansion into the Chinatownarea. This new aggressive attitude ledto the creation of grassroots organizingvehicles such as the Asian AmericanResource Workshop, the ChineseProgressive Association, and theChinatown Housing and LandDevelopment Task Force.
Many of Boston's social and reli-gious institutions have been character-ized by structures paralleling those inthe dominant group. Boston's Blackchurches, over eighty in number, havebeen the center of the Black communi-ty. They continue to grow and expandin membership, providing much need-ed services and educational alternativesto the community. More recently, anew generation of Black ministers hasassumed the pulpit, giving new impe-tus to the social activist role of thechurch.
Although for the most part absentprior to 1960, a network of Latino agen-
cies has been built very quickly sincethat time. This network has includedcommunity development organizationssuch as IBA and Neustra Communidad,strategic planning institutions such asthe Hispanic Office of Planning andEvaluation, and cultural centers such asthe Hernandez. In 1989 the MauricioGaston Institute for Latino CommunityDevelopment and Public Policy at theUniversity of Massachusetts Bostonwas created.
Of the over 200 hundred AsianAmerican organizations in Massa-chusetts many are traditional familyand district associations, churches,Buddhist temples, and cultural groupsthat exist alongside service and grass-roots organizations. Several serviceagencies for Asian Americans grew outof Great Society programsthe QuincySchool Community Council, the SouthCove Health Center, and the ChineseAmerican Civic Association. TheInstitute for Asian American Studies atthe University of Massachusetts Bostonwas established in 1993 to increase theresearch and policy analysis, communi-ty development, and educational capac-ity of the Asian American community.
Recent refugee and immigrantcommunities in Boston have beenassisted by the formation of manymutual aid associations, serving South-east Asians, Caribbeans, Ethiopians,Russians, Irish, and many other groups.
The Old and the New
Undoubtedly, many of the city's tradi-tional institutions have strived to open
46
CHANGING DEMOGRAPHICS, CHALLENGES, & NEW OPPORTUNITIES FOR BOSTON 37
themselves to Boston's non-white resi-dents. The Mayor's Office has begun toinclude more liaisons to diverse con-stituencies. Governmental bureaucra-cies have become more integrated. Thepercentage of minority officers in theBoston police force, for example, hasgrown to 25%. The city's numerouseducational institutions have becomemore diverse. Some foundations haveplaced a high priority on supportingcommunity-based initiatives and orga-nizations. Many individuals inBoston's non-white communities, how-ever, have remained skeptical and dis-trustful. The pace and extent of fullintegration into mainstream structuresin even the best of circumstances hasbeen limited. Furthermore, non-whiteparticipation often appears to be meretokenism, which is not regarded as asubstitute for fundamental change.
In its recent history, the critical sec-tors of the economic, political, social,
and cultural life of Boston have gener-ally not adapted swiftly or well to theneeds and interests of Boston's expand-ing communities of color. Only a fewestablished institutions have been intro-spective enough to carefully contem-plate the consequences of operating inor serving a city that demographicallyhas changed dramatically in a relativelyshort period of time. By being moreopen to Black, Latino, and AsianAmerican participation in crucial deci-sionmaking and established structures,the city could have ameliorated manyof the problems faced by these commu-nities. Instead, traditional city andneighborhood institutions have foundtheir absolute dominance, if not theiroverall clout, challenged by new enter-prises and structures intent on eitherbuilding bridges to the mainstream ordeveloping autarkical enclave commu-nities as much as possible.
47
CHANGING DEMOGRAPHICS, CHALLENGES, & NEW OPPORTUNITIES FOR BOSTON 39
Challeng
Building a Diverse and WorkableCommunity
The patterns, changes, and contra-dictions portrayed in this reportpresent both formidable chal-
lenges and new opportunities forBoston. It is difficult in these pages todelineate the implications completely.Consequently the remainder of thereport is intended to summarize andidentify only a portion of the challengesand opportunities facing the city. Indefining and dealing with Boston'sstrengths and needs, a paramount goalmust be building a diverse, adaptable,and workable community. In pursuit ofthat objective it is essential thatBostonians commence a broad andinclusive dialogue to assess the mean-ing and implications of the city'schanging demography and variedsocioeconomic realities. The manner inwhich Boston's institutions and indi-
4 8
ortunities
viduals go about this inquiry will havea profound impact on the city's abilityto marshal its enormous capabilitiesand tackle its perplexing problems.Politicians, policymakers, educators,foundations, business and communityleaders, and residents from everyneighborhood must act with foresight,vision, and courage to enhance collec-tive and individual efforts to realizefully the city's true potential.
Political Power
One of the principal challenges facingBoston is the more equitable distribu-tion of political and economic powerand, especially, the transformation ofthe growing number of non-whites intosources of economic opportunity andpolitical clout. A severe disjunctionnow exists between the distribution ofpower and the shape of the populace.
40 CHALLENGES & OPPORTUNITIES
A system of representative democ-racy relies on the active involvement bythose governed in the selection of theirgovernmental leaders. The currentpolitical situation in Boston with lowparticipation rates by communities ofcolor causes great concern because thislimits the ability of citizens to influencepolicymaking and, instead, makes iteasier for political figures to ignoretheir needs. Government, as a result,becomes less efficacious and more dis-tant. As cynicism grows, alienationalso increases.
Although limited overall participa-tion makes it easier to maintain the sta-tus quo, significant gains could bemade through the electoral processwith even modest increases and con-centration of voting by Boston's Blacks,Latinos, and Asian Americans. Anincrease in voter registration and voterturnout would present opportunitiesfor substantial political gains. This isespecially true when overall participa-tion in the political process is low.
Blacks, Latinos, and AsianAmericans must see to it that their dra-matically expanded numbers manifestthemselves in expanded political clout.Working to increase the political impactof non-whites encompasses many activ-ities including greater involvement inthe civic affairs of neighborhoods andthe city from parent councils to volun-tary associations to governmentalboards, voter registration and get-out-the-vote campaigns, and groomingviable candidates for public office.
Each of the minority communitiescan build political strength from withinby developing coalitions among diversenationality groups. An even morepotent political force would be theexpansion of coalition-building amongcommunities of color. The goal of estab-lishing and maintaining such a cross-community coalition has been an elu-sive one. The deleterious consequencesof "going alone or not going at all"should serve to strengthen the allure ofcoalition-building. Whatever strategiesare pursued, the fundamental challengeis to turn the potential into real power.
Indeed, the opening-up of Boston'spolitical system is in the best interest ofall of the city's residents. The politicalbase of Boston's dominant politicalinstitutions will continue to decline dueto demographic change, as long as suchinstitutions remain relatively exclusive,closed, and narrow "clubs." Inevitablythe time will come for a reckoningwhen the new populations discoverand take advantage of paths to politicalempowerment.
Economic Empowerment
Dramatic transformations in Boston'sdemographic make-up coupled with achanging economy offer substantialchallenges and potentially promisingopportunities. Wise economic planningwill take into consideration the charac-teristics and contributions of minorityemployees and businesses. New eth-nic-owned shops and enterprises,whether specializing in the needs and
49
CHANGING DEMOGRAPHICS, CHALLENGES, & NEW OPPORTUNITIES FOR BOSTON 41
tastes of a particular community orengaging in mainstream pursuits fromnail salons to financial institutions,should be regarded as valuableresources for all Bostonians. In addi-tion, it would be wise not to neglect theimportance of Blacks, Latinos, andAsian Americans as avid consumers ina strong Boston economy.
Without economic vitality andstrength in Boston's growing communi-ties of color there can be no lastingprosperity for the city's residents.Moreover, a host of social ills from law-lessness, to endangered public health,to domestic and child abuse will surelyaccompany prolonged economicdespair and inequality. Persistentpoverty's impact on the dignity andwell-being of individuals and familiesand the future of Boston cannot beoveremphasized.
Community-Based Structures
An important source of strength is theimpressive network of community-based organizations in Boston. Theseorganizations have been sources ofyouth programs, skills training, politicalleadership development, vital informa-tion, advocacy, and countless otheractivities. Many organizations haverelied heavily on funding from federal,state, and local governments. The futuredoes not look promising for high levelsof government support. Funding fromother sources, including some largefoundations, has been tightly squeezed.Community-based organizations will be
challenged to do more with less.Chances are that many valuable organi-zations will not survive, and if so theloss in some areas will be devastating.
Beyond financial support, commu-nity agencies could profit immenselythrough partnerships with institutionssuch as colleges and universities.Every one of Boston's numerousschools of higher education should beguided by and take seriously theirurban missions. Technical assistance,leadership training, and the expandedavailability of scholarships for city resi-dents should be crucial components of"town and gown" relations in Boston.Community agencies are a source ofhope for many Boston residents, andthey need help from the public sector,private foundations and funders, andmore established institutions includingacademia.
Structures based in Boston's Black,Latino, and Asian American communi-ties can significantly enhance thestrength and livelihood of these com-munities. The fact remains, however,that community-based organizationscannot meet all of the needs of Boston'sdiverse population. These organiza-tions have been necessary but inade-quate alternatives to an often impene-trable economic, political, and socialsystem.
Unity with Diversity
Whites, Blacks, Latinos, AsianAmericans, and others must learn toacknowledge differences without pro-
50
42 CHALLENGES & OPPORTUNITIES
moting racial and ethnic hierarchiesand to build collective strength by forg-ing alliances and breaking downboundaries. Managing diversity withinBlack, Latino, and Asian Americancommunities also poses significantchallenges and opportunities. Therehas been an influx of new ethnicgroups such as Ethiopians, Haitians,Nigerians, Somalians, and blackLatinos into Boston's traditionallyAfrican American population. TheLatino community in Boston is one ofthe most diverse Latino communities inthe United States. And in the AsianAmerican community substantial num-bers of Southeast Asians have settled inthe city augmenting the large and well-established Chinese population.
Invariably change requires adjust-ments by both the more establishedgroups and relative newcomers. Thechallenge is to overcome differencesthat may exist among various sub-groups and to continue to strive for thewell-being of the whole. This is anappropriate goal for all groups withinthe city but is especially important forBoston's minority communities. Thesecommunities are already underrepre-sented politically and economically,and division further weakens them.On the other hand, strength and oppor-tunity lie in unity.
Although cultural and languagedifferences can be barriers to full partic-ipation, equal access, and justice formany residents, these same differencescan also be sources of strength and can
create opportunities when properly rec-ognized and harnessed. In a worldwhere economic, cultural, and sociallinkages across national boundaries areburgeoning, Boston businesses andother institutions could capitalize onthe talents, cultural familiarity, andcontacts of the city's diverse popula-tion. The proliferation of wide-rangingcultural connections and languagecapabilities could be used by astuteentrepreneurs of all races to competemore effectively in international arenasand other settings.
Cultural and language differencescan, in a somewhat ironic fashion,assist in bringing diverse communitiestogether. The awareness of growingdiversity within Boston's racial andethnic groups may develop a greaterappreciation of the need for programsand institutions that acknowledge andbuild on differences. For example, sup-port for bilingual and multiculturaleducation programs may gain broadersupport as more communities experi-ence a medley of cultural and languagevariations.
A New Boston
Boston's many contradictions poseimportant challenges for those who livein and care about the city. Rapidlychanging demographics and persistentsocioeconomic inequalities have madethe challenges even more compellingand the consequences of failing to meetthem even more decisive. Individualsof vision and good will must undertake
51
CHANGING DEMOGRAPHICS, CHALLENGES, & NEW OPPORTUNITIES FOR BOSTON 43
to build a new community in Bostonthat learns from the past while harness-ing the current forces of change. Thisnew Boston would recognize that racialand ethnic diversity creates opportuni-ties, rather than burdens, for all of thecity's residents. If a cooperative spiritprevails no one in the city would needto suffer alone and all Bostonians couldcelebrate together.
52
CHANGING DEMOGRAPHICS, CHALLENGES, & NEW OPPORTUNITIES FOR BOSTON 45
References
Asian American Resource Workshop. 1991. Voter Education Project. Boston.
Boston Municipal Research Bureau. 1995. Boston Facts and Figures: AStatistical Perspective on Boston's Government. Boston.
The Chinatown Coalition. 1994. The Chinatown Community Assessment Report.Boston.
Fogg, N., Leone, M., Sum, A., & Tortora, F. 1994. Boston Neighborhoods from1980 to 1990. Center for Labor Market Studies, NortheasternUniversity. Boston: The Boston Persistent Poverty Project, The BostonFoundation.
Grantmakers Concerned with Immigrants and Refugees. 1994. Newcomers inAmerica: A Grantmakers' Look at Immigrant and Refugee Issues. NewYork: Mertz-Gilmore Foundation.
Halter, M. Ed.. 1995. New Migrants in the Marketplace: Boston's EthnicEntrepreneurs. Amherst, MA: University of Massachusetts Press.
Hartigan, P. & Lewis, D. 6 January 1991. A World Without Color. BostonSunday Globe.
Institute for Asian American Studies. 1994. Community Profiles inMassachusetts: Asian Pacific Americans in Boston. University ofMassachusetts Boston.
Jennings, J., Baker, S., Williams, R., Evereteze, J., & Napier, C. 1993.Demographic and Economic Analysis Report: Disparity Study ProjectDraft.
Johnson, K. 1987. Media Images of Boston's Black Community. William MonroeTrotter Institute, University of Massachusetts Boston.
53 BEST COPY AVAilABLE
46 REFERENCES
Kennedy, L. 1992. Planning the City Upon a Hill. Amherst, MA:University of Massachusetts Press.
King, M. 1981. Chain of Change: Struggles for Black CommunityDevelopment. Boston: Southend Press.
Massachusetts Department of Health. 1993. Refugees and Immigrants inMassachusetts.
Mauricio Gaston Institute. 1994. Latinos in Boston: Poverty, Income,Education, Employment, and Housing. University of MassachusettsBoston.
The Media Project. 1992. The Community Media Study. Boston: The MediaEducation Project.
Osterman, P. 1992. "Latinos in the Midst of Plenty". In Latinos in Boston:Confronting Poverty, Building Community, by M. Uriarte, P.Osterman, & E. Melendez, Boston: The Boston Persistent PovertyProject, The Boston Foundation.
Powers, J. 10 August 1993. Invisible Voters. The Boston Globe Magazine.
Sum, A. with Bonacci, S., Fogg, N., Goicoechea, J., & Sum, J. 1994. TheChanging Labor Market Fortunes of Boston Residents. Center forLabor Market Studies, Northeastern University. Boston: TheBoston Persistent Poverty Project, The Boston Foundation. [1994a]
Sum, A. with Fogg, N. & Sum, J. 1994. Growth and Change in Boston, 1980-1990. Center for Labor Market Studies, Northeastern University.Boston: The Boston Persistent Poverty Project, The BostonFoundation. [1994b]
Uriarte, M. 1992. "Contra Vietno Y Marea Against All Odds: LatinosBuild Community in Boston." In Latinos in Boston: ConfrontingPoverty, Building Community, by M. Uriarte, P. Osterman, & E.Melendez, Boston: The Boston Persistent Poverty Project, TheBoston Foundation.
U.S. Bureau of the Census. 1983. 1980 Census of Population: Characteristicsof the Population: General Social and Economic CharacteristicsMassachusetts.
BEST COPY ANAILABIE
54
CHANGING DEMOGRAPHICS, CHALLENGES, & NEW OPPORTUNITIES FOR BOSTON 47
. 1991. 1990 Census of Population and Housing. Summary TapeFile 1. [1991a]
. 1991. 1990 Census of Population and Housing. Summary TapeFile 1A. [1991b]
. 1992. 1990 Census of Population and Housing. Summary TapeFile 3. [1992a]
. 1992. 1990 Census of Population and Housing. General PopulationCharacteristics Massachusetts.. [1992b]
. 1992. 1990 Census of Population and Housing. Summary TapeFile 4B, Subfile A. [1992c]
. 1992. Statistical Abstract of the United States: 1992 112th edition.[1992d]
. 1993. 1990 Census of Population: Social and EconomicCharacteristics Massachusetts.
Williams, R. & Kim, S. 1995. An Overview of Minority-Owned Businesses inthe Boston Metropolitan Area 1987. William Monroe TrotterInstitute, University of Massachusetts Boston.
EST COPY AVAILABLE
55
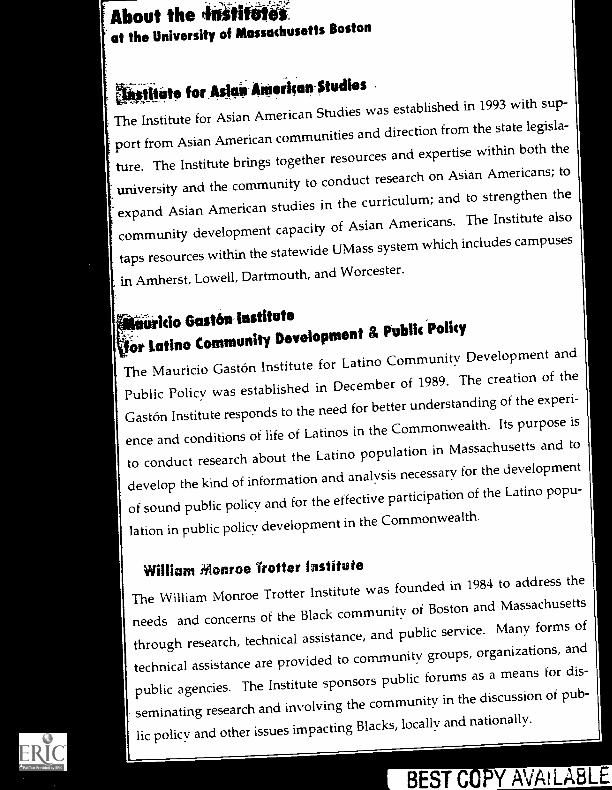
About theat the University of Massachusetts Boston
Mete for Askii-AMerican-Studies
The Institute for Asian American Studies was established in 1993 with sup-
port from Asian American communities and direction from the state legisla-
ture. The Institute brings together resources and expertise within both the
university and the community to conduct research on Asian Americans; to
expand Asian American studies in the curriculum; and to strengthen the
community development capacity of Asian Americans. The Institute also
taps resources within the statewide UMass system which includes campuses
in Amherst, Lowell, Dartmouth, and Worcester.
ido Gaston institute
or Latino Community Development & Public Policy
The Mauricio Gast& Institute for Latino Community Development and
Public Policy was established in December of 1989. The creation of the
Gaston Institute responds to the need for better understanding of the experi-
ence and conditions of life of Latinos in the Commonwealth. Its purpose is
to conduct research about the Latino population in Massachusetts and to
develop the kind of information and analysis necessary for the development
of sound public policy and for the effective participation of the Latino popu-
lation in public policy development in the Commonwealth.
William Monroe Trotter institute
The William Monroe Trotter Institute was founded in 1984 to address the
needs and concerns of the Black community of Boston and Massachusetts
through research, technical assistance, and public service. Many forms of
technical assistance are provided to community groups, organizations, and
public agencies. The Institute sponsors public forums as a means for dis-
seminating research and involving the community in the discussion of pub-
lic policy and other issues impacting Blacks, locally and nationally.
BEST C Y AVAILABLE
(9/92)
U.S. DEPARTMENT OF EDUCATIONOffice of Educational Research and Improvement (OERI)
Educational Resources Information Center (ERIC)
NOTICE
REPRODUCTION BASIS
ERIC
This document is covered by a signed "Reproduction Release(Blanket)" form (on file within the ERIC system), encompassing allor classes of documents from its source organization and, therefore,does not require a "Specific Document" Release form.
This document is Federally-funded, or carries its own permission toreproduce, or is otherwise in the public domain and, therefore, maybe reproduced by ERIC without a signed Reproduction Releaseform (either "Specific Document" or "Blanket").