Embed Size (px)
Citation preview
DOCUMENT RESUME
ED 110 199 PS 008 004'
AUTHOR Needels, Margaret; Stallings, JaneTITLE ClasSroom Processes Related to Abence Rate.INSTITUTION Stanford Research Inst., Menlo Park, Calif.PUB DATE Mar 75NOTE 23p.; Paper presented at the Annual Meeting, of the
American Educ,#tional Research-Association(Washington, D.C., March 31-April '3, 1975)
EDRS PRICE i MF-$0.76 HC-$1.58 PLUS POSTAGE .
DESCRIPTORS Attendance Patterns; Check Lists; *ClaSs Attendance;*Classroom Enrjronmemt; *Classroom ObservationTechnique's; Classroom Research; Correlation; *PrimaryEducatiOn; *Teaching Methods
IDENTIFIERS *Project Follow Through Planned Variation Program
ABSTRACTThis study explored the relationship between
classroom instructional processes and the average number of studentabsences,in first and third grades., The data were collected in a
1total of 166 classrooms as part of the Follow Through PlannedVariation Program. The Classroom Observation Instrutent, developed byStanford Research Institute, was used to record classroom activities,instructional methods, interpersonal from school records.,Since4thedata 'were correlational, causal effects could not be attributed tothe instructional processes. However, the resultS slowed 56 variablesfor first grade and 65 for third grade to be significantly correlatedwith absence'r te'after adjusting'for baseline achievement scores.Children in boA1l first and third grades seemed'to be absent less, inclassroom's whe e there was a higher degree of child independence,c _stioning, adult response, individualized instruction, andpen-ended questions'and where children and adults showed more
positive affect. Child absences appeared to be more frequent inclassrooms where children often worked in large groups, where adultsused direct questioris in academic work, and where corrgitive,feedbackwas used frequently; (JMB) ,.
"Th
t.
******************44***********************t*************************Documents acquired by4ERIC include many informal 'unpublished
* ,materialS not available from other sources. ERIC makes every effort ** to obtain the best copy available. nevertheless, items of)marginal ** reproducibility are often encountered and this affects the quality *
* of the microfiche and-hardeopy reproductions ERIC,makes available *
* via the ERIC Document 'Reproduction Service JEDPS). EDRS is not *
* responsible for the quality of the origi,Aal document. Reproductions ** suppliqd by EUS.are the best that can be made from the original.**************t*******************************************************
"1
0
4
S
J
"
SCOPE OF INTEREST NbTICE
Th. ERIC Fa My has assignedthis docurhe 1s ocessmgTo
In our Judgement this documentis also of Interest to the clearing.houses noted to the right Index-ing should reflect their specialpoints of view
DEPARTMENT OF HEALTH,.EDUCATION &WELFARENATIONAL INSTITUTE OF
EDUCATIONTHIS DOCUMENT HAS, BEEN REPRODUCED EXACTLY AS RECEIVED FROMTHE PERSON DR ORGANIZATION ORIOINATING IT .POINTS OF VIEW OR OPINIONSSTATED DO NDT NECESSARILY REPRESENT OFFICIAL NA14NAL INSTITUTE OFEDUCATION POSITION'OR POLICY
CLASSROEN PROCESSES RELATED TO ABSENCE RATE q
/Th
by
Mai2-Ilet Nt,edels
Jan(' Stallings
I
Prcsented to the
Ame11(An Educational Research Association
1975 Annual Meeting
t,:asilimgton, D.C.
March 31,-,A6ri1 3, 1975
*a.
o
CLASSROOM PROCESSES RELATED TO ABSENCE RATE
Introduction'
Most educators agree that absences are a matter of concern in the
American education system. Some urban schools have reported that on any
current school daymore students are absen.Laitn present in school. .
AbVences affect various levels within a school system the student,
classroom teachers, and thd administration. The student is affected by
the material that he has missed during his absence, and excessive absence
can cause him to fall,drastically,betiiird-h'is classmates in academic work.
Some educators view ,absenteeism in the higher grades as a'predictor of
students who will drop out'of school before graduating from high school.t
Teachers are affected by absences through the disruption of continuity
within their classrooms. A returning student muse be presented tith the
material that was taught during his absence while the remainder of the
class must be offerod more advanced materials. A large number of children
who are constanfly absent from school can be a source of frustration to
even the' most conscientious, well-organized teacher. School administra-
tors experience the impact of absences in the school system's budget.
School syst, ems usually receives their funds on the basiS of average,daily
attendance, ;Ind consequentk a school district can suffer economically as
a result of a high absentee rate.
In an effort to bring absences to a minimum, several studies have,
investigated the causes of students' absences.. The variables studied
have Included length of school day, weather, student grades,. student and%
or teacher attitudes, and school curriculum.t Most of these studies have
'Truancy Overwhelms the Truancy Officer Here, New York Times, p. 1
(February 2, 1970).
A Report of the Study Group on School Attendance'Dropout,"Study Group
on School Attendance'Dropouts, Table 17, Baltimore City Public Schools
(December 1972).
N. Karweit, "Rainy Days and Mondays: An Analysis of Factors Related to
Absence from:School,- John Hopkin's Center for the Study of Social, Organ-
ization.o.f Schools" (November 1973'.
1
sa ti
o
loased on junior or .)enior high sc'h'ool, the prevailing hypothesis being
that. older children have more autonomy in making the decision on attend-
M..t school.
This paper is focusjd on absences in the first and third grades.
It Lb an exploratory study attempting to reveal any correlation between
instructional processes within a classroom and the average number of ab-
sences for that classroom. Do very young children have the-power to
decillo whether or not they will attend school? The answer to this ques-
tion would, perhaps, benefit school districts, teachers, and students.
Background
The data reported.in this paper were collected as part of a larger
study of the Follow Through Planned Variation Program. These data were
collected during the 1972-73 school year, the foUrth year of the study.
The primary aim of the evaluation of Follow Through Planned Variation was
to determin whether educational innovators had been able to implement
their program of compensatory education. Seven educational programs
(called sponsors), representing n variety of educational viewpoints, were
selected,for'the study.
The seven Follow Through programs selected for study represented. a
wide spectrum of innovative educational theories. The range includes two
model based upon the positive reinforcement theory (the University of
4-. 2.. Kansa and University of Oregon), a model based primarily upon the cogni-
tive /developmental theory of Jean.Piaget (High/Scope Foundatlon), an open
... classroom model based upon the English Infant School theory (Education
Deylopment Center), and three oilier modelsfdrawn from Piaget, John Dewey,
anc the English Infant Schools (Far West Laboratory, University of Arizona,
and Bank Street College).
1easurements
An observation method, called. the ClaSsrooM Observation Instrument,
was developed by Stanford Research Institute and used to assess program
implementation. The Classroom Observation Instrument is /tructured to
desLribe activities and interactions in A classroom. Through the use of
prescribed codes, it yields a.record of classroom activities, the class-,
room environment, the interactions between the teacher and/or aides and
the children, and interactions among the children. This observation in-
strument was developed specifically for focusing on and recording the
instructional methods, interpersonal interactions, and classroom atmosphere
in ways necessary to reflect the variety of educational models.
2
The Instrument
The Cl
sections:
servation Instrument (COI) contains three major
Th'e elassroom SummAry Information (CSI) section.
he Pliysi-CAErivironment 1-h-format-bin (PEI) section.
The Classroom Observation Procedure (COP), which consists'of
three parts: The Classroom Check List (CCL), Five-Minute
Observation Preamble (PRE), and Five - Minute. Observation (FMO).
In a single observation day, the CSI and the PEIare, completed once and
the COP (which includes the CCL, the PRE, and the FMO) is completed four
times an hour.
Classroom Summary Information
The Classroom Summary Information (CSI) section is designed for (i).
Loding the number of children enrolled and the number present on the ob-
servation day; (2) the number of teachers and aides assigned to the Class-
room*and (3) the number of volunteers or visitorsyteSent on the observar
tion day. Also recorded in this section is the length'of the school day.
Physical Environment Information
The Physical Environment Information (PEI) section provides space
for coding information about the classroom setting, which includes the,
presence and use of specific equipment, instructional materials, games,.
Lovs, and displays in the classroom. The observer also records whether
the colassrodm has movable tables and chairs or stationary desks in rows,
' whether seating is assigned during part of the day or self- pelected,, and
whether children arc assigned .to groups by the teacher or aide ors select
their own work groups.
Classroom Observation rocedure
The4Classroom Observation PKocedure (COP) consists df.three sections
of codes that describe the classroom structure and process:
5
Classroom Check List (CCL)
Five-Minute Observation Pl-eamble (PRE)
Fi\e-Minute Observnt-t-on (FM0).
Fhe lass )om observer completes the entire COP--the CCL, the PRE, and
the FM -approximatOy four times an hour or 16' to 20 complete COPs over
a four- to fiVe-hour observation dnv.'' -
,______--
. Classroom Check List
t . -. 1 t
\ As noted above, tlie----trassroom Check List (CCL) is completed approxi-
matelymatelv fo/drt-ines an hour. The CCL is referred to as a -snapshot" of the
sroom because it allows for coding relatively stable "pictures," at,a
given point in tirlie, of the activities enpaged in and the distribution of.----- ti42 adults and children in the classroom. A record is made of activities
occurring, of child and adult grouping patterns, of adult_roles, of child
involve-Jent, and of the materials used in the academic activities. Forexample, sevet d activities mav be taking place simultaneously in the
classtoom:1 a small group of children may he doing crafts under the guid-
ince of a teacher aide, the teacher may be instructinp a large group (over
eight chilcAren) in reading, three yhildren may be working independe4tly
on n science project, and four children may be using t gcs and blocks in
independent play. In this case, all'of these activitie and the number
of individuals involved in each would be recorded on the CCL.
The Five-Minute Observation Preamble
The Five-Minute Observation Preamble (PRE) is designed for recording
intormation about the activity in which the preselectqd focus pers-Oh-,-
whether child or adult--is actually engaged. This iOdone four times an
hour. The observer focuses on the selected person just before the five
consecutive minutes of ohservatio ;i begins and records: whether the focus
person is an adult or child and his'her identification number; tfle CCL
code 'number for the activit'; the role of the adult--that is, whether
the teacher; aide, or volunteer is observing, participating, or directing
tits activity, or not involved; the number ofichildren involved; whether
tie activity in progress is a continuation of the previously observed
4The number of observations cannot be fixed because. some hours are in-
terrupted by recesses or uther out-of-classroom events.
O
activity'(i.e., the preceding FMO); and the time the FMO was started.
If, during the five:minutc-obserNation period, there is a change in the
activity in which the focus person isWgaged, the observer records the
activity actually taking plae at the end of the time period in the desig-
nated space'at the eivl of the FMO. 'de
The Five-Minute Observation
l'he last part of the COP, the Five-Minute Observation (FMO), is coded
four times an hour immediately after the Preamble and is used to record
interactions among people in the classroom. One person, the preselected
focus adult or child, is,follwed throughout the five-minute-pbservation
period and the activities and interactions of which he/she is a part, and
only these, are recorded.
Absences
The data on absences used in this analysis were obtained from school'
records.
Sample1
_ 2 '
The data presented her wereobtained in Follow Through and Non-:
Follow Through classrooms across the country. The Non-Follow Throtigh
classrooms were observed in the same sites as 'Follow Through classrooms.
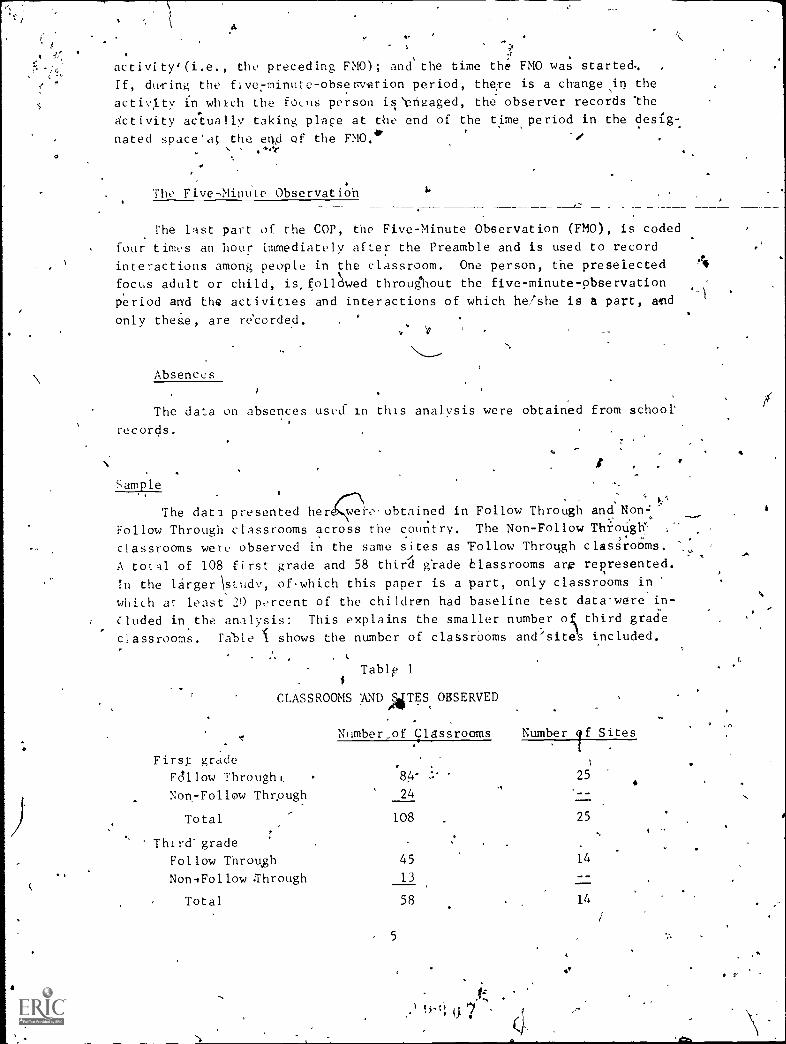
A total of 108 first grade and 58 third grade Classrooms arg represented.
In the larger\studv, of,which this paper is a part, only classrooms in
which at least 20 percent of the children had baseline test data were in-
Cluded in the analysis: This explains the smaller number o third grade
classrooms. fable I shows the number of classrboms and'sites included.
Tablp 1
CLASSROOMS ;AND RTES OBSERVED
First grade
Number .of Classrooms Number Sites
.
If
Fdllow Through,, 84- 25
Non-Follow Through 24
Total 108 25
Third-grade
Follow Through 45 14
NoniFollow Through 13
Total 58 14
5
fz
1j 7
LW.
.Metho4ology
' The.'main focus of this paper is ,on correlationaldata that have been
adjusted for the baselineenterinktMte Range Achievement Test (WRAT)
scores. 'An o'xploratory. proceduTe was also used with a step-wise rdgres-;
sion analysis.
edata were collected on two days separate from the child behavior. Child,
behavior data were collected, On one,.clay by observingfour children per
cla:sroom and observing each child five separate times for five minutes
each.
o.
ObserN;ation ddta were collected for three days. First, adult,process
The data reported here were computed over all classrooms, separated
only by grade level. This procedure was used to investigate instructional s
prd(esses and their relationship to ,child absence regardless of where they
occurred.
From the data collected, 340 instructional variables were used inthe
correlations. The value assigned to a variable was the ;average numberof
tImes that specific variables occurred per five - minute, observation during
the total number of days observed. This was computed by classroom.
Absence data were obtained from the school records; these listed the
number of days absent per child. Classroom means were computed from these
data. There is no control for the length pf the school year.
4
The problems of interpreting correlational data need to be mentioned
They concern such pitfalls as apitalizing on chance results and drawing
invalid inferencestfro the correlations. The problem of capitalizing on
chance'is compounded bA the large number of tests of signiticace that
were computed. Of'the 340 partial correlations computed with data on
child absence, approximtely 17 significant correlations (p < .05) would
be expected to occur by chance if the variables were statistically incl--.
pendent. The findings reveal 56 firstgTade and 65 third grade correla-
tions that were-found to be significant. The problem is that there is no
way of identifying which correlations occurred by chance. Variables that
correlete similarly-at both first and third grades probably: can be inter-
pre,ted with more confidence. The strongest ,type of statement that can be
made when interpreting these correlations'taices the form, "in classrdats
where'teachers were observe to be more positive toward children, the ab-
sence rate was lower.-
Causalrelationships cannot be inferred from correlational findings.
114 Correlations we,Te adjusted for baseline achieveTent scores-in a art mpt .
6
4to eliminate any relationship between, a large proportion of high achieve-
4 ment test scores and low nuMber of absences within a classroom: The re-
sults of this study are skgnifleant Rnough to warrant, further explRration
into the reavns for abeentveism.
1
Relationship Between Days Absent and Instructional
Process Variables /-
1
,'As stated prevLqusly, 56 variables for fiist grade and 65 variabl,
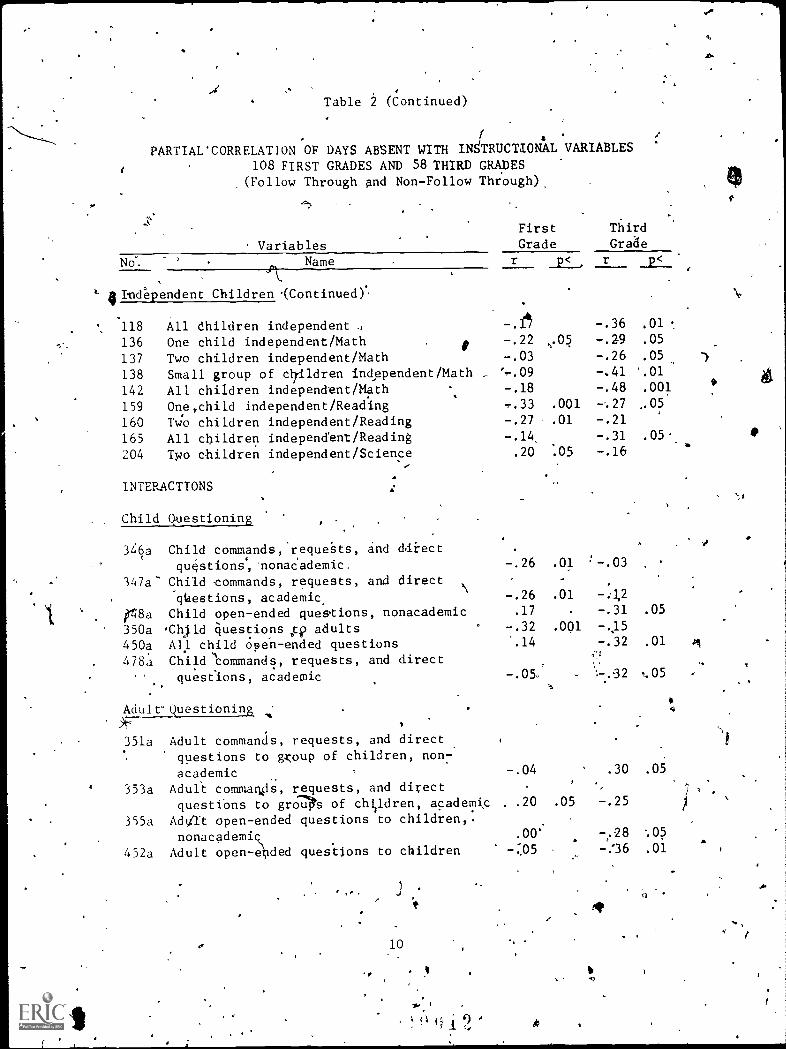
for third grade were fosind to be .significant (p < .05). ,Tahle 2 lists
these variables. For the purpose of comparison, lf a variable was sig-
nificant only at one grade level, corielations are shown for both grades.
A positive, correlation between an instructional variable and days absent
means that children were absent more often in classrooms where that in-
trn.tional process occurred. As-negative correlation,between ,an instruc-
tional variable and days absent means that children were absent less often. .-
in classrooms where that process occurred. . ..
,
First trade Classrooms
.
Information recorded on the observation .instrument includes materials
used in the classroom. Two very similar variables that indicaee the use
of audiovisual eqdipment showed n negative correlation with absences (see
Table 2): Apparently, first gra'de classrooms in Which audiovisual 'equip.:
ment is used'as an instructional aid experience fewer absbnces than othex
Classrooms.
ActiYities of the classroom personnel and grouping arrangements of.
children also were related to the average number of.pupil absences in the
first grade. The variabrys indicating that the teacher or aide was engaged
in a task without children showed a positive correlation with days absent;
thus, classrooms where thy teacher or aide-was oceupiedly activities that
. did not include children, such'as grading papers, praring assignments,
. or eleaning_up, show a positive correlation with absences. Absences were
also positively correlated in classrooms 'Where adults worked with large.
. groups of children (i.e.; more than eight).
A's. might be expected, individualized attention appears to be an im-
portant factor ip daily attendmice. (The 12 variables relating to (in-
dividualize.d attention are listed in Table 2.) All of these variables
indicating individualized attention showa negtive correlation with days
absedt f4om school. The four mot. Tavorablecorrelations were adult witkl
one child, one child with any adult, one child with any adult in reading,
and personafiZed 'instruction in reading.
r
I
S
-
0.
4.
Table 2
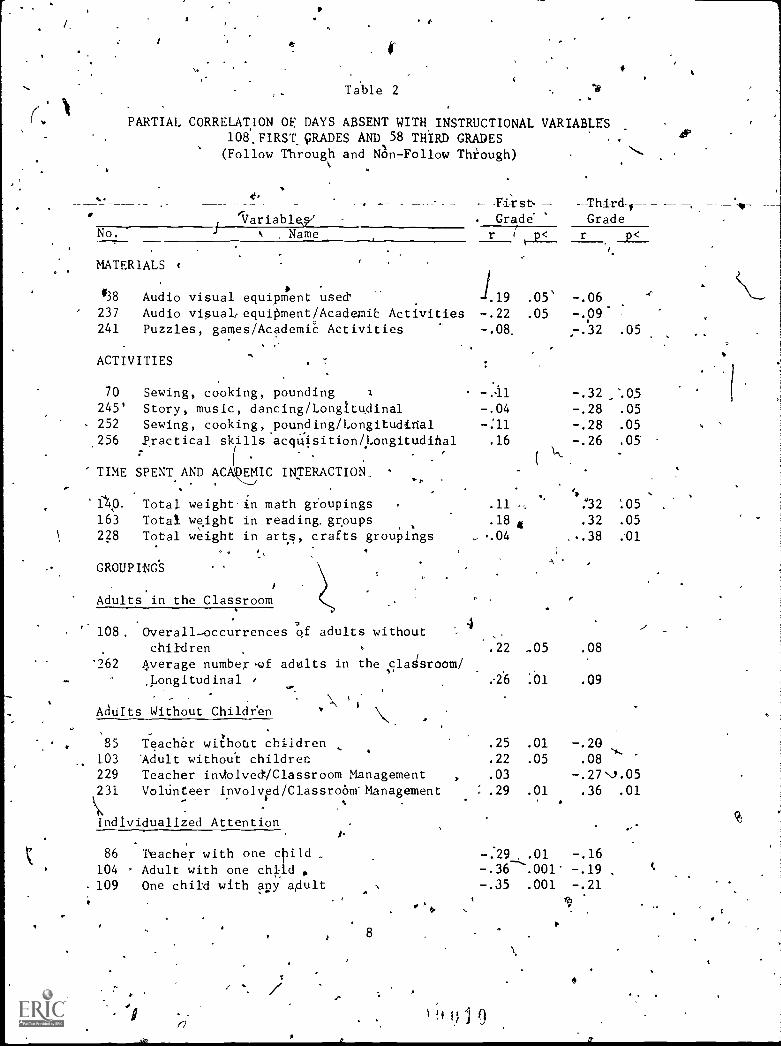
PARTIAL CORRELATION OF DAYS ABSENT WITH INSTRUCTIONAL VARIABLES108.FIRSTJRADES AND 58 THIRD GRADES(Follow Through and Non-Follow Through)
MATERIALS 4
First-
, 'Variables/ Grade Gradek , Name r t_p_< r Po<
138 Audio visual equipment used' 1.19 .05' -.06o
' 237 Audio visual)equiPment/AcademiC Activities -.22 .05 -.09-241 Puzzles, games/Academi Activities -.08. 7.32 .05
ACTIVITIES
70 Sewing, cooking, pounding i -.11 -.32 ,'.05
245' Story, music, dancing /Longitudinal -.04 -.28 .05
252 Sewing, cooking,younding/Longitudinal -:11 -.28 .05
.256 Practical skills acqUisition/Longitudihal .16 -.26 .05
(
TIME SPENT AND AC EMIC INTERACTION_
.Ap. Total weight-in math groupings163 Total weight in reading, groups
.11 ,
.18 4
:32 :05
.32 .05
228 Total weight in arts, crafts groupings .04 .38
GROUPINGSA '
Adults in the Classroom
' 108. Overall occurrences of adults withoutchildren .22 05 .08
'262 average number .of adults in the cladsroom/Longitudinal ) .26 :61 .09
12/P.
Adults Without Children
85 Teacher without children .25 .01 -.20103 'Adult without children .22 .05 .08
229 Teacher imiolvediClassroom Management . .03 -.27J.05231 Voldnteer involved/Classroom-Management .29 .01
, .
.36 .01
Individualized Attention
86 Teacher with one child -:29 .01 -.16104 - Adult with one child , -.36 -.19
. 109 One child with any adult -.35 .001 -.21
ts
8
I.
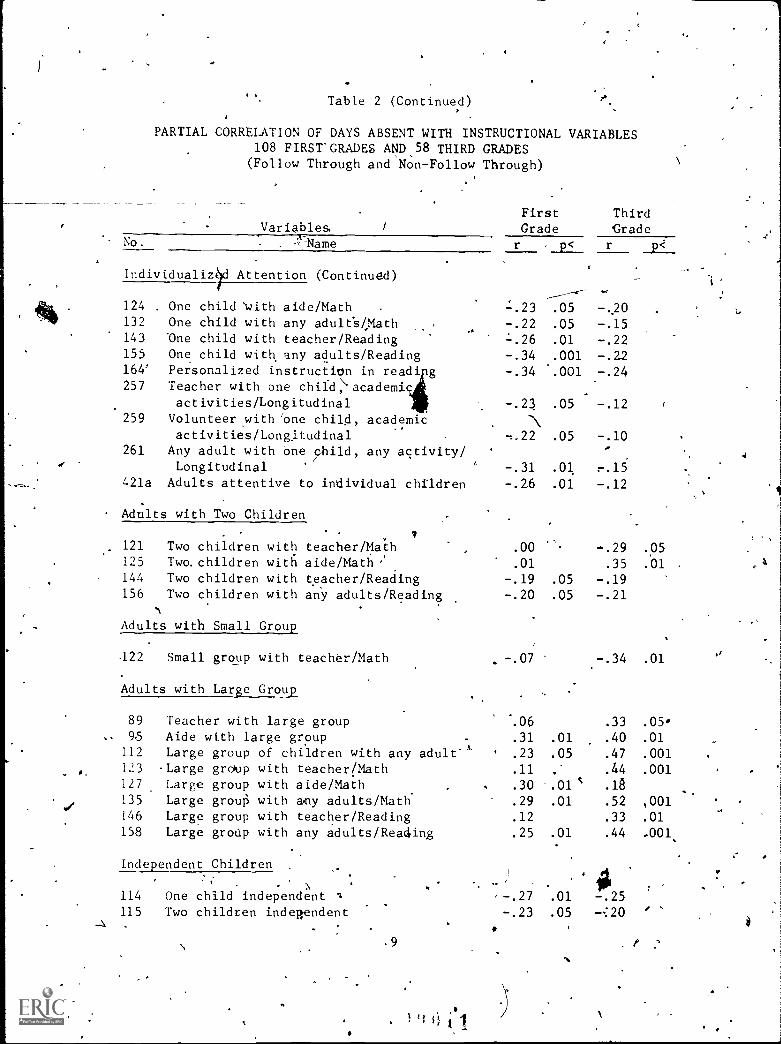
Table 2 (Continued)
PARTIAL CORRELATION OF DAYS ABSENT WITH INSTRUCTIONAL VARIABLES108 FIRST'GRADES AND 58 THIRD GRADES
(Follow Through and Non-Follow Through)
No.
Variables,
- -';'Name
Individualized Attention (Continued)
First ThirdGrade Grade
r .p< r p<
124 One child with aide/Math . -.23132 One child with any adultS4Math -.22143 One child with teacher/Reading -.26155 One child with any adults/Reading -.34164' Personalized instruction in readi g -.34257 Teacher with one child>academic
activities/Longitudinal -.23259 Volunteer with 'one child, academic
activities/Longitudinal ,.22261 Any adult with one any activity/
Longitudinal -.31421a Adults attentive to individual children -.26
Adults with Two Children
. . 1
121 Two children with teacher/Math .00125 Two. children with aide/Math '' .01144 Two children with teacher/Reading -.19156 Two children with any adults/Reading -.20
Adults with Small Group
122 Small group with teacher/Math -.07
Adults with Large Group
89 Teacher with large group %0695 Aide with large group .31
112 Large group of children with any adult' .23123 Large group with teacher/Math .11
127 Large group with aide /Math .30135 Large group with any adults/Math .29146 Large group with teacher/Reading .12
158 Large group with any adults/Readin .25
Independent Children
114 One child independent IL
115 Two children independent
17 1 4.1.1
-.27
-.23
.05 -.20
.05 -.15
.01 -.22
.001 -.22
.001 -.24
.05 -.12
.05 -.10
.01
.01 -.12
-.29 .05
.35 .01 .
.05 -.19
.05 -.21
-.34 .01,1
.33 .05.01 .40 .01
.05 .47 .001
,' .44 .001
.01 c .18
.01 .52 ,001
.33 .01
.01 .44 .001,
V
.01 -.25
.05 '
-
I
ro
.t.
Table 2 (Continued)
PARTIAL'CORRELAT1ON OF DAYS ABSENT WITH INgTRUCTIONAL VARIABLES
108 FIRST GRADES AND 58 THIRD GRADES(Follow Through and Non-Follow Through),
Variables
'-.09
FirstGrade
ThirdGrade
Name r r p<
4 Independent Children -(Continued)''
_p<
-.f,
-.22 ,.05
-.03
-.18
-.33 .001
-.27 .01
-.14,
.20 .05
-.36
-.29
-.26
-.41-.48-.27
-.21
-.31-.16
.01
.05
.05
'.01
.001
,.05
.05'
118 All Children independent .
136 One child independent/Math ,137 Two children independent/Math138 Small group of children independent/Math _
142 All children independent/Math159 One,child independent/Reading160 Two children independent/Reading165 All children independent/Reading204 Two children independent/Science
INTERACTIONS
Child Questioning
346a Child commands,'requets, and ddlect. i
questions, nonacademic. -.26 .01 '-.03
347a- Child commands, requests, and directOdestions, academic. -.26 .01 -.-1,2
018a Child open-ended questions, nonacademic .17 -.31 .05
350a Child questions ,,tp adults ° -.32 .001 -.15
450a All child opeil-ended questions '.14 -.32 .01 At
478a Childlommands, requests, and directo°2
questions, academic -.05. h.32 '.05 .
%
AdulrQuestioning. ..,' 4
* 1
351a Adult commands, requests, and directquestions to group of children, non-
academic -.04 .30 .05
353a Adult commanes, requests, and directquestiOns to grON of children, academic .20 .05 -.25
355a Advil open-ended questions to children,.
nonacademic.
.00' -.28 :05
452a Adult open -ended questions to children -:05 .
..-
-:36 .01
J4
10
e*f
Table 2 (Continued),,
PARTIAL CORRELATION OF DAYS ABSENT WITH .INSTRUCTIONAL VARIABLES1081FIUT GRADES,AND 58' THIRD GRADES
(Followhrough and Non-Follow Through)
'No.
Variables,Name
Child Responsiveness
.
363a' Child group responses to a4ult academic,command, request, or direct questions
368a Child responses to adult open-ended/*
questions
371a Child extended-responseto adult open-,ended question
585c Child's extended response to questions
Adult Responsiverress
fi
364a Adult responses to child requegts or..questio s, academic ,
,365a Adult responses to child requests orquestions, nonacademic
367a Aellt responds to cluld question withdirect qu.estvn- .
453a Adult response to child's question witha question
'495a Addlt response'S to child requests orquestions, academi
Ada-ft Feedback4
-
a 400a Adult mieinforcement with token, behavior403a Adult praise, behavior ,
.
v,-,_ '405a All adult coi;rdetive feedback to children
409a. Adult negative corrective feedback,-behavior ', .
410a Adult positiAFe corrective feedback, other
i''. & '' task-ref hted
,..1,...:-.V1 -1Adult:negativexorrective feedback, othera
4 task-related .
Izo 432a Adult pun401ment of children447a Adult neutral corrective feedback, task-
f ,.
4. v iii),..related ; mip.
11 448a Adult neutral corrective fe4dback; behavior.41601h MYadultnegative cc4Ative feedback465a Adult feedback to children for behavior
a
N
First ThirdGrade Grade
r,
.22 .05 .25
-.36 .01
-.16 -.31 .05
-.17 -7-34 .01
-.26 .01 -.10
.05' -.18
-.22 .05 -.01
-.23 .05 -.02
-.07 -.26 .05
r
k
.33 .001 -.02
.32 .001 .02 .
.09 .48. .001 sit
-.04 ' .37 .01
..13 .40 ,. .01
.07 .36 .01
.13 .54 .001
.02.
.38 .01
X .41 .01
-'-.05 -- .51 .001
.21 .05 . .34' .01
,
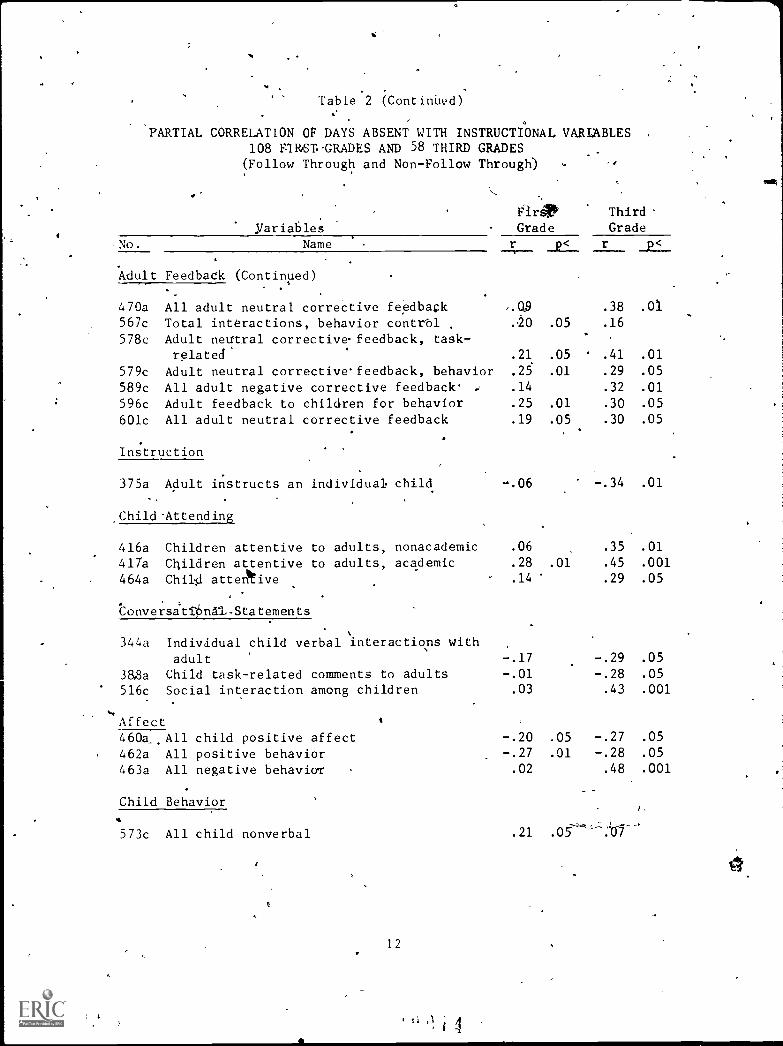
Table 2 (Continued).
PARTIAL CORRELATION 01' DAYS ABSENT WITH INSTRUCTIONAL VARLABLES108 F1R6T.GRADES AND 58 THIRD GRADES(Follow Through and Non-Follow Through) -
Firs, ThirdVariables Grade Grade
No. Name r p< r
Adult Feedback (Continued)
470a All adult neutral corrective feedback567c Total interactions, behavior control578c Adult neutral corrective feedback, task-
related'
579c Adult neutral corrective' feedback, behavior
589c All adult negative corrective feedback' ...
596c Adult feedback to children for behavior601c All adult neutral corrective feedback
,A19
.0
.21
.25
.14
.25
.19
.05
.05
.01
.01
.05
.38
.16
' .41
.29
.32
.30
.30
.01
.01
.05
.01
.05
.05
Instruction
375a Adult instructs an individual child -.34 .01
ChildAttending
416a Children attentive to adults, nonacademic .06 .35 .01
417a Children attentive to adults, academic .28 .01 .45 .001
464a Chil4 attentive .14 .29 .05
Convetsatrklat.Statements
344a Individual child verbal interactions withadult -.17 -.29 .05
38,8a Child task-related comments to adults -.01 -.28 .05
516c Social interaction among children .03 .43 .001
Affect 4
460a_. All child positive affect -.20 .05 -.27 .05
462a All positive behavior -.27 .01 -.28 .05
463a All negative behaviaT .02 .48 .001
Child Behavior
573c All child nonverbal .21
12
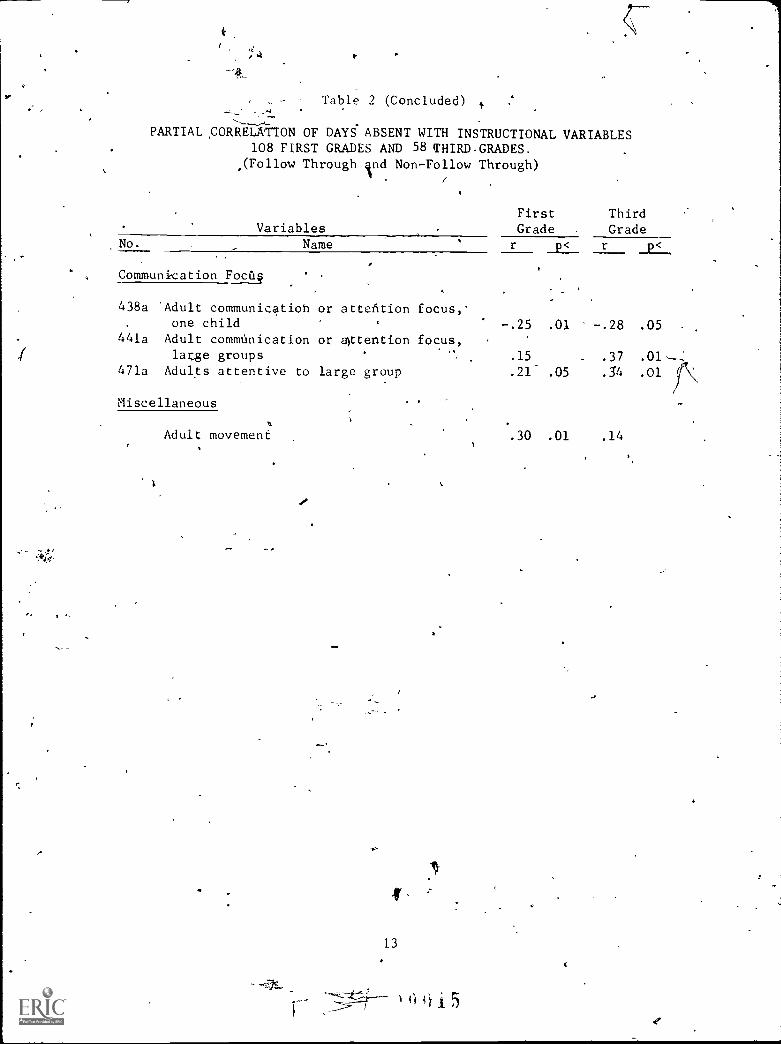
Table 2 (Concluded) t
PARTIAL CORRELATION OF DAYS. ABSENT WITH INSTRUCTIONAL VARIABLES108 FIRST GRADES AND 58 THIRD.GRADES.
,(Follow Through ind Non-Follow Through)
No.
VariablesName
Communication Foctiq
438a 'Adult communicationone child
441a Adult communicationlatge groups
471a Adults attentive to
Miscellaneous
Adult movement
4;
or attention focus,'
or .attention
large group
t
13
focus,
First ThirdGrade Grade
r_p< r
-.25 .01 -.28 .05
.15 - .37 .01--,
.21' .05 .54 .01
.30 .01 .14
Two variables that recorded tlie number of dults in the classroom
. showed a positive'correlation with number of das absent, which may indi- I
cate that a higher adult- student ratio is only one aspect to be con-
sidered when evaluating the effectiveness of-classroom personnel. What
the adult is doing may be more important than sheer number of adults.
In Llassroms where adults were less involved with the children or worked
only with large groups a-significant puitive correlation with absencest
was likely, while classrooms where adults interacted with children on a
one -to -one basis had a negative correlation with absences..
Five variables that indicate that 'children were allowed to\work on
their own without adults showed a negAive correlation with absences.
In particular, these variables descriobtionc,or two children working in-
dependently in reading or math.
In a clasSroom atmosphere where children'asked questipns of the
adults, child absences correlate negatively. Three 'variables that de-
scr'be 'child questioning correlated negatively with absences.
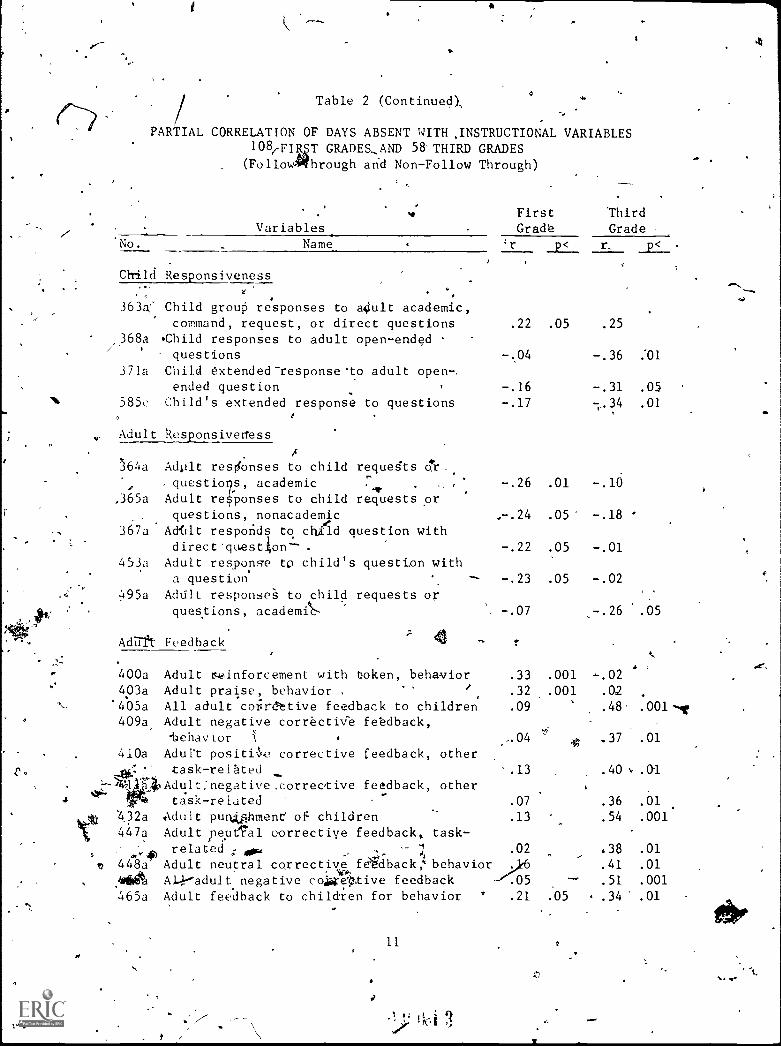
In classrooms where adults responded to children's questions, the
children were absent less frequently.' Two other variables that reflect
specific types of adult responses to the questions of children also were
related to a higher school attendance. These describe ..an adult respond-
ing to a child's question with another question. All of the preceding
variables describe situations where adults are responsive to children,
two of them suggest that adults are encouraging the children to think by
asking further questions, rather than just providing an answer.
The average numbet of absences tended eo increase in classrooms
where children observed an adult engaged in an academic activity; i.e.,
the children Were not actively engaged in their learning but instead were
observing or listening to an adult. Also, classrooms that had small
groups of children responding in chorus to adult questions during academic
instruction showed a positive correlation to absences. Both of these
variables suggOt a lack of individualized attention, and individualized
attention is an instructional process that was previously identified as
having a significant negative correlation with absences.
Instructional variables that indicate adult feedback to children
regarding their behavior in the classroom show a positive correlation
with absences. These correlations occurred whether the feedback was
orai,ie for acceptable behavior or criticism for unacceptable behavior.
14
i4 1 (3
JO.
1
Third Gtade Classrooms
fhe kind of mat,,,rials used in the classroom, which was related to-
the chiPZIren's absences, changes from fi,rst to third gt-ade. In third
glade classrooms where puzzles and games were used in academic activi-
ties, children's absences correlate negatively (see Table 2); whereas
in first grade.classrooms, attendance was related to higher use of audio-
wistial equipment.
In the third grade,acertain classroom activities seemed tb be asso-
ciated with the absences. In classrooms where children engaged in acti-
vities that allowed for more motor activity, such as sewing, cooking,
carpentry, stories, music, dancing, or acquisition of practical skills,
absences are 'negatively correlated. Absence is positively Correlated
with a higher percentage of the time spent in reading and math.
It should be noted here that these variableq,,only record the prevail-
ing activity and do not identify a classroom where children are taught
reading and math in what appears to be a different type of activity, such
a, carpentry or cooking. However, if a conventional reading or math ac-
tivity is occurring, it is recorded as such. Therefore, the occurrence
ot activities stAllas, sewing, cooking, and so on, does not show that an
academic subject is not being taught.
In direct opposition to the first gra'cle findings regarding the
1 teacher or aide without children, in classrooms where the third grade
reacher was involved in classroom management tasks, the children's ab-
sence correlates negatively. A'hird grade children may have less need of
the teacher's attention and may be more independent than first grade
children, so that when the, teacher engages in classroom management tasks,
attendance is not adversely affected.
( As in the first grade, absences correlated positively with third
grade children spending a large portion of the school day in large groups
with adults. Seven variables, which represented children in large groups
kith adults, showed a positive correlation with the absences. These were
not limited, but referred'to large group activities in reading and math
and all other activities. Two interaction variables that incl!icate'adults
fOcusing their attention on a large group or speaking to a large group
correlate positively with absence. (Adults observing or listening to a
large group was Also a significant variable for first grade children.)
Cunversely", when't1q1Vten received individualized attention, the corre-
lation was negative with absences. Adult attention to one child also
correlated negatively with absences in first grade classrooms.
15
;
As in the first grade, in third grade, classrooms where children were y
mare independerit the correlation was negative. These correlations' occur-
. . rod in all instances of children operating independently in activities,
and they also occurred. whether the child was working alone, with another'
child, or in a small group in math.
Third gr'ade classrooms where children asked questions and where
adults were'responsive to the children showed a significant negative
correlation with absences. -,
In third grade classrooms where adults asked children open-ended\
questions, the correlation was negative. This finding is further empha-
:,1,:ed by Lwo variables that relate to child r sponses tt-.4 open-ended ques-
tions: when children responded to an adul s open-ended question or-gave
an extended response to any type of ques ion, the correlation was also
negative?. However, the correlation wa positive in clas'srooms where
adults commanded or asked direct que tions.of groups of children in non-
academiL activities.
Absences correlated positively in classrooms where children were
more otten not interacting but were listening to ,or obserVing adults.
. A high correlation (.45) with absence was found for children attentive
to or obsrving adults in an academic activity. This was true for both
'first and third grade clooms where the children's outward behavior
was passive, which indicates that they were not actively involved in the
academic activity.
Variables that reflect another dimensiip of an interactive environ-
ment indicated t1at 90 correlation was negative when the conversation
was task-related. However, when the interaction was purely social, the
correlation was positive-.. (Social interactions included all of the
general comments children make among themselves, both positive and nega-
tive; these were mainly' greetings, personalicompliments, or criticisms.)
. 4
Consistent with -some of the first grade findings, many types of
adult feedback were related to children's absence from school. Not sur-
prisingly, adult punishment of children had the. highest correlation of
.54. This means 'that in classrooms where children were often' punished,
children also were absent more often. This finding could be of interest
to those state legislations who, are currently passing laws .that will make
corporal punishment in the schools illegal Without thewritten consent
of the parent. Another high correlation with absencts was all adult
negativ, corrective feedback where the" correlation w)k .51. A total of
15 feedback variables showed a significant correlation with absences.
Ia the first grade, the 'feedback variables correlated primarily'with
9
behAor. However, in the third grade, the &feedback Variables were re-
lated to nonacademic task activities and academic activities as well as
to behavior. In anv event, feedback, whether negativie, neutral, or posi-
tive, always had an adverse relntionship with the attendance of third
grade children.
The correlations of theVariable that describe feelings or affect
were similar for third grade and first grade. ClasSroomswith the morepositive behavior showed a negative correlation to absence. In addi-
tion, in third grade classrooms wINre more negative behavior as observed,
whether on the part of adults or children, a positive correlation bf
.48 was obtained.
Conclusions
rhe:;e data sAlgge, that -in both first and third grade classrooms,
Children may be absent less frquentiv in classrooms where there is a
higher degree of child, independence, child questioning, adult response,
indiyidualiZed instruction, and open-ended questions. Alt, in class-,
rooms where children and adults show more positive affect'the children
are absent less often. .
?55"
1
is
Child absences correlate positively in both first and third grade
classr.olop/s where children work in large groups more often and where
adults used direct quesions2in academic work and more, often used cor-
rectiveA
rective feedback. ,
''
.i> .',t ;
,
Findings forthe'khird grade indicate that iriclassrbots where
children were punished more often, the correlation was highly signifi-
(ant. Iii additAops
, in classrooms with a high occuhrence of negative
affect on the part of teachers 'and ',students, ab;enies correlated'posi-1;tivelv. , -
Although the data are correlational and causal effects cannot be
attributed to the instructional processes, the correlations are high`
enough, and the sample large enough, to suggest some directions for fur-
ther research in absenteeism.
Absence Rate for Follow Through Sponsors
As stated earlier, the Follow Through spdrisors represent, several
approaches to education. The'overafl average of classroom absences
17
r
t 9
across sites by sponsor can supply further information regardiriV the
relationship of instructional process to absences. P
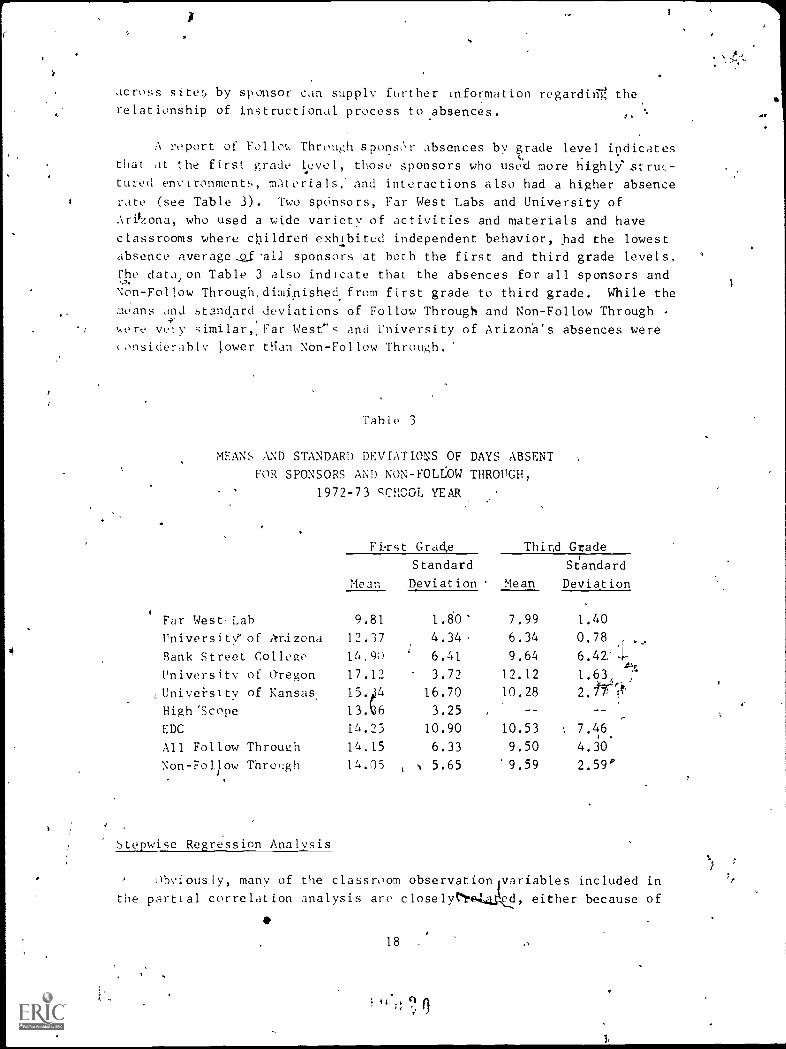
A report of Follow Through sponsi',1- absences by grade level indicates
that at the first grade Idevel, those sponsors who used more highly strut-
turgid environments, materials and interactions also had a higher absence
rate (see Table 3). Two sp6nsors, Far West Labs and University of
Argzona, who used a wide variety of activities and materials and have
classrooms where children exhibited independent behavior, had the lowest
absence average __Qf -all sponsors at both the first and third grade levels.
Che data,on Table 3 also indicate that the absences for all sponsors and
Non-Follow Through.diminishedfrom first grade to third grade. While the
means and standard deviations of Follow Through and Non-Follow Through
lAere vety similar,,Far West "c and University of Arizona's absences were
(onsiderdblv lower tlidn Non-Follow Through.
Table 3
MEANS AND STANDARD DEVIATIONS OF DAYS ABSENT
FOR SPONSORS AND NON-FOLLOW THROUGH,
1972-73 RCUOOL YEAR
Far West,Lab
University' of Arizona
Rank Street College
University of Oregon
,Univei.sity of Kansas
High 'Scope
EDC
All Follow Through
Non-Follow Throught
,
Fi2rst Grade Third Grade
Mean
1
Standard
Deviation Mean
Standard
Deviation
9.81
12.37
14.90
17.12
15.34
13A6IA-23
14.15
14 .05
1.80'
4.34,
6.41
3.72
16.70
3.25
10.90
6.33
N 5.65
7.99
6.34
9.64
12.12
10.28
10.53
9.50
9.59
1.40
0.78
6.42:4-,ai,
1.63, P.
2. ri''
--
, 7.46.
4.30
2.59°
Stepwise Regression Analysis
k,Obviously, many of the classroom observation variables included in
the partial correlation analysis are closelyt'te4,4_ed, either because of
18 .
41 0
40
0 Or4
the way they are defined Or':because certain'processes occur together in
the classroom. Because of the relationship among the process variables,
it was impossible to determine from the partial correlation the unique,,
contribution made by each variable to the prbdiction of the number ,;f
days absent. Because oftthis, it was decidecrto run an exploratory analy-sis using stepwise revessionsl
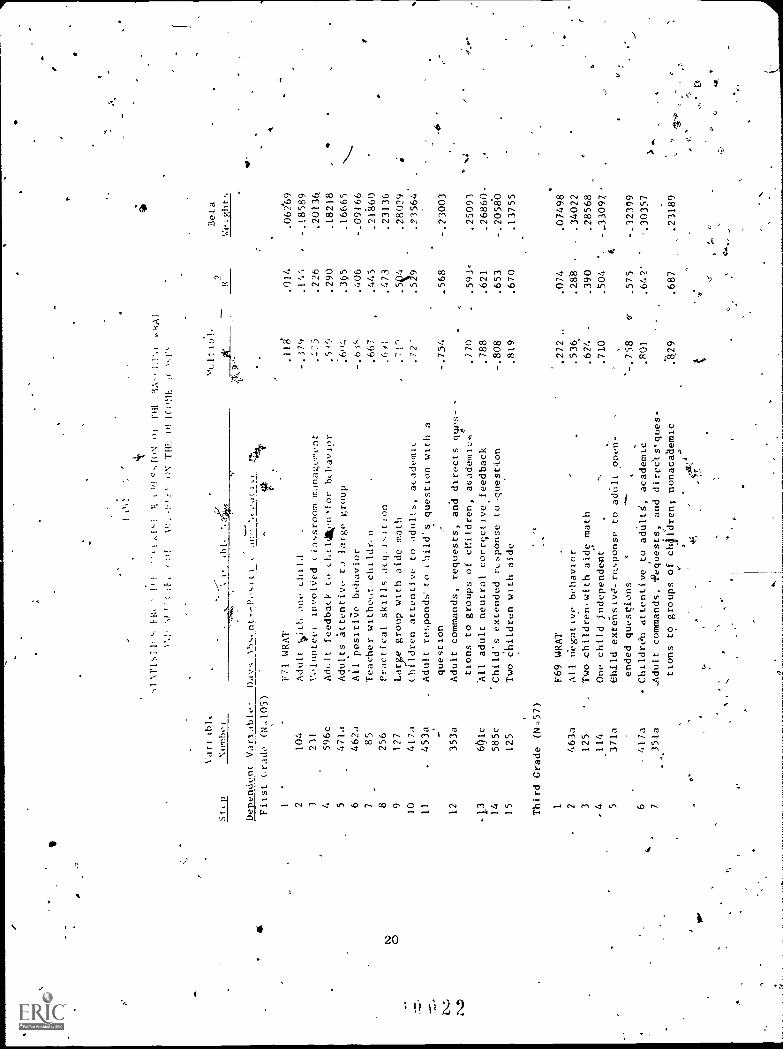
4 e This analysis is an attempt to identify an entire process thlats might'
be correlated with days absent. Jt should be noted that all of these *.
variables combined and in the exact order listed form the multiple R'of
.819 for first grade and .82.9 for third grade (see Table,4).
A set of 38 process variables was chosen to be entered into the step-wise i-egressionf Based on previous findings, the process variables
hclected had shown to be strong predictOrs of outcomes., A stepwise mul-
tIole linear regression was run' separately for each grade level with
days absent" as the dependent variable and the set of selected process
variables and thebaseline WRAT score as independent variables.' The
baseline WRAT score was placed in the regression on the first step, and
process, variables were added one at a time until a total of 20 were en-
tered. Varjables weee listed until further significant'increase in the
R2 did noE'occur.
For first grade, 14,p.rocess variables and for third grade, seven44.
variables showed significant contribution.
Bet'a weights for all the variables are listed. These values are
those shown at the last step(Step"15 for first grade and Step 7 for
third grade). The sign of the beta weights remained stable.wit,h-the
cat the correlations. By rilnking the value of the beta weights',
one can determine.the power of prediction each Variable would have to
thertuillber of d'ays absent.
,
x.The WRAT R- values at e first step (where WRAT was entered) were
very small, indicating thatI'the WRAT accounts for very little of the
Jf variance for'the absence rate. Educators have different opinions as to
whether student achievement correlates highly with absences.* Althoughti this analysis is conducted at the classroom level rather than individual
child, the value of WRAT scares is low enough to stimulate further re-
search.
*K. J. Gurecki and S. R. Wursten, A Study of the Relationship of the
Length of Continuous Attendance at a Single School to Rbading and
Acbievement'Test Scores," University of Arizona (July 1974).
19
\11:
-.+
111
1-1+
k1.
11:A
P-.!
Rt .
1Q,1
()\:
iyPi
l34
- 1.
1'.1
,kA
i()
II'r
r'T
HE
()1
IC
ON
E)k
r<
4
O
ca
Varitbl,
ilLE
Numhei
,.%-i
-,4
.i-
121.L,,w1
11.ltipl_
-
e
R
.
%
Beta
Weights
Dependent Variable'
Days Nbs,nt--P.,srti a
a no
.c.!.iti,,
_ik
.118
-.379
.=.75
.5.,
.6w.
-.6J
.667
.6/1
.71'
.72-
-.754
.
.770
.788
-.808
.819
.272 ,
.536
.624
.710
,
-.758
.801
:8,29
.014
.14'.
.226
.290
.365
.406
.445
.473
.5Q4
.529
.568
.593°
.621
.653
.670
.074
.390
.504
.575
.64?'
.687
-.01268:83994
.18218
.16665
-.09166
.2160
.23136
.28029
.23564'
-.23003
.25093
.26860
-2.11
=
.07498
-.34022
.28568
--33097'
-.32399
'.30357
.23189
Fitst Grade (1\1-105)
1 2104
3231
4596c
5471a
6462a
7 8
214855677a
9 10
11
453a
12
353a
'1(3
601c
14
585c
15
125
Third Grade (N=57)
1 2463a
3125
.4
114
5371a
6- 417a
7351a
F71 WRAT
Adult
iii ti
one 0111.1
.
Volunteer involved classroom manager,ent
Adult feedback to 0.11.41hi for behavior
Adults attentive t..)
large group
..
All positive behavior
Teacher without children
Practical skills acy(tsrtion
Law, group with aide math
Children attentive to adults, academic
Adult ret.ponds to child's question with a
question
,
Adult commands, requests, and directs cples- -
tions to groups of children, academic,,
A11 adult neutral corrective feedback
Child's extended response to .quest-ion
Two children with aide
F69 WRAT
All negative behavior
Two children-with aide math
One child ,independent
...,
Child extensive- response to adult open-
ended questions
.
- Childr6h attentive to adults[, academic
,Adult commands, -Pequests, and ,direetsques-
lions to groups of ch4ldrent nonacademic
A
At'first grade, foie of the.variables that entered the regressiont
are negatively correlated with absences. All fourof these usually repre-sent components of an'open, flexible classroom where children have the.
freedom to question and work independently. Three of these four showed.A level of significance in the partial correlation. .-
In the third grade, two variables shay& a, negative sign, and, as
in the first grade, these variables reflect'%n open kind of classroom,
one where children work independently and give elaborate rpsp'onses to
thought-provoking questions: On if,the two.was significantly correlated vin the partial correlation.
Summarya
As stated e.irlier in this paper, caution must be used when inter-
preting correlation data, and policy decisions should not be made on thebasis of these data. However, in this study, those correlations that
show a Level o.f significance at both the first and third grades would
appear tb have some indication of. instruC'tional processes that might be
related to absences. At the same time, one must remember that certain
instructional processes might be effective for first grades and not thirdgrades, as well as the reverse.
)
.Both first and third grades showed.a_significant correlation in
those variables that indicated that children worked independently and
the occurrence of adult feedback. With the increasing interest in in-.
dividuatized instruction in the Amer4kan school systems, these instruc-
tional variables might be investig'ated in future studies. 'Perhaps in-
dividualizition in, the classroom not only benefits the student academallolly
but decreases his' absences.
Even though this study is exploratory, the findings are strong enough
to raise an intense interest in this-srea. Future-.findings could aid
teachers in developing instructional.processes that would encourage chil-
dren to attend schodl and subsequently decrease absences, an effect that
would benefit all 'levels of the educational system.
a
21