Embed Size (px)
Citation preview

DOCUMENT RESUME
ED 303 280 RC 016 694
AUTHOR Freudenburg, William R.; McGinn, BarbaraTITLE Rural-Urban Differences in Environmental Concern: A
Closer Look.PUB DATE 87
NOTE 53p.; Revised version of a paper presented at theAnnual Meeting of the Rural Sociological Society(50th, Madison, WI, August 12-15, 1987). Some tablescontain small print.
PUB TYPE Speeches/Conference Papers (150) -- Reports -Research /Technical (143)
EDRS PRICE MF01/PC03 Plus Postage.DESCRIPTORS Agricultural Occupations; *Community Attitudes;
Community Surveys; *Conservation (Environment);Economic Development; Energy Occupations;Environmental Standards; Farmers; Land Use; LocalIssues; *Rural Areas; *Rural Urban Differences
IDENTIFIERS Colorado (West); *Environmental Attitudes;Environmental Protection
ABSTRACTThis paper presents survey results from rural areas
having significant levels of employment both in agriculture and inextraction industries (coal mining). Although a review of theliterature suggests that rural residents may express lower levels ofenvironmental concern than urban residents, one study proposed thatrural residents in farm-related industries might have differentattitudes than those in extractive industries. The survey includesitems dealing with specific local concerns over environmentalprotection and technological development. The data come from a studyof four communities in western Colorado that were facing the prospectof large scale development of coal and other fossil fuel energyresources. Aside from the issues of planning and zoning, farmers andranchers in this sample were more concerned about environmentalprotection than, persons in any other occupational category. The leastenvironmental concerns were expressed by persons in coal mining andrapidly growing business and professional occupations. Qualitativeinterviews with area residents suggest that persons in agriculturevalued environmental preservation in general, but were opposed toconstraints of land use that might prevent them from obtaining highprices from the sale of their land. This study concludes that peoplein agriculture express higher levels of concern for environmentalissues than do other rural persons living in the same community. Thepaper contains 71 references. (DP)
Reproductions supplied by EDRS are the best that can be madefrom the original document.
***********************************************************************

RURAL-I MBAN DIFFERENCES IN ENVIRONMENTAL CONCERN:
A CLOSER LOOK1
by
William R. Freudenburg
and
Barbara McGinn
Department of Rural Sociology
University of Wisconsin
1. This is a revised version of a paper prepared for presentation at the 50thAnnual Meeting of the Rural Sociological Society, Madison, WI, August, 1987.Comments, suggestions and additional sources of data would be greatly appreciated.
U.S. DEPARTMENT OF EDUCATIONOffice of Educational Research and Improvement
EDUCATIONAL RESOURCES INFORMATIONCENTER (ERIC)
0 This document has been reproduced asreceived from the person or organizationon ing itMinor changes have been made to improvereproduction quality,
POintSOI viewOr OprnionS stalechn Must:loco-men! do not necessarily represent officialOERI position or policy.
2
"PERMISSION TO REPRODUCE THISMATERIAL HAS BEEN GRA D BY
TO THE EDUCATIONAL RESO RCESINFORMATION CENTER (ERIC)."

ABSTRACT
The significance and validity of urban-rural disctinctions have long been the
focus of contention in sociology. The debate extends even to an area where there
appears to be reason to expect a difference, namely, in levels of environmental
concern. On average, rural residents live in physical environments that are less
heavily modified by human actions, depend more directly on employment in the
extraction or use of natural resources, and experience the kind of weakness in
local economies that may lead them to favor economic development even at the
expense of environmental protection. While past studies have found some support
for the expecwt.ion that rural residents would therefore express lower levels of en-
vironmental concern, several authors have found that what appear to be low levels
of "rural" environmental concern may actually be low levels of concern among
farmers in particular. Results also appear to be affected by methodological fac-
tors, including the degree to which survey items focus on local environmental con-
cerns, plus the need to separate the effects of living in polluted areas from the
effects of working for "polluting industries." This paper presents survey results
from rural areas having significant levels of employment both in agriculture and in
extraction (coal mining); the survey includes items dealing with specific local con-
cerns over environmental protection and technological development. Contrary to
earlier studies, our results show persons in agriculture to express higher levels of
concern than do other rural persons, who in this case live in the same communi-
ties. The results suggest that the widespread nature of high levels of support for
environmental protection may make it difficult to isolate occupational or residential
groups having "low" levels of environmental concern, in general, without careful
analysis of the specific aspects of development and preservation having the
greatest salience to the persons involved.

INTRODUCTION
One of the most long-lasting controversies in sociology, at least in the United States,
concerns the degree to which it is appropriate to conceive of "rural" social systems as
being conceptually and empirically distinct from urban ones. On one hand, a number of
authors argue that, whatever relevance the urban-rural distinction might once have had,
recent changes (such as the effects of the mass media and the extension to rural areas
of what were once "urban" conveniences) have led to the elimination of most of the
important differences (Fischer, 1972; Bealer et al., 1973; Van Es and Brown, 1974). On
the other hand, other authors point to remaining differnces in levels of economic
development (Dillmar. and Tremblay, 1977), control over resources (Lovejoy and
ICrannich, 1982), levels of interpersonal acquaintanceship (Freudenburg, 1986), and even
the rate of cultural change, as indexed for example by crime cycles (Fischer, 1980) as
warranting further attention (see also Lowe and Peek, 1974; Glenn ani Alston, 1974).
If differences between types of people can be expected to reflect at least in part
the "objective" differences between the places in which they live, then it would be
reasonable to expect that, if urban-rural differences are to be found anywhere, they
would appear in people's attitudes toward their physical environmental settings. Indeed,
Tremblay and Dunlap (1978: 476) report that there does appear to be a degree of corre-
lation between levels of environmental concern and the actual levels of pollution (see
also DeGroot, 1967; Dillman and Christenson, 1975). In addition to any "objective" dif-
ferences in the degree of exposure to environmental degradation, at least three other
reasons have been advanced for expecting rural residents to have lower levels of envi-
ronmental concern than persons in urban areas. One is that rural residents are more
likely to make direct or extractive use of the environment in their employment, while
urban residents are more likely to "use" the environment for appreciative or recreational
purposes (Hendee, 1969). Another is that the tenuous economic position of many rural
residents may lead them to be more likely to favor local economic growth over environ-
mental protection (Murdock and Schriner, 1977; cf. Molotch, 1976). Still another is that
4

- 2 -
socialization in a metropolitan environment is likely to lead people to see human activi-
ties as being responsible for creating environmental disruptions--but also as being
capable of correcting them (Lowe and Pinhey, 1982). Despite all of these plausible
arguments, however, the data to support the notion of urban-rural differences in levels
of environmental concern have been mixed.
In this paper, we attempt to summarize the existing literature on the topic and to
shed additional light on the question by taking a somewhat different approach. One of
the problems with the existing literature may be that rural people, like urban people,
are anything but homogeneous, and that it may thus be necessary to examine more
closely the people who make up the "rural" category (cf. Van Es and Brown, 1974).
Another may be a methodological factor. As Tremblay and Dunlap have shown, "studies
focusing on environmental problems at the state or national level tend to report negli-
gible relationships, while those focusing on problems at the local or community level
generally report substantial relationships (with rural residents less environmentally
concerned than urban residents)" (Tremblay and Dunlap, 1978: 474).
What appears to be missing from the literature to date, and what we attempt to
provide in this paper, is an analysis that deals with truly local environmental *problems
and challenges, and focusing more closely on the responses of the differing groups of
people who live in "rural" localities. A national survey, even if it includes a heavy
oversampling of rural residents, is forced to rely on relatively vague and generic issues
such as "the level of water pollution in your area." If we are truly to look at attitudes
toward "local" environmental issues, we need to realize that the specific environmental
issues that may be of concern to rural residents in Vermont are likely to be quite dif-
ferent from those that are of concern in West Virginia, the upper peninsula of Michi-
gan, the desert areas of Nevada, or even mountainous areas of Colorado or Washington
state, let alone the rural areas of other nations. The disaggregation of rural responses
is far short of being a panacea, in that the findings from one area may or may not be
5

- 3 -
generalizable to another, but given the lack of closure and clarity in the literature to
date, the time has clearly come for an in-depth focus on the "rural" residents of an
area that is smaller than the nation at large. Accordingly, after reviewing the liter-
ature that has accumulated to date, we will present an analysis of the results from a
study of four communities in western Colorado, all rural, and all facing the prospect of
a similar type of developmentrapid, large-scale development of energy resources.
Urban-Rural Differences in Environmental Concern: The Basic Literature
Studies of the relationships between environmental concern and residence (i.e.,
living in rural or urban locations) have long found mixed results. Milbraith's (1975)
study, for example revealed no differences in environmental concern between one county
that was highly industrial and another that was largely nonindustrial, partly wilderness,
and Lowe et al. (1980) also reported no rural-urban differences (see also Koenig, 1975).
On the other hand, at least some positive association between urban residence and level
of environmental concern has been reported by Althoff and Grieg (1977), Buttel and
Flinn (1978a, 1978b), and Van Liere and Dunlap (1981).
Studies explicitly considering the attitudes of the rural residents whc are farmers
have become increasingly important in this literature; indeed, considerable evidence
suggests that the mixed results may relate in part to the varying significance of
"farmers" in the rural samples. In their early surveys of farmers.and city dwellers,
Salcedo et al. (1971) found little direct relationship between rural-urban residence and
pesticide use, but they also found that Illinois farmers were more favorable toward the
pesticide industry than were nearby urban residents (see also Kronus and van Es,
1976:22). Buttel and Flinn (1974) explicitly conceptualized the relationship as being a
two-dimensional residence-and-occupational relationship. Their study found no apparent
zero-order relationship between an urban-rural variable and environmental concern, but
when rural residents were separated into farm and nonfarm segments, the rural farm
6

- 4 -
group was found to be much less concerned about environmental problems than either
the rural nonfarm group or the urban group. These results led Buttel and Flinn to
offer the suggestion, which has been followed in only some of the studies that have
been done since that time, that the rural-urban variable be dropped and that future
studies focus instead on farm-nonfarm differences in levels of environmental concern.
In their comprehensive review, Tremblay and Dunlap (1978) argued that the failure
of Buttel and Flinn to find significant differences between urban and rural residents
may have been related in part to methodical factors, specifically including a focus on
national or state-level concerns, rather than on community or local-level concerns.
Their examination of the available literature led Tremblay and Dunlap to conclude that
studies focusing on environmental problems at the state or national level (including the
Buttel and Flinn study) tended to find minor or negligible relationships, while those
focusing on local- or community-level environmental problems generally found that rural
respondents reported substantially lower levels of environmental concern than did urban
residents. Even so, the Marsh and Christenson (1977) report of higher support for en-
vironmental protection among the urban respondents does not clearly distinguish
between farmers and "rural" residents more generally, and even Tremblay and Dunlap
(1978) lend support to the Buttel and Flinn findings; the Tremblay and Dunlap data
showed rural farmers to rank lowest in levels of pollution concern, followed by rural
non-farmers, and then by urban residents.
Complicating the matter further, Lowe, Pinhey and Grimes (1980) reported that,
while rural respondents expressed less environmental concern than urban residents,
multivariate analyses showed that urbanism did not have significant independent effect
on environmental priority scores; using data from the National Opinion Research Center
(NORC) general social survey, Lowe and Pinhey (1982) concluded that socialization in a
metropolitan environment--not current residence in a rural or urban environmentwas
the factor having the greatest explanatory power. The Lowe and Pinhey data show that

5
the independent effect of being in an agricultural family was statistically significant,
while persons in other nature-exploitative occupations, such as miners and persons
working in polluting industries; were found to be no less likely to support environmental
protection than were those in non-exploitative occupations. In addition, persons whose
fathers were in agriculture showed slightly less support for environmental protection
than those whose fathers were in mining or other "polluting" industries.
These conclusions, however, have been called into question by Mohai and Twight
(1986), based on a national survey sponsored by the U.S. Soil Conservation Service and
conducted by Louis Harris and Associates. Unlike Lowe and his colleagues, Mohai and
Twight find no statistically (or substantively) significant effects of residence during age
of socialization (whether in farm, non-farm rural, urban, or metropolitan locations), but
like several earlier authors, they find a significant difference associated with employ-
ment of the head of household in farm or nonfarm occupations. This study also finds
no urban-rural differences once the effects of farm-nonfanl occupation (and residence)
are controlled. (As Mohai and Twight point out, the effects of farm residence may
differ from the effects of farm employment; a separate U.S. Department of Agriculture
study found that 70% of the persons residing on farms did not list farming as their
occupations, while 39% of the respondents who listed their occupations as farming did
not reside on a farmMohai and Twight, 1986: 7. In this case, however,both farmers
by residence and farmers by occupation showed significantly lower levels of environ-
mental concern than did persons in other categories, including nonfarm rural persons.)
Mohai and Twight also differ from many of the previous authors in this literature
in calling attention the large literature on farmers' consistent endorsement of "steward-
ship," noting that the apparent strength of this orientation among American farmers
would call into question the conclusion that the farmers have a disregard fdr the envi-
ronment. Mohai and Twight (1986: 15) see their data as indicating that farmers have "a
lack of perception of a threat" to the environment, perhaps not only because they live

- 6 -
in relatively unspoiled environments, but also because they see their occupation as
working with nature, not "exploiting" it. Perhaps farmers' direct experiences with na-
ture cause them to see i' as resilient and adaptable, and to see human activities as
contributing to natural productivity, not necessarily impairing it. Accordingly, Mohai
and Twight call for drawing a distinction between the nature-manipulative occupation of
farming and the other occupations that are often grouped together as nature-exploit-
ative, such as logging and mining. The results of the Mohai and Twight analysis, in
short, also indicate the need for closer attention to the differences that may exist
within the overall categories of "rural" people and occupations.
Overall, the accumulated findings seem to support the suggestion first put forward
by Buttel and Flinn more than a dozen years ago (1974)that urban-rural differences in
environmental concern, to the degree to which they can be said to exist at all, might
more accurately be seen as farm-nonfarm differences. The picture, however, is not
entirely clear; in addition, it is necessary to consider the possibility that what appear to
be urban-rural differences (or farm-nonfarm differences) in environmental concern could
actually prove to be due to sociodemographic or other underlying differences in the
populations in question, such as differences in age or sex.
The possibility of significant sociodemographic differences is reduced somewhat by
the high levels of support for environmental concern that continue to be found among
the U.S. national public. Although support for environmental protection has risen and
fallen to an extent over the years and is not always the first priority among the public
for allocation of government funds (Dunlap and Dillman, 1976), the support levels are
generally quite high. In fact, a number of national opinion polls indicate an increasing
percentage of the public feels that we are spending too little for environmental protec-
tion and that our laws do not "go far enough" (Dunlap, 1985). Such evidence has led
one study to conclude there is "no broad-based opposition to the idea of environmental
protection" (Lowe, Pinhey, and Grimes, 1980: 41) and another to add that "environmental

- 7 -
consciousness has 'trickled down,' i.e. that support for environmental reforms has now
diffused well below the stratification position occupied by the core environmentalists,
and that there is neither a clear, nor consistent pattern of support" for the assertion
that environmental concern is limited to elites (Morrison, 1986: 189).
Even so, the search for predictable patterns of support for the environment among
specific social and demographic groups continues to be a major focus of the literature.
In their review of studies done up to that time, Van Liere and Dunlap (1980) concluded
that "age, education and political ideology are consistently (albeit moderately) associated
with environmental concern, and thus we have confidence in concluding that younger,
well-educated, and politically liberal persons tend to be more concerned about environ-
mental quality than their older, less educated, and politically conservative counterparts"
(p. 192). Weaker and less consistent correlations have been reported for political party
identification and occupation. Democrats exhibit significatly greater concern for envi-
ronmental problems than Republicans, at least among political elites and the college edu-
cated. Business, technologically dependent and nature-exploitative occupations' may be
negatively associated with environmental concern, although there has been little empiri-
cal testing of these,occupational assocatic.as. To the extent permitted by the available
data set, all of the above factors will be assessed and controlled in the analyses that
follow.
In addition, a closer examination of existing literature suggests there may be a
need to devote closer attention to three concerns in the measurement of occupational
status that have sometimes not been considered explicitly in past workthe potential
for confounding "nature-exploitative" occupations with exposure to degraded environ-
ments, the need to consider "growth machine" occupations, and the potential for
differences between farming and ranching, which are in many ways dissindlar
occupations even if both are "agricultural." We will discuss each of these three
considerations briefly before moving on to a discussion of the findings.

Nature-exploitative occupations uKiicLsIs42o1 h ical envir nrnents.
Lower levels of exposure to environmental degradation and a higher tendency to depend
economically on the direct extraction of environmental resources were the two primal),
reasons identified by Tremblay and Dunlap (1978) for expecting rural residents to have
lower levels of environmental concern than urban residents. It may not be necessary to
disentangle the effects of these two factors when one is examinit% overall urban-rural
differences in orientations, but if one is attempting to compare different categories of
nature-extractive occupations, it obviously becomes necessary to distinguish between the
effects of polluting employment and the effects of living in environments that are more
or less polluted. It is all too plausible, unfortunately, that a substantial portion of the
persons working in agriculture could be living in areas that are predominantly
Igricultural and relatively "unspoiled," while substantial portions of those working in
mining, oil development, etc., would live in areas that are more heavily industrialized
and more heavily altered by the effects of the very industries that provide employment
to the workers being interviewed. In a national or even a statewide survey, therefore,
it can be difficult if not impossible to determine whether any differences in attitudes
between persons working in agriculture and those working in other nature-extractive
occupations would be due to their occupations or to their environmental settings.
This difficulty is overcome by use of the present data set. As a number of
previous authors have pointed out (e.g. Mohai and Twight, 1986; Tremblay and Dunlap,
1978), one of the occupations most clearly representing not only a direst use but also a
depletion of nature would be mining. The coal being developed in these study commun-
ities within the past decade has been known to exist for the better part of a century,
and each of the study communities has been surrounded by ongoing coal mining activi-
ties nearby for most of that extended time period. This makes possible a direct com-
parison between persons in what Mohai andiNvight call nature-extractive and nature-
manipulative occupations, doing so where the persons in both sets of occupations work

in the same communities and live in the same environmental settings. Indeed, direct
firsthand fieldwork in the study communities (see [identifying reference]) indicates that
the agricultural and the mining workeia in these study communities had generally similar
recreational and even cultural patterns, and in a number of cases the miners themselves
were the offspring or tne siblings of persons who were still working in agriculture in
the same communities. A number of the miners also indicated that one of the reasons
for seeking employment in raining is that it allowed them to continue enjoying the envi-
ronmental amenitiesof the area. The analyses below, a .ordingly, will separate out
the responses of persons in households headed by persons employed in coalmining.
Growth-Machine Orientation. As Murdock and Schriner (1977) noted, another of
tin reasons for expecting rural residents to express lower levels of environmental con-
cern may be that relatively weak economies may cause them to emphasize economic de-
velopment even at the expense of environmental protection. On the other hand, as
Molotch's discussion of the growth machine concept (1976) notes that not all residents
of a community would normally be expected to adhere to the same degree to a pro-
growth orientation. In particular, persons who are directly involved in local businesses,
and who therefore stand to have significantly more to gain than most from the presert'e
of additional customers in a community might be expected to be some of the most vocal
proponents of the growth machine orientation. Again here, one of the advantages of a
locally focused data set is that it allows us to focus on the relatively specific subset of
the population potentially having the most to gain from development. In the analyses
below, accordingly, we will also focus on responses from households headed by persons
employed in a growth-related business or technical profession such as engineering.
Farming and Ranching. These communities contained a number of households en-
gaged not only in farming (defined here simply as the raising of crops, ranging from
apples to wheat) but also a number engaged in ranching (defined here, as by the
persons involved, as the raising of livestock, principally cattle and sheep). As Gold
1.2A . .

- 10 -
(1974), in particular, has pointed out, the ranchers in western U.S. communities faced by
energy development may have been more negatively affected by such developments than
other community residents, and thus might be expected to have more negative attitudes
toward such development (see also Freudenburg, 1979, 1982). Partly because some of
the common complaints relate specifically to ranching rather than farming (e.g., the
-difficulties created when new residents of an area leave gates open, allowing livestock
to scatter Ov.:1' an area that literally covers many square miles), partly because ranching
may involve less "manipulation" of the physical environment than does farming (the
animals themselves do most of the "manipulating" when they graze), and partly because
most of the literature to date appears to have focused on what we are here calling
"farming" rather than "ranching," our analyses below will also present the results for
ranchers separately from those for farmers.
DATA
As noted above, the data for this paper come from a study of four communities in
western Colorado that were all facing the prospect of large-scale development of coal
and other fossil-fuel energy resources. In three of the communities, relatively little
development had taken place at the time when the study's survey was performed, and
the dramatic decline in energy prices during the 1980s has meant that the prospects for
such development seem to have declined significantly today, although the issue was a
very lively one at the time of the survey. Irn the fourth community, the issue of energy
development was even more pronounced, because significant energy-related growth was
already beginning to take place at the time of the survey, although this fourth commun-
ity has,since suffered a substantial' decline in population and economic vitality as the
"bust" in energy development has been experienced firsthand. All four communities were
distinctly nonmetr having populations between one and seven thousand persons
even when persons .g in the surrounding countryside were included; all were well-

removed from interstate highways, and all were well over a hundred miles away from
the nearest, metropolitan area. Given the significant growth that was already taking
place in one of these communities, however, we will include a dummy (0-1) variable for
"boomtown residence" in each of the analyses to be summarized below. In all four
communities, interviewers covered a significant range of truly rural territory (generally
extending roughly half the distance to the next community in any direction, up to a
limit of twenty miles, thus including farmers and ranchers in the sample in numbers
that, while smaller than ideal, still permit statistical analysis?
Our analysis has proceeded in several stages. First, we have examined the
questionnaire from the original study to identify the items having the greatest face
validity as indicators of environmental concern, paying particular attention to the
advantages provided by a data set that focuses closely on a set of specific rural
localities. Second, we subjected these items to a series of factor analyses, which
identified four subsets of items that grouped together consistently, even when different
methods were used for identifying and rotating the factors. Next, the factor score
coefficients from these factor analyses were used to construct a set of four scales that
have been subjected to further, multivariate analysis. The following discussion will
describe each of these three steps in greater detail.
Selection of Controls and Dependent Variable Items
The use of a data set that is more focused in its locality and rurality than in most
previous analyses also makes possible the use of a more focused and fine-grained
analysis in terms of occupational groups, thus permitting a closer examination of some
of the underlying conceptual issues. Given that the occupation of a head of household
could be expected to exert a significant influence over the orientations toward environ-
mental protection and/or the regulation of technology of other adults in the household,
14

- 12 -
we will follow the practice of Tremblay and Dunlap (1978) and others of categorizing
respondents in terms of the occupation of the household head.
The selection of items to form the dependent variable of "environmental concern"
entails a good deal more complexity. One of the first difficulties, as already noted, is
that concern over environmental issues and support for environmental protection are
both so widespread, at least in the contemporary United States, that scales will tend to
show virtually all respondents as having "high" levels of environmental concern/support.
Another problem is that the situation calls for close attention to the task ofoperation-
alization, but that past research efforts have approached the operationalization of "envi-
ronmental concern" in a number ofdifferent ways.
Perhaps the approach that is most straightforward, at least on the surface, is to
ask people how worried or upset they are about a series of environmental problems,
whether on the local or national level (see e.g. Constantine and Hanf, 1972; McEvoy,
1972; Dunlap et al., 1974; Milbraith, 1975). Other approaches strive for greater con-
creteness and specificity by asking respondents to weigh tradeoffs, sometimes implicitly,
e.g. by asking whether the country ought to spend more or less money on environmental
protection (Dillman and Christenson, 1972; Erskine, 1974; Dunlap and Dillman, 1976; Lowe
et al., 1980; Mohai and Twight, 1986), and at other times asking for explict tradeoffs of
environmental protection against increased employment or industrial development (Sharma
et al., 1975; Marsh and Christenson, 1977; Butte] and Flinn, 1976a; Mohai and Twight,
1986). Still other authors have taken the opposite approach, measuring agreement with
items that are more abstract rather than more concrete, such as the belief that
"Mankind was created to rule over the rest of nature," or that "The earth is like a
spaceship with only limited room and resources" (Dunlap and Van Liere, 1978: 13).
To some extent, this multiplicity ofapproaches may reflect the inherent difficulty
of attempting to measure a variable that is intended, in the words of Van Liere and
Dunlap (1981:668), to represent "a fairly broad concept." As Neiman and Loveridge

- 13 -
(1981:761) have pointed out, however, the broad or global nature of the variable can
create problems in "assessing the correlates of support for environmental protection
when it is measured at a very abstract, hypothetical level rather than in the context of
specific real proposals affecting those people beingstudied." The present paper's
approach, because its community-specific approach allows it to focus on the very kinds
of "specific real proposals" advocated by Neiman and Loveridge, should be less subject
to such problems than the more "abstract, hypothetical" approach.
On the other hand, one of the apparent reasons for taking the more abstract ap-
proach, as Van Liere and Dunlap (1981) have noted, is that as we become more sophis-
ticated in our ability both to create and to detect environmental pollution, "new" issues
rise to awareness, and many of them need to be added to the more specific environ-
mental concern scales if those scales are to measure the concerns that are salient at
the time of the survey. This continues to be true. One or two decades ago, a "typical"
scale might have focused exclusively on air and water pollution; current scales would be
more likely to include ground water contamination, toxics in the workplace, the disposal
of radioactive wastes, the creation of genetically engineered organisms, the loss of
genetic variability through the destruction of tropical rain forests, and so forth.
In short, there appears to be no one "best" way to measure environmental concern,
and neither does it appear likely that the field is on the verge of developing any such
definitive index. The absence of a "preferred" approach, however, clearly does not make
it advisable for researchers to take a casual or lax approach to the operationalization of
the concept. While it may be that "environmental concern" is sufficiently broad to be
measured successfully in a variety of ways, it may also be that one approach to oper-
ationalization will lead to different results than will another. It is definitely the case
that researchers on given study need to be both clear and explicit in describing their
scale(s) and methods if other researchers are to be able to replicate their findings- -
making it possible for the field as a whole to move forward in a cumulative fashion.
:16

- 14 -
The questionnaire from the present study is sufficiently extensive that it is possi-
ble to find items paralleling those used in many, if not most, of the previously published
studies. Rather than simply selecting any one such approach as being somehow superior
to the others, however, we have decided instead to start with all of the items having
face validity as measures of environmental concern under one or more of the approaches
employed in previms studies, subjecting these items to a series of factor analyses and
using for our further analysis only the most robust of the scales so identified. The
specifics of this approach will be spelled out in greater detail in the following section.
The Factor Analyses
We began with a set of 40 items having the desired face validity; these items were
subjected to a set of roughly 200 factor analyses, using a variety of rotation, factoring
and weighting techniques. Over the course of our analyses, we consistently found a set
of four factors to emerge, and with the deletion of the items having the lowest loadings
on these four factors, the results became even clearer and more directly interpretable.
For our final analysis, generating the scales to be analyzed in the present paper,
we selected a four-factor solution generated by the use of principal component analysis
and equamax rotation, where all four factors have Eigenvalues over 1.0, all are clearly
interpretable, all variables have factor loadings above .50, and only four of the 22 vari-
ables have loadings of .30 or greater on the factors on which they are not included
(with none of these non-included loadings being as high as .40). The greatest weakness
of the scales so identified is that nonresponses to certain items lead to a significant
number of missing cases for some of the scales, a problem to which we will respond by
reporting two sets of analyses below, one with the missing cases excluded from the
analysis, and the other with the missing cases recoded to the means of the specific
items involved. The final set of rotated factor 'loadings is reported in Table 1.
TABLE 1 ABOUT HERE

- 15 -
The full sets of items for the factor-analyzed scales are reported in the appendix,
but briefly, the four factors can be described as follows. The first factor consists of
items measuring respondents' orientations toward the energy developments already
occurring in their communities; an example would be provided by agreement with the
item, "If significant development takes place, the people around here will benefit (for
example, from increased employment and an expanded tax base) more than suffer (from
damage to the environment or our way of life)." The second set of items all measure
levels of distrust toward the industries and companies actually carrying out the
development. Examples include The coal companies have no compassion for our land,
air, and water quality; all they will do is what's required by law," and "There is a lot
of effort going on by coal, power, and construction companies, to try to bluff, coerce,
and even intimidate local residents into doing their bidding" (lobes and Parsons, 1975).
The third set of items, by contrast, appears to reflect a general distaste for regu-
lation of ind!strial and economic activity. Examples include, "None of us has the right
to interfere with the Nation's need for western coal," or "One person's right to a clean
environment is not as important as another's right to gainful employment." The fourth
and final set of items measures attitudes toward zoning and land-use planning. This
scale includes items measuring the respondent's own orientation and the perceived orien-
tations of "most of the people around here" toward zoning, plus an agree/disagree item
holding that "A person who owns land ought to be able to do what he pleases with it."
All four of the scales were found to have good reliability, as measured by the
coefficient alpha. With missing data removed from the analyses, the four scales had
alphas of .759, .748, .685, and .621, respectively. With the missing data recoded to the
means of each of the items involved, the alphas were comparable in magnitude, at the
values of .713, .738, .679 and .607, respectively.
As noted above, these scales contain a number of items having similarity to those
employed in prior scales. Perhaps the approach from previous work that is least well
18

- 16
represented in the resultant four scales is the approach recommended to the authors by
Riley Dunlap (1987) in a personal communication. As Dr. Dunlap noted, each of the
four scales represents one aspect or another of the respondent's orientation toward the
environmental and developmental issues that were most salient in the area at the time
of the survey. He suggests that, perhaps partly as a consequence of this focus, none of
the four scales could be said to represent "overall" environmentalism or environmental
concern. On the other hand, we have also considered carefully the arguments of others,
such as the the Neiman and Loveridge (1981: 761) admonition on the need to focus on
"specific, real proposals affecting those people being studied." Overall, and particularly
given our earlier discussion of the need for greater specificity in operationaiizing "envi-
ronmental concern," we see the specificity of our scale items as offering more of an
advantage than a disadvantage.3 The larger issue, as we and others have noted, may
be that very breadth of the "environmental concern" concept may have limited cumu-
lative advancement in this area to date; at a miniumum, the concept is so broad that it
has at least the potential of including several relatively distinct factors, rather than
being "one thing." In the words of Van Liere and Dunlap (1981: 670), "further research
is needed to establish clearly the 'boundaries' of the concept of environmental concern."
Extensive factor analyses of items that have been designed around the specific environ-
mental and developmental concerns of given communities would surely qualify as being
among the research that is required.
In an effort to respond more directly to Dr. Dunlap's concerns, however, the
following section of this paper will present the results of analyses that include not only
the four scales just described, but also the one item in the questionnaire taking the
most straightforward approach to measuring environmental concern. This item, following
the format of Andrews and Withey (1976), asks respondents to indicate on a 1-7 scale
(where 1= "terrible" and 7 = "delighted), "How do you feel about the condition of the
local natural environment--the air, land, and water in this area?" This item, while

- 17 -
included in the majority of the 200 factor analyses summarized above, failed consistently
to load with other items. This fact that may be taken to indicate either that the more
specific scales measure constructs that differ at least somewhat from "overall" environ-
mental concern or that previous authors have been wise in urging caution in interpret-
ing "overall" concern and in stressing a more careful analysis of the various components
that make up the overall concept. The empirical reason for the failure of this item to
load with any of the other scales, incidentally, was quickly revealed by an examination
of the correlation matrix: only one of the 22 items that emerged from the factor anal-
ysis as making up the four scales has a correlation with this additional item that ex-
ceeds .20.4 Nevertheless, given the importance of this approach to measuring environ-
mental concern, in at least a subset of the existing literature, and given also the
straightforward nature of this single item, the analyses below will report the results
for this single item along with the results from the four scales.
Multivariate analyses of Resultant Scales.
Like previous researchers who have looked at national or statewide data sets, and
also like those who have looked at other communities in the rural West (Murdock and
Leistritz, 1979; Thompson and Blevins, 1983), we find high levels of overall concern for
environmental quality. While respondents also express strong support for economic
development, as will be noted below, there are no indications in this data set that they
support economic development at the expense of environmental protection. For example,
on an item asserting that "one person's right to a clean environment is not as important
as another's right to gainful employment," only 21.2% agreed, while just over 60%
disagreed. Other items showed similar patterns.
The primary focus of this paper, however, has to do with the effects of agri-
cultural occupations on the levels of environmental concern. We have chosen to analyze
the occupational differences by using multiple classification analysis (MCA) because it

- 18 -
permits tne simultaneous use of categorical variables, such as occupational category and
religious affiliation, along with interval-level variables such as years of residence in the
community and dummy (0-1) variables such as whether or not a respondent lives in the
growing community or belongs to a church, all in a regression-type format. Because the
MCA feature in the SPSS-X program available to us allows for only a limited number of
variables to be included in each analysis, the tables that follow will provide information
on a varying set of independent or explanatory variables. We have analyzed each of the
dependent variables using the full set of explanatory variables, although this has
required additional computer runs in each case; for the tables that follow, we have then
chosen the subset of variables having the greatest effects. As will be seen, the
"greatest" effects are relative; in most cases, only a minority of the explanatory
variables achieve statistical significance. Even so, we will report as many of the
"greatest" effects as allowed in each case, given the number of occasions on which
colleagues reading earlier drafts of this paper have expressed an interest in seeing
statistical controls for the effects of many of the variables involved.5
A word about missing data is also in order. As noted above, this was a drop-off,
pick-up questionnaire, meaning that the respondents themselves filled it out. Not
surprisingly, there were a number of items that some respondents did not fill out, often
presumably because they felt the question did not apply to them or because they were
unsure of the answer. The highest levels of nonresponse, by far, were found on the
item measuring religious denomination, which was left blank by 216 of the 595 respond-
ents; over 80 respondents failed to provide responses on their fathers' and/or mothers'
levels of education. Clearly, such a large number of missing cases could provide sig-
nificant problems for an analysis that includes these specific items, as our analyses do.
On the other hand, except for the large number of missing cases for religious denomina-
tion, the pattern of missing data appears to be reasonably random, with minor excep-
tions that will be noted below, meaning that the cases having missing data on one or
- 19 -
more items generally should have little effect other than to lower the proportion of
variance explained so long as the missing data are recoded in a way that does not
distort the overall patterns. To provide readers with the highest reasonable level of
relevant data, accordingly, each of the next five tables will be presented in two forms
once with listwise deletion of missing data, and the other with the missing-data cases
included, but with the missing data recoded to means (for interval-level data) or to a
special "missing/other" category for categorical data. As will be seen, the changes in
Ns (and sometimes in the proportion of variance explained) are significant, but the
changes in coefficients and interpretations generally are not.
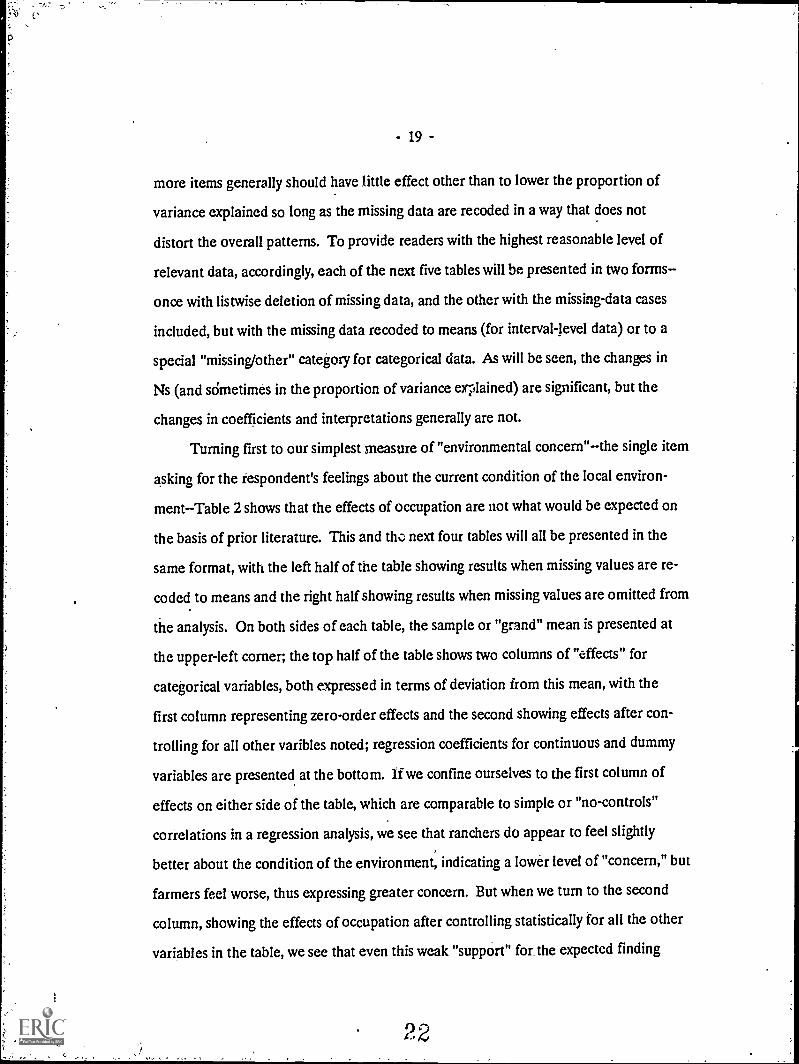
Turning first to our simplest measure of "environmental concern"the single item
asking for the respondent's feelings about the current condition of the local environ-
mentTable 2 shows that the effects of occupation are not what would be expected on
the basis of prior literature. This and the next four tables will all be presented in the
same format, with the left half of the table showing results when missing values are re-
coded to means and the right half showing results when missing values are omitted from
the analysis. On both sides of each table, the sample or "grand" mean is presented at
the upper-left corner; the top half of the table shows two columns of "effects" for
categorical variables, both expressed in terms of deviation from this mean, with the
first column representing zero-order effects and the second showing effects after con-
trolling for all other varibles noted; regression coefficients for continuous and dummy
variables are presented at the bottom. If we confine ourselves to the first column of
effects on either side of the table, which are comparable to simple or "no-controls"
correlations in a regression analysis, we see that ranchers do appear to feel slightly
better about the condition of the environment, indicating a lower level of "concern," but
farmers feel worse, thus expressing greater concern. But when we turn to the second
column, showing the effects of occupation after controlling statistically for all the other
variables in the table, we see that even this weak "support" for the expected finding
22

20 -
(i.e., that at least some agriculturalists will have low levels of concern about local envi-
ronmental conditions) is not sustained. After other factors are controlled, farmers
clearly feel worse about the condition of the local environment than an other occupa-
tional group, while persons in businesses/professions and in coal mining, who might be
expected to have more to gain financially from further development, feel better; ranch-
ers and persons in the "other" category are roughly at the group mean. The overall
effect of occupation is clearly significant in the analysis that excludes missing cases (p
< .02) but achieves only a substandard level of statistical significance (p < .20) the
analysis'that includes the recoded missing values. Religious denomination is marginally
significant in both analyses summarized in Table 2, although the large number of missing
cases on this variable means that the two sides of the table suggest slightly different
conclusions for some denominations. Residence in the boomtown and higher levels of
income were both associated with significantly lower levels of perceived environmental
quality. Overall, the analysis that excludes missing cases explains 26.6% of the variance,
while the analysis that includes the recoded missing cases explains a lower 14.4% of the
variance.
TABLE 2 ABOUT HERE
As noted above, our own judgment is that the four factor-analyzed scales are
deserving of greater confidence than this individual item. Each of the four scales,
however, also fails to show the expected occupational effects; in no case do the farmers
or ranchers show significantly lower levels of concern than the community mean; in
fact, both the farmers and the ranchers show higher-than-average levels of environ-
mental concern on three of the four scalesand these results hold whether missing
cases are recoded to means or excluded from the analysis. In the case of the scale
showing support for local development (Table 3), both farmers and ranchers show levels
of support that are lower than the mean, once other variables are controlled, with the
overall effects of occupation being clearly significant statistically, whether missing data

- 21 -
are excluded or recoded to the means. Indeed, farmers show the lowest level of support
for any occupational group, whatever the fate of cases involving missing data, while
ranchers show the second-lowest level of support in the analysis including missing data
and narrowly miss the second-lowest status in the analysis excluding cases that have
missing data. Most other variables had only insignificant effects, although persons
whose mothers had high levels of education and who were judged by interviewers to
have high levels of cognitive capacity expressed significantly tower levels of support for
local development, as didpersons living in the boomtown (in the analysis that excludes. .
missing data) and those in lower age brackets (in the analysis including missing values
recoded to the means). The findings with respect to religious denomination again
depend on whether the numerous missing cases on this variable are excluded from the
analysis or recoded to the means; the overall analyses explain 12.0% and 23.0% of the
variance, respectively, when missing values are recoded or excluded from consideration.6
TABLE 3 ABOUT HERE
Table 4 also fails to show low levels of environmental concern among persons in
agriculture. Both farmers and ranchers show higher-than-average levels of distrust of
industry, with the effect of occupational category again being statistically significant
whether the missing values are recociod to means or excluded from the analysis. Again
in this table, farmers express the highest levels of distrust of industry, whether missing
data are recoded or excluded from the analysis, while ranchers show the second-highest
levels in the analysis that recodes missing data and come in a close third in the anal-
ysis that exclude;; missing data. The effect of occupational category is clearly signifi-
cant in both analyses. Self-identified Republicans and older persons show lower levels
of distrust of industry in the analysis that includes recoded missing values, although
both effects fall short of statistical significance in the analysis that excludes the
missing values from the analysis. Persons identifying urban areas as the places they
had lived that they had "enjoyed the most" show the greatest levels of mistrust of in-
24

- 22 -
dustry while those who had most enjoyed small towns show the lowest levels on that
item, although this variable achieves statistical significance only for the analysis that
exiuces the missing data. The two MCAs explain 12.3% and 18.5% of the variance,
respectively, in the analyses that recode and exclude the missing data.
TABLE 4 ABOUT HERE
Table 5 shows that both ranchers and farmers express lower levels of opposition to
governmental regulations for environmental protection than do other community resi-
dents, with the effects of occupational category being statistically significant in the
analysis that includes recoded missing values (p < .02), but not in the analysis that
excludes all missing values from consideration. The agriculturalists rank first and
second in expressing low levels of opposition in both analyses, although their rankings
with respect to each other are switched between the two. The table shows higher lev-
els of opposition to governmental regulations among persons who report Republican
party affiliation, are older, have lower levels of education, and have fathers who were
high school graduates (and trade-school graduates, in the case of the analysis that
excludes missing values). The MCAs explain 24.1% and 20.8% of the variance, respec-
tively, when missing data are recoded to means or dropped from the analysis.
TAM' E 5 ABOUT HERE
It is only when we turn to the fourth and final scale, which measures attitudes
toward local planning and zoning, that we see something like support for the exectation
that farmers and ranchers will be low in environmental concern. As can be seen from
Table 6, this scale indicates there may be low levels of support for planning and zoning
among ranchers, but not farmers, when missing data are excluded from the analysis--but
the effect is clearly nonsignificant (p > .9). If missing data are recoded to means, and
if we accept a substandard level of statistical significance (p ii .10, with a sample size
of 595), we begin to approach a significant finding in the "expected" direction, with
ranchers and farmers expressing a level of support for planning and zoning that is

- 23 -
slightly lower than the community mean. Persons judged by interviewers to have higher
levels of cognitive capacity and lower levels of interest and helpfulness toward the
survey show higher levels of support for planning and zoning; the two MCAs explain
9.1% and 153% of the variance, respectively, across the two analyses.
TABLE 6 ABOUT HERE
DISCUSSION
Although the magnitudes and the levels of significance vary across tables, the
farmers and ranchers in this sample generally do nal express lower levels of environ-
mental concern than the other persons in the same communities. Indeed, if we set
aside for the moment the issue of planning and zoning, th.:. zgr:::::lturalists in this
sample would need to be seen as more concerned about environmental protection than
persons in any other occupational category. Tables 2 - 5 can be seen as providing
eight "tests" of environmental concernfour measures of concern, with two ways of
dealing with missing data in each table. The two groups of agriculturalists rank first
and second in four of the eight tests, ranking first and third in the other fourand in
each of the other four tests, the ranchers miss a second -place ranking by less than
three-tenths of a point. In all tight of these tests, the lowest levels of environmental
concern are found instead among persons in coal mining and in growth-related busi-
ness/professional occupations, as would be expected from a "growth machine" perspective
(Molotch, 1976; Logan and Molotch, 1987).
The results of our analysis thus support the Mohai- Twight argument that farmers
arc not anti-environmental in their orientation, as well as supporting the Tremblay-
Dunlap argument that there is a need to include a focus on local as well as more
generic environmental concerns. In all other respects, however, the results of this more
fine-grained analysis run counter to, li;ther than extending, the existing literature on
levels of environmental concern among persons in agriculture. When the farmers and

- 24 -
the ranchers in this sample are compared with other rural residents from the same
communities--thus providing a degree of statistical "control" for residence that is far
greater than has appeared in this literature to datethese persons employed in
agriculture actually prove to be more concerned about environmental protection, in
general; than do the other residents of the same communities. The one possible
exception appears to concern attitudes toward land-use planning and zoning.
A likely reason for this potential exception is suggested by qualitative interviews
with area residents (summarized in [identifying reference]). The persons engaged in
agriculture in these study communities were sometimes in tight financial situations, and
some of them considered it vital for their survival that they maintain the ability to sell
their land for the higher prices that residential development could bring. Given that
"zoning," in these communities, often referred specifically to the zoning of rural areas
with the intention of "preserving agricultural land," it is easy to understand how
persons who were in agriculture could value environmental preservation in general, but
still express at least some opposition to the idea of land-use constraints that might
prevent them from obtaining high prices from the sale of their land. Previous literature
(e.g. Nellis, 1980; Bultena et al., 1982) lends additional credibility to this interpretation.
Given that the clear preponderance of our findings is so directly contradictory to
what would have been expected on the basis of prior literature, and given as well the
modest size of the sample, there is a need to ask whether this particular group of
farmers and ranchers might be highly unusual. Few direct tests of this possibility are
available to us, but it is possible to examine at least the political orientation of the
agriculturalists in this sample.
As noted above, previous studies in the U.S. have tended to identify political
orientation as one significant correlate of environmental concern, with Republicans
tending to express lower levels of concern than Democrats. This tendency appears to
hold both among Congressional personnel (Dunlap and Gale, 1974; Dunlap and Allen,

25
1976) and among members of the general public (Dunlap, 1975; Mitchell, 1979; Tognacci
et al., 1972), although Buttel and his colleagues have reported less clear-cut findings
(Buttel, 1975; Buttel and Flinn, 1976b; Buttel and Johnson, 1977). While the primary
focus of this article is on the effects ofagricultural occupation rather than on the
effect-of political affiliation, a re-examination of Tables 2 - 6 suggests an intriguing
line of potential explanation for the differences among prior findings, particularly when
one recalls our earlier discussion on the importance of careful operationalization of the
"environmental concern" concept. On the single item summarized in Table 2 and on two
of the four scales summarized in Tables 3 - 6, self-identified Republicans in this sample
sometimes but not always showed lower levels of environmental concern than did self-
identified Democrats. Differences were found on the scales measuring mistrust of
industry and opposition to governmental regulationissues on which the two major
parties may be more likely to differ than in the case of the remaining two scales, which
measure support for local development and for planning and zoning.
To examine the question of whether the agriculturalists in this sample might
somehow possess unusually pro-environmental values, it is instructive to consider the
findings in Table 7. Independent of the fact that the MCAs reported above all
contolled statistically for the effects of party affiliation, political orientation does not
appear to provide an explanation for the unexpected findings in this study. As can be
seen, the farmers and ranchers in this sample actually are somewhat "more Republican"
than the persons who make up the remainder of the sampleand the overall sample, like
the communities froin which it is drawn, leans more heavily themselves in the Republi-
can direction than did the nation as a whole at the time of this survey.
TABLE 7 ABOUT HERE
Despite,tho straightforward finding that the farmers and ranchers in this sample
were neither "rnore Democratic" nor "more independent" than the other persons in this
rural sample, the study's findings still clearly need to be interpreted with caution. As

- 26 -
noted above, the data come from a single set of communities that were facing generally
comparable scenarios for environmental change. Different places and times might have
presented issues and concerns that would lead to different distributions of findings. In
particular, we have been able to identify two factors that might have had some degree
of influence upon our findings. First, development in at least the "boomtown" of the
current sample was associated with certain levels of social disruption (see [identifying
references]) and even persons in the comparison communities may have become sensi-
tized to concerns about large-scale energy development from thediscussions of boom-
town problems that were beginning to appear in the regional media at the time when
this study's survey data were being collected. It is not clear how or why the potential
for boomtown disruptions might have affected agriculturalists more than persons in
other occupations, but the possibility cannot be ruled out by using this data set alone.
Second, at least some literature suggests that large-scale energy development of the sort
being considered in the present communities may have the potential to lead to changes
in the cultural status of agriculturalists, who might lose at least some of the recogni-
tion they had previously enjoyed by providing a key economic base in their communities
(Gold, 1974; Freudenburg, 1979).
It also appears, however, that it is appropriate to add emphasis to the observation
of Mohai and 'Night (1986) that farmeis may indeed have a significant level of concern
for the environment. At least in this locality-focused sample, in fact, it has proved to
be impossible to attribute the "low" levels of environmental concern among rural
residents in some previous studies to the markedly low levels of concern among farmers.
After controlling for location and operationalizing "environmental concern" in a way
that focuses on issues that were indeed of local concern, the present study has found
farmers to have levels of concern over environmental issues and of support for environ-
mental regulation that are consistently among the highest. not the lowest, of those for

- 27 -
anyoccupationallfoups in the communities involved. This finding holds across several
differing measures of environmental concern.
At the same time, it is also important to maintain a certain level of skepticism
about farmers' (or any other groups') propensity to express abstract support for "stew-
ardship" or other environmental principles, particularly if actual behaviors fail to reflect
similar levels of support for such principles in more concrete form. Research on the
relationship between attitudes and behaviors indicates that correlations tend to be lower
in cases where the attitudes considered are broad ones but the behaviors of interest are
more specific (Ajzen and Fishbein, 1977; Hebedein and Black, 1976); it appears likely
that the same logic would tend to hold when examining the stated attitudes of specific
groups, be they farmers or corporations. Indeed, given the consistently high levels of
support for environmental protection that continue to be found among the public at
large (Dunlap, 1985), it would appear that even those who are creating significant levels
of pollutionor perhaps especially such actorswould find it in their interest to project
a public image of concern for the environment even in cases where their actual
behaviors suggested little such concern.? Similarly, policymakers whose pragmatic
actions tend to be damaging to the environment might find it to be helpful in defusing
potential opposition if they were to proclaim themselves publicly as "environmentalists,"
particularly if they were able to offer at least some examples of their environmental
concern that were high in symboloic value without imposing significant constraints on
the economic interests that are of particular concern to the policymakers. (One current
example is provided by elected officials from timber-producing regions who have taken a
lead role in drawing attention to the problems of deforestation in the Amazon basin.)
Expressions of support for "stewardship," in short, may or may not reflect the kind of
concern for the environment that will translate into specific environmentally helpful
behaviors--just as "abstract, hypothetical" statements of environmental concern may

- 28 -
sometimes offer lower discriminatory power than a focus on "specific real proposals"
(Neiman and Loveridge, 1981:761).
Overall, it appears that future studies of environmental concern will need to
devote continued attention to methodological factors. In particular, when one attempts
to operationalize a concept as complex as "environmental concern," either a broad and
global approach or. one that focuses on the specific issues of local salience is likely to
involve a mixture of advantages and disadvantages. For understanding the differences
between persons in agriculture and other persons in rural areas, we have argued, it may
be preferable to focus on relatively specific and explicitly local concerns. In the case
of national samples, a more global measure may still prove to be superior. In either in-
stance, however, we need to measure environmental concern in a way that is approp-
riately inclusive yet at the same time appropriately precise. In short, methods do
matter; in the words of Van Liere and Dunlap (1981), apparently "it does make a
difference" how we measure the construct.

FOOTNOTES
2. Survey data were obtained by means of a drop-off, pick-up technique; the sampleincluded the random selection of adults from within a probability sample of householdsin each of the four communities. In each community, interviewers gathered a smallamount of background information while dropping off questionnaires at households thatwere selected for inclusion in the survey. An adult from within the household was thenchosen by means of a random number table to complete the longer questionnaire, whichthe interviewer returned later to retrieve. The total sample size, including 597 usablequestionnaires, reflects a response rate of approximately 81%. For further details, see[identifying reference].
3. Our review of the existing literature has been able to identify only one publicationthat clearly suppoit's Dr. Dunlap's suggestion that we maintain a clear distinctionbetween "environmental concern" and "attitudes toward land-use planning and growthmanagement," at least in terms of communityAevel analysis. Connerly's factor analysisof environmental and growth attitudes (1986) found three dimensions of growth manage-ment concernscosts of controlling growth, support for specific growth-control tech-niques, and support for increased environmental protection. Connerly's resultant call forenvironmental protection and growth management to be treated as "two fairly distinctareas of citizen attitudes," however, appears not to be supported by most of the availa-ble literature. Both empirically and conceptually, land-use and growth controls tend tobe seen as a subset of the broader range of factors that make up "environmentalconcern." Empirically, even the authors who have separated land-use and growth-planning concerns from other aspects of environmental concern have found the differingmeasures to be significantly correlatedincluding not only Dr. Connerly's later workwith Frank (Connerly and Frank, 1986), but also Gottdiener and Neiman (1981), Dowall(1980), Geisler and Martinson (1970), and Christenson (1978: 53), who reported, "Inshort, persons most likely to be supportive of landuse planning had higher incomes,advanced education, urban residence, some knowledge of landuse planning, and/or apolitically liberal orientation. These findings parallel the findings of past research onsupport for environmental preservation." At least as importantly, most of the 2athorswho have discussed the topic appear to have conceptualized growth management as anindex of environmental concern. Examples range from Carter's early observation (1973:692) that "many people have come to regard local development as just another form ofpollution," to the recent commentary from Logan and Molotch (1987: 95-96) that"Growth has obvious negative consequences for the physical environment," affecting air,water, open space, esthetic qualities, and ecological variety, "with a consequent threatto the larger ecosystem....Perhaps nowhere are the effects of environmental decline moredramatically displayed than in those places with the most rapid growth experience" (therelevance of this observation to a study of energy boomtown growth scarcely needs tobe emphasized here; but see also Geersten and Beylund, 1975; Albrecht et al., 1986).Even Dr. Dunlap's own work in developing his "New Environmental Paradigm" scale(Dunlap and Van Liere, 1978) has included questions about industrial growth, with itemssuch as "To maintain a healthy economy we will have to develop a 'steady-state'economy where industrial growth is controlled," and "There are limits to growth beyondwhich our industrialized society cannot expand."
On the other hand, the heavy concentration of agriculturalists' investments in landgives some plausibility to the expectation that farmers and ranchers, in particular, mayhave different views of land-use controls than of environmental protection more gener-ally. The literature contains some suggestions that agriculturalists might view land-usecontrols with particular distaste (see e.g. Bultena et al., 1982; Nellis, 1980), and as willbe seen below, the three items in our study most clearly tapping attitudes toward land-
32

use controls were found by our factor analysis to form a factor of their own. Thisscale is correlated with potential explanatory factors in a way that is broadly similar tothe findings from the other three scales and from an item that approaches the issue ofenvironmental concern in-a way that appears to be more closely in line with theapproach that Dr. Dunlap has advocated. Th.. analysis will show, however, that thefindings for agriculturalists on this scale will indeed differ somewhat from the findingsfor the other scales. In short, our approach reflects the conclusion not that growthand land-use controls should be excluded from the analysis of environmental concern,but rather that careful empirical and conceptual analysis should be used to obtain animproved understanding of the broader complex of factors that contribute to publicconcerns about the environment and technological development in different contexts.
4. The item, which is in the second of the four scales, is the agree-disagree item,"Industrial interests in this area are too powerful."
5. As would be expected on the basis of the literature review reported above, the fullset of variables includes measures of age, education, occupation, religious persuasion,
, and places of previous residence, among others, along with interviewer assessments ofinterest/helpfulness and cognitive capacity and coder assessments of written self-expression.
6. As can be seen, this is the only one of the fourscales for which the scale meanis considerably lower in one analysis (the one that excludes missing values) than thzother. The difference is due to the fact that this is the scale with the largest numberof cases with missing dataparticularly on the open-ended items asking how theinterviewee "generally [felt] about coal/energy development" (MEFOR in the appendix;256 missing cases) and 'how much development" he/she would "personally like to see inthis area in the years to come" (DEVWANT in the appendix, 136 missing cases). Givenour concern about the potential for drawing insufficiently cautious conclusions, we re-ran the entire factor analysis with these items removed from the analysis. When this
was done, we still encountered almost identical results from the factor analysis--identi-fying the same four factors, again with all Eigenvalues over 1.0 and with no ambiguousitemsand the difference between the means of the two versions of the scale becameinsignificant, as is already the case with the other scales. On the other hand, thisincrease in scale value consistency was purchased at the cost ofa significant decline inthe reliability of the, scale. The values of alpha declined from those reported in thetext above (.759 and .713, respectively, for the scales removing or recoding the missingdata) to the values of .533 and .521 for the "same" two scales that had the itemsremoved from the analysis. After careful consideration, we reached the conclusion thatthe versions of the scales reported in Table 3 are clearly superior in all respects exceptfor this inconsistency in magnitudea shortcoming that can be dealt with by straight-forwardly reporting both sets of results, which is the course we have followed here.
7. It is intriguing to consider the contrast provided by activities such as mining andoil drilling, which depend on the depletion of resources that are inherently non-renewable. Few such references to "stewardship" or "sustainability" are found in thestatements of purpose for such industries, which tend instead to emphasize othersocially approved goals, such as "independence from unreliable foreign sources," or their"contributions to the national good" that can be quantified with respect to their contri-butions to the Gross National Product. Alternatively, it may prove to be equally in-triguing to analyze more carefully the official statements of those who speak for insti-tutions of higher learningand who in many cases appear to speak with somethingapproaching passion of the significant returns to national economic vitality that can beexpected to follow, through causal mechanisms that are often not made specific, fromlarger "investments" in the institutions of higher learning that such persons represent.

REFERENCES
Albrecht, Don E., Gordon Bultena and Eric Hoiberg1986 "Constituency of the Antigrowth Movement: A Comparison of the Growth
Orientations of Urban Status Groups." Urban Affairs Quarterly21(June):607-616.
Ajzen, I., and Martin Fishbein1977 "Attitude-Behavior Relations: A Theoretical Analysis and Review of
Empirical Research." 'Psychological Bulletin 84: 888-918.
Althoff, P. and W.H. Greig1977 "Environmental Pollution: Two Views from the General Population."
nvironment and behavior 9:441-456.
Andrews, Frank M. and Stephen Withey.1976 Social Indicators of Well-Being: Americans' Perceptions of Life Quality.
New York: Plenum.
Bealer, Robert C., Fern K. Willitis and William P. Kuvlesky1973 "The Meaning of 'Rurality' in American Society: Some Implications of
Alternative Definitions." Rural Sociology 38(Spring):255-266.
Bultena, Gordon, Eric Hoiberg, Don Albr cht and Peter Nowak1982 "Land Use Planning: A Study of Farm and City Perspectives." Journal of
Soil and Watei Conservation 37 (Nov.-Dec.): 341-44.
Buttel, Frederick H.1975 "Class Conflict, Environmental Conflict, and the Environmental Movement:
The Social Bases of Mass Environmental Beliefs, 1968-1974." UnpublishedDoctoral Dissertation, University of Wisconsin, Madison.
Buttel, Frederick H. and William L Flinn1974 "The Structure of Support for the Environmental Movement, 1968-1970."
Rural Sociology 39(Spring):56-59.1976a "Economic Growth Versus the Environment: Survey Evidence." Social
Science Quarterly 57(September):410-420.1976b "Environmental Politics: The Structuring of Partisan and Ideological
Cleavages in Mass Environmental Attitudes." Sociological Quarterly17:477-490.
1978a "The Politics of Environmental Concern: The Impacts of PartyIdentification and Political Ideology on Environmental Attitudes."Environment and Behavior 10:17-36.
978b "Social Class and Environmental Beliefs: A Reconsideration."Environment and Behavior 10:433-450.
Buttel, Frederick H. and Donald E. Johnson1977 "Dimensions of Environmental Concern: Factor Structure Correlates, and
Implications for Research." Journal of Environmental Education 9:49-64.
Carter, Luther J.1973 "Land Use Law (I): Congress on the Verge o
Science 182:691-697.
34
Modest Beginning."

Christenson, James A.1978 "Individual Versus Public Rights: Implications of Support for Lanause
Planning and Control." Journal of Environmental Education 9:50-57.
Connerly, Charles E.1986 "Growth Management Concern: The Impact of Its Definition on Support
for Local Growth Controls."' Environment and Behavior18(November):707-732.
1986 "Predicting Support for Local Growth Controls." Social Science Quarterly67:572-586.
Constantini, E. and K. Hanf1972 "Environmental Concern and Lake Tahoe: A Study of Elite Perceptions,
Backgrounds, and Attitudes." Environment and Behavior 4:209-242.
DeGroot, Ido1967 "Trends in Public Attitudes Toward Air Pollution." Journal of the Air
Pollution Control Association 17(October):679-81.
Dillman, Don A. and James A. Christenson1972 "The Public Value for Pollution Control," Pp 237-256 in William R. Burch,
Jr., Neil H. Creek, Jr., and Lee Taylor (Eds.), Social Behavior, NaturalResources and the Environment. New York: Harper and Row.
1975 "The Public Value for Air Pollution Control: A Needed Change ofEmphasis in Opinion Studies." Cornell Journal of Social Relations10(1):73-95.
Dillman, Don A. and Kenneth R. Tremblay, Jr.1977 "The Quality of Life in Rural America." Annals, AAPSS
429(January):115-129.
Dowall, David E.1980 "An Examination of Population-Growth-Managing Communities." Policy
Studies Journal 9(3):414-427.
Dunlap, Riley E.1975 "The Impact of Political Orientation on Environmental Attitudes and
Actions.' Environment and Behavior 7:428-454.1985 "Public Opinion: Behind the Transformation." EPA Journal
11(July/August):15-17.
Dunlap, Riley E. and M.P. Allen1976 "Partisan Differences on Environmental Issues: A Congressional Roll Call
Analysis." Western Political Quarterly 29:384-397.
Dunlap, Riley E. and Don A. Dillman1976 "Decline in Public Support for Environmental Protection: Evidence From
a 1970-1974 Panel Study." Rural Sociology 41(Fall):382-390.
Dunlap, Riley E. and Richard Gale1974 "Party Membership and Environmental Politics: A Legislative Roll-Cc::
Analysis." social Science Quarterly 55(December):670-690.
3b

Dunlap, Riley E., and Richard Gale and Brent M. Rutherford1974 "Concern for Environmental Rights Among College Students." Pp. 115-130
in Arvin W. Murch (Ed.,), Environmental Concern: Personal Attitudes andBehavior Toward Environmental Problems. New York: MSS Info Corp.
Dunlap, Riley E. and Kent D. Van Liere1978 "The 'New Environmental Paradigm.'" Journal of Environmental Education
9(Summer):10-19.
Erskine, Hazel1974 "The Polls: Pollution and Its Costs." Pp. 345-360 in Arvin W. Murch
(Ed.) in Environmental Concern: Personal Attitudes and Behavior TowardE vironmental Problems. New York: HSS INF Corp.
Fisher, Claude S.1972 "Urbanism as a Way of Life: A Review and an Agenda." Sociological
Methods and Research 1 (November):187-242.1980 "The Spread of Violent Crime from City to Countryside, 1955 to 1975."
Rural Sociology 45(Fall):416-434.
Freudenburg, William R.1979 "People in the Impact Zone: The Human and Social Consequences of
Energy Boomtown Growth in Four Western Colorado Communities."Unpublished Doctoral Dissertation, Yale University.
1982 "The Impacts of Rapid Growth on the Social and Personal Well-Being ofLocal Community Residents," Pp. '7-170 in Bruce A. Weber and Robert E.Howell (Eds.), Coping with Rapid Growth in Rural Communities. Boulder,Colorado: Westview Press.
1986 "The Density of Acquaintanceship: An Overlooked Variable in CommunityResearch?" American Journal of Sociology 92(July):27-63.
Geertsen, H. Reed and H. Bruce Bylund1975 "Land Use and Related Environmental Issues in Utah." Cornell Journal of
Social Relations 10:97-109.
Geisler, Charles C. and Oscar B. Martinson1976 "Local Control of Land Use: Profile of a Problem." Land Economics
52:371-381.
Glenn, Norval D. and Jon P. Alston1977 "Rural-Urban Differences in Reported Attitudes and Behavior." The
Southwestern Social Science Ouarterly 47(March):381-400.
Gold, Raymond L1974 "A Comparative Study of the Impacts of Coal Development on the Way of
Life of People in the Coal Areas of Eastern Montana and NortheasternWyoming." Denver, Colorado: Northern Great Plains Resources Program.
Gottdiener, M. and Max Neiman1981 "Characteristics of Support for Local Growth Control." Urban Affairs
Quarterly 17(September):55-73.
36

Heberlein, Thomas A. and J. Stanley Black1976 "Attitudinal Specificity and the Prediction of Behavior in a Field Setting."
Journal of Personality and Social Psychology 33: 474-479.
Hendee, John C.1969- "Rural-Urban Differences in Outdoor Recreation Participation." Journal of
Leisure Research 1(Autumn):333-341.
Jobes, Patrick and Milton G. Parsons1975 "Satisfaction, Coal Development, and Land-Use Planning: A Report of Atti-
tudes held by Residents of the Decker-Birney-Ashland Study Area." HelenaMT: Montana Energy Advisory Council
Koenig, Daniel J.1975 "Additional Research on Environmental Activism." Environment and
Behavior 7(4):473-485.
Kronus, Carol L and J.C. Van Es1976 "The Practice of Environmental Quality Behavior." Journal of
Environmental Education 8(Fall):392-420.
Libby, Donald L1987 "A Stratification Model for Social Impact Assessment: Assessing the
Relation Between Growth Rates and the Effects of Social and EconomicStatus on the quality of Life." Unpublished Master's Thesis, WashingtonState University, Pullman, Washington.
Logan, John R. and Harvey L Molotch1987 Urban Fortunes: The Political Economy of Place. Berkeley, CA:
University of California Press.
Lovejoy, Stephen B. and Richard S. Krannich1982 "Rural Industrial Development and Domestic Depending Relations: Toward
an Integrated Perspective." Rural Sociology 47(Fall):475-495.
Lowe, George D. and Charles W. Peek.1974 "Location and Lifestyle: The Comparative Explanatory Ability of
Urbanism and Rurality." Rural Sociology 39(Fall):392-420.
Lowe, George D. and Thomas K. Pinhey1982 "Rural-Urban Differences in Support for Environmental Protection." Rural
Sociology 47(Spring):114-128.
Lowe, George D., Thomas K. Pinhey and Michael D. Grimes1980 "Public Support for Environmental Protection: New Evidence From
National Surveys." pacific Sociological Review 23(October):423-445.
Marsh, Paul C. and James A. Christenson1977 "Support for Economic Growth and Environmental Protection, 1973-1975."
Rural Sociology 42(Spring):101-103.

McEvoy, James III1972 "The American Concern with Environment." Pp. 214-236 in William R.
Burch, Jr., Neil'H. Cheek, Jr. and Lee Taylor (Eds.), Social Behavior,Natural Resources. and the Environment. New York: Harper and Row.
Milbraith, Lester W.1975 "Environmental Beliefs, Perceptions, and Actions." Cornell Journal of
Social Relations 10(Spring):139-149.
Mitchell, Robert Cameron1979 "Silent Springs/Solid Majorities." Public Opinion 55(Aug/Sept):1-20.
Mohai, Paul and Ben W. 'Night1986 "Rural-Urban Differences in Environmentalism Revisited: Nature Manipu-
lative Vs. Nature Exploitative Orientations." Paper Presented at the An-nual Meeting of the Rural Sociological Society, Salt Lake City, August.
Molotch, Harvey L1976 "The City as a Gro,wth Machine: Toward a Political Economy of Place."
American Journal of Sociology 82(5):309-332.
Morrison, Denton E.1986 "How and Why Environmental Consciousness has Trickled Down," Pp.
187-220 in Allan Schnaiberg, Nicholas Watts and Klaus Zimmerman (Eds.),Distributional Conflicts in Environmental Reource Policy. England:Gower.
Murdock, Steve H. and F. Larry Leistritz1979 Energy Development in the Western United States: Impact on Rural
Areas. New York: Praeger.
Murdock, Steve H. and Eldon Shriner1977 "Social and Economic Determinants of the Level of Support for Envrion-
mental Protection and Economic Growth in a Rural Population." Presentedat Annual Meeting of the Rural Sociological Society, Madison, WI.
Neiman, Max and Ronald 0. Loveridge1981 "Environmentalism and Local Growth Control: A Probe into the Class
Bias Thesis." Environmental and Behavior 13 (November):759-772.
Nellis, Lee1980 "Planning with Rural Values." Journal of Soil and Water Conservation 35
(Mar.-Apr.):67-71.
Salcedo, Rodolfo N., Hadley Read, James F. Evans and Ann C. Kong.1971 "Rural-Urban Perspectives of the Pesticide Industry." Rural Sociology
36(December):554-562.
Sharma, Navin C. Joseph E. Kivlin and Frederick C. Fliegel1975 "Environmental Pollution: Is There Enough Public Concern to Lead to
Action?" Environment and Behavior 7(4):455-471.
38

Thompson, James G. and Audie L. Blevins1983 "Attitudes Toward Energy Development in the Northern Great Plains."
48(Spring):148-158.
Tognacci, Louis N., Russel H. Weigel, Marvin F. Wideen and David T.A. Vernon1972 "Environmental QualityHow Universal is Public Concern? Environment
and B_ehavint 4(March):73-86.
Tremblay, Kenneth R., Jr., and Riley E. Dunlap1978 "Rural-Urban Residence and Concern with Environmental Quality: A
Replication and Extension." Rural Sociology 43(Fall):474-491.
Van Es;J.C. and J.E. Brown, Jr.1974 "The Rural-Urban Variable Once More: Some Individual Level
Observations." Rural Sociology.39(Fall):373-391.
Van Liere, Kent D. and Riley E. Dunlap1980 "The Social Bases of Environmental Concern: A Review of Hypotheses,
Explanations and Empirical Evidence." Public Opinion Ouarterly44(Summer):181-197.
1981 "Environmental Concern--Does it Make a Difference How It's Measured?"Environment and Behavior 13(November):651-676.

Table 1: RESULTS OF FACTOR ANALYSIS
LOCALDEVELORIEW
FACTOR 2:D/S1RUST OFCORPORATIONS
FACTOR 3:OPPOSITION
TOGOVERMENT'REGULATION
FACTOR 4:SUPPORT FORPLANNINGAND ZONING
HOUSEFOR 0.76145 -0.05356 0.10841 0.00186
HEFOR 0.74560 0.08492 0.05582 0.02767
BaroFF 0.65459 -0.36852 0.29031 -0.07479
GOODBAD 0.62172 -0.16214 0.28802 -0.09466
MENEM' 0.59109 -0.32807 0.11084 -0.05820
DEVWANT 0.57007 -0.20162 0.20434 -0.04961
FNOTDES -0.53162 0.37917 -0.07833 -0.07423
EQUALIMP 0.51822 -0.12404 0.07159 -0.07809
DOBIDG -0.16547 0.70221 -0.16179 -0.04869
NOME° 0.05245 0.68104 0.08523 -0.01069
NOCCNTAS -0.21806 0.66207 -0.14207 -0.01224
SOCCOSTS -0.1592 0.63391 -0.06404 0.04466
STDSWEAK -0.06418 0.55076 -0.21230 0.01338
IND2POWR -0.30396 0.54798 -0.23835 -0.04548
NO1NTFR 0.14239 -0.10499 0.68891 -0.0035
ECONONLY 0.34467 -0.01789 0.63868 -0.12755
ENIAOREMP 0.03634 -0.02852 0.63482 -0.06368
MOVECUT 0.27585 -0.19355 0.61709 -0.11488
UNER1ELL 0.01808 -0.14165 0.58098 -0.03576
ZONENGME -0.01594 0.01349 -0.07388 0.83349
ZORENG2 -0.01667 -0.00055 0.03691 0.77570
DOASP1S 0.02884 0.04540 0.14375 -0.56052
EIGENVALUES: 5.64 1.96 1.64 1.38
RUZABILUMIS(ALPHAS)' OF
SMILES:
wrawrHissimum 0.759 0.748 0.685 0.621
w r 1H MISSING 0.713 0.738 0.679 0.607
DATA
4 o.

Table 2: HOW DO You FEEL ABOUT THE LOCAL ENVIRONMENT?
Missing Values Recoded to Means
Grand Mean 3.73
DeviationUnadjusted From Mien,(2ero-Order) Adjusted for
Deviation,Adjusted forCategorical
Missing Values Excluded from Analysis
Grand Mean 5.82
DeviationUnadjusted From Meer,(2ero-Order) Adjusted for
Deviation,Adjusted forCategorical
Deviation Categorical Continuous Significance Deviation Categorical I Continuous Significance
CATEGORICAL VARIAILES Ns: From Mean Variables Variables F: of F: CATEGORICAL VARIABLES Ns: iron Mean Varlabtes variables Ft of F:
WUPATiom 1.677 0.154OCCUPATtON 3.152 0.015
(Mead of Household)(Need of Nousehold)
Farming 21 -0.15 -0.10 -0.34Firming 10 0.82 -0.69 1.01
/inching 60 0.27 0.20 0.05 Ranching 24 0.51 0.34 0.04
lusiness/ProfessionalCoat Mining
8560
0.010.28
-0.010.31
0.140.30
lusiness/ProfessionalCoal Mining
41
14
0.060.75
0.080.62
0.330.67
Other 369 -0.05 0.05 -0.07Other 147 -0.11 0.11 -0.06
RELIGIOUS OENOMINATION 2.325 0.032 RELIGIOUS DENOMINATION 2.167 0.059
None/AgnostiC/Athelstic . 63 -0.29 -0.25 -0.07 None /Agnostic /Atheistic 40 .0.5 0.45 -0.67
Liberal Protestant (1) 99 0.21 0.22 0.20 Liberal Protestant (1) 71 0.26 0.24 0.28
Moderate Protestant (2) 63 0.14 0.14 0.13Moderate Protestant (2) 41 -0.04 -0.04 -0.07
Conserv. Protestant (3) 50 -0.29 -0.28 -0.25Conserv. Protestant (3) 25 0.22 -0.11 0.02
Catholic 64 -0.11 -0.11 -0.02 Catholic 33 -0.13 -0.15 -0.02
Mormon 40 0.44 0.42 0.39 Mormon 26 0.49 0.40 0.41
Other/Unknown/Missing 216 -0.03 0.05 -0.12
WIER'S EDUCATION 0.56 0.692 FATHER'S EDUCATION 0.631 0.596
Less than High School 267 0.07 0.07 0.10 Less than high School 125 0.03 0.04 0.04
Nigh School Graduate 129 -0.09 -0.12 -0.12Sigh School Graduate 52 0.12 0.03 0.11
Trade SchoolMore than Nigh School
and Trade School
2096
0.07-0.07
0.090.06
0.18-0.15
Trade SchoolMore than High School
andTrade School
10
49-0.52-0.11
-0.510.03
-0.47-0.13
Other/Unknown/Missing 53 0.03 0.00 -0.01
Raw Regression Significance Raw Regression Significance
CONTINUOUS VARIABLES Coefficient F: of F: CONTINUOUS VARIAILES Coefficient F: of it
( Republican) Party 0.113 6.361 0.012 (Republican) Party 0.084 0.955 0.330
Boomtown Residence -0.524 40.252 0:000 loomtown Residence 0.952 22.258 0.000
Age 'racket -0.052 1.752 0.159 Age Bracket -0.120 1.450 0.230
Belong to Church 0.035 0.297 0.556 Belong to Church 0.333 1.721 0.191
income Iracket 0.063 .00.553 0.001 Income Bracket 0.087 13.248 0.000
Other Place Most EnjoyedRespondent's Education
0.0160.012
0.2550.205
0.5940.648
Other Place Most EnjoyedRespondent's Education
0.098-0.009
2.0000.048
0.1590.326
(Interviewer Assess. of)(Interviewer Assess. of)
Written Self-Expression 0.038 0.142 0.706 Written Self-Expression 0.102 0.433 0.511
Interest I Nelpfulnesss 0.004 0.460 0.495 Interest I Nelpfutnesis 0.007 0.353 0.45$
Cognitive Capacity 0.005 0.404 0.525 Cognitive Capacity -0.008 0.350 0.555
Multiple R-Squared: 0.144Multiple R-Squared: 0.266

Missing Values Recoded to Means
Table 3: SUPPORT FOR LOCAL DEVELOPMENT
Missing Values Excluded from Analysts
Grand Mean 45.14Grand Mean 50.87
Deviation Deviation, Deviation Deviation,
Unadjusted from Mean, Adjusted for Unadjusted From Mean, Adjusted for
(ZeroOrder) Adjusted for Categorical (Zero-Order) Adjusted for Categorical
Deviation Categorical I Continuous Significance Deviation Categorical I Continuous Significance
CATEGORICAL VARIABLES Ma: from Mean Variables Variables Pt of t: CATEGORICAL VARIABLES Mat from Mean Valetas. Variables f: of Ft
OCCUPATION9.382 0.000 OCCUPATION 3.760 0.006
(Mead of aousehold)(Head of Household)
farming 21 -13.89 -12.12 -11.32 farming 10 -15.22 -12.62 -12.72
Ranching 60 -8.46 -8.87 -7.30 Ranching 24 . 3.26 -0.55 -1.91
lysine's/Professional SS 3.57 4.58 S.53 Business /Professional 42 4.97 6.83 8.96
Coal Mining 60 8.71 8.27 8.28 Coal Mining 13 10.80 13.47 8.53
Other 369 -0.07 -0.27 -0.79 Other 147 -1.87 -2.19 -2.14
IELIGIOUSDEMONIMATfOM 1.122 0.348 RELIGIOUS OEMoNtwAttow 5.433 0.000
None/Agnostic/Atheistic 63 -5.26 -4.94 -3.26 None / Agnostic /Atheistic 40 -13.36 -12.89 -14.71
Liberal P (1) 99 0.84 2.13 1.17 Liberal Protestant (1) 70 5.57 5.47 4.37
Moderato Protestant (2) 43 -0.94 -1.51 -1.96 Modorste Protestant (2) 42 -2.44 -3.39 -2.79
Conerv. Protestant (3) 50 1.99 2.SS 1.64 C . Protestant (3) 2S 6.75 8.70 9.53
Catholic 64 1.00 0.49 1.00 Catholic 33 -2.38 -2.12 0.86
Mormon 40 -0.43 0.27 -0.78 Mormon 26 6.03 4.90 5.11
Other/Unknown/Missing 216 0.74 0.12 0.45
NOTNER'S EDUCATION 2.572 0.053 NoTNER'S EDUCATION 4.084 0.018
Less than Nigh School 214 1.31 1.15 0.41 Less than High School 94 3.35 3.74 3.06
Nigh School Graduate 181 0.29 0.04 1.19 Nigh School Graduate 85 1.37 0.09 0.44
Mort then Nigh Schooland Trade School
116 -4.92 -4.2 -3.05 More than Nigh Schooland trade School
57 -7.57 -6.30 -5.70
Other/Unknown/Missing 84 2.85 2.78 0.62
Raw Regression Significance Raw Regression Significance
CORTIELIOU: VARIABLES Coefficient F: of f: CONTINUOUS VARIABLES Coefficient F: of f:
(Republican) Party -0.507 0.545 0.461 (Republican) Party 1.500 1.074 0.301
Boomtown Residence -2.673 1.820 0.176 Boomtown Residence -15.791 20.722 0.000
Age "racket 2.622 7.533 0.006 Age Bracket 0.58 0.114 0.736
Belong to Church 0.390 0.155 0.694 Belong to Church -5.101 1.398 0.238
Income Bracket 0.110 0.140 0.706 Income Cricket 0.284 0.500 0.480
Other Place Most Enjoyed 0.766 2.793 0.095 Other Place Most Enjoyed 0.698 0.340 0.561
Respondent's Education -0.116 0.083 0.773 Respondent's Education 0.281 0.146 0.703
(Interviewer Assets. of)(Interviewer Assess. ot)
Written Self-Expression -0.962Written SelfExpression -1.822
Interest I Melpfulnesss 0.037 0.392 0.531 Interest t Helpfulness 0.117 0.459 0.499
Cognitive Capacity -0.376 0.150 0.699 Cognitive Capacity -0.691 0.493 0.483
8.440 0.004 9.352 0.003
Multiple I-Squared: 0.120Multiple 8-Squared: 0.280
4°

Missing Values Receded to means
Grand mean 46.53
CATEGORICAL VARIABLES His
PCCUPATIONMad of Household)
_FarmingRanchingNusiness/ProfessionalCost MiningOther
Unadjusted(ZeroOrder)DeviationProm Mean
DeviationProm Mean.
Adjusted forCategoricalVariables
Deviation.Adjusted forCategoricriContinuousVariables Ft of F:
Table 4: MISTRUST OF INDUSTRY
Signkficanca
21 6.42 7.08 6.5460 1.18 1.35 2.3485 -3.25 3.96 -3.7760 -2.43 -2.08 -3.53369 0.58 0.63 0.69
FATHER'S EOUCATIONLess than sigh School 267 -1.02 -1.26 -0.98Nigh School 129 1.01 1.39 0.97Trade School 20 -1.65 -0.73 -1.57More than Nigh School 96 1.55 1.65 1.30andlrade SchoolOther/Unknown/Missing 83 0.31 0.15 0.53
9TMER PLACE LIMEDRESP0NDENT.gm.10/ED MOSTLived Current CosnunityEntire Life
Rural Area- 92 0.05 -0.31 0.24Small,Town 184 0.39 -0.29 -0.52Suburban 37 -0.75 -0.42 -0.31Urban 50 3.33 3.50 3.82Other/Unknown/Misting 118 0.10 0.13 0.14
114 -0.73 0.82 -1.07
CONTINUOUS VARIABLES
(Republican) PartyBoomtown ResidenceTeens Current ResidenceBelong to ChurchIncome BracketMother's EducationAge trinketReligious Oenominstion'(Interviewer Assess. of)Written Self-ExpressionCognitive Capacity .
Raw RegressionCoefficient
Multiple ftSquared: 0.123
- 1.638
1.0020.054
0.170- 0.170
0.481- 1.653
-0.158
- 1.477- 0.075
6.499 0.000
2.119 0.077
1.315 0.256
SignificanceF: of F:
19.382 0.0000.896 0.3450.538 0.4640.172 0.6791.143 0.285`0.642 0.42310.222 0.0010.614 0.434
3.197 0.0741.366 0.243
Missing values Excluded from Analysis
Grand Mean 45.44
CATEGORICAL VARIABLES 222
OCCUPATION(Read of Household)
FarmingRanchingB usiness /ProfessionalCoal MiningOther
10
244213
145
Unadjusted(2eroOrder)
DeviationFrom Mean
5.37- 1.44
-3.87- 2.se
1.22
FATHER'S EDUCATIONLess than High School 124 -1.08sigh School 52 0.65Trade School 10 -2.42More than Nigh School 48 2.59and Trade Schcol
Other /Unknown /Missing
9TNER PLACE LIVEDRESPONDENT ENJOYED MOSTLived Current CommunityEntire Life
Rural AreaSmell townSuburbanUrban
CONTINUOUS VARIABLES
(Republican) PartyBoomtown ResidenceTears Current ResidenceB elong to ChurchIncome BracketMother's EducationAge BracketReligious Denomination(Interviewer 222222. of)Written Self-ExpressionCognitive Capacity
48
51
891729
-1.48
-1.06- 0.71
0.736.91
Raw RegressionCoefficient
Multiple I-Squared: 0.185
-1.4451.734-0.1011.782
- 0.018
1.734-1.030-0.878
-1.125-0.184
DeviationFrom Mean,
Adjusted forCategoricalVariables
Deviation.Adjusted forCategorical
6 ContinuousVariables Ft Sf Ft
Significance
6.56 5.94-0.38 1.10- 4.84 -5.43- 2.29 -3.401.22 1.29
-1.48 -0.901.28
-0.55 -1.482.56 1.48
- 1.38 -0.01
-1.00 -0.35- 0.82 -1.72-0.15 0.106.65 5.86
2.819 0.026
1.482 0.220
2.565 0.039
SignificanceF: of F:
2.914 0.0890.723 0.3962.395 0.1231.608 0.2060.006 0.9391.907 0.1690.652 0.4202.290 0.132
0.513 0.4752.535 0.113
4

Table 5: OPPOSITION TO GOVERNMENT REGULATION
hissing Values Recoded to Means
Grand Neon 36.85
DeviationUnadjusted From Mean,(Zero-Order) Adjusted for
Deviation,Adjusted forCategorical
hissing Values Excluded from Analysis
Crand Mean 34.57
DeviationUnadjusted From Mean,(ZeroOrder) Adjusted for
Deviation,Adjusted forCategorical
Deviation Categorical I, Continuous Significance Deviation Categorical S Continuous Significance
CATEGORICAL VARIASLES Ns: From Seen varliblts Variables F: of F: CATEGORICAL VARIAILES Ns: From Neon Variables Variables F: of F:
OCCUPATION 3.109 0.015 gCUPATIoN 1.554 0.188
(heed of household) (Need of household)Farming 21 5.69 6.23 -4.16 Forming 10 3.58 4.05 0.93Ranching 60 0.92 0.58 0.80 Ranching 25 2.16 3.19 3.59lusiness/Professional 85 2.36 1.20 0.06 lusiness/Professionsl 42 -1.61 -1.27 0.24
Coal Mining 60 2.0) 1.60 3.73 Coal Mining 13 3.35 2.20 2.91
Other 369 0.69 0.46 0.25 Other 145 0.79 1.00 0.35
INNER'S EDUCATION 9.228 0.000 'AMR'S EDUCATION 3.509 0:016Less than Nigh School 267 0.69 0.74 -0.75 Less than Nigh School 125 0.46 0.41 0.82Nigh School 129 1.41 1.41 0.20 Nigh School 52 2.19 2.02 2.81
Trade School 20 -1.84 1.73 0.22 Trade School 10 3.39 3.88 4.92
More than Nigh Schooland Trade School
Other/Unknown/hissing
96
83
-4.11
5.15
3.87
4.70
0.75
3.02
More than Nigh Schooland Trade School
Other/Unknown/Missing
48 4.27 4.08 1.92
".
OTNER PLACE LIVED 1.122 0.347 OTTER PLACE LIVED 0.733 0.570
MESPONDENT ENJOYED MOST RESPONDENT ENJOYED MOSTLived Current Community 114 0.26 0.70 0.59 Lived Current Community 48 1.31 1.23 0.58
Entire Life Entire LifeRural Ares 92 0.78 0.96 0.40 Rural Area 52 0.63 0.33 -1.01
Smell Town 184 0.75 0.71 0.56 Smell Town 89 0.37 -0.43 0.26
Suburban 37 0.04 0.50 1.28 Suburban 17 1.'S 1.97 3.11
Urban 50 1.98 1.18 0.77 Urban 29 -2.84 .2.44 -1.76Other/Unknown /hissing 118 1.64 1.38 1.06
Raw Regression Significance
Raw Regression Significance CONTINUOUS VARIASLES Coefficient F: . of F:CONTINUOUS VARIABLES Coefficient F: of F:
(Republican) Party 1.673 5.178 0.024
(Republican) Party 0.909 6.726 0.010 loomtown Residence 0.288 0.027 0.870
Boomtown Residence 0.346 0.122 0.727 Age Bracket 3.241 13.43 0.000
Age track*: 3.981 67.952 0.000 Oolong to Church 0.638 0.269 0.605
Oolong to Church 0.103, 0.071 0.790 Income ;racket 0.316 2.343 0.127
Income 'racket 0.300 ,4.036 0.045 Mother's Education 0.984 0.773 0.380
Mother's Education' 1.068 3.561 0.060 Respondent's Educetion 0.746 4.013 u.046Respondent's Education 0.644 10.098 0.002 Religious Denomination 0.123 0.058 0.810
Religious Da -lination 0.123 0.411 0.522 (interviewee Assess. of)(Interviewer . lees. of) Interest S helpfulness 0.089 1.082 0.299
interest L Nel, ulnets 0.016 0.101 0.750 Cognitive Capacity 0.110 0.883 0.348
Cesnitive Capacity 0.078 1.379 0.241
Multiple R.Squared: 0.241Multiple RSquared: 0.208

Table 6: SUPPORT FOR PLANNING i ZONING
Missing Values hooded to Nelms
Grand Mean 17.56
RogationUnadjusted Troll Mean,
(Zero-Order) Adjusted for
Deviation,Adjusted forCategorical
Missing Values Excluded From Analysis
Grand Neon 16.93
DeviationUnadjusted From Neon,(ZeroOrder) Adjusted for
Deviation,Adjusted forCategorical
Deviation Categorical & Continuous Significance Deviation Categorical & Continuous Significance
CATEGORICAL VARIABLES MRS From Nun Variables Variables is of Ft CATEGORICAL VARIABLES Nst from Nun Variables Variables it of ft
OCCUPATION 1.948 0.101 occupoloy 0.200 0.938
(Need of Household) (Hood of Household)
Tornio, 21 1.45 1.60 -1.85 Teraina 11 0.44 1.07 0.18
Pinching 60 -0.22 -0.59 -T.16 Ranching 25 0.70 -0.53 -1.00
business /Professional 65 3.35 2.68 1.40 lusIness/Professional 46 2.05 1.35 -0.42
Cosl-Mining 60 -2.67 .1.88 -0.93 Coal Mining 14 -1.50 -0.13 2.25
Other 369 -0.22 -0.12 0.12 Other 152 -0.63 -0.39 0.07
RELIGIOUS DEMORIVAILO, 1.937 0.073 RELIGIOUS DENOMINATION 1.075 0.375
None/Agnostic/Atheistic 63 0.23 0.25 0.54 None/Agnostic/Atheistic 43 -2.30 -2.63 4.41
Liberal Protestant (1) 99 3.58 3.10 2.08 Liberal Protestant (1) 72 2.39 2.23 0.53
Nod (2) 63 0.94 0.53 0.45 Moderate Protestant (2) 43 0.53 0.48 -0.44
Conserv. Protestant (3) 50 -0.93 -0.82 -1.02 Conserv. Protestant (3) 27 -3.08 -2.76 -3.53
Catholic 64 -0.90 0.98 1.73, Catholic 37 -0.01 -0.03 :.29NOMODA 40 .0.76 0.57 0.52 Mormon 26 -0.49 0.29 -1.10
Other/Unknown/Missing 216 1.36 1.06 -0.40 e
WNW, EDUCATION 0.616 0.605 MOTHER'S EDUCATION 2.433 0.090
Less than 11181$ School 214 -0.31 0.08 0.05 Less than Nigh School 96 -1.22 -0.99 -0.20
Nigh School Graduate 181 -0.07 -0.33 -0.67 Nigh School Graduate 88 -0.96 -1.08 1.41More than Nigh School
and Trade School116 1.78 1.14 0.73 More than Nigh School
and Trade School54 3.16 2.98 2.23
Other/Unknown/Missing 84 141 -0.67 0.31
Raw R tt ion Significance Raw Regression Significance
CONTINUOUS VARIABLES Coefficient ft of Ft CONTINUOUS VARIABLES Coefficient it of Is
(Republican) Party 0.159 0.178 0.673 (Republican) Party 0.949 1.239 0.267
boomtown Residence 1.699 2.474 0.116 loomown Residence 4.682 5.381 0.021
Age , t
belong to ChurchOther Place Most Enjoyedletherealducation
0.1930.6780.153-0.303
0.1361.5470.3690.525
0.7130.2140.5440.469
Age recketMono to ChurchOther Place Most EnjoyedFather's Education
-0.4955.954-0.166-0 042
0.2285.5340.0560.002
0.6340.0200.8140.962
Respondint's Education 0.478 '4.705 0.030 Respondent's Education 0.368 0.746 0.389
(Interviewer Assess. of) (Interviewer A . of)
Written SelfExpressionInterest & NelpfulnesssCognitive Capacity
0.964-0.1030.224
1.3143.8424.936
0.2520.0500.002
written Self-ExpressionInterest & HelpfulnesssCognitive Capacity
1.593-0.2050.375
0.9964.4987.911
0.3190.0350.00
Multiple ItSquareds .0.091
4 9
Multiple ISquared: 0.153
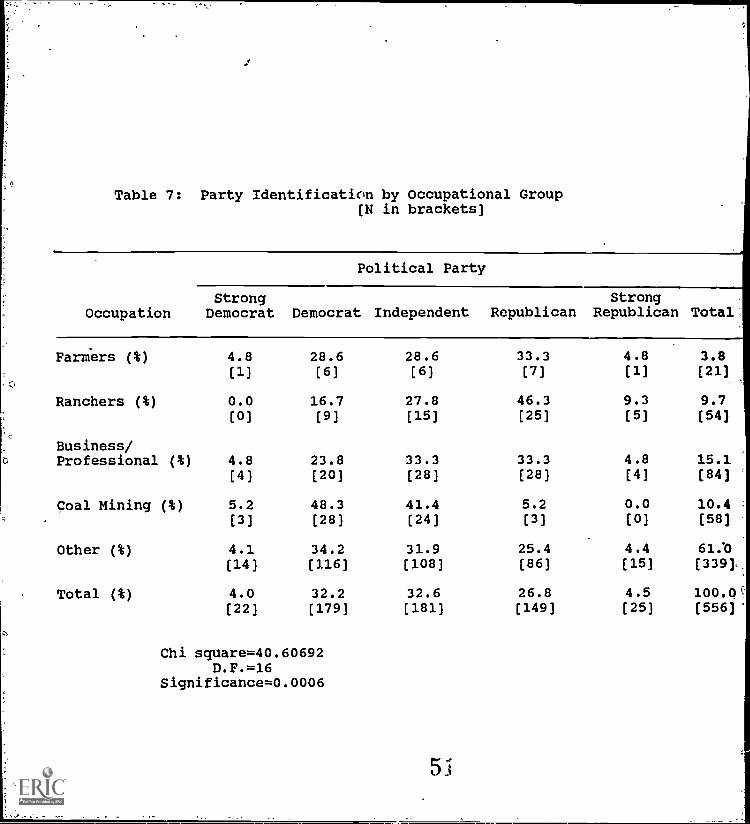
Table 7: Party Identification by Occupational Group[11 in brackets]
Political Party
OccupationStrongDemocrat Democrat Independent Republican
StrongRepublican Total,
Farmers (%) 4.8 28.6 28.6 33.3 4.8 3.8[1) [6] [6] (7] [1] [21]
Ranchers (%) 0.0 16.7 27.8 46.3 9.3 9.7[0) (9] [15] [25] (5] [54]
Business/Professional (%) 4.8 23.8 33.3 33.3 4.8 15.1
[4] [20) [28] [28] [4] [84]
Coal Mining (%) 5.2 48.3 41.4 5.2 0.0 10.4
[3) [28] [24) (3] [0) [58]
Other (%) 4.1 34.2 31.9 25.4 4.4 61.b[14] [116] [108] [86] [15] [3391.
Total (%) 4.0 32.2 32.6 26.8 4.5 100.01i
[22] [179] [181] [149] [25] [556]*
Chi square=40.60692D.F.=16
Significance=0.0006

1
NOINFO:
SOCCOSTS:
STDSWEAK:
IND2POWR:
Not enough information concerning coal and other developments isbeing made available to the public.(5 = strongly agree; 1 = strongly disagree)
Too little attention is being paid to the social costs of coaldevelopment, which accompany whatever economic benefitsdevelopment may bring into the region.(5 = strongly agree; 1 = strongly disagree)
Governmental pollution standards are simply not strict enought tosuit me.(5 = strongly agree; 1 = strongly disagree)
Industrial interests in this area are too powerful.(5 = strongly agree; 1 = strongly disagree)
FACTOR 3: OPPOSITION TO GOVERNMENTAL REGULATIONS
NOINTFR:
MOVEOUT:
UNFRTELL:
ENVOREMP:
ECONONLY:
None of us has the right to interfere with the Nation's need forWestern coal.(5 = strongly agree; 1 = strongly disagree)
People who object to coal development in this area should movesome place else.(5 = strongly agree; 1 = strongly disagree)
Because industries have to be competitiv", it is unfair to expectthem to tell the public about their plans.(5 = strongly agree; 1 = strongly disagree)
One person's right to a clean environment is not as important asanother's right to gainful employment.(5 = strongly agree; 1 = strongly disagree)
Decisions about coal-related development should be made oneconomic grounds only; considerations need not be given to effectson lie styles and values of people in this area.(5 = strongly agree; 1 = strongly disagree)
FACTOR 4: SUPPORT FOR PLANNING AND ZONING
ZONINGME: How do you personally feel about zoning?(5 = totally in favor; 1 = totally opposed)
ZONING2: How do most people around here feel about zoning?(5 = totally in favor; 1 = totally opposed)
DOASPLS: A person who owns land ought to be able to do what he pleaseswith it.(5 = strongly agree; 1 = strongly disagree)

HOUSEFOR:
MEFOR:
BETTOFF:
GOODBAD:
EBENEFIT:
DEVWANT:
ENOTDES:
EQUALIMP:
DOBIDG:
NOCOMPAS:
APPENDIX: SCALE ITEMS
FACTOR 1: SUPPORT FQR LOCAL DEVELOPMENT
Generally, would you say people living in your house are in favorof or against further coal/energ developments in this area, orhaven't you discussed it much?(9 = unqualified support; 1 = unqualified opposition)
How do you generally feel (about coal/energy development)?(9 = unqualified support; 1 = unqualified opposition)
In the long run, I'm sure that people in this area will be betteroff if our energy resources are developed.(5 = strongly agree; 1 = strongly disagree)
Is.that good or bad? (refers to how much development you thinkwill take place here in the next 3 or 4 years) Would you preferto see more or less development than that, or about that amount?(8 = more, as much as we can get; 1= less, not nearly that much)
If significant development takes place ... the people who livearound here will benefit (for example, from increased employmentand an expanded tax base) more than suffer (from damage to theenvironment and our way of life)(1 = true; 0 = false)
How much development would you, personally, like to see in thisarea in the years to come? (Feel free to say as much about thisas you would like, even if you use more paper. But please don'ttake any more time on this item than you wish to take.)(8 = more, as much as we can get; 1= less, not nearly that much)
If significant development takes place ... this will no longer be adesirable place for me to live.(1 = true; 2 = false)
If significant development takes place ... the quality of my lifewill certainly improve.(1= true; 2 = false)
FACTOR 2: DISTRUST OF INDUSTRY
There is a lot of effort going on by coal, power, andconsauction companies to try to buff, coerce, and evenintimidate local residents into doing their bidding.(5 = strongly agree; 1 = strongly disagree)
The coai companies have no compassion for our land, air, andwater quality; all they will do is what's required by law.(5 = strongly agree; 1 = strongly disagree)
53