Embed Size (px)
Citation preview
DOCUMENT RESUME
ED 306 226 TM 012 939
AUTHOR Thompson, BruceTITLE Invariance on Multivariate Results: A Monte Carlo
Study of Canonical Coefficients.PUB DATE 5 Mar 89NOTE 104p.; Paper presented at the Annual Meeting of the
American Educational Research Association (SanFrancisco, CA, March 27-31, 1989).
PUB TYPE Speeches/Conference Papers (150) -- Reports -Evaluative/Feasibility*(142) -- Statistical Data0_10)
EDRS PRICE MF01/PC05 Plus Postage.DESCRIPTORS Computer Simulation; *Correlation; *Monte Carlo
Methods; *Multivariate Analysis; *Sampling;Statistical Analysis; Statistical Studies
IDENTIFIERS *Canonical Coefficients; *Sampling Error
ABSTRACT
In the present study Monte Carlo methods wereemployed to evaluate the degree to which canonical function andstructure coefficients may be differentially sensitive to samplingerror. Sampling error influences were investigated across variationsin variable and sample (n) sizes, and across variations in averagewithin-set correlation sizes and in across-set population correlationsizes. Sixty-four different resea ch situations were investigated,and for each situation 1,000 random samples were drawn. Resultssuggest that both sets of coefficients are roughly equally influencedby sampling error, except perhaps when some intradomain correlationcoefficients are quite large. Thus, the case for emphasizinginterpretation of structure coefficients must be made on apsychometric basis, rather than on the grounds that structurecoefficients are less sensitive to sampling error influences. (Eightdata tables supplement the text. A scattergram of canonical compositescores, population parameters for 16 research situations, 64 tablesof descriptive statistics each involving 1,000 samples, and twotables of mean deviations and mean absolute deviations frompopulation values are appended.) (Author)
*************************************X*********************************Reproductions supplied by EDRS are the best that can be made
from the original document.***********************************************************************
canmonts.rno 3/5/69
U.S. DEPARTMENT OF EDUCATIONOnce of Educational Research and Improvement
4600 EDUCATIONAL RESOURCES INFORMATIONCENTER (ERIC)
IRIThis document has been reproduced asreceived from the perSOn Or OrganizationOriginating it
%fa0 Minor changes have been made to improve
reproduction quality
CD Pants of view Ot OP mons statedinihrsdocu.
rft ment do not necessarily represent officialOERI position or policy
"PERMISSION TO REPRODUCE THISMATERIAL HAS BEEN GRANTED BY
Biducc ilicsmAscm)
TO THE EDUCATIONAL RESOURCESINFORMATION CENTER (ERIC)."
INVARIANCE OF MULTIVARIATE RESULTS:
A MONTE CARLO STUDY OF CANONICAL COEFFICIENTS
Bruce Thompson
University of New Orleans 70148
Paper presented at the annual meeting of the AmericanEducational Research Association (session #13.20), San Francisco,March 28, 1989. The author gratefully acknowledges theuniversity's allocation of extraordina_y computer resources andthe LSU system's generous sabbatical policy, both of which madethis Monte Carlo computer simulation study possible.
2 BEST COPY AVAILABLE

ABSTRACT
In the present study Monte Carlo methods were employed to
evaluate the degree to which canonical function and structure
coefficients may be differentially sensitive to sampling error.
Sampling error influences were investigated across variations in
variable and sample (n) sizes, and across variations in average
within-set correlation sizes and in across-set population
correlation sizes. Sixty-four different research situations we*-
investigated, and for each situation 1,000 random samples were
drawn. Results suggest that both sets of coefficients are roughly
equally influenced by sampling error, except perhaps when some
intradomain correlation coefficients are quite large. Thus, the
case for emphasizing interpretation of structure coefficients
must made on a psychometric basis, rather than on the grounds
that structure coefficients are less sensitive to sampling error
influences.
3
As Hinkle, Wiersma and Jurs (1979) have noted, "it is
becoming increasingly important for behavioral scientists to
understand multivariate procedures even if they do not use them
in their own research." And recent empirical studies of research
practice do confirm that multivariate methods are employed with
some regularity in behavioral research (Elmore & Woehlke, 1988;
Gaither & Glorfeld, 1985; Goodwin & Goodwin, 1985).
There are two reasons why multivariate methods are so
important in behavioral research, as noted by Thompson (1986c)
and by Fish (1988). First, multivariate methods control the
inflation of Type I "experimentwise" error rates. Paradoxically,
although the use of several univariate tests in a single study
can lead to too many hypotheses being spuriously rejected, as
reflected in inflation of "experimentwise" error rate, it is also
possible that the failure to employ multivariate methods cal. lead
to a failure to identify statistically significant results which
actually exist. Fish (1988) provides a data set illustrating this
equally disturbing possibility, a possibility suggesting that
multivariate methods are also often vital in behavioral research
because multivariate methods best honor the reality to which the
researcher is purportedly trying_ to generalize. Since
significance testing and error rates may not be the most
important aspect of research practice (Thompson, 1988b), this
second reason for employing multivariate statistics is actually
the more important of the two grounds for using these methods.
Thompson (1986c, p. 9) notes that the reality about which
most researchers wish to generalize is usually one "in which the
researcher cares about multiple outcomes, in which most outcomes
1
4
have multiple causes, and in which most causes have multiple
effects." Hopkins (1980, p. 374) has emphasized:
These multivariate methods allow understanding of
relationships among several variables not possible
with univariate analysis... Factor analysis,
canonical correlation, and discriminant analysis-
and modifications of each procedure--allow
researchers to study complex data, particularly
situations with many interrelated variables. Such is
the case with questions based in the education of
human beings.
Similarly, McMillan and Schumacher (1984) argue that:
Social scientists have realized for many years that
human behavior can be understood only by examining
many variables at the same time, not by dealing with
one variable in one study, another variable in a
second study, and so forth... These (univariate]
procedures hayed failed to reflect our current
emphasis on the multiplicity of factors in human
behavior... In the reality of complex social
situations the researcher weds to examine many
variables simultaneously. (pp. 269-270)
One of the most useful multivariate methods is canonical
correlation analysis, a statistical procedure first
conceptualized by Hotelling (1935). Kerlinger (1973, p. 65.) has
suggested that "some research problems almost demand canonical
(correlation] analysis." Similarly, Cooley and Lohnes (1971, p.
2

176) suggest that "it is the simplest model that can begin to do
justice to this difficult problem of scientific generalization."
Canonical methods subsume all univariate and parametric methods
as special cases (Knapp, 1978). Thompson (1988a) presents a small
heuristic data set and illustrates how univariate and
multivariate methods can be conducted with canonical correlation
analysis, a general data analytic system.
However, for a variety of reasons (Thompson, 1984, pp. 8-9),
some researchers hesitate to employ canonical methods. One reason
involves the difficulty of interpreting canonical results. As
Thompson (1980, pp. 16-17) notes, "The neophyte student of
canonical correlation analysis may be overwhelmed by the myriad
coefficients which the procedure produces." Two sets of
coefficients have been primary rivals as candidates for emphasis
when making interpretations: (a) function coefficients, which are
the mathematical equivalents of the beta weights produced in the
more familiar regression analysis; and (b) structure
coefficients, which represent the bivariate correlation
coefficients between each variable and the synthetic or composite
variables that are actually interrelated in a canonical analysis.
Canonical structure coefficients are equivalent to the structure
coefficients generated in regression analysis (Thompson &
Borrello, 1985). Disagreement regarding the interpretation
utility of these canonical coefficients even resulted in a formal
debate (Harris vs. Bolton) on these issues at a recent meeting of
the Society for Multivariate Experimental Psychology--Southwest
Division (cf. Harris, 1987).
Some researchers have emphatically argued that structure
3
6

coefficients must be given primary consideration when formulating
interpretations. For example, Meredith (1964, p. 55) argued that
the chance of formulating correct interpretations absent
examination of structure coefficients "is practically nil."
Kerlinger and Pedhazur (1973, p. 344) characterize function
coefficients as "the weak link in the canonical correlation
analysis chain." Levine (1977, p. 20) is equally emphatic in
arguing that structure coefficients are critical to making
correct interpretations. An important argument on which this
position is based involves the psychometric position that
structure coefficients should be emphasized, because these
coefficients tell the researcher the correlation between a given
observed variable and the latent synthetic variables that are
really being correlated in a canonical analysis.
But some researchers have based their positions on the view
that structure coefficients should theoretically be more
invariant from sample to sample than function coefficients (e.g.,
Darlington, Weinberg & Walberg, 1973). Cooley and Lohnes (1971,
p. 55) take the same position in the related regression case, and
do so on the same grounds. However, Monte Carlo studies
(Barcikowski & Stevens, 1975; Thorndike & Weiss, 1973) have not
yet conclusively resolved these issues. The present study was
conducted to investigate the relative invariance of the two sets
of coefficients across variations in variable and sample (n)
sizes, and across variations in average within-set correlation
sizes and in across-set population correlation sizes.
4
The Basic Logic of Canonical Analysis
Although canonical analysis is explained in several recent
texts (Marascuilo & Levin, 1983; Thompson, 1984), some readers
may appreciate a brief discussion of the logic of canonical
analysis, prior to the presentation of the results of computer
simulations reported here. Table 1 presents the simplest case of
a true multivariate correlation analysis, since there are two
variables in both the predictor ("A" and "B") and the criterion
("X" and "Y") variable sets. The table also presents the Z-score
equivalents of the raw scores of the 12 hypothetical subjects on
all four variables. The full canonical results associated with
the Table 1 data are presented in Table 2.
INSERT TABLES 1 AND 2 ABOUT HERE.
The function coefficients presented in Table 2 are
equivalent to multiple regression beta weights, factor analysis
pattern coefficients ("loadings"), and discriminant analysis
function coefficients. Like all these weights, function
coefficients are the best possible weights for a given data set
for a given purpose. In the case of canonical function
coefficients, no other weights can be derived for a given data
set to yield a larger correlation between variable sets. Thompson
and Borrello (1985) provide more detail on the equivalence of
coefficients across methods, an equivalence that is to some
degree masked by the unfortunate but traditional use of different
names to refer to statistical entities that are in fact the same
across analytic methods.
The function coefficient weights in Table 2 can be applied
5
to the "observed" Z-scores reported in Table 1 to create "latent"
or "synthetic" variables scores for each of the 12 subjects on
each of the two canonical functions reported in Table 2. For
example, the function coefficients for criterion variables
and "Y" on Function I were, respectively, 0.511 and 0.867. The
first subject's Z-scores for "ZX" and "ZY" were -1.525 and 1.248,
respectively. Thus, the application of these weights to these
observed Z-scores ((0.511 x -1.525) + (0.867 x 1.248)) yields a
"latent" canonical composite score ("Cl") of 0.303 for this
subject, as reported in Table 1. Scores for the canonical
composite for the predictor variable set ( "P1 ") are computed in
an analogous manner.
The Pearson product-moment correlation between latent
criterion and predictor variables "Cl" and "P1" is the canonical
correlation coefficient (Rc) associated with the first canonical
function reported in Table 2. Similarly, the bivariate
correlation between "C2" and "P2" is Rc for the second canonical
function.
Correlating observed with latent variables yields
coefficients that can be very useful in interpreting canonical
results. For example, correlating "X" (or "ZX") with the
canonical composite scores associated with the variable's own
variable set ("Cl") yields what is called a structure coefficient
for the variable "X" on canonical Function I. Structure
coefficients inform the researcher regarding the nature of the
latent canonical variable (e.g., "Cl"), and are often vital in
interpreting canonical results (Thompson, 1987).
6
9
Similarly, correlating the observed variable "X" (or "ZX")
with the latent variable for the other variable set on Function I
( "P1 ") helps inform the researcher about the meaning of the
latent variable associated with scores for the canonical
composite for the predictor variables on Function I. Correlation
coefficients between observed and latent variables computed
across variable sets are called index coefficients (Thompson,
1984, pp. 30-31), and are also very important in interpretation
(Timm & Carlson, 1976, p. 161). Table 3 indicates which canonical
coefficients are computed by correlating various combinations of
.observed and latent variables.
INSERT TABLE 3 ABOUT HERE.
Method
Monte Carlo or computer simulation methods have been used
for various purposes, including confirming that Yates' correction
for contingency ..table chi-square results is inappropriate
(Thompson, 1988b), creating a test statistic for evaluating the
statistical significance of correlations of factors across
different data sets (Thompson, 1986b), and establishing the
magnitudes of distortions introduced when plOVA is
inappropriately used (Thompson, 1986a). One type of Monte Carlo
study begins with the creation of a large population of data with
known characteristics predetermined by the researcher. Then
samples of data are randomly selected and sample results are
calculated over and over again, usually 1,000 times for each
unique population of data. These results are averaged to
7
10
determine the degree to which sampling error causes bias in
estimates of population parameters.
In the present study it was necessary to create populations
of data that were multivariate normally distributed, since
statistical significance testing of Rc requires this assumption
(Thompson, 1984, pp. 16-18). Many researchers are interested in
significance tests (Thompson, 1988c), try to meet the
multivariate normality assumption in their research, and so this
assumption was met here in creating the Monte Carlo populations
in order to generalize to contemporary research practice.
The present study was conducted to investigate the impacts
of sampling error across variations in variable and sample (n)
sizes, and across variations in average within-set correlation
sizes and in across-set population correlation sizes. The
computer program developed by Morris (1975) was employed to
generate populations of N= 6,000 -by -v_ with desired parameters. The
specific variations explored in the Monte Carlo study were: (a)
use of variable sets consisting of 6+6(v=12), 4+4(v=8), 4+2(v=6),
or 10+2(v=12) variables; (b) sample sizes (n) consisting of 3,
10, 25, or 40 persons per variable; and (c) populations in which
all correlations were zero, populations in which within-set
correlations were all zero but in which between-set correlations
were heterogeneous, populations in which within-set correlations
were heterogeneous but in which between-set correlations were all
zero, and populations in which all bivariate correlation
coefficients were non-zero and homogeneous.
One population was created for each of the four types of
L....._:..........._..,_............,
8
11
correlation matrices. Different subsets of variables were
employed to represent variations in variable set sizes. For
example, for a given population of data, variable set "A"
consisted of variables "1" through "6" being correlated with
variables "7" throt'jh "12". Variable set "B" consisted of
7ariables "1" through "4" being correlated with variables "9"
through "12". Tables 4 and 5 present the population correlation
coefficients for each of the four types of correlation matricet)
based on data for N=6,000 subjects, and the footnotes to the
tables further explain which subsets of variables were used to
.study the effects of the four variations in variable set sizes.
INSERT TABLES 4 AND 5 ABOUT HERE.
Monte Carlo Results
For each of the 64 sets of population data (64 = 4 variable
set sizes by 4 sample sizes (n) per variable by 4 correlation
matrix types), 1000 random samples without replacement were
drawn, and canonical function and structure coefficients were
compute. Table 6 presents illustrative selected results (a) for
the population correlation matrix in which all bivariate
correlation coefficients for the N=6,000 subjects were all zero
to at least two decimal places; (b) for which both variable sets
consisted of six variables (v = 6+6 = 12); (c) and for which the
1,000 samples each involved three subjects per variable (n = 3x12
= 36).
INSERT TABLE 6 ABOUT HERE.
In Table 6, descriptive statistics for each coefficient
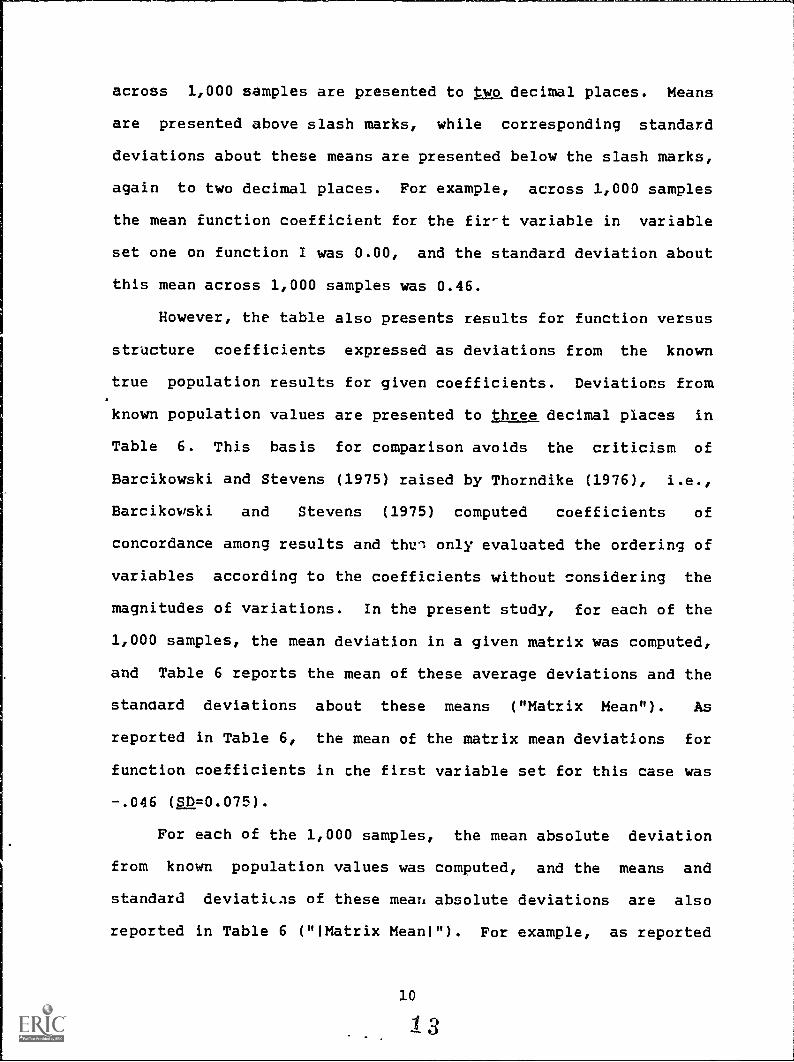
across 1,000 samples are presented to two decimal places. Means
are presented above slash marks, while corresponding standard
deviations about these means are presented below the slash marks,
again to two decimal places. For example, across 1,000 samples
the mean function coefficient for the fir-t variable in variable
set one on function I was 0.00, and the standard deviation about
this mean across 1,000 samples was 0.46.
However, the table also presents results for function versus
structure coefficients expressed as deviations from the known
true population results for given coefficients. Deviations from
known population values are presented to three decimal places in
Table 6. This basis for comparison avoids the criticism of
Harcikowski and Stevens (1975) raised by Thorndike (1976), i.e.,
Barcikowski and Stevens (1975) computed coefficients of
concordance among results and thin only evaluated the ordering of
variables according to the coefficients without considering the
magnitudes of variations. In the present study, for each of the
1,000 samples, the mean deviation in a given matrix was computed,
and Table 6 reports the mean of these average deviations and the
standard deviations about these means ("Matrix Mean"). As
reported in Table 6, the mean of the matrix mean deviations for
function coefficients in the first variable set for this case was
-.046 (SD=0.075).
For each of the 1,000 samples, the mean absolute deviation
from known population values was computed, and the means and
standard deviations of these mean absolute deviations are also
reported in Table 6 ("Matrix Mean1"). For example, as reported
in Table 6, the mean of the 1,000 mean absolute deviations for
the function coefficients for the larger variable set in this
case was 0.475 (SD=0.048).
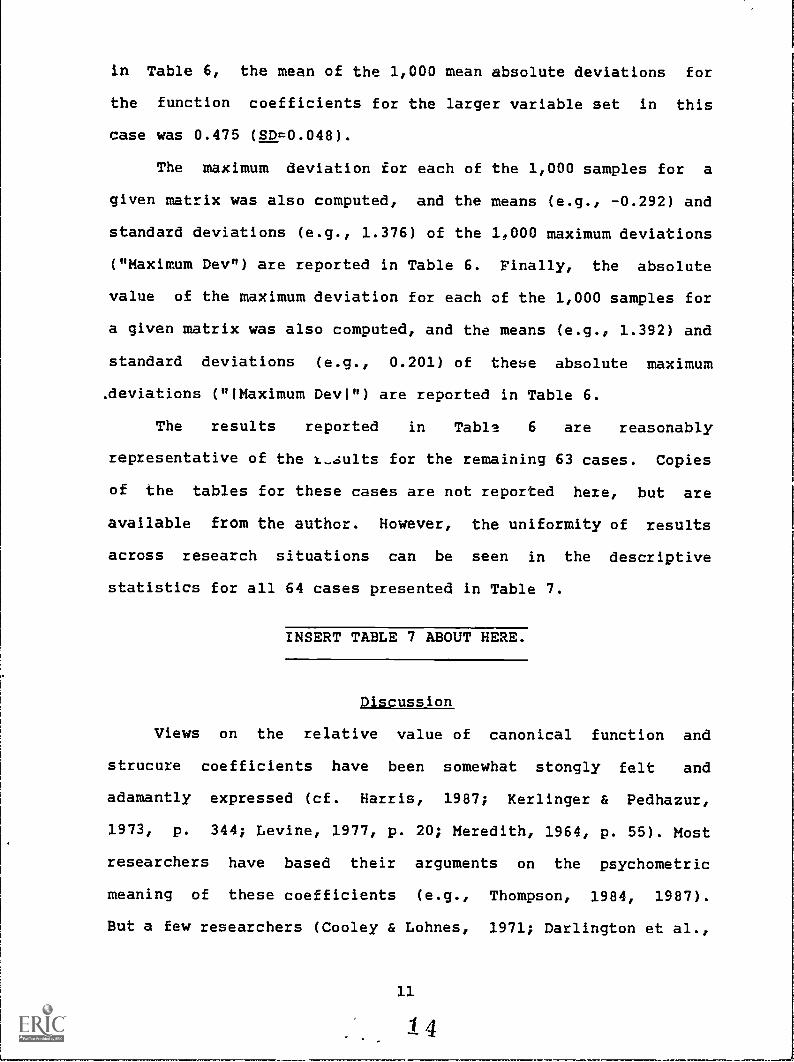
The maximum deviation for each of the 1,000 samples for a
given matrix was also computed, and the means (e.g., -0.292) and
standard deviations (e.g., 1.376) of the 1,000 maximum deviations
("Maximum Dev") are reported in Table 6. Finally, the absolute
value of the maximum deviation for each of the 1,000 samples for
a given matrix was also computed, and the means (e.g., 1.392) and
standard deviations (e.g., 0.201) of these absolute maximum
.deviations ("Maximum Devi") are reported in Table 6.
The results reported in Table 6 are reasonably
representative of the r_sults for the remaining 63 cases. Copies
of the tables for these cases are not reported here, but are
available from the author. However, the uniformity of results
across research situations can be seen in the descriptive
statistics for all 64 cases presented in Table 7.
INSERT TABLE 7 ABOUT HERE.
Discussion
Views on the relative value of canonical function and
strucure coefficients have been somewhat stongly felt and
adamantly expressed (cf. Harris, 1987; Kerlinger & Pedhazur,
1973, p. 344; Levine, 1977, p. 20; Meredith, 1964, p. 55). Most
researchers have based their arguments on the psychometric
meaning of these coefficients (e.g., Thompson, 1984, 1987).
But a few researchers (Cooley & Lohnes, 1971; Darlington et al.,
11
14
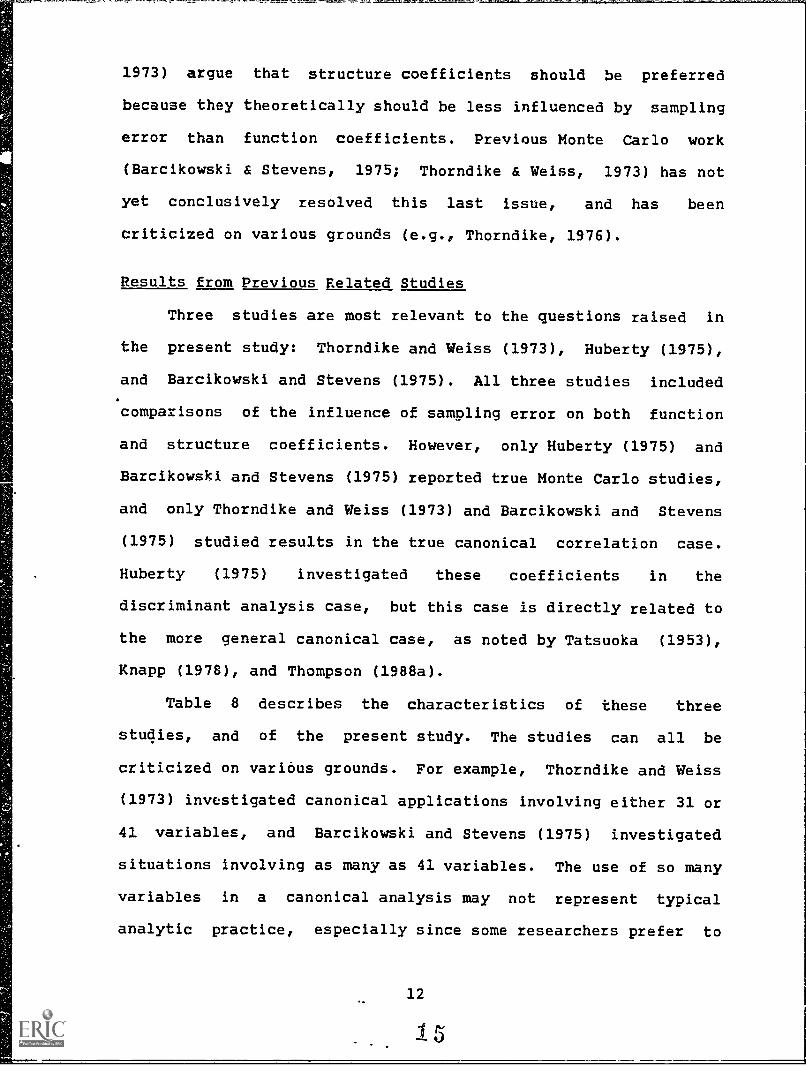
1973) argue that structure coefficients should be preferred
because they theoretically should be less influenced by sampling
error than function coefficients. Previous Monte Carlo work
(Barcikowski & Stevens, 1975; Thorndike & Weiss, 1973) has not
yet conclusively resolved this last issue, and has been
criticized on various grounds (e.g., Thorndike, 1976).
Results from Previous Related Studies
Three studies are most relevant to the questions raised in
the present study: Thorndike and Weiss (1973), Huberty (1975),
and Barcikowski and Stevens (1975). All three studies included
comparisons of the influence of sampling error on both function
and structure coefficients. However, only Huberty (1975) and
Barcikowski and Stevens (1975) reported true Monte Carlo studies,
and only Thorndike and Weiss (1973) and Barcikowski and Stevens
(1975) studied results in the true canonical correlation case.
Huberty (1975) investigated these coefficients in the
discriminant analysis case, but this case is directly related to
the more general canonical case, as noted by Tatsuoka (1953),
Knapp (1978), and Thompson (1988a).
Table 8 describes the characteristics of these three
studies, and of the present study. The studies can all be
criticized on various grounds. For example, Thorndike and Weiss
(1973) investigated canonical applications involving either 31 or
41 variables, and Barcikowski and Stevens (1975) investigated
situations involving as many as 41 variables. The use of so many
variables in a canonical analysis may not represent typical
analytic practice, especially since some researchers prefer to
12
1J
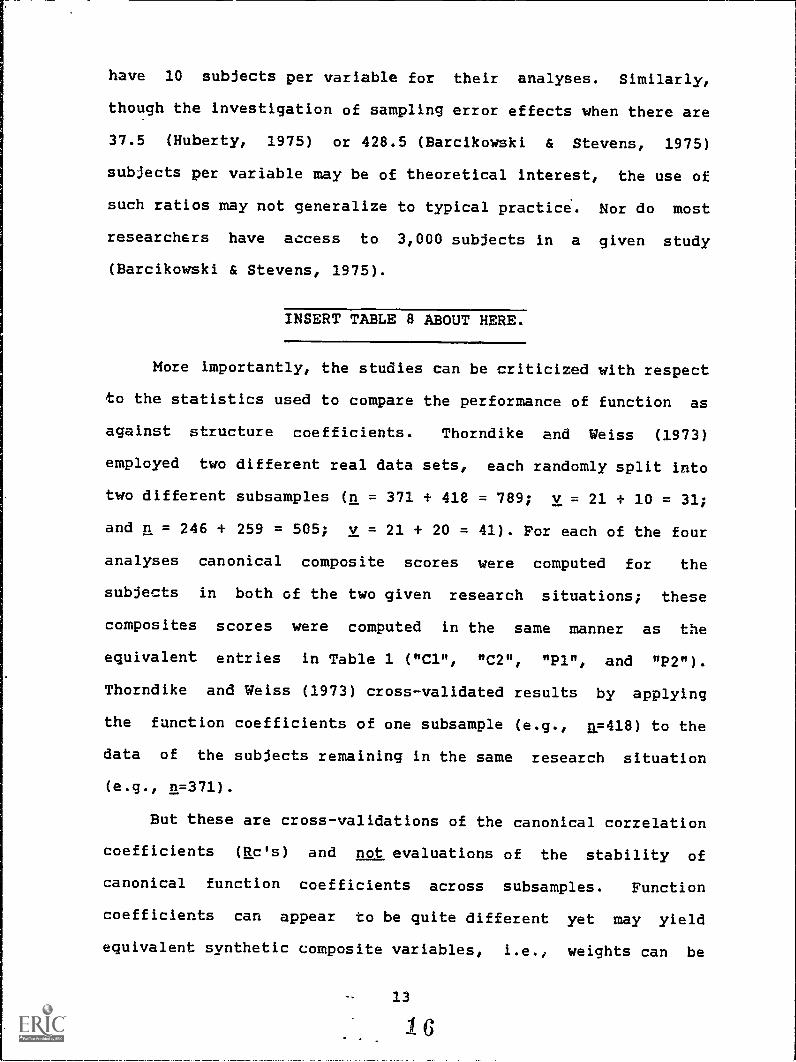
have 10 subjects per variable for their analyses. Similarly,
though the investigation of sampling error effects when there are
37.5 (Huberty, 1975) or 428.5 (Barcikowski & Stevens, 1975)
subjects per variable may be of theoretical interest, the use of
such ratios may not generalize to typical practice. Nor do most
researchers have access to 3,000 subjects in a given study
(Barcikowski & Stevens, 1975).
INSERT TABLE 8 ABOUT HERE.
More importantly, the studies can be criticized with respect
to the statistics used to compare the performance of function as
against structure coefficients. Thorndike and Weiss (1973)
employed two different real data sets, each randomly split into
two different subsamples (n = 371 + 41e = 789; v = 21 + 10 = 31;
and n = 246 + 259 = 505; v = 21 + 20 = 41). For each of the four
analyses canonical composite scores were computed for the
subjects in both of the two given research situations; these
composites scores were computed in the same manner as the
equivalent entries in Table 1 ("Cl", "C2", "P1 ", and "P2").
Thorndike and Weiss (1973) cross-validated results by applying
the function coefficients of one subsample (e.g., n=418) to the
data of the subjects remaining in the same research situation
(e.g., n=371).
But these are cross-validations of the canonical corzelation
coefficients (Rc's) and not evaluations of the stability of
canonical function coefficients across subsamples. Function
coefficients can appear to be quite different yet may yield
equivalent synthetic composite variables, i.e., weights can be
what Cliff (1987, pp. 177-178) calls statistically sensitive or
insensitive. "Insensitive" weights may result in good replication
of ac, but different interpretations of the meaning of the
functions might still result. Indeed, Barcikowski and Stevens
(1975, p. 363) note that, "The authors have several specific
examples of where this has happened, so that it appears that it
would not be unusual for it to happen in practice."
Huberty (1975) and Barcikowski and Stevens (1975), on the
other hand, both employed Kendall's coefficient of concordance to
compare results across 100 samples for each of the various
research situations they investigated. However, as Thorndike
(1976) notes, such procedures ignore fluctuations in the
magnitudes of coefficients across samples. Researchers do not
only interpret the ordering of variables with respect to a given
set of coefficients, but also consider the magnitudes of
coefficients for different variables. Evalzating stability of
rankings of variables across samples treats all fluctuations in
rankings as being equal in importance. As Thorndike (1976, p.
250) noted, "small changes in the numerical values of small
weights, which might result in substantial changes in rank, would
be of little consequence" as regards affecting the differential
interpretation of results.
Although results in any single study are inherently limited,
the results in these three previous studies merit some
consideration. Thorndike and Weiss (1973, p. 130) conclude that
"the canonical component loadings (structure coefficients] are
consistent in cross-validation and in this sense they are stable
14
and more useful than the canonical beta weights." But the basis
for this conclusion and the magnitude of stability differences is
not made entirely clear.
Huberty (1975, p. 63) concluded that
when the number of criterion groups is three, this
reliability [of structure coefficients) is
slightly higher than that of Index 1 [function
coefficients), and vice versa for five criterion
groups... Given a single run of the experiment,
none of the indices can be expected to be
sufficiently reliable to be of great practical
value in identifying potent variables unless the
total sample size is very large.
Barcikowski and Stevens (1975, pp. 363-364) concluded that,
For the examples considered the components
[structure coefficients) tended to be more
reliable more often for the largest canonical
correlation, especially when the correlations
among the variables within each set are fairly
high. The advantage of the components [structure
coefficients), however, seemed to decrease for the
second and third largest canonical correlations.
Barcikowski and Stevens (1975, pp. 364) also found that "The
number of subjects per variable necessary to achieve reliability
in determining the most important variables, using components or
coefficients, was quite large, ranging from 12/1 to 68/1."
Monte Carlo Results in the Present Study
3.5
1 8
In the current study, the results presented in Table 6 for
one of the 64 cases studied, similar results for the remaining 63
cases (available from the author), and the summary of all 64,000
canonical analysis presented in Table 7, all suggest that
function and structure coefficients are influenced by sampling
error t.r; roughly equal degrees. For example, one basis for
comparison would be the mean of the mean deviations in a given
matrix from the true known population parameters. As reported in
Table 6, for this one of the 64 population cases studied here,
across 1,000 samples the mean of the mean matrix deviations from
parameters for function and structure coefficients from the first
variable set, and for structure and function coefficients from
the second variable set, respectively, were -0.046 (SD=0.075),
-0.046 (SD=0.068), 0.089 (SD=0.062), and 0.079 (SD=0.068).
Furthermore, the mean of the mean matrix deviations was
consistently small and homogeneous across the 64 research
situations investigated in the present study. As reported in
Table 7, across the 64 population cases studied here, the average
mean of the mean matrix deviations from parameters for function
and structure coefficients from the first variable set, and for
structure and function coefficients from the second variable set,
respectively, were -0.035 (SD=0.068), -0.034 (SD=0.092), -0.044
(SD=0.123), and -0.042 (SD=0.093).
A comparison involving the largest deviation from known
parameters for a given matrix yields similar conclusions. As
reported in Table 6, for this one of the 64 population cases
studied here, the mean of the 1,000 maximum matrix deviations
from parameters for function and structure coefficients from the
16
19
first variable set, and for structure and function coefficients
from the second variable set, respectively, were -0.292
(SD=1.376), -0.347 (SD=1.309), 0.023 (SD=1.226), and 0.065
(SD=1.278).
Furthermore, the means of 1,000 maximum matrix deviations
were consistently small and homogeneous across the 64 research
situations investigated in the present study. As reported in
Table 7, across the 64 population cases studied here, the average
mean of the maximum matrix deviations from parameters for
function and structure coefficients from the first variable set,
and for structure and function coefficients from the second
variable set, respectively, were -0.080 (SD=0.468), -0.089
(SD=0.436), -0.028 (SD=0.336), and -0.005 (SD=0.384).
Comparisons based on the absolute values of the largest
deviations from known population parameters also tend to suggest
that function and structure coefficients are roughly equally
affected by sampling error influences. For example, as noted in
Table 7, across the 64 population cases studied here, the average
mean of the mean absolute matrix deviations from parameters for
function and structure coefficients from the first variable set,
and for structure and function coefficients from the second
variable set, respectively, were 0.355 (SD=0.156), 0.325
(SD=0.137), 0.292 (SD=0.175), and 0.318 (SD=0.178). Similarly, as
reported in Table 7, across the 64 population cases studied here,
the average mean of the absolute maximum matrix deviations from
parameters for function and structure coefficients from the first
variable set, and for structure and function coefficients from

the second variable set, respectively, were 1.192 (SD=0.435),
1.053 (SD=0.397), 0.889 (SD=0.533), and 0.972 (SD=0.587).
Overall, as indicated by results presented in Table 7, some
results in the present suggest that function coefficients are
less influenced by sampling error than are structure
coefficients. For example, as reported in Table 7, the average
mean of matrix deviations for functions coefficients for the
smaller variable set was -0.042 (SD=0.093), while the average
mean of matrix deviations for structure coefficients for the
smaller variable set was -0.044 (SD=0.123). But contradictory
results are also available. For example, the average mean of
matrix deviations for structure coefficients for the larger
variable set was -0.034 (SD=0.092), while the average mean of
matrix deviations for function coefficients for the larger
variable set was -0.035 (SD=0.068).
In general, the results do not indicate that either type of
coefficient is inherently less sensitive to sampling error,
notwithstanding previous speculation (e.g., Cooley & Lohnes,
1971, p. 55; Darlington et al., 1973). This tends to be true
across different frameworks for comparison, including some not
reported here (e.g., maximum and absolute maximum deviations from
known population parameters only on the first function).
Differences are somewhat more likely when population intradomain
correlation coefficients are larger, and in these cases function
coefficients appeared to be somewhat less sensitive to sampling
error. A greater number of cases in which intradomain correlation
coefficients were larger might have resulted in more differences
in the comparisons of effects of sampling error on function as
18
21
against structure coefficients. Still, it appears that any
preference for interpretation of one coefficient over the other
must be primarily based on psychometric grounds rather than on
the basis of estimate stability.
These resuats are consistent with previous research,
although this research has been limited, as noted. Huberty (1975)
reported that structure coefficients were less sensitive to
sampling error with k=3 criterion variable groups, but that
function coefficients tended to be superior with k=5 groups.
Similarly, Barcikowski and Stevens (1975) found that on the first
canonical function structure coefficients tended to be less
sensitive to sampling error, but that the superiority of
structure coefficients tended to decrease for the second and
third functions. Thus, results do not consistently suggest that a
particular set of coefficients is less sensitive to sampling
error.
In summary, good psychometric arguments can be offered that
researchers must consider structure coefficients when
interpreting canonical results (Thompson, 1987, 1988a; Thompson &
Borrello, 1985). Interpretations based only on function
coefficients can be seriously misleading. But results in previous
studies (Barcikowski & Stevens, 1975; Huberty, 1975; Thorndike &
Weiss, 1973) and in the present study do not suggest that either
structure or function coefficients are inherently differentially
sensitive to sampling error.
References
Barcikowski, R.S., & Stevens, J.P. (1975). A Monte Carlo study of
the stability of canonical correlations, canonical weights and
canonical variate-variable correlations. Multivariate
Behavioral Research, 10, 353-364.
Cliff, N. (1987). Analyzing multivariate data. San Diego:
Harcourt Brace Javanovich.
Cooley, W.W., & Lohnes, P.R. (1971). 4ultivariate data analysis.
New York: Irvington.
Darlington, R.B., Weinberg, S.L., & Walberg, H.J. (1973).
Canonical variate analysis and related techniques. Review of
Educational Research, 93, 433-454.
Elmore, P.B., & Woehlke, P.L. (1988, April). Research methods
employed in American Educational Research Journal, Educational
Researcher, and Review of Educational Research from 1978 to
1987. Paper presented at the annual meeting of the American
Educational Research Association, New Orleans.
Fish, L.J. (1988). Why multivariate oethods are usually vital.
Measurement and Evaluation in Counseling and Development, 21,
130-137.
Gaither, N., & Glorfeld, L. (1985). An evaluation of the use of
tests of significance in organizational behavior research.
Academy of Management Review, 10, 787-793.
Goodwin, L.D., & Goodwin, W.L. (1985). Statistical techniques in
AERJ articles, 1979-1933: The preparation of graduate students
to read the educational research literature. Educational
Researcher, 14(2), 5-11.
Harris, R. J. (1987, April). A canonical cautionary. Paper
20
23

presented at the annual meeting of the Society for
Multivariate Experimental Psychology--Southwestern Division,
New Orleans.
Hinkle, D.E., Wiersma, W., & Jurs, S.G. (1979). Applies
statistics for the behavioral sciences. Chicago: Rand McNally.
Hopkins, C.D. (1980). Understanding educational research: An
inquiry approach. New York: Holt, Rinehart and Winston.
Hotelling, H. (1935). The most predictable criterion. Journal of
Experimental Psychology, 21, 139-142.
Huberty, C.J. (1975). The stability of three indices of relative
variable contribution in discriminant analysis. Journal of
Experimental Education, 44(2), 59-64.
Kerlinger, F.N. (1973). Foundations of behavioral research (2nd
ed.). New York: Holt, Rinehart and Winston.
Kerlinger, F.N., & Pedhazur, E.J. (1973). Multiple regression in
the behavioral research. New York: Holt, Rinehart and Winston.
Knapp, T.R. (1978). Canonical correlation analysis: A general
parametric significance-testing system. Psychological
Bulletin, 85, 410-416.
Levine, M.S. (1977). Canonical analysis and factor comparison.
Menlo Park: SAGE.
Marascuilo, L.A., & Levin, J.R. (1983). Multivariate statistics
in the social sciences. Monterey, CA: Brooks/Cole.
McMillan, J.H., & Schumacher, S. (1984). Research in education: A
conceptual approach. Boston: Little, Brown.
Meredith, W. (1964). Canonical correlations with fallible data.
asychometrika, 21, 55-65.
Moore, G.W. (1983). Developing and evaluating educational
research. Boston: Little, Brown.
Morris, J.D. (1975). A computer program to create a population
with any desired centroid and covariance matrix. Educational
and Psychological Measurement, 35, 707-710.
Tatsuoka, M.M. (1953). The relationship between canonical
correlation and discriminant analysis. Cambridge, MA:
Educational Research Corporation.
Thompson, B. (1980, April). Canonical correlation: Recent
extensions for modelling educational processes. Paper
. presented at the annual meeting of the American Educational
Research Association, Boston. (ERIC Document Reproduction
Service No. ED 199 269)
Thompson, B. (1984). Canonical correlation analysis. Menlo Park:
SAGE.
Thompson, B. (1986a). ANOVA versus regression analysis of ATI
designs: An empirical investigation. Educational and
Psychological Measurement, 46, 917-928.
Thompson, B. (1986b, April). A partial test distributira for
cosines among factors across samples. Paper presented at the
ann,4a1 meeting of the American Educational Research
Association, San Francisco.
Thompson, B. (1986c, November). Two reasons, why multivariate
methods are usually vital. Paper presented at the annual
meeting of the Mid-South Educational Research Association,
Memphis.
Thompson, B. (1987, April). Fundamentals of canonical correlation
analysis: Basics and three common fallacies in interpretation.
Paper presented as the Featured Speaker at the annual meeting
of the Society for Multivariate Experimental Psychology- -
Southwest Division, New Orleans. (ERIC Document Reproduction
Service No. ED 282 904)
Thompson, B. (1988a, April). Canonical correlation analysis: An
explanation yith comments on correct practice. Paper presented
at the annual meeting of the American Educational Research
AssoGiation, New Orleans. (ERIC Document keproducticI Service
No. ED 295 957)
Thompson, B. (1988b). Misuse of chi-square contingency table test
statistics. Educational and Psychological Research, 8, 39-49.
Thompson, B. (1988c). A note about significance testing.
Measurement and Evaluation in Counseling. and Development, 20,
146-148.
Thompson, B., & Borrello, G.M. (1985). The importance of
structure coefficients in regression research. Educational and
Psychological Measurement, /5, 203-209.
Thorndike, R.M. (1976). Studying canonical analysis: Comments on
Barcikowski and Stevens. Multivariate Behavioral Research, 11,
249-253.
Thorndike, R.M., & Weiss, D.J. (1973). A study of the stability
of canonical correlations and canonical components.
Educational and Esychological Research, 33, 123-184.
Timm, N.H., & Carlson, J.E. (1976). Part and bipartial canonical
correlation analysis. Psychometrika, Al, 159-176.
23
2G

Table 1Hypothetical Observed and Latent Scores
X Y AB ZX ZY ZA ZB Cl C2 Al P21 11 51 -1.525 1.248 -.416 .957 .303 -1.934 -.182 -.9952 5 3 1 -1.248 -.416 -.971 .957 -.998 -.866 -.733 -1.0763 2 2 1 -.971 -1.248 -1.248 .957 -1.578 -.212 -1.009 -1.1174 8 8 0 -.693 .416 .416 -.957 .006 -.804 .182 .9955 4 4 0 -.416 -.693 -.693 -.957 -.814 -.012 -.921 .8326 12 10 1 -.139 1.525 .971 .957 1.251 -.880 1.197 -.7917 7 6 1 .139 .139 -.139 .957 .191 .050 .094 -.9548 1 1 0 .416 -1.525 -1.525 -.957 -1.110 1.118 -1.748 .7109 9 12 0 .693 .693 1.525 -.957 .955 .250 1.284 1.15710 3 7 0 .971 -.971 .139 -.957 -.346 1.319 -.094 .95411 6 9 0 1.248 -.139 .693 -.957 .517 1.142 .457 1.03512 10 11 1 1.525 .971 1.248 .957 1.621 .827 1.472 -.750
Note. Variables "X", "Y", "A", and "B", and their 2 -scoreequivalents are "observed" scores. The remaining scores are"latent" or "synthetic" scores since they are created by addingtogether the observed scores once they have been weighted bycoefficients analogous to beta weights, i.e., the canonicalfunction coefficients.
Vaziable/Coefficient
Table 2Canonical Results for Hypothetical Data
Function I Coefficients Function II CoefficientsFunc Str Sq S Index Func Str Sq S Index
2
hX .511 .499 24.87% .470 .860 .867 75.13% .460 1.000
.867 .860 73.91% .809 -.499 -.511 26.09% -.271 1.000Adequacy 49.39% 50.61%Redundancy 43.78% 14.24%2
Rc 88.63% 28.13%
Redundancy 42.69% 14.58%Adequacy 48.17% 51.83%A .994 .971 94.20% .914 .147 .241 5.80% .128 1.000B .242 .146 2.13% .138 -.975 -.989 97.87% -.525 1.000
24
27
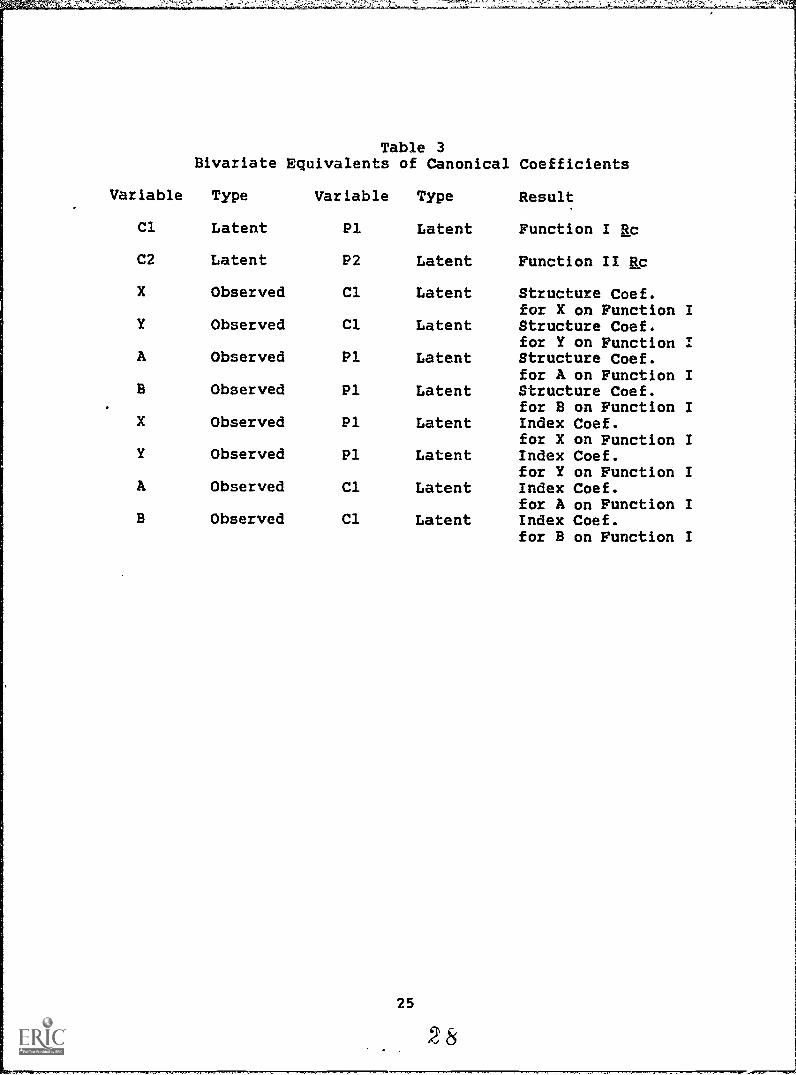
Table 3Bivariate Equivalents of Canonical Coefficients
Result
Function I Rc
Function II Rc
Variable Type Variable Type
Cl Latent P1 Latent
C2 Latent P2 Latent
X Observed Cl Latent
Y Observed Cl Latent
A Observed P1 Latent
B Observed P1 Latent
X Observed P1 Latent
Y Observed P1 Latent
A Observed Cl Latent
B Observed Cl Latent
Structure Coef.for X on Function IStructure Coef.for Y on Function TaStructure Coef.for A on Function IStructure Coef.for B on Function IIndex Coef.for X on Function IIndex Coef.for Y on Function IIndex Coef.for A on Function IIndex Coef.for B on Function I
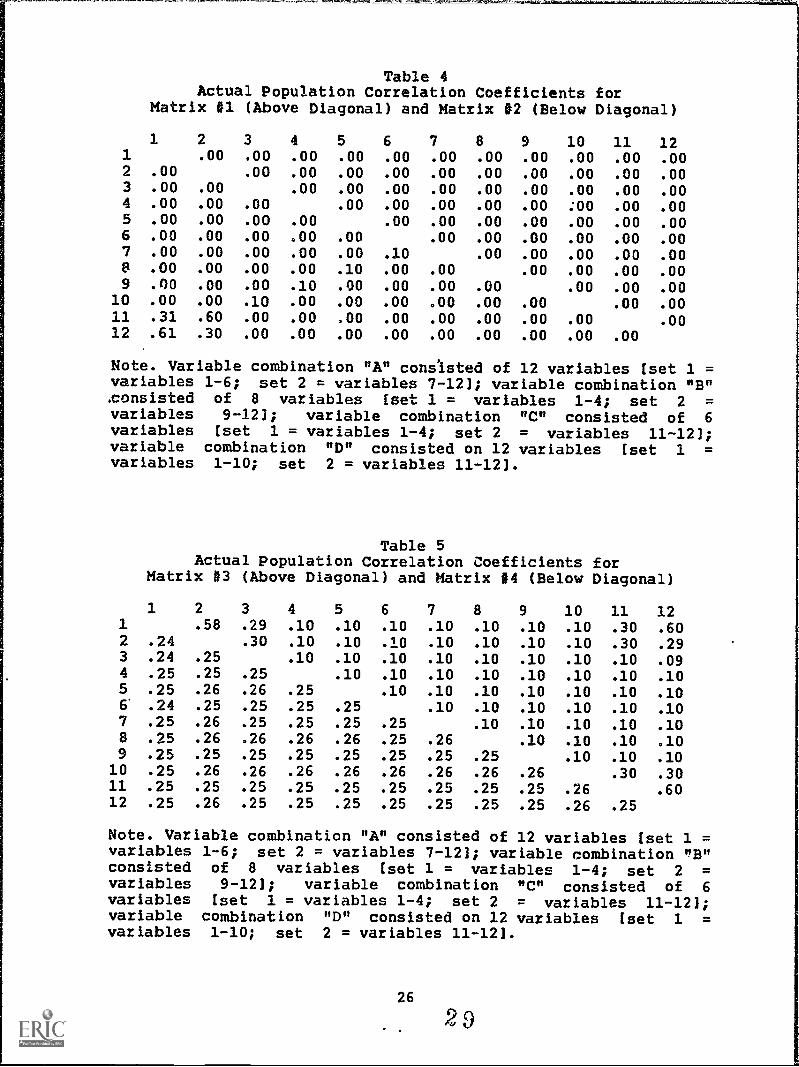
Table 4Actual Population Correlation Coefficients for
Matrix #1 (Above Diagonal) and Matrix #2 (Below Diagonal)
1 2 3 4 5 6 7 8 9 10 11 121 .00 .00 .00 .00 .00 .00 .00 .00 .00 .00 .002 .00 .00 .00 .00 .00 .00 .00 .00 .00 .00 .003 .00 .00 .00 .00 .00 .00 .00 .00 .00 .00 .004 .00 .00 .00 .00 .00 .00 .00 .00 :00 .00 .005 .00 .00 .00 .00 .00 .00 .00 .00 .00 .00 .006 .00 .00 .00 .00 .00 .00 .00 .00 .00 .00 .007 .00 .00 .00 .00 .00 .10 .00 .00 .00 .00 .008 .00 .00 .00 .00 .10 .00 .00 .00 .00 .00 .009 .00 .00 .00 .10 .00 .00 .00 .00 .00 .00 .00
10 .00 .00 .10 .00 .00 .00 .00 .00 .00 .00 .0011 .31 .60 .00 .00 .00 .00 .00 .00 .00 .00 .0012 .61 .30 .00 .00 .00 .00 .00 .00 .00 .00 .00
Note. Variable combination "A" cons'isted of 12 variables [set 1 =variables 1-6; set 2 = variables 7-121; variable combination "B".consisted of 8 variables (set 1 = variables 1-4; set 2 =variables 9-121; variable combination "C" consisted of 6variables [set 1 = variables 1-4; set 2 = variables 11-12];variable combination "D" consisted on 12 variables [set 1 =variables 1-10; set 2 = variables 11-121.
Table 5Actual Population Correlation Coefficients for
Matrix #3 (Above Diagonal) and Matrix #4 (Below Diagonal)
1 2 3 4 5 6 7 8 9 10 11 121 .58 .29 .10 .10 .10 .10 .10 .10 .10 .30 .602 .24 .30 .10 .10 .10 .10 .10 .10 .10 .30 .293 .24 .25 .10 .10 .10 .10 .10 .10 .10 .10 .094 .25 .25 .25 .10 .10 .10 .10 .10 .10 .10 .105 .25 .26 .26 .25 .10 .10 .10 .10 .10 .10 .106' .24 .25 .25 .25 .25 .10 .10 .10 .10 .10 .107 .25 .26 .25 .25 .25 .25 .10 .10 .10 .10 .108 .25 .26 .26 .26 .26 .25 .26 .10 .10 .10 .109 .25 .25 .25 .25 .25 .25 .25 .25 .10 .10 .1010 .25 .26 .26 .26 .26 .26 .26 .26 .26 .30 .3011 .25 .25 .25 .25 .25 .25 .25 .25 .25 .26 .6012 .25 .26 .25 .25 .25 .25 .25 .25 .25 .26 .25
Note. Variable combination "A" consisted of 12 variables (set 1 =variables 1-6; set 2 = variables 7-121; variable combination "B"consisted of 8 variables [set 1 = variables 1-4; set 2 =variables 9-121; variable combination "C" consisted of 6variables iset 1 = variables 1-4; set 2 = variables 11-12];variable combination "D" consisted on 12 variables [set 1 =variables 1-10; set 2 = variables 11-12].
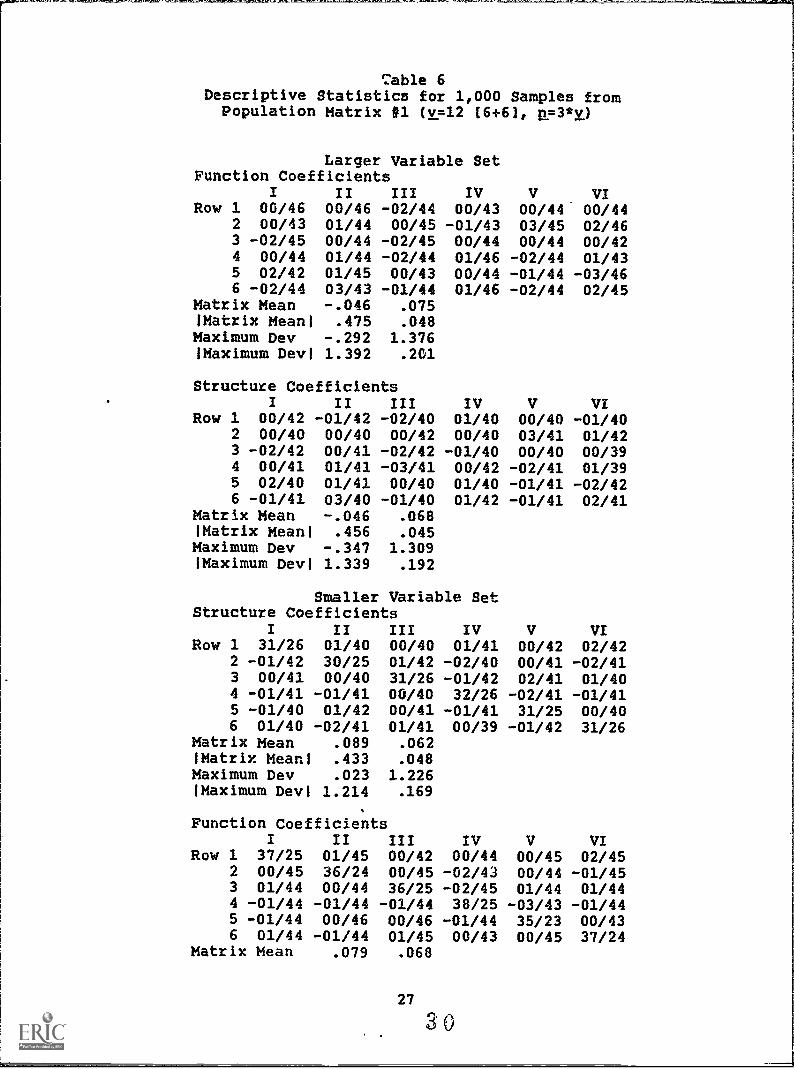
Table 6Descriptive Statistics for 1,000 Samples fromPopulation Matrix #1 (v=12 16+6), R=3*v)
Larger Variable SetFunction Coefficients
I II III IV V VIRow 1 00/46 00/46 -02/44 00/43 00/44 00/44
2 00/43 01/44 00/45 -01/43 03/45 02/463 -02/45 00/44 -02/45 00/44 00/44 00/424 00/44 01/44 -02/44 01/46 -02/44 01/435 02/42 01/45 00/43 00/44 -01/44 -03/466 -02/44 03/43 -01/44 01/46 -02/44 02/45
Matrix Mean -.046 .075'Matrix Mean! .475 .048Maximum Dev -.292 1.376'Maximum Devi 1.392 .201
Structure CoefficientsI II III IV V VI
Row 1 00/42 -01/42 -02/40 01/40 00/40 -01/402 00/40 00/40 00/42 00/40 03/41 01/423 -02/42 00/41 -02/42 -01/40 00/40 00/394 00/41 01/41 -03/41 00/42 -02/41 01/395 02/40 01/41 00/40 01/40 -01/41 -02/426 -01/41 03/40 -01/40 01/42 -01/41 02/41
Matrix Mean -.046 .068'Matrix Meant .456 .045Maximum Dev -.347 1.309'Maximum Devi 1.339 .192
Smaller Variable SetStructure Coefficients
I II III IV V VIRow 1 31/26 01/40 00/40 01/41 00/42 02/42
2 -01/42 30/25 01/42 -02/40 00/41 -02/413 00/41 00/40 31/26 -01/42 02/41 01/404 -01/41 -01/41 00/40 32/26 -02/41 -01/415 -01/40 01/42 00/41 -01/41 31/25 00/406 01/40 -02/41 01/41 00/39 -01/42 31/26
Matrix Mean .089 .062'Matrix Meant .433 .048Maximum Dev .023 1.226'Maximum Devi 1.214 .169
Function CoefficientsI II III IV V VI
Row 1 37/25 01/45 00/42 00/44 00/45 02/452 00/45 36/24 00/45 -02/43 00/44 -01/453 01/44 00/44 36/25 -02/45 01/44 01/444 -01/44 -01/44 -01/44 38/25 -03/43 -01/445 -01/44 00/46 00/46 -01/44 35/23 00/436 01/44 -01/44 01/45 00/43 00/45 37/24
Matrix Mean .079 .068
27
30
!Matrix Meant .448 .049Maximum Dev .065 1.278!Maximum Devi 1.265 .187
28
31
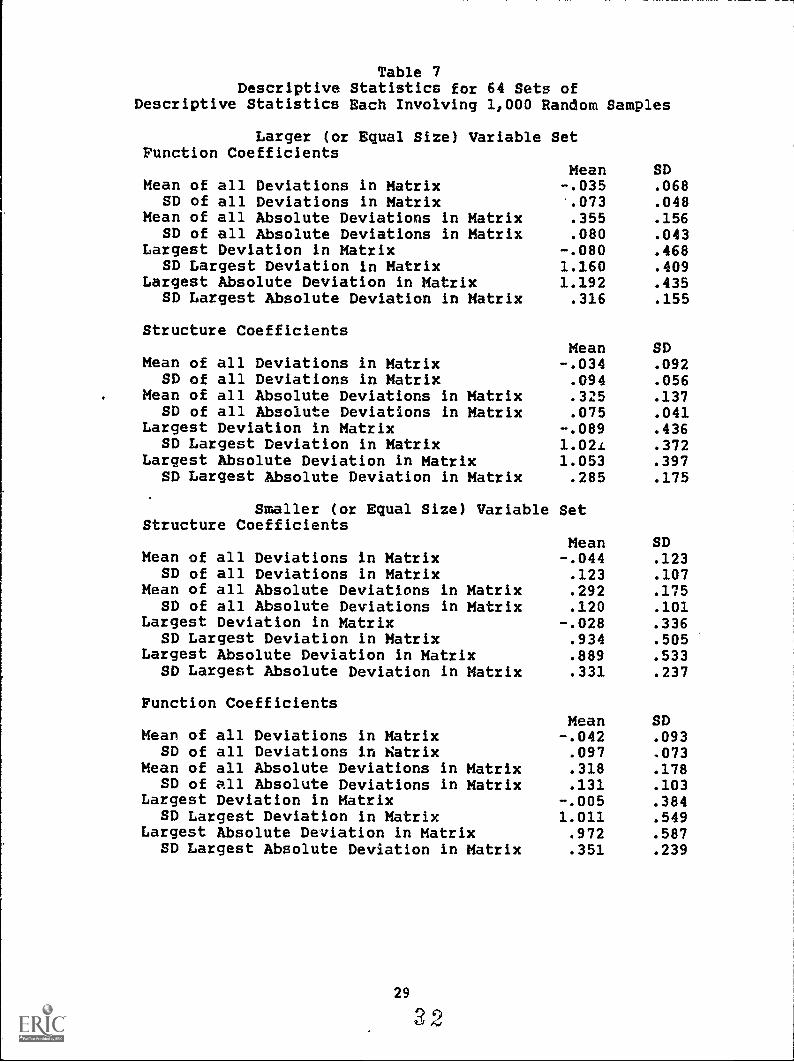
Table 7Descriptive Statistics for 64 Sets of
Descriptive Statistics Each Involving 1,000 Random Samples
Larger (or Equal Size) Variable SetFunction Coefficients
Mean of all Deviations in MatrixSD of all Deviations in Matrix
Mean of all Absolute Deviations in MatrixSD of all Absolute Deviations in Matrix
Mean-.035'.073.355.080
SD.068.048.156.043
Largest Deviation in Matrix -.080 .468SD Largest Deviation in Matrix 1.160 .409
Largest Absolute Deviation in Matrix 1.192 .435SD Largest Absolute Deviation in Matrix .316 .155
Structure CoefficientsMean SD
Mean of all Deviations in Matrix -.034 .092SD of all Deviations in Matrix .094 .056
Mean of all Absolute Deviations in Matrix .325 .137SD of all Absolute Deviations in Matrix .075 .041
Largest Deviation in Matrix -.089 .436SD Largest Deviation in Matrix 1.021 .372
Largest Absolute Deviation in Matrix 1.053 .397SD Largest Absolute Deviation in Matrix .285 .175
Smaller (or Equal Size) Variable SetStructure Coefficients
Mean of all Deviations in MatrixSD of all Deviations in Matrix
Mean of all Absolute Deviations in MatrixSD of all Absolute Deviations in Matrix
Mean-.044.123.292.120
SD.123.107.175.101
Largest Deviation in Matrix -.028 .336SD Largest Deviation in Matrix .934 .505
Largest Absolute Deviation in Matrix .889 .533SD Largest Absolute Deviation in Matrix .331 .237
Function CoefficientsMean SD
Mean of all Deviations in Matrix -.042 .093SD of all Deviations in Matrix .097 .073
Mean of all Absolute Deviations in Matrix .318 .178SD of all Absolute Deviations in Matrix .131 .103
Largest Deviation in Matrix -.005 .384SD Largest Deviation in Matrix 1.011 .549
Largest Absolute Deviation in Matrix .972 .587SD Largest Absolute Deviation in Matrix .351 .239
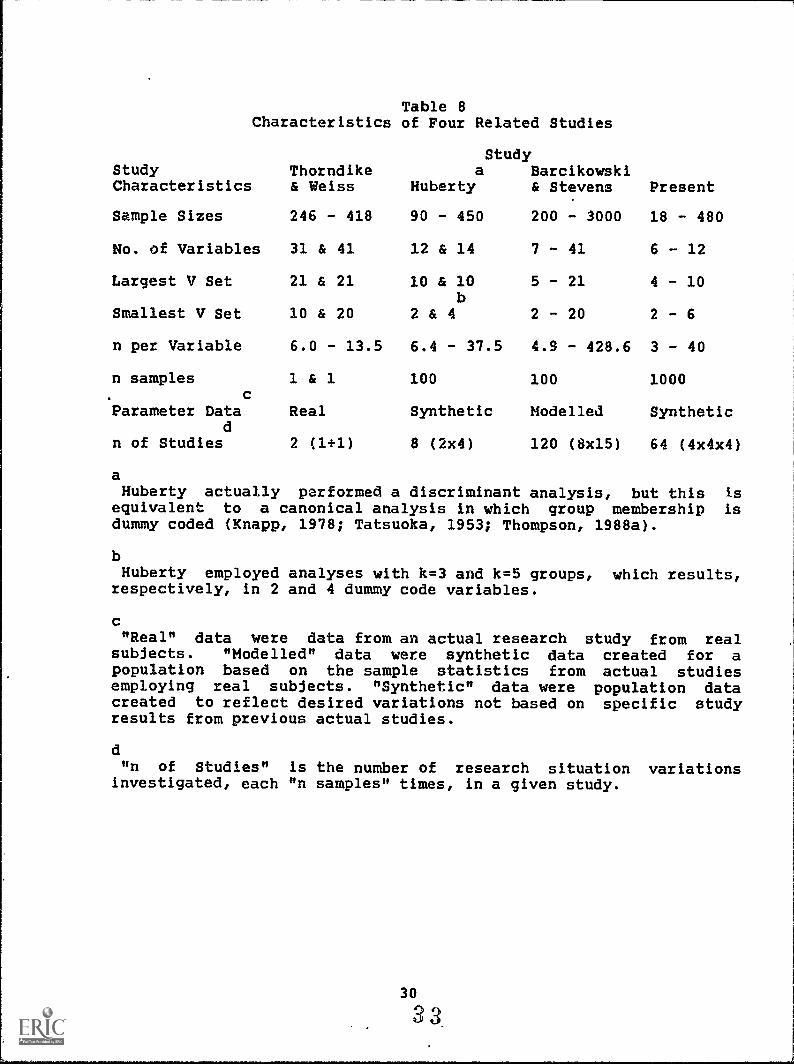
Table 8Characteristics of Four Related Studies
StudyStudy Thorndike a BarcikowskiCharacteristics & Weiss Huberty & Stevens
Sample Sizes 246 - 418 90 - 450 200 - 3000
Present
18 - 480
No. of Variables 31 & 41 12 & 14 7 - 41 6 - 12
Largest V Set 21 & 21 10 & 10b
5 - 21 4 - 10
Smallest V Set 10 & 20 2 & 4 2 - 20 2 - 6
n per Variable 6.0 - 13.5 6.4 - 37.5 4.9 - 428.6 3 - 40
n samplesc
1 & 1 100 100 1000
Parameter Datad
Real Synthetic Modelled Synthetic
n of Studies 2 (1+1) 8 (2x4) 120 (8x15) 64 (4x4x4)
aHuberty actually performed a discriminant analysis, but this is
equivalent to a canonical analysis in which group membership isdummy coded (Knapp, 1978; Tatsuoka, 1953; Thompson, 1988a).
bHuberty employed analyses with k=3 and k=5 groups, which results,
respectively, in 2 and 4 dummy code variables.
"Real" data were data from an actual research study from realsubjects. "Modelled" data were synthetic data created for apopulation based on the sample statistics from actual studiesemploying real subjects. "Synthetic" data were population datacreated to reflect desired variations not based on specific studyresults from previous actual studies.
d"n of Studies" is the number of research situation variations
investigated, each "n samples" times, in a given study.
30
2+
1+C I
ri
te 0+
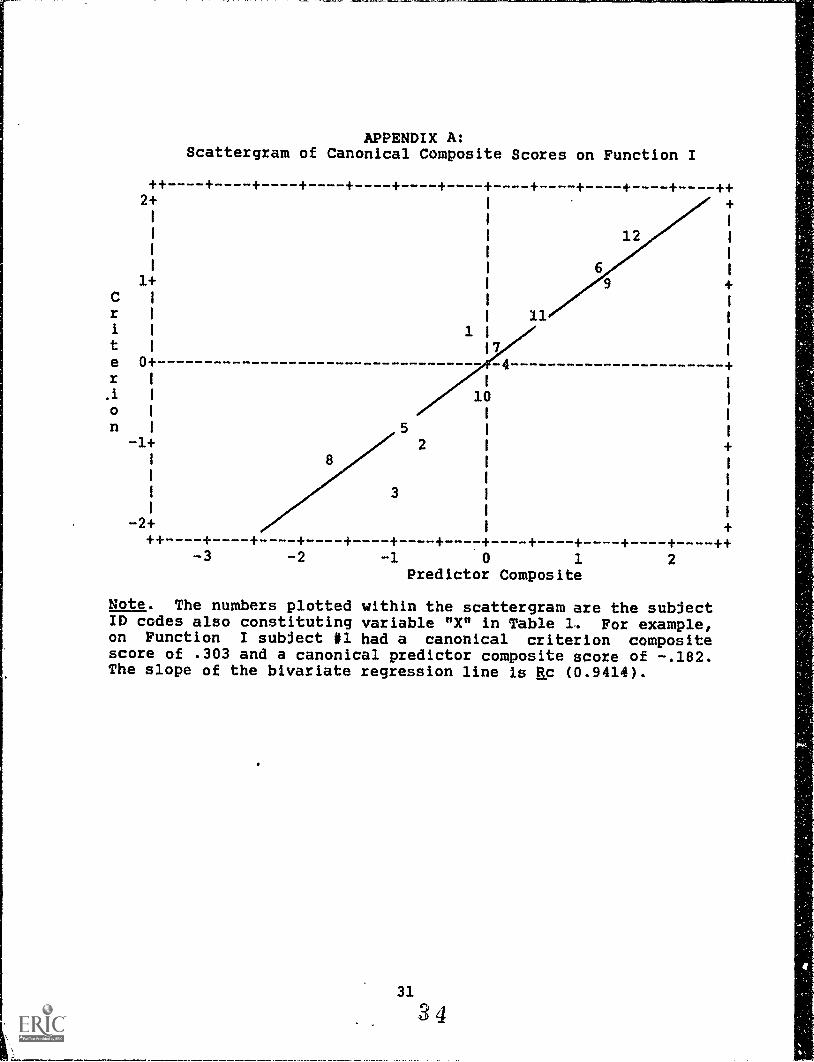
APPENDIX A:Scattergram of Canonical Composite Scores on Function I
17
4r
.1 1
on I
-1+ 2I
-2+
8
3
1
12
11
-3 -2 -1 0 1 2
Predictor Composite
Note. The numbers plotted within the scattergram are the subjectID codes also constituting variable "X" in Table 1. For example,on Function I subject 111 had a canonical criterion compositescore of .303 and a canonical predictor composite score of -.182.The slope of the bivariate regression line is Rc (0.9414).
31
34
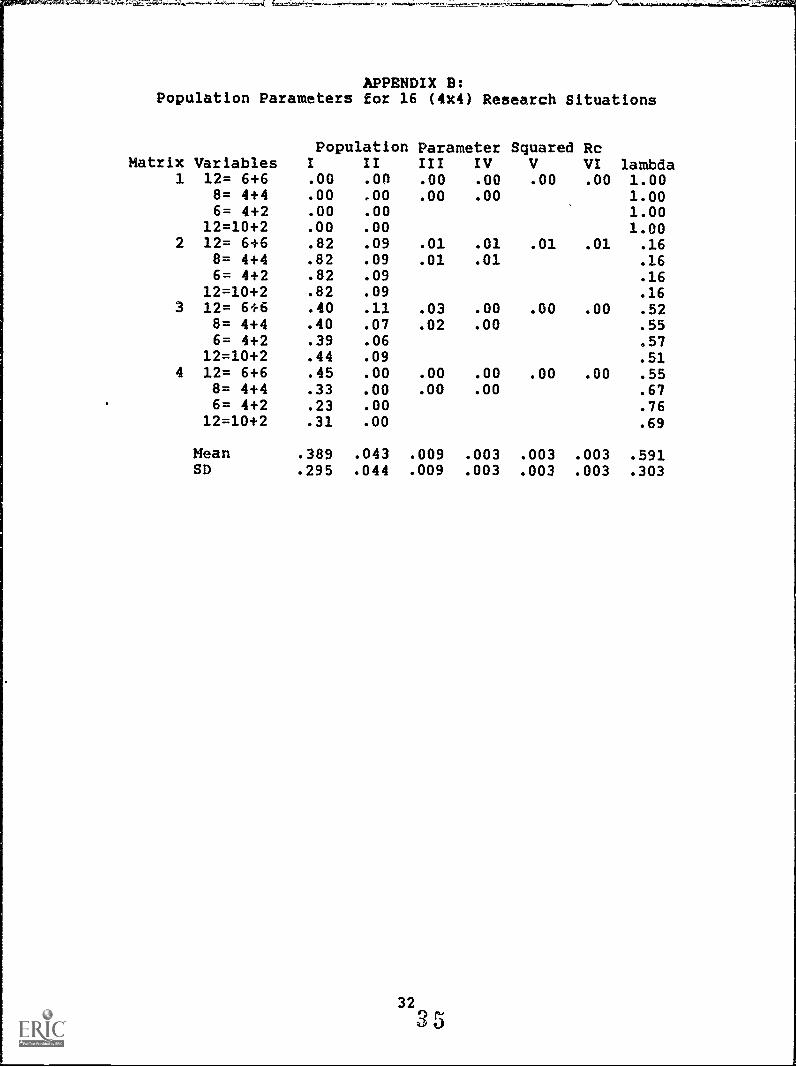
APPENDIX B:Population Parameters for 16 (4x4) Research Situations
Matrix VariablesPopulation Parameter
I II III IVSquared
VRcVI lambda
1 12= 6+6 .00 .00 .00 .00 .00 .00 1.008= 4+4 .00 .00 .00 .00 1.006= 4+2 .00 .00 1.00
12=10+2 .00 .00 1.002 12= 6+6 .82 .09 .01 .01 .01 .01 .16
8= 4+4 .82 .09 .01 .01 .166= 4+2 .82 .09 .16
12=10+2 .82 .09 .163 12= 6+6 .40 .11 .03 .00 .00 .00 .52
8= 4+4 .40 .07 .02 .00 .556= 4+2 .39 .06 .57
12=10+2 .44 .09 .514 12= 6+6 .45 .00 .00 .00 .00 .00 .55
8= 4+4 .33 .00 .00 .00 .676= 4+2 .23 .00 .76
12=10+2 .31 .00 .69
Mean .389 .043 .009 .003 .003 .003 .591SD .295 .044 .009 .003 .003 .003 .303
canmonts.big 3/6/89
APPENDIX C:
Complete Set of Descriptive statistics for 64 Sets ofDescriptive Statistics Each Involving 1,000 Samples
Note. The layout of the tables is explained in the narrative.
33
3G
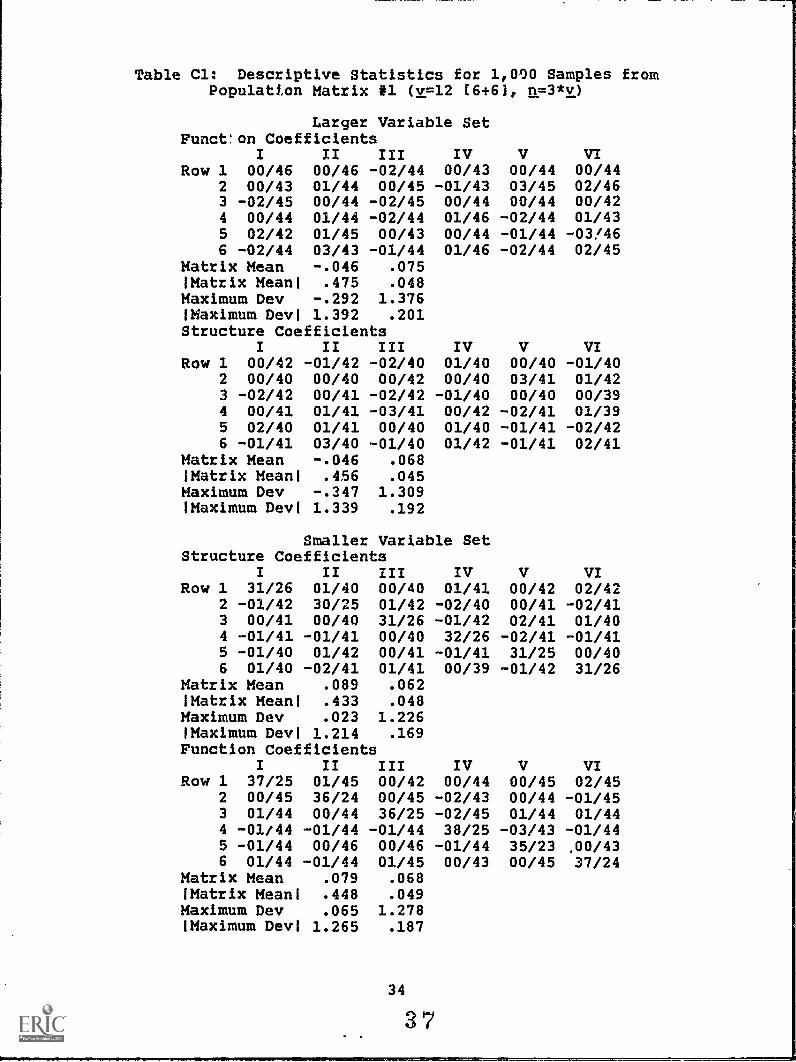
Table Cl: Descriptive Statistics for 1,000 Samples fromPopulation Matrix fa (v=12 (6+611 n=3*v)
Larger Variable SetFunct:on Coefficients
I II III IV V VIRow 1 00/46 00/46 -02/44 00/43 00/44 00/44
2 00/43 01/44 00/45 -01/43 03/45 02/463 -02/45 00/44 -02/45 00/44 00/44 00/424 00/44 01/44 -02/44 01/46 -02/44 01/435 02/42 01/45 00/43 00/44 -01/44 -03/466 -02/44 03/43 -01/44 01/46 -02/44 02/45
Matrix Mean -.046 .075Matrix Mean! .475 .048Maximum Dev -.292 1.376Maximum Devi 1.392 .201Structure Coefficients
I II III IV V VIRow 1 00/42 -01/42 -02/40 01/40 00/40 -01/40
2 00/40 00/40 00/42 00/40 03/41 01/423 -02/42 00/41 -02/42 -01/40 00/40 00/394 00/41 01/41 -03/41 00/42 -02/41 01/395 02/40 01/41 00/40 01/40 -01/41 -02/426 -01/41 03/40 -01/40 01/42 -01/41 02/41
Matrix Mean -.046 .068!Matrix Mean' .456 .045Maximum Dev -.347 1.309'Maximum Devi 1.339 .192
Smaller Variable SetStructure Coefficients
I II III IV V VIRow 1 31/26 01/40 00/40 01/41 00/42 02/42
2 -01/42 30/25 01/42 -02/40 00/41 -02/413 00/41 00/40 31/26 -01/42 02/41 01/404 -01/41 -01/41 00/40 32/26 -02/41 -01/415 -01/40 01/42 00/41 -01/41 31/25 00/406 01/40 -02/41 01/41 00/39 -01/42 31/26
Matrix Mean .089 .062!Matrix Meant .433 .048Maximum Dev .023 1.226!Maximum Dev! 1.214 .169Function Coefficients
I II III IV V VIRow 1 37/25 01/45 00/42 00/44 00/45 02/45
2 00/45 36/24 00/45 -02/43 00/44 -01/453 01/44 00/44 36/25 -02/45 01/44 01/444 -01/44 -01/44 -01/44 38/25 -03/43 -01/445 -01/44 00/46 00/46 -01/44 35/23 .00/436 01/44 -01/44 01/45 00/43 00/45 37/24
Matrix Mean .079 .068(Matrix Meanl .448 .049Maximum Dev .065 1.278!Maximum Dev( 1.265 .187
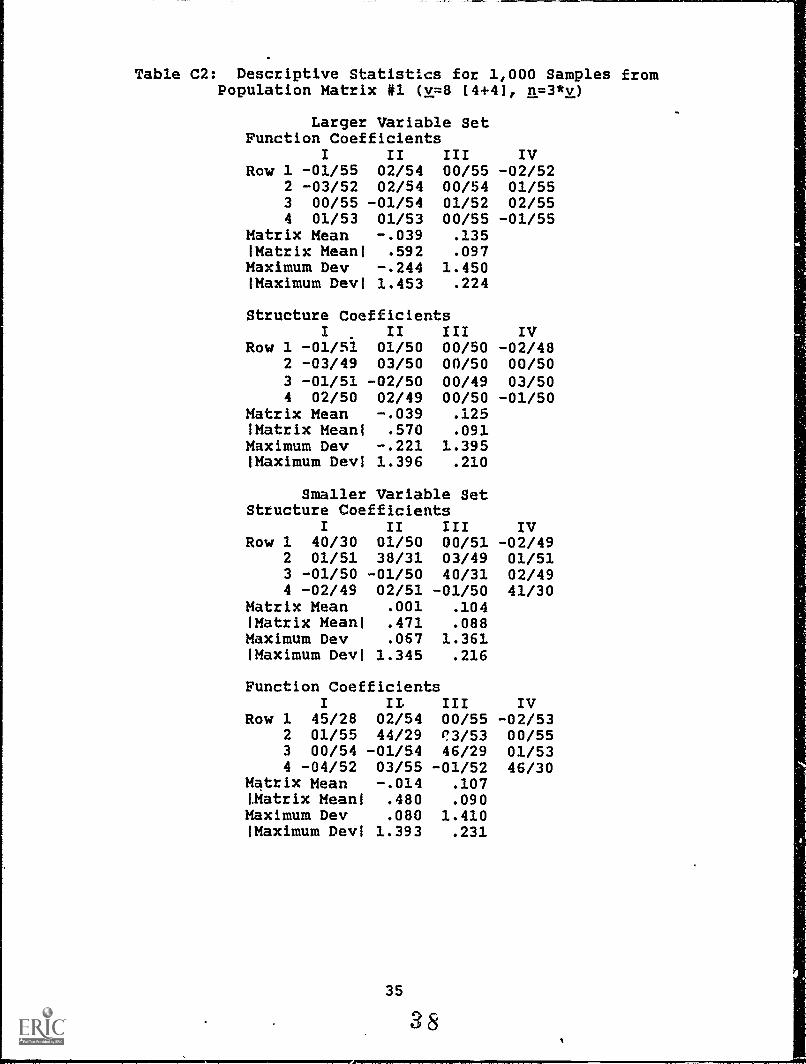
Table C2: Descriptive Statistics for 1,000 Samples fromPopulation Matrix #1 (v=8 [4+44 n=3*v)
Larger Variable SetFunction Coefficients
I II III IVRow 1 -01/55 02/54 00/55 -02/52
2 -03/52 02/54 00/54 01/553 00/55 -01/54 01/52 02/554 01/53 01/53 00/55 -01/55
Matrix Mean -.039 .135!Matrix Meanl .592 .097Maximum Dev -.244 1.450'Maximum Devl 1.453 .224
Structure CoefficientsI II IIi IV
Row 1 -01/51 01/50 00/50 -02/482 -03/49 03/50 00/50 00/503 -01/51 -02/50 00/49 03/504 02/50 02/49 00/50 -01/50
Matrix Mean -.039 .125!Matrix Mean! .570 .091Maximum Dev -.221 1.395'Maximum Devi 1.396 .210
Smaller Variable SetStructure Coefficients
I II III IVRow 1 40/30 01/50 00/51 -02/49
2 01/51 38/31 03/49 01/513 -01/50 -01/50 40/31 02/494 -02/49 02/51 -01/50 41/30
Matrix Mean .001 .104IMatrix Meanl .471 .088Maximum Dev .067 1.361'Maximum Devi 1.345 .216
Function CoefficientsI IL III IV
Row 1 45/28 02/54 00/55 -02/532 01/55 44/29 ('3/53 00/553 00/54 -01/54 46/29 01/534 -04/52 03/55 -01/52 46/30
Matrix Mean -.014 .107(,Matrix Meanl .480 .090Maximum Dev .080 1.410!Maximum Devi 1.393 .231
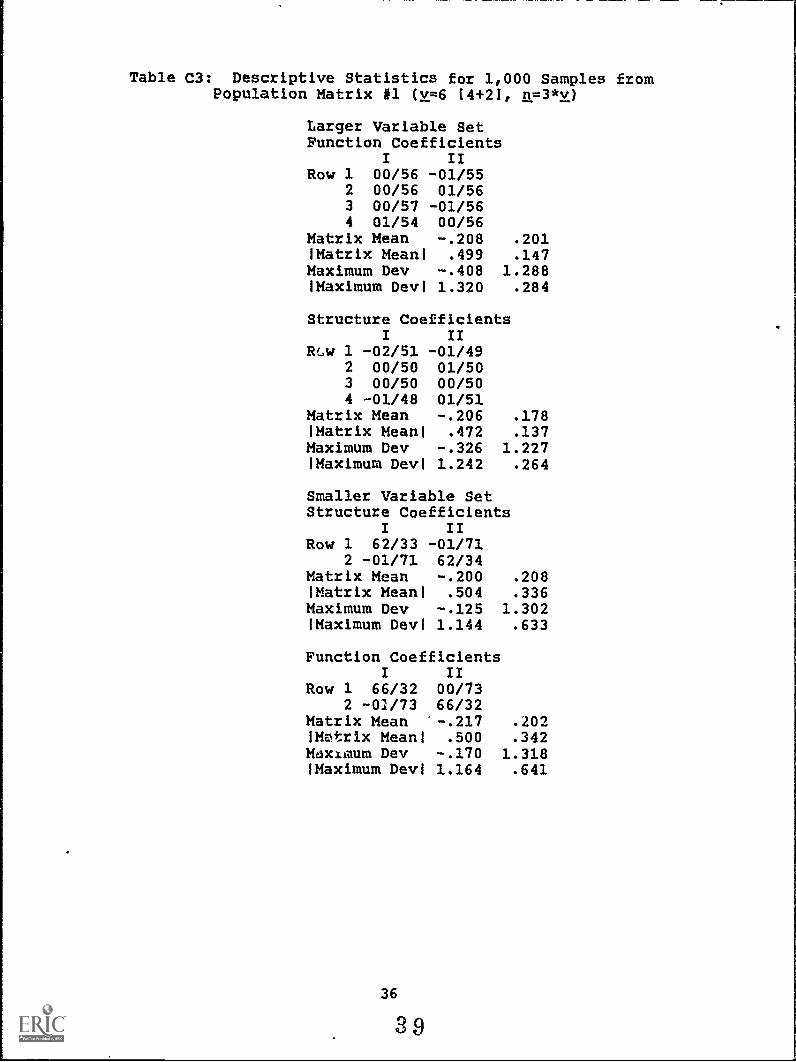
Table C3: Descriptive Statistics for 1,000 Samples fromPopulation Matrix #1 (v=6 14 +2], n=3*v)
Larger Variable SetFunction Coefficients
I IIRow 1 00/56 -01/55
2 00/56 01/563 00/57 -01/564 01/54 00/56
Matrix Mean -.208 .201!Matrix Mean! .499 .147Maximum Dev -.408 1.288!Maximum Devl 1.320 .284
Structure CoefficientsI II
Raw 1 -02/51 -01/492 00/50 01/503 00/50 00/504 -01/48 01/51
Matrix Mean -.206 .178!Matrix Mean! .472 .137Maximum Dev -.326 1.227!Maximum Devi 1.242 .264
Smaller Variable SetStructure Coefficients
I IIRow 1 62/33 -01/71
2 -01/71 62/34Matrix Mean -.200 .208!Matrix Mean! .504 .336Maximum Dev -.125 1.302!Maximum Devi 1.144 .633
Function CoefficientsI II
Row 1 66/32 00/732 -01/73 66/32
Matrix Mean '-.217 .202!Matrix Mean! .500 .342Maximum Dev -.170 1.318!Maximum Devi 1.164 .641
36
39
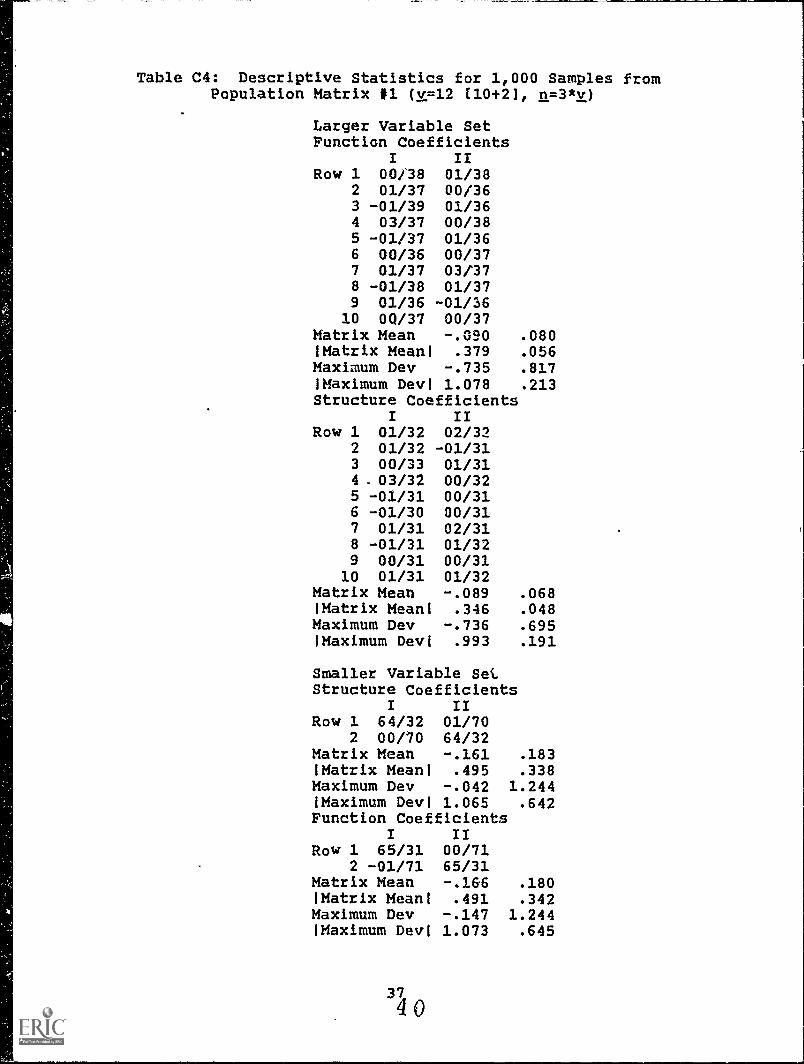
Table C4: Descriptive Statistics for 1,000 Samples fromPopulation Matrix *1 (v=12 110+21, n=3*v)
Larger Variable SetFunction Coefficients
I ITRow 1 00/38 01/38
2 01/37 00/363 -01/39 01/364 03/37 00/385 -01/37 01/366 00/36 00/377 01/37 03/378 -01/38 01/379 01/36 -01/36
10 0Q/37 00/37Matrix Mean -.090 .080!Matrix Mean! .379 .056Maximum Dev -.735 .817!Maximum Devi 1.078 .213Structure Coefficients
I IIRow 1 01/32 02/32
2 01/32 -01/313 00/33 01/314. 03/32 00/325 -01/31 00/316 -01/30 00/317 01/31 02/318 -01/31 01/329 00/31 00/31
10 01/31 01/32Matrix Mean -.089 .068'Matrix Mean' .346 .048Maximum Dev -.736 .695!Maximum Devl .993 .191
Smaller Variable SetStructure Coefficients
I IIRow 1 64/32 01/70
2 00/70 64/32Matrix Mean -.161 .183'Matrix Meant .495 .338Maximum Dev -.042 1.244!Maximum Devl 1.065 .642Function Coefficients
I IIRow 1 65/31 00/71
2 -01/71 65/31Matrix Mean -.166 .180'Matrix Mean' .491 .342Maximum Dev -.147 1.244'Maximum Devl 1.073 .645
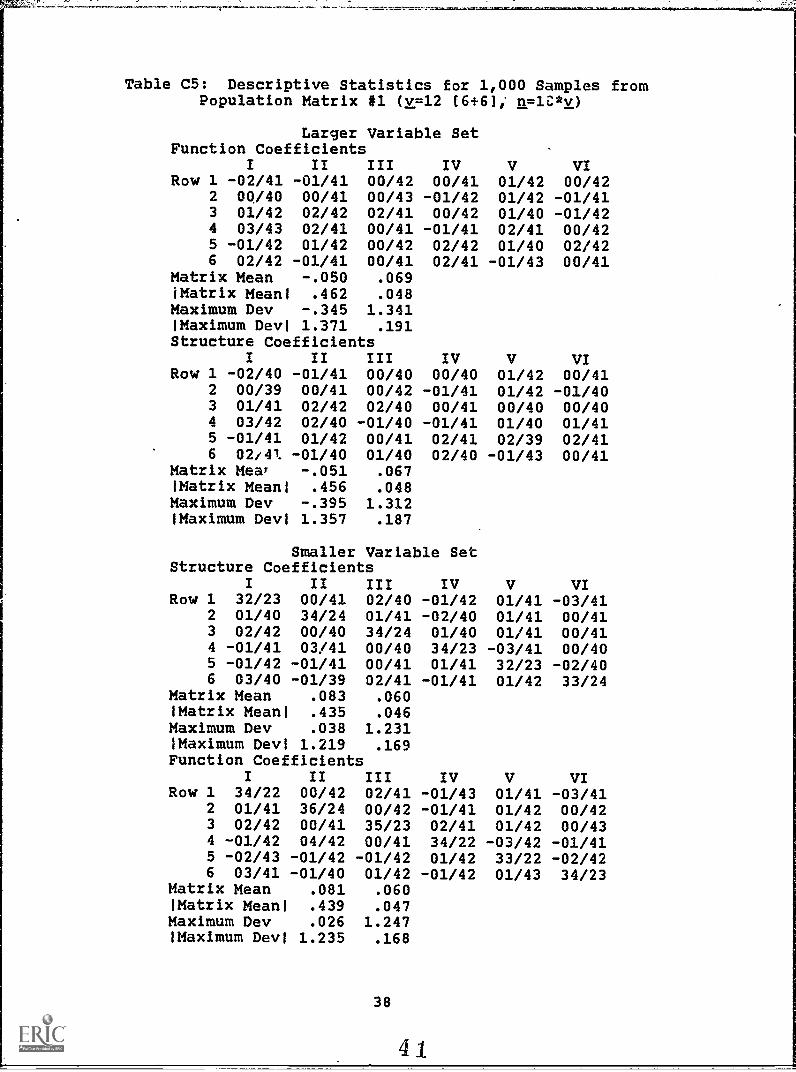
Table C5: Descriptive Statistics for 1,000 Samples fromPopulation Matrix #1 (v=12 (6 +6]; n=10/cv)
Larger Variable SetFunction Coefficients
I II III IV V VIRow 1 -02/41 -01/41 00/42 00/41 01/42 00/42
2 00/40 00/41 00/43 -01/42 01/42 -01/413 01/42 02/42 02/41 00/42 01/40 -01/424 03/43 02/41 00/41 -01/41 02/41 00/425 -01/42 01/42 00/42 02/42 01/40 02/426 02/42 -01/41 00/41 02/41 -01/43 00/41
Matrix Mean -.050 .069'Matrix Meanl .462 .048Maximum Dev -.345 1.341!Maximum Devi 1.371 .191Structure Coefficients
I II III IV V VIRow 1 -02/40 -01/41 00/40 00/40 01/42 00/41
2 00/39 00/41 00/42 -01/41 01/42 -01/403 01/41 02/42 02/40 00/41 00/40 00/404 03/42 02/40 -01/40 -01/41 01/40 01/415 -01/41 01/42 00/41 02/41 02/39 02/416 02,41 -01/40 01/40 02/40 -01/43 00/41
Matrix Mew -.051 .067'Matrix Meanl .456 .048Maximum Dev -.395 1.312Maximum Devi 1.357 .187
Smaller Variable SetStructure Coefficients
I II III IV V VIRow 1 32/23 00/41 02/40 -01/42 01/41 -03/41
2 01/40 34/24 01/41 -02/40 01/41 00/413 02/42 00/40 34/24 01/40 01/41 00/414 -01/41 03/41 00/40 34/23 -03/41 00/405 -01/42 -01/41 00/41 01/41 32/23 -02/406 03/40 -01/39 02/41 -01/41 01/42 33/24
Matrix Mean .083 .060!Matrix Mean' .435 .046Maximum Dev .038 1.231'Maximum Devi 1.219 .169Function Coefficients
I II III IV V VIRow 1 34/22 00/42 02/41 -01/43 01/41 -03/41
2 01/41 36/24 00/42 -01/41 01/42 00/423 02/42 00/41 35/23 02/41 01/42 00/434 -01/42 04/42 00/41 34/22 -03/42 -01/415 -02/43 -01/42 -01/42 01/42 33/22 -02/426 03/41 -01/40 01/42 -01/42 01/43 34/23
Matrix Mean .081 .060'Matrix Mean' .439 .047Maximum Dev .026 1.247'Maximum Devi 1.235 .168
38
41

Table C6: Descriptive Statistics for 1,000 Samples fromPopulation Matrix let tv=8 [4+41, n=10*v)
Larger Variable SetFunction Coefficients
II III IVRow 1 00/52 -03/52 00/50 00/50
2 -01/51 02/50 00/50 01/523 02/52 -01/49 01/52 -01/514 00/50 01/52 03/51 03/51
Matrix Mean -.042 .128!Matrix Mean! .576 .094Maximum Dev -.262 1.415!Maximum Dev! 1.423 .207
Structure CoefficientsI II III IV
Row 1 -01/50 -03/51 01/50 00/492 -01/50 02/50 00/49 01/513 02/50 -01/48 00/51 -01/504 -01/49 01/50 03/50 03/50
Matrix Mean -.041 .126!Matrix Means .571 .094Maximum Dev -.23S 1.404!Maximum Devi 1.407 .206
Smaller Variable SetStructure Coefficients
I II III IVRow 1 40/27 00/50 00/51 00/50
2 01/50 42/28 00/49 00/503 -01/51 00/48 40/28 -01/524 -03/50 00/50 -02/51 41/27
Matrix Mean .002 .103!Matrix Mean! .472 .088Maximum Dev .027 1.368!Maximum DevI 1.349 .220
Function CoefficientsI II III IV
Row 1 42/26 00/51 00/52 00/502 01/52 44/27 00/50 00/513 -01/52 00/49 42/27 -01/524 -02/51 00/52 -02/52 42/26
Matrix Mean -.003 .105!Matrix Mean! .474 .0e9Maximum Dev .028 1.381!Maximum DevI 1.363 .220
39
42
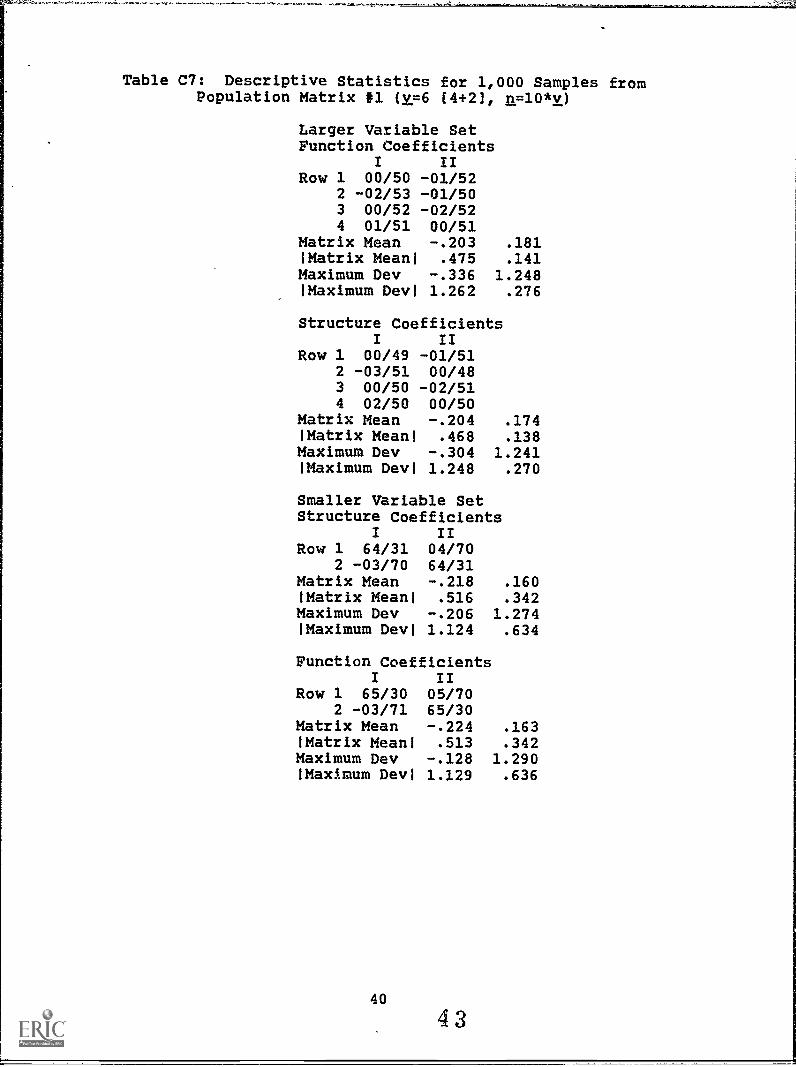
Table C7: Descriptive Statistics for 1,000 Samples fromPopulation Matrix #1 (v=6 (4+21, n=10*v)
Larger Variable SetFunction Coefficients
I IIRow 1 00/50 -01/52
2 -02/53 -01/503 00/52 -02/524 01/51 00/51
Matrix Mean -.203 .181'Matrix Meani .475 .141Maximum Dev -.336 1.248!Maximum Devi 1.262 .276
Structure CoefficientsI II
Row 1 00/49 -01/512 -03/51 00/483 00/50 -02/514 02/50 00/50
Matrix Mean -.204 .174'Matrix Meant .468 .138Maximum Dev -.304 1.241'Maximum Devi 1.248 .270
Smaller Variable SetStructure Coefficients
I IIRow 1 64/31
2 -03/7004/7064/31
Matrix Mean -.218 .160'Matrix Meant .516 .342Maximum Dev -.206 1.274'Maximum Devi 1.124 .634
Function CoefficientsI II
Row 1 65/30 05/702 -03/71 65/30
Matrix Mean -.224 .163'Matrix Meant .513 .342Maximum Dev -.128 1.290!Maximum Devi 1.129 .636
40
43
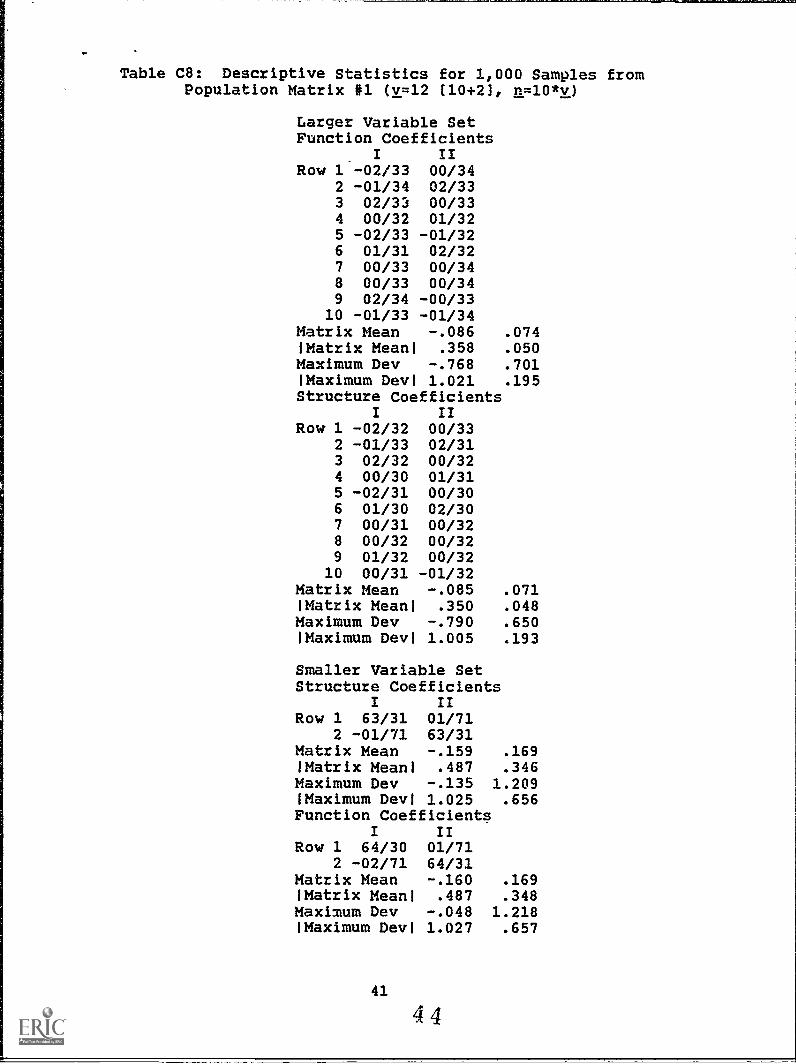
Table C8: Descriptive Statistics for 1,000 Samples fromPopulation Matrix #1 (v=12 (10+21, n=10*v)
Larger Variable SetFunction Coefficients
I IIRow 1 -02/33 00/34
2 -01/34 02/333 02/33 00/334 00/32 01/325 -02/33 -01/326 01/31 02/327 00/33 00/348 00/33 00/349 02/34 -00/33
10 -01/33 -01/34Matrix Mean -.086 .074'Matrix Meant .358 .050Maximum Dev -.768 .701'Maximum Devi 1.021 .195Structure Coefficients
I IIRow 1 -02/32 00/33
2 -01/33 02/313 02/32 00/324 00/30 01/315 -02/31 00/306 01/30 02/307 00/31 00/328 00/32 00/329 01/32 00/32
10 00/31 -01/32Matrix Mean -.085 .071'Matrix Mean! .350 .048Maximum Dev -.790 .650'Maximum Devi 1.005 .193
Smaller Variable SetStructure Coefficients
I IIRow 1 63/31 01/71
2 -01/71 63/31Matrix Mean -.159 .169'Matrix Mean! .487 .346Maximum Dev -.135 1.209'Maximum Devi 1.025 .656Function Coefficients
I IIRow 1 64/30 01/71
2 -02/71 64/31Matrix Mean -.160 .169!Matrix Mean' .487 .348Maximum Dev -.048 1.218!Maximum Devi 1.027 .657
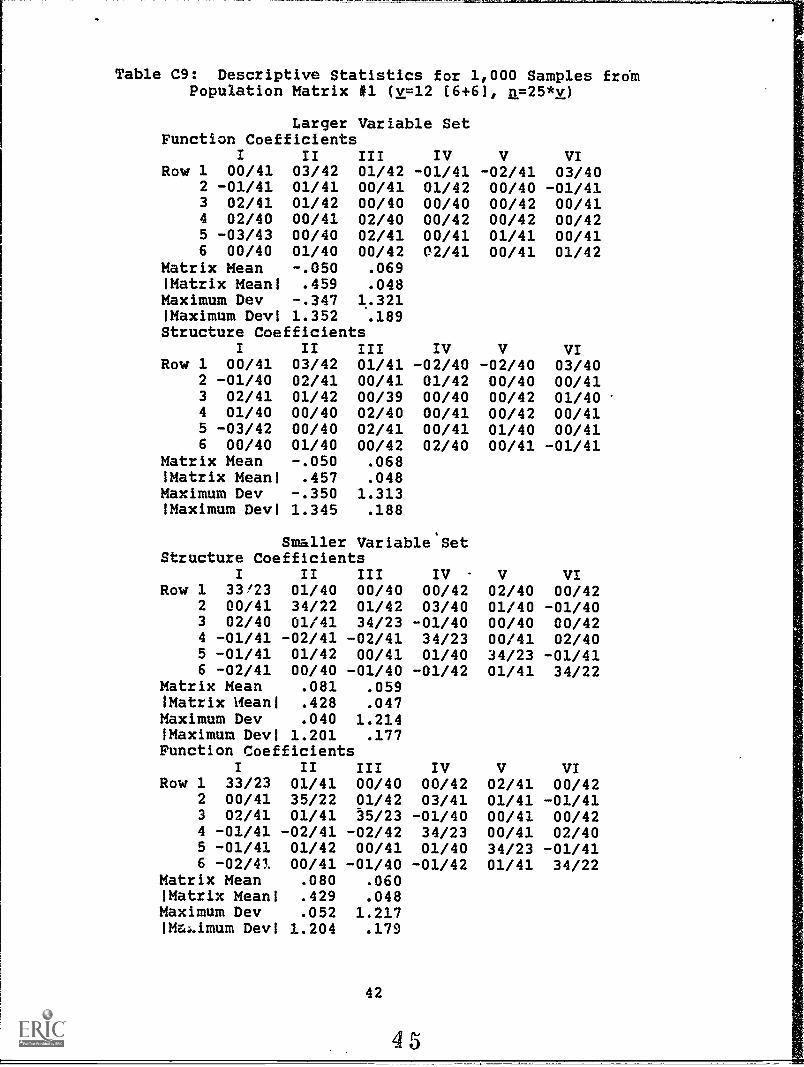
Table C9: Descriptive Statistics for 1,000 Samples fromPopulation Matrix 11 (v=12 16+6), n=25*v)
Larger Variable SetFunction Coefficients
I II III IV V VIRow 1 00/41 03/42 01/42 -01/41 -02/41 03/40
2 -01/41 01/41 00/41 01/42 00/40 -01/413 02/41 01/42 00/40 00/40 00/42 00/414 02/40 00/41 02/40 00/42 00/42 00/425 -03/43 00/40 02/41 00/41 01/41 00/416 00/40 01/40 00/42 02/41 00/41 01/42
Matrix Mean -.050 .069!Matrix Mean' .459 .048Maximum Dev -.347 1.321'Maximum Devi 1.352 .189Structure Coefficients
I II III IV V VIRow 1 00/41 03/42 01/41 -02/40 -02/40 03/40
2 -01/40 02/41 00/41 01/42 00/40 00/413 02/41 01/42 00/39 00/40 00/42 01/404 01/40 00/40 02/40 00/41 00/42 00/415 -03/42 00/40 02/41 00/41 01/40 00/416 00/40 01/40 00/42 02/40 00/41 -01/41
Matrix Mean -.050 .068'Matrix Mean' .457 .048Maximum Dev -.350 1.313!Maximum Devi 1.345 .188
Smaller Variable,
SetStructure Coefficients
I II III IV V VIRow 1 33123 01/40 00/40 00/42 02/40 00/42
2 00/41 34/22 01/42 03/40 01/40 -01/403 02/40 01/41 34/23 -01/40 00/40 00/424 -01/41 -02/41 -02/41 34/23 00/41 02/405 -01/41 01/42 00/41 01/40 34/23 -01/416 -02/41 00/40 -01/40 -01/42 01/41 34/22
Matrix Mean .081 .059'Matrix Reanl .428 .047Maximum Dev .040 1.214Maximum Devi 1.201 .177Function Coefficients
I II III IV V VIRow 1 33/23 01/41 00/40 00/42 02/41 00/42
2 00/41 35/22 01/42 03/41 01/41 -01/413 02/41 01/41 35/23 -01/40 00/41 00/424 -01/41 -02/41 -02/42 34/23 00/41 02/405 -01/41 01/42 00/41 01/40 34/23 -01/416 -02/41 00/41 -01/40 -01/42 01/41 34/22
Matrix Mean .080 .060'Matrix Meant .429 .048Maximum Dev .052 1.2171Maimum Devi 1.204 .179
42
45

Table C10: Descriptive Statistics for 1,000 Samples fromPopulation Matrix #1 (v=8 (4+4), n=25*v)
Larger Variable SetFunction Coefficients
I II III IVRow 1 00/51 -01/50 01/50 00/50
2 01/50 -01/51 -02/50 00/493 00/50 02/50 -01/51 -01/504 -02/50 00/50 00/50 01/51
Matrix Mean -.035 .129IMatrix Meanl .568 .095Maximum Dev -.254 1,409'Maximum Devi 1.415 .213
Structure CoefficientsI II III IV
Row 1 00/50 -01/49 01/50 -01/502 01/50 -01/51 -02/50 01/493 00/50 02/50 -01/51 -01/504 -02/50 00/50 00/49 01/51
Matrix Mean -.035 .127IMatrix Meanl .565 .095Maximum Dev -.271 1.402'Maximum Devi 1.411 .210
Smaller Variable SetStructure Coefficients
I II III IVRow 1 44/27 -01/49 00/49 01/50
2 -01/48 42/27 -01/52 02/503 00/50 00/50 42/27 -01/504 -03/50 00/51 00/49 42/26
Matrix Mean -.003 .106IMatrix Meanl .467 .087Maximum Dev .112 1.362'Maximum Devi 1.349 .216
Function CoefficientsI II III IV
Row 1 45/26 -01/49 00/50 00/512 -01/49 42/26 -01/52 02/503 00/50 00/51 42/26 -01/504 -03/50 00/52 00/49 43/26
Matrix Mean -.004 .107IMatrix Meanl .467 .087Maximum Dev .111 1.366'Maximum Devi 1.353 .215
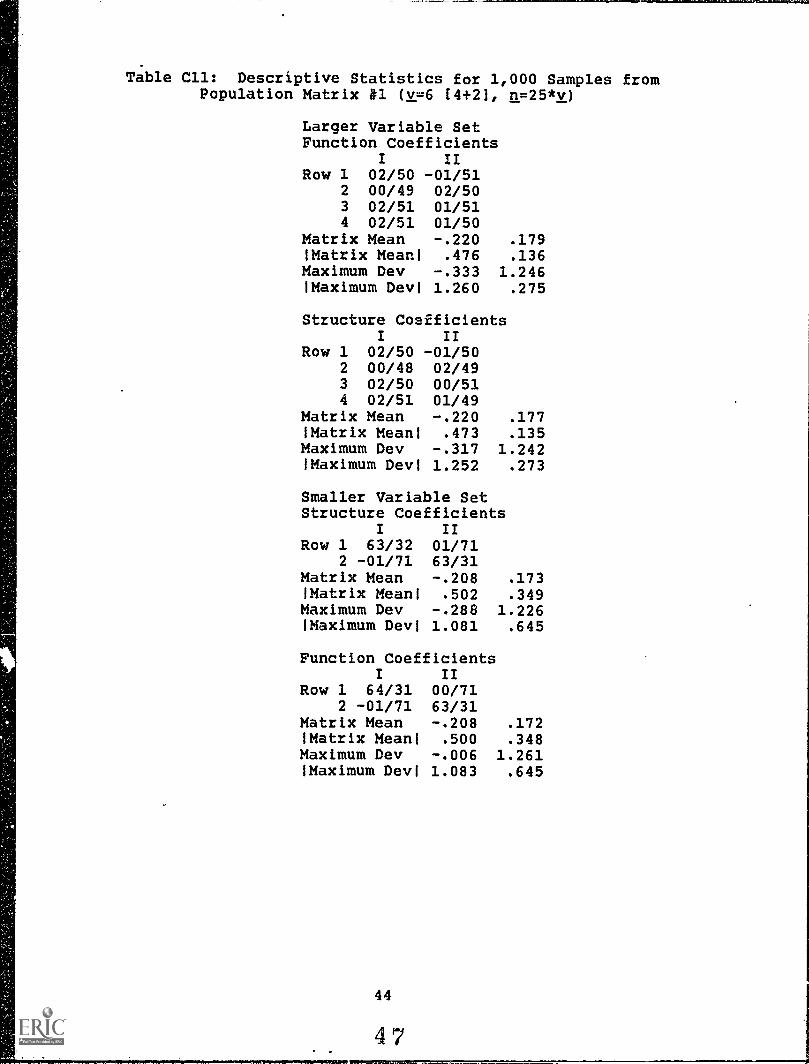
Table C11: Descriptive Statistics for 1,000 Samples fromPopulation Matrix #1 (v=6 (4+21, n=25*v)
Larger Variable SetFunction Coefficients
I IIRow 1 02/50 -01/51
2 00/49 02/503 02/51 01/514 02/51 01/50
Matrix Mean -.220 .179IMatrix Mean' .476 .136Maximum Dev -.333 1.246IMaximum Devi 1.260 .275
Structure CoefficientsI II
Row 1 02/50 -01/502 00/48 02/493 02/50 00/514 02/51 01/49
Matrix Mean -.220 .177IMatrix Mean' .473 .135Maximum Dev -.317 1.242'Maximum Devi 1.252 .273
Smaller Variable SetStructure Coefficients
I IIRow 1 63/32 01/71
2 -01/71 63/31Matrix Mean -.208 .173IMatrix Meanl .502 .349Maximum Dev -.288 1.226IMaximum Devl 1.081 .645
Function CoefficientsI II
Row 1 64/31 00/712 -01/71 63/31
Matrix Mean -.208 .172IMatrix Mean' .500 .348Maximum Dev -.006 1.261IMaximum Devi 1.083 .645
44
47
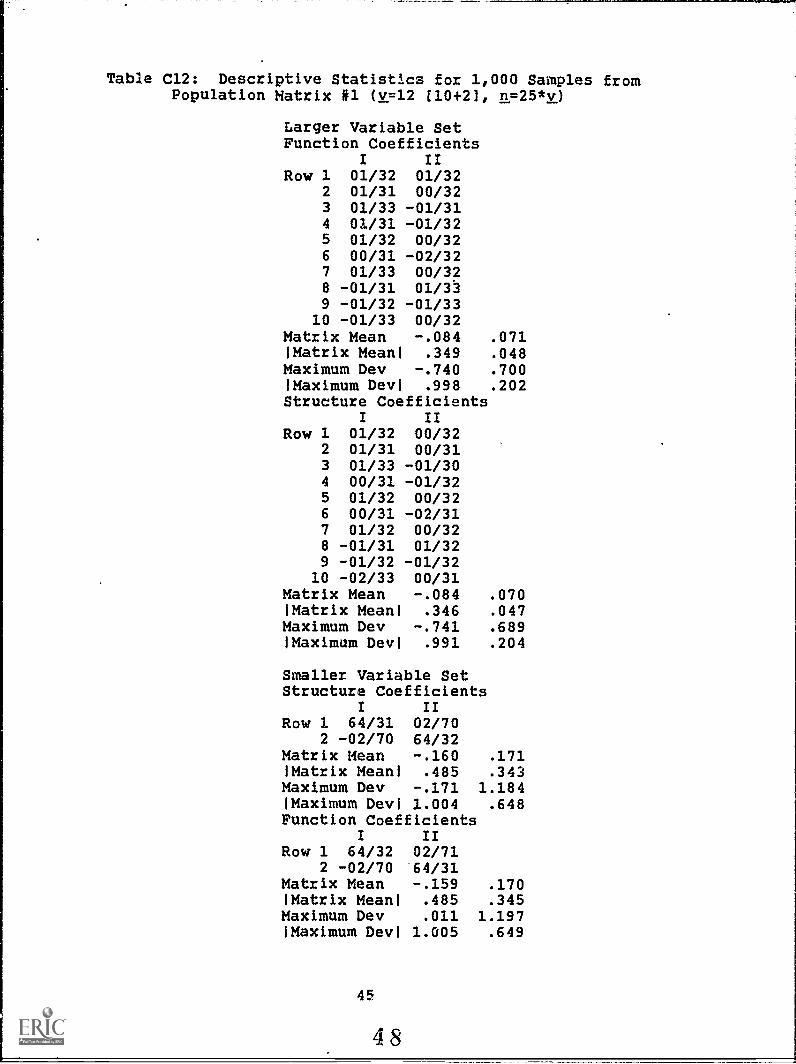
Table C12: Descriptive Statistics for 1,000 Samples fromPopulation Matrix #1 (v=12 (10+211 n=25*v)
Larger Variable SetFunction Coefficients
I IIRow 1 01/32 01/32
2 01/31 00/323 01/33 -01/314 01/31 -01/325 01/32 00/326 00/31 -02/327 01/33 00/328 -01/31 01/339 -01/32 -01/3310 -01/33 00/32
Matrix Mean -.084 .071'Matrix Meanl .349 .048Maximum Dev -.740 .700'Maximum Devi .998 .202Structure Coefficients
I IIRow 1 01/32 00/32
2 01/31 00/313 01/33 -01/304 00/31 -01/325 01/32 00/326 00/31 -02/317 01/32 00/328 -01/31 01/329 -01/32 -01/3210 -02/33 00/31
Matrix Mean -.084 .070'Matrix Meanl .346 .047Maximum Dev -.741 .689'Maximum Dev) .991 .204
Smaller Variable SetStructure Coefficients
I IIRow 1 64/31
2 -02/70Matrix MeanMatrix Mean)Maximum Dev'Maximum Dev)
02/7064/32-.160.485
-.1711.004
.171
.3431.184.648
Function CoefficientsI II
Row 1 64/32 02/712 -02/70 64/31
Matrix Mean -.159 .170'Matrix Mean' .485 .345Maximum Dev .011 1.197'Maximum Dev) 1.005 .649
45
48
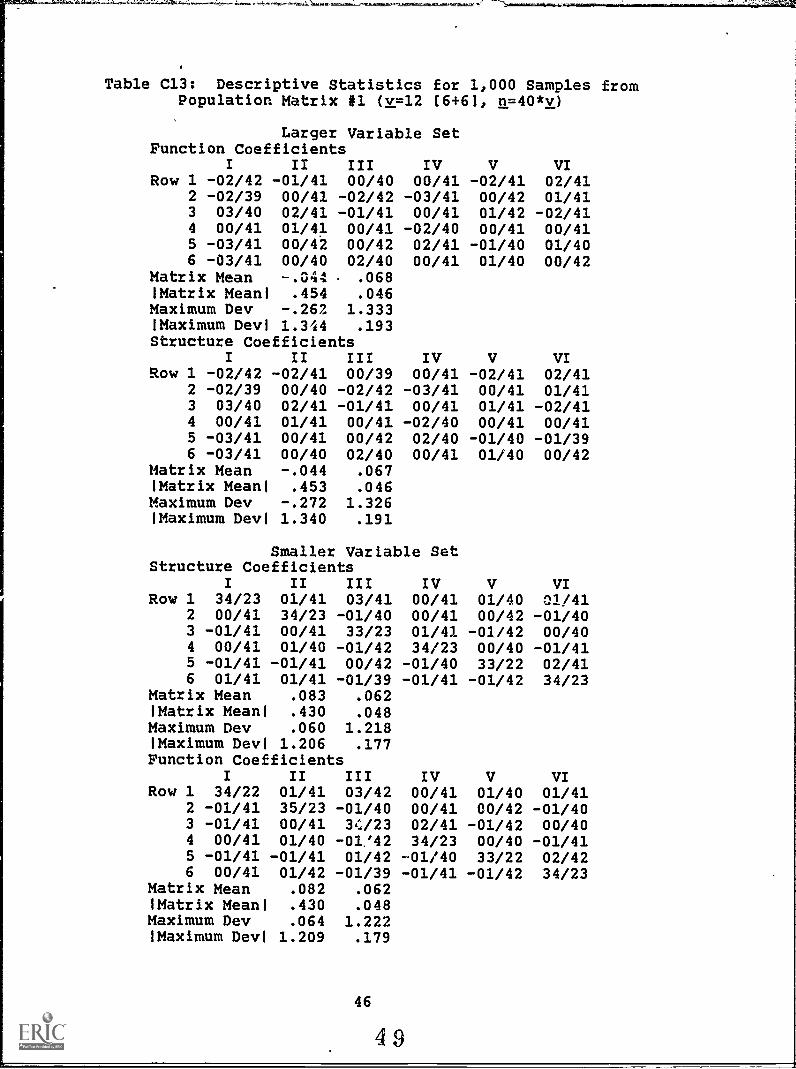
Table C13: Descriptive Statistics for 1,000 Samples fromPopulation. Matrix #1 (v=12 (6+6), n=40*v)
Larger Variable SetFunction Coefficients
I II III IV V VIRow 1 -02/42 -01/41 00/40 00/41 -02/41 02/41
2 -02/39 00/41 -02/42 -03/41 00/42 01/413 03/40 02/41 -01/41 00/41 01/42 -02/414 00/41 01/41 00/41 -02/40 00/41 00/415 -03/41 00/42 00/42 02/41 -01/40 01/406 -03/41 00/40 02/40 00/41 01/40 00/42
Matrix Mean -.044 .068!Matrix Meanl .454 .046Maximum Dev -.262 1.333!Maximum Devi 1.344 .193Structure Coefficients
I II III IV V VIRow 1 -02/42 -02/41 00/39 00/41 -02/41 02/41
2 -02/39 00/40 -02/42 -03/41 00/41 01/413 03/40 02/41 -01/41 00/41 01/41 -02/414 00/41 01/41 00/41 -02/40 00/41 00/415 -03/41 00/41 00/42 02/40 -01/40 -01/396 -03/41 00/40 02/40 00/41 01/40 00/42
Matrix Mean -.044 .067!Matrix Mean! .453 .046Maximum Dev -.272 1.326!Maximum Devi 1.340 .191
Smaller Variable SetStructure Coefficients
I II III IV V VIRow 1 34/23 01/41 03/41 00/41 01/40 01/41
2 00/41 34/23 -01/40 00/41 00/42 -01/403 -01/41 00/41 33/23 01/41 -01/42 00/404 00/41 01/40 -01/42 34/23 00/40 -01/415 -01/41 -01/41 00/42 -01/40 33/22 02/416 01/41 01/41 -01/39 -01/41 -01/42 34/23
Matrix Mean .083 .062!Matrix Meanl .430 .048Maximum Dev .060 1.218!Maximum Devi 1.206 .177Function Coefficients
I II III IV V VIRow 1 34/22 01/41 03/42 00/41 01/40 01/41
2 -01/41 35/23 -01/40 00/41 00/42 -01/403 -01/41 00/41 3e4/23 02/41 -01/42 00/404 00/41 01/40 -01:42 34/23 00/40 -01/415 -01/41 -01/41 01/42 -01/40 33/22 02/426 00/41 01/42 -01/39 -01/41 -01/42 34/23
Matrix Mean .082 .062!Matrix Mean! .430 .048Maximum Dev .064 1.222!Maximum Devi 1.209 .179
46
49
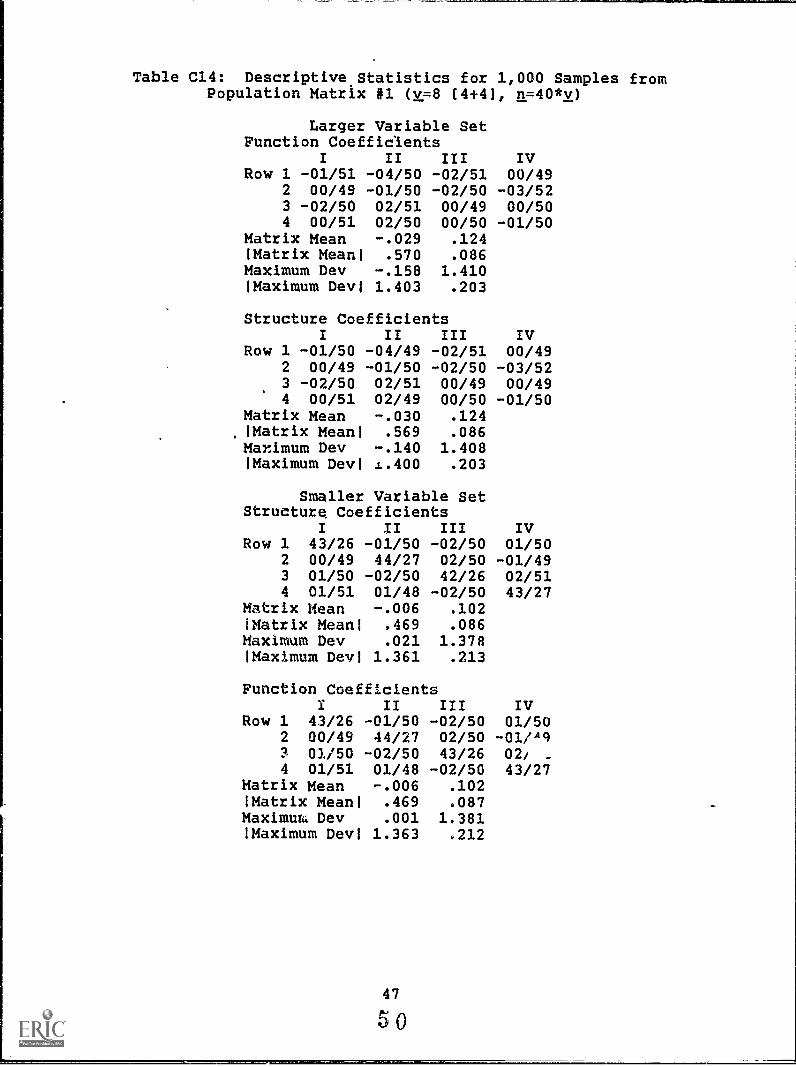
Table C14: Descriptive Statistics for 1,000 Samples fromPopulation Matrix #1 (v=8 (4+4), n=40*v)
Larger Variable SetFunction Coefficients
I II III IVRow 1 -01/51 -04/50 -02/51 00/49
2 00/49 -01/50 -02/50 -03/523 -02/50 02/51 00/49 00/504 00/51 02/50 00/50 -01/50
Matrix Mean -.029 .124'Matrix Meani .570 .086Maximum Dev -.158 1.410'Maximum Devi 1.403 .203
Structure CoefficientsII III IV
Row 1 -01/50 -04/49 -02/51 00/492 00/49 -01/50 -02/50 -03/523 -02/50 02/51 00/49 00/494 00/51 02/49 00/50 -01/50
Matrix Mean -.030 .124'Matrix Mean' .569 .086Maximum Dev -.140 1.408'Maximum Devi J.400 .203
Smaller Variable SetStructure Coefficients
I II III IVRow 1 43/26 -01/50 -02/50 01/50
2 00/49 44/27 02/50 -01/493 01/50 -02/50 42/26 02/514 01/51 01/48 -02/50 43/27
Matrix Mean -.006 .102'Matrix Meani .469 .086Maximum Dev .021 1.378'Maximum Devi 1.361 .213
Function CoefficientsX II III IV
Row 1 43/26 -01/50 -02/50 01/502 00/49 44/27 02/50 -01/Aq
01/50 -02/50 43/26 02/4 01/51 01/48 -02/50 43/27
Matrix Mean -.006 .102'Matrix Mean' .469 .087Maximum Dev .001 1.381'Maximum Devi 1.363 .212
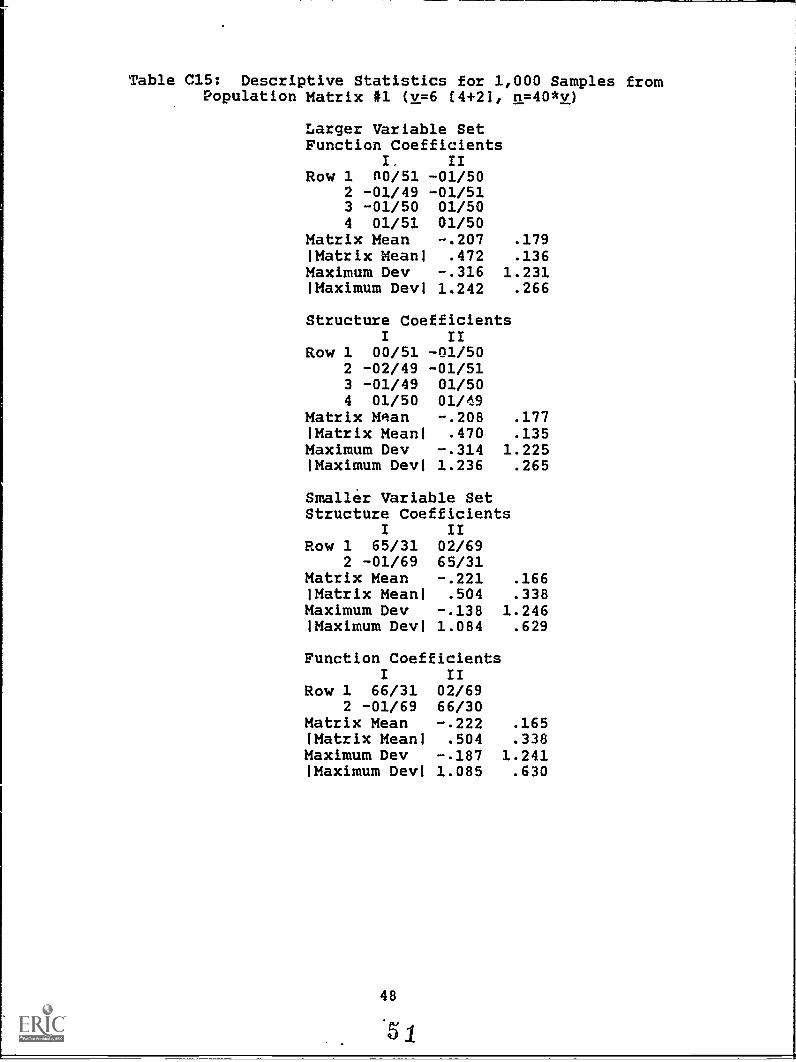
Table C15: Descriptive Statistics for 1,000 Samples fromPopulation Matrix #1 (v=6 (4+24 n=40*v)
Larger Variable SetFunction Coefficients
I. IIRow 1 n0/51 -01/50
2 -01/49 -01/513 -01/50 01/504 01/51 01/50
Matrix Mean -.207 .179'Matrix Meanl .472 .136Maximum Dev -.316 1.231'Maximum Devi 1.242 .266
Structure CoefficientsI II
Row 1 00/51 -01/502 -02/49 -01/513 -01/49 01/504 01/50 01/69
Matrix Mean -.208 .177'Matrix Meanl .470 .135Maximum Dev -.314 1.225'Maximum Devi 1.236 .265
Smaller Variable SetStructure Coefficients
I IIRow 1 65/31 02/69
2 -01/69 65/31Matrix Mean -.221 .166'Matrix Meanl .504 .338Maximum Dev -.138 1.246'Maximum Devi 1.084 .629
Function CoefficientsI II
Row 1 66/31 02/692 -01/69 66/30
Matrix Mean -.222 .165(Matrix Meanl .504 .338Maximum Dev -.187 1.241IMaximum Devi 1.085 .630
48
.51
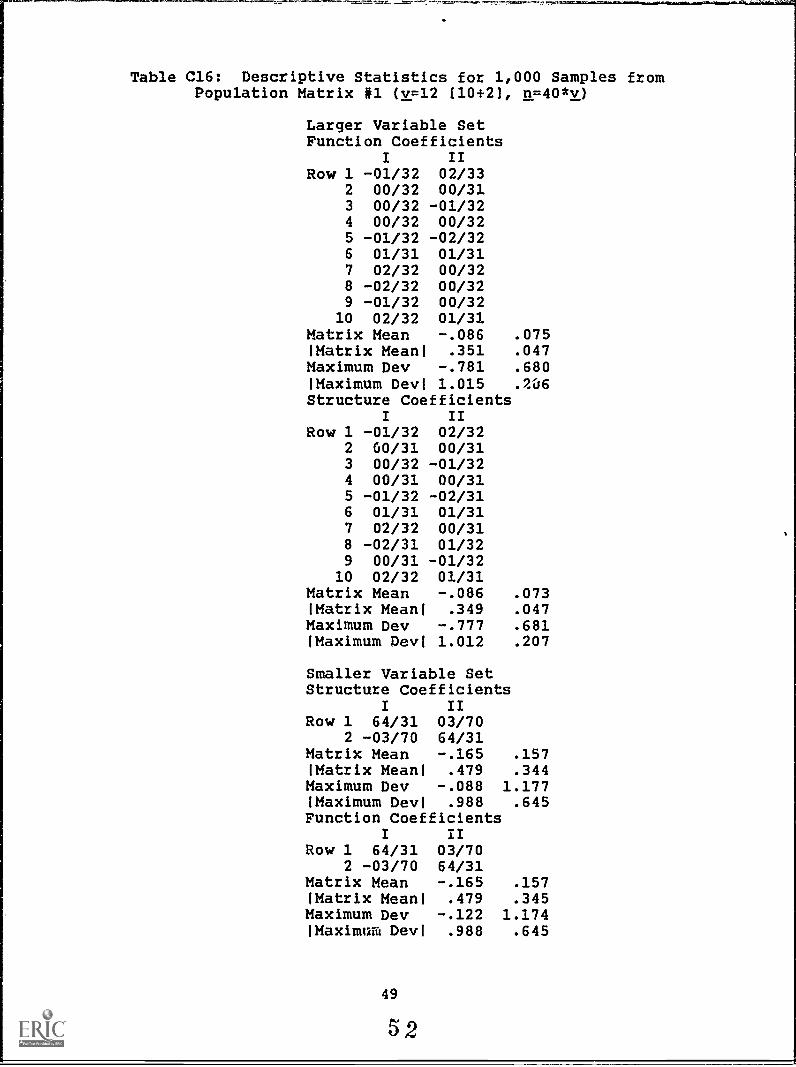
Table C16: Descriptive Statistics for 1,000 Samples fromPopulation Matrix #1 (v=12 [10 +2], n=40*v)
Larger Variable SetFunction Coefficients
I IIRow 1 -01/32 02/33
2 00/32 00/313 00/32 -01/324 00/32 00/325 -01/32 -02/326 01/31 01/317 02/32 00/328 -02/32 00/329 -01/32 00/32
10 02/32 01/31Matrix Mean -.086 .075!Matrix Mean' .351 .047Maximum Dev -.781 .680!Maximum Devi 1.015 .2i6Structure Coefficients
I IIRow 1 -01/32 02/32
2 G0/31 00/313 00/32 -01/324 00/31 00/315 -01/32 -02/316 01/31 01/317 02/32 00/318 -02/31 01/329 00/31 -01/32
10 02/32 01/31Matrix Mean -.086 .073!Matrix Meanl .349 .047Maximum Dev -.777 .681!Maximum Devi 1.012 .207
Smaller Variable SetStructure Coefficients
I IIRow 1 64/31
2 -03/70Matrix Mean!Matrix MeanlMaximum Dev!Maximum Devi
03/7064/31-.165.479
-.088.988
.157
.3441.177.645
Function CoefficientsI II
Row 1 64/31 03/702 -03/70 64/31
Matrix Mean -.165 .157!Matrix Meanl .479 .345Maximum Dev -.122 1.174!Maximum Devi .988 .645
49
52

Table C17: Descriptive Statistics for 1,000 Samples fromPopulation Matrix #2 (v=12 (6+6], n=3*v)
Larger Variable SetFunction Coefficients
I II III IV V VIRow 1 -05/72 -00/44 -01/37 00/34 -06/33 01/32
2 -05/69 00/45 00/38 -01/35 08/34 -02/323 00/10 -01/44 01/48 10/50 -02/49 01/504 00/10 02/44 12/44 -02/49 00/50 00/515 00/10 09/43 -01/49 01/49 01/51 00/496 01/11 03/43 01/48 02/49 '00/51 -01/50
Matrix Mean -.053 .072IMatrix Meanl .402 .044Maximum Dev -.333 1.538!Maximum Devi 1.556 .227Structure Coefficients
I II III IV V VIRow 1 -04/70 -01/41 00/34 01/28 -06/26 02/26
2 -04/68 01/42 01/34 -01/30 07/28 -02/273 00/19 -01/40 01/43 09/45 -02/44 00/454 00/19 01/41 11/40 -01/45 00/45 00/465 00/19 10/40 00/44 01/44 00/45 00/456 02/20 02/40 01/44 01/44 00/46 -02/46
Matrix Mean -.053 .067!Matrix Meanl .384 .041Maximum Dev -.412 1.471'Maximum Devi 1.513 .206
Smaller Variable SetStructure Coefficients
1 II III IV V VIRow 1 07/17 -02/41 -01/43 00/45 02/45 -01/45
2 01/20 31/26 -02/43 02/44 00/45 -03/463 00/18 01/42 36/27 01/44 00/44 -03/444 -01/19 -02/41 -01/44 36/26 01/45 -01/455 -04/69 01/41 00/34 01/30 22/19 -16/216 -04/70 -02/40 01/33 00/29 -19/20 17/19
Matrix Mean -.072 .066!Matrix Mean' .409 .056Maximum Dev -.424 1.449Maximum DevI 1.493 .220Function Coefficients
I II III IV V VIRow 1 08/06 -02/44 00/47 -01/50 02/50 -01/50
2 00/11 36/25 -02/46 01/50 00/50 -04/523 00/10 02/44 41/26 01/49 01/49 -03/504 00/10 -02/45 00/48 41/27 00/50 -02/505 -04/69 01/44 -01/38 01/35 29/19 -17/286 -05/71 -02/43 00/38 00/35 -20/28 27/19
Matrix Mean -.080 .070Matrix Mean' .428 .059Maximum Dev -.354 1.518Maximum Devi 1.539 .241
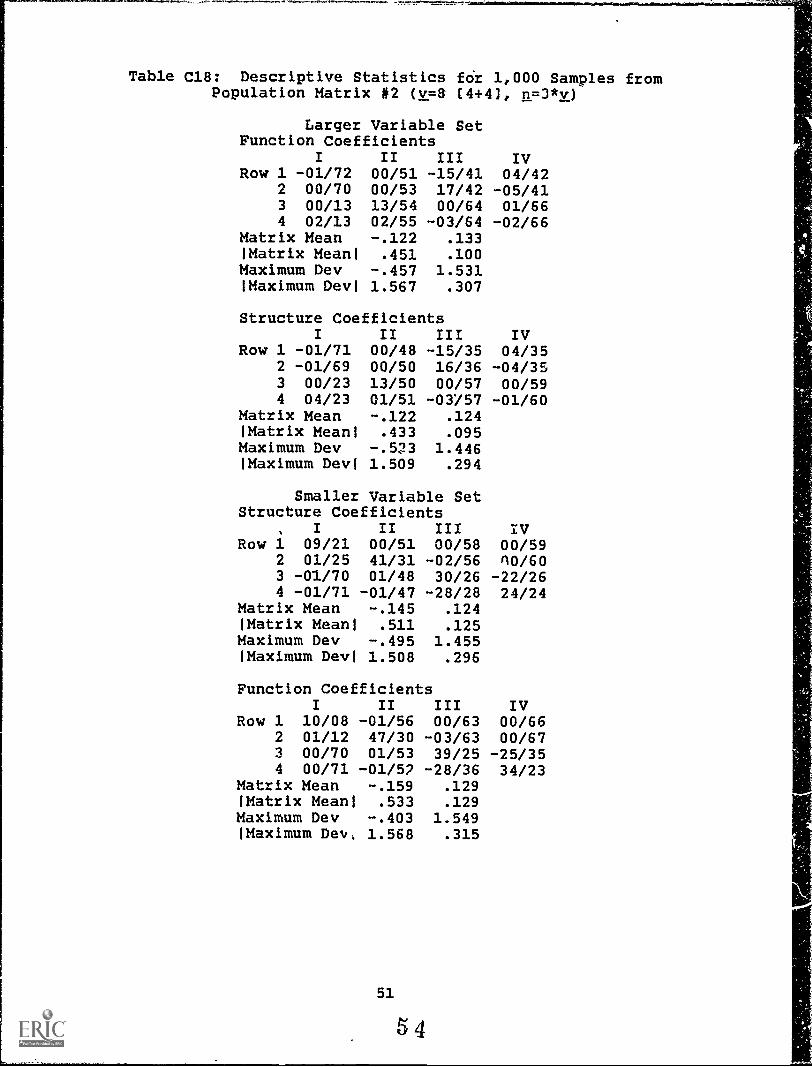
Table C18: Descriptive Statistics for 1,000 Samples fromPopulation Matrix #2 (v=8 (4+4), n=3*v)
Larger Variable SetFunction Coefficients
I II III IVRow 1 -01/72 00/51 -15/41 04/42
2 00/70 00/53 17/42 -05/413 00/13 13/54 00/64 01/664 02/13 02/55 -03/64 -02/66
Matrix Mean -.122 .133'Matrix Meant .451 .100Maximum Dev -.457 1.531'Maximum Devi 1.567 .307
Structure CoefficientsI II III IV
Row 1 -01/71 00/48 -15/35 04/352 -01/69 00/50 16/36 -04/353 00/23 13/50 00/57 00/594 04/23 01/51 -03/57 -01/60
Matrix Mean -.122 .124'Matrix Meanl .433 .095Maximum Dev -.5'3 1.446'Maximum Devi 1.509 .294
Smaller Variable SetStructure Coefficients
, I II III IVRow 1 09/21 00/51 00/58 00/59
2 01/25 41/31 -02/56 n0 /603 -01/70 01/48 30/26 -22/264 -01/71 -01/47 -28/28 24/24
Matrix Mean -.145 .124'Matrix Meanl .511 .125Maximum Dev -.495 1.455'Maximum Dev) 1.508 .296
Function CoefficientsI II III IV
Row 1 10/08 -01/56 00/63 00/662 01/12 47/30 -03/63 00/673 00/70 01/53 39/25 -25/354 00/71 -01/52 -28/36 34/23
Matrix Mean -.159 .129'Matrix Meanl .533 .129Maximum Dev -.403 1.549'Maximum Dev, 1.568 .315
51
54
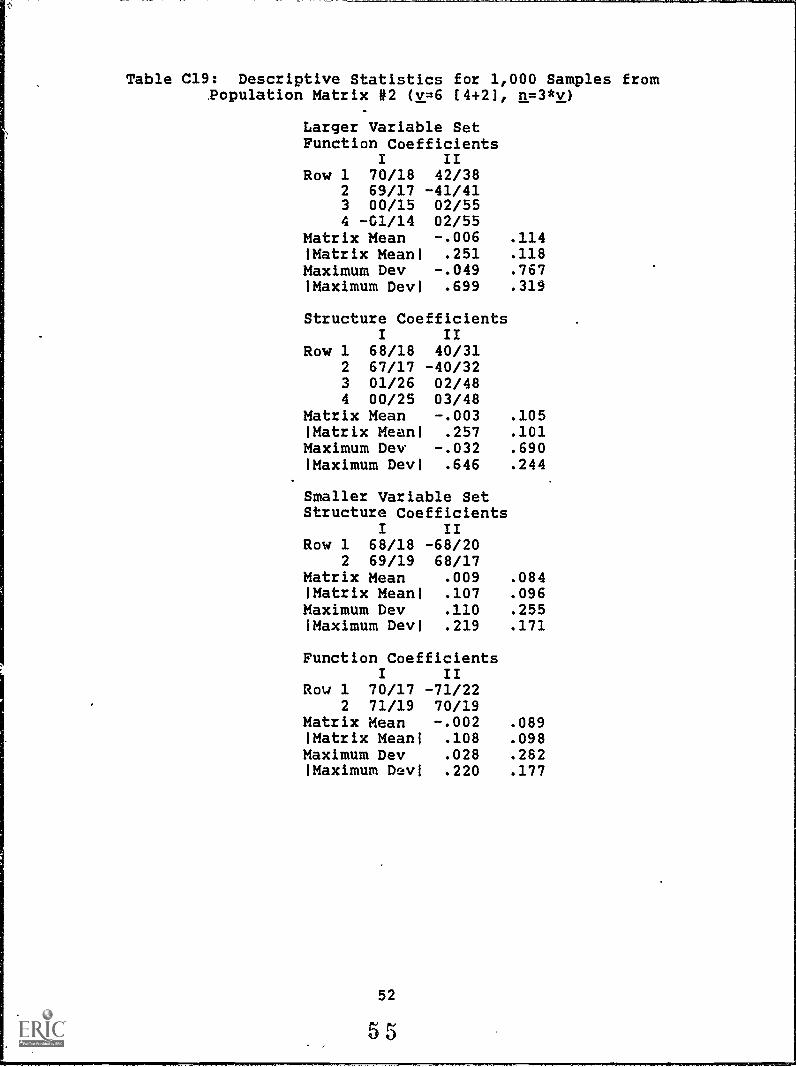
Table C19: Descriptive Statistics for 1,000 Samples fromPopulation Matrix 02 (v=6 [4+21, n=3*v)
Larger Variable SetFunction Coefficients
I IIRow 1 70/18 42/38
2 69/17 -41/413 00/15 02/554 -01/14 02/55
Matrix Mean -.006 .114Matrix Mean! .251 .118Maximum Dev -.049 .767IMaximum Devi .699 .319
Structure CoefficientsI II
Row 1 68/18 40/312 67/17 -40/323 01/26 02/484 00/25 03/48
Matrix Mean -.003 .105!Matrix Mean' .257 .101Maximum Dev -.032 .690IMaximum Devi .646 .244
Smaller Variable SetStructure Coefficients
I IIRow 1 68/18 -68/20
2 69/19 68/17Matrix Mean .009 .084!Matrix Mean! .107 .096Maximum Dev .110 .255Maximum Devi .219 .171
Function CoefficientsI II
Row 1 70/17 -71/222 71/19 70/19
Matrix Mean -.002 .089!Matrix Meanl .108 .098Maximum Dev .028 .282'Maximum Devi .220 .177
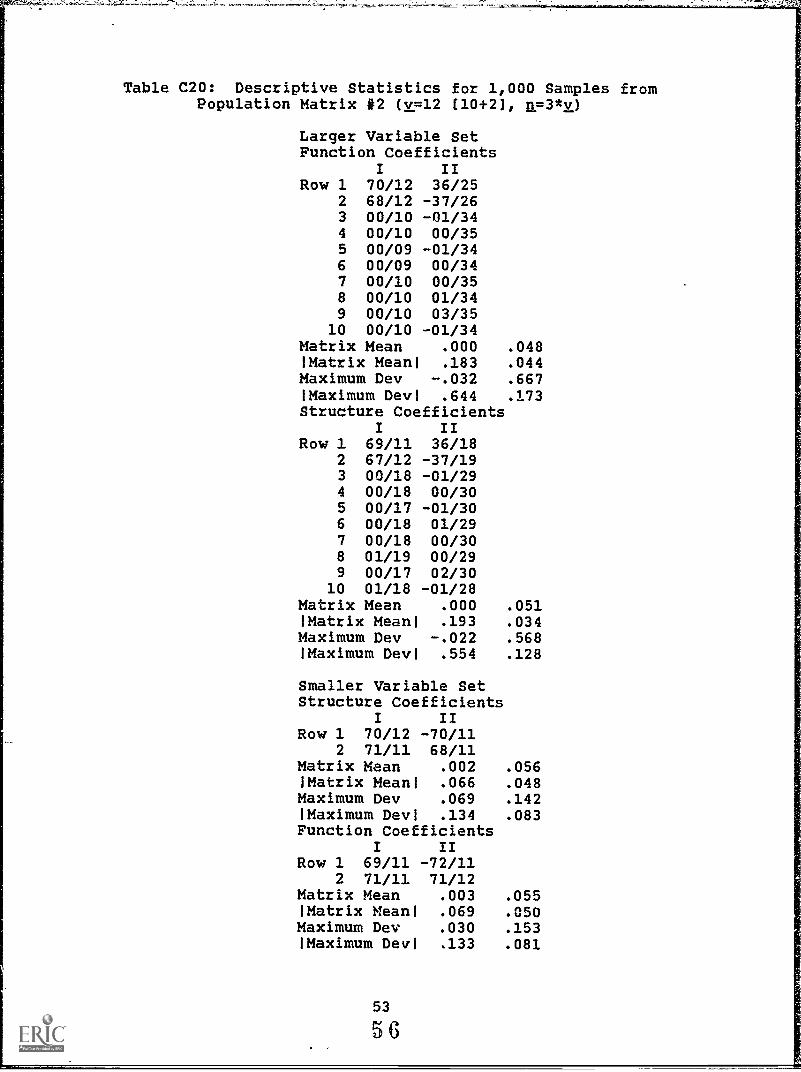
Table C20: Descriptive Statistics for 1,000 Samples fromPopulation Matrix #2 (v=12 (10+21, n=3*v)
Larger Variable SetFunction Coefficients
I IIRow 1 70/12 36/25
2 68/12 -37/263 00/10 -01/344 00/10 00/355 00/09 -01/346 00/09 00/347 00/10 00/358 00/10 01/349 00/10 03/35
10 00/10 -01/34Matrix Mean .000 .048'Matrix Meanl .183 .044Maximum Dev -.032 .667'Maximum Devi .644 .173Structure Coefficients
I IIRow 1 69/11 36/18
2 67/12 -37/193 00/18 -01/294 00/18 00/305 00/17 -01/306 00/18 01/297 00/18 00/308 01/19 00/299 00/17 02/30
10 01/18 -01/28Matrix Mean .000 .051'Matrix Mean' .193 .034Maximum Dev -.022 .568Maximum Devi .554 .128
Smaller Variable SetStructure Coefficients
I IIRow 1 70/12 -70/11
2 71/11 68/11Matrix Mean .002 .056'Matrix Meanl .066 .048Maximum Dev .069 .142'Maximum Devi .134 .083Function Coefficients
I IIRow 1 69/11 -72/11
2 71/11 71/12Matrix Mean .003 .055'Matrix Mean' .069 .050Maximum Dev .030 .153Maximum Devl .133 .081
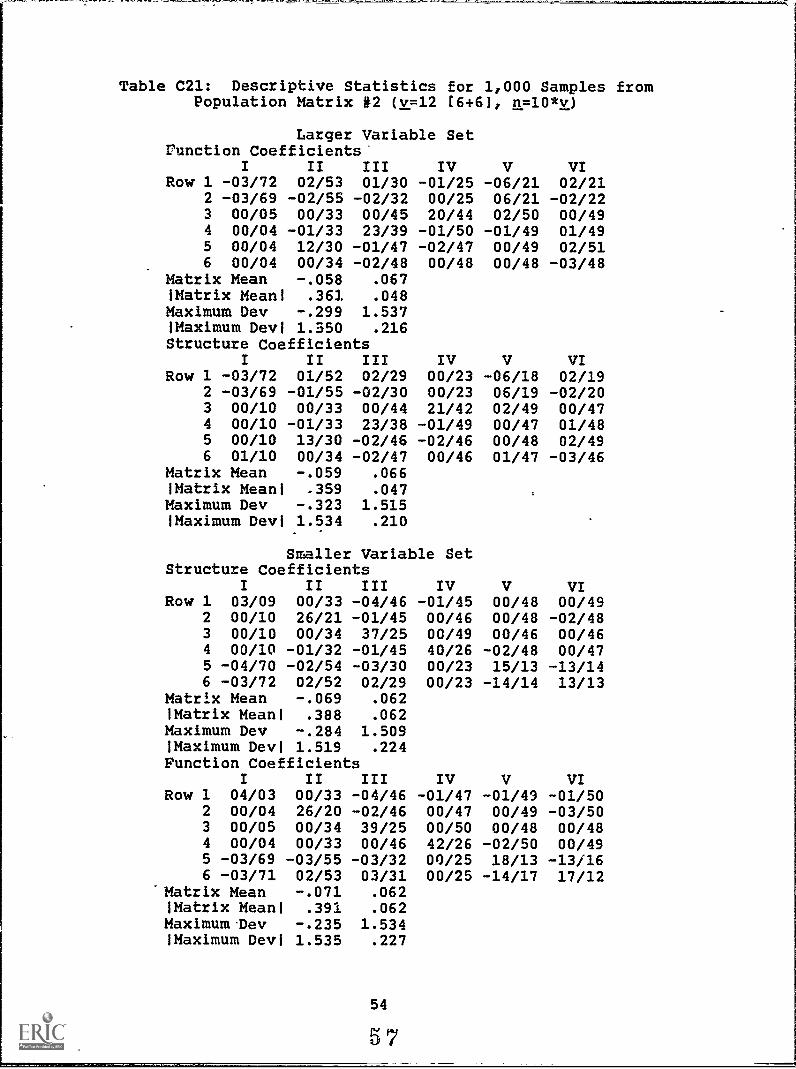
Table C21: Descriptive Statistics for 1,000 Samples fromPopulation Matrix #2 (v=12 (6+6], n=10*v)
Larger Variable Setjunction Coefficients'
I II III IV V VIRow 1 -03/72 02/53 01/30 -01/25 -06/21 02/21
2 -03/69 -02/55 -02/32 00/25 06/21 -02/223 00/05 00/33 00/45 20/44 02/50 00/494 00/04 -01/33 23/39 -01/50 -01/49 01/495 00/04 12/30 -01/47 -02/47 00/49 02/516 00/04 00/34 -02/48 00/48 00/48 -03/48
Matrix Mean -.058 .067(Matrix Meanl .361 .048Maximum Dev -.299 1.537(Maximum Devi 1.550 .216Structure Coefficients
I II III IV V VIRow 1 -03/72 01/52 02/29 00/23 -06/18 02/19
2 -03/69 -01/55 -02/30 00/23 06/19 -02/203 00/10 00/33 00/44 21/42 02/49 00/474 00/10 -01/33 23/38 -01/49 00/47 01/485 00/10 13/30 -02/46 -02/46 00/48 02/496 01/10 00/34 -02/47 00/46 01/47 -03/46
Matrix Mean -.059 .066(Matrix Mean( .359 .047Maximum Dev -.323 1.515(Maximum Devi 1.534 .210
Smaller Variable SetStructure Coefficients
I II III IV V VIRow 1 03/09 00/33 -04/46 -01/45 00/48 00/49
2 00/10 26/21 -01/45 00/46 00/48 -02/483 00/10 00/34 37/25 00/49 00/46 00/464 00/10 -01/32 -01/45 40/26 -02/48 00/475 -04/70 -02/54 -03/30 00/23 15/13 -13/146 -03/72 02/52 02/29 00/23 -14/14 13/13
Matrix Mean -.069 .062(Matrix Meanl .388 .062Maximum Dev -.284 1.509'Maximum Devi 1.519 .224Function Coefficients
I II III IV V VIRow 1 04/03 00/33 -04/46 -01/47 -01/49 -01/50
2 00/04 26/20 -02/46 00/47 00/49 -03/503 00/05 00/34 39/25 00/50 00/48 00/484 00/04 00/33 00/46 42/26 -02/50 00/495 -03/69 -03/55 -03/32 00/25 18/13 -13/166 -03/71 02/53 03/31 00/25 -14/17 17/12
Matrix Mean -.071 .062'Matrix Mean( .391 .062Maximum -Dev -.235 1.534(Maximum Devi 1.535 .227
54
57
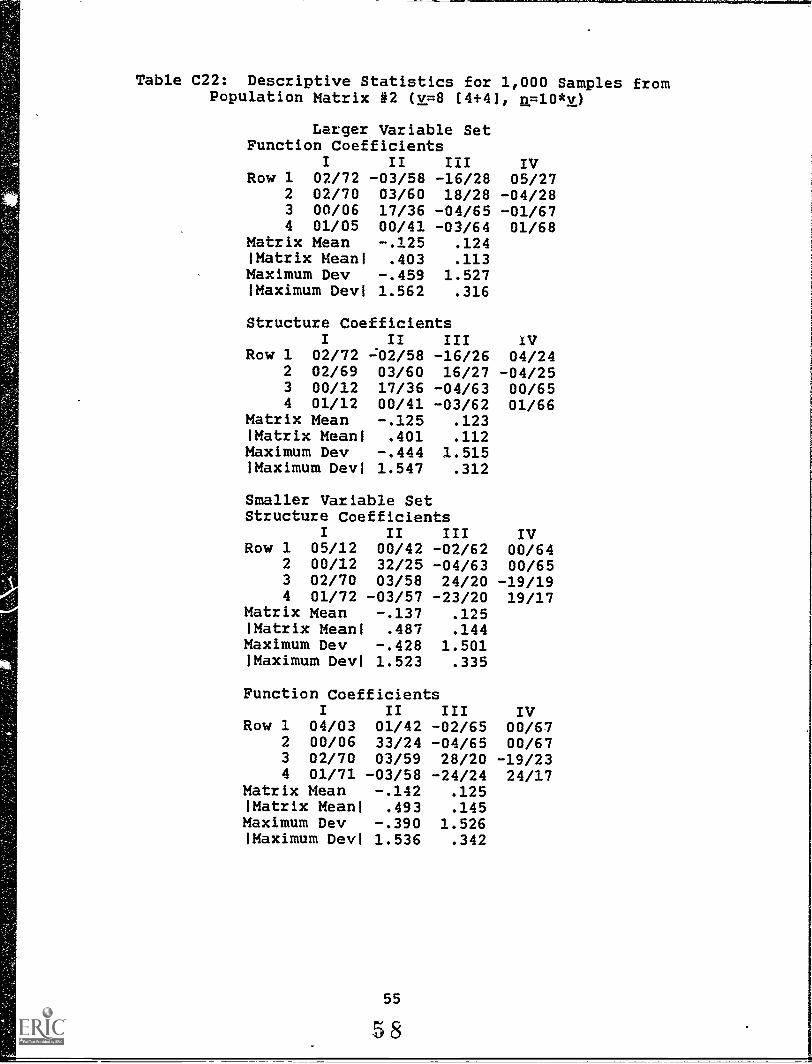
Table C22: Descriptive Statistics for 1,000 Samples fromPopulation Matrix #2 (v=8 (4+4), n=10*v)
Larger Variable SetFunction Coefficients
I II III IVRow 1 02/72 -03/58 -16/28 05/27
2 02/70 03/60 18/28 -04/283 00/06 17/36 -04/65 -01/674 01/05 00/41 -03/64 01/68
Matrix Mean -.125 .124!Matrix Mean! .403 .113Maximum Dev -.459 1.527!Maximum Devi 1.562 .316
Structure CoefficientsI II III IV
Row 1 02/72 02/58 -16/26 04/242 02/69 03/60 16/27 -04/253 00/12 17/36 -04/63 00/654 01/12 00/41 -03/62 01/66
Matrix Mean -.125 .123Matrix Mean! .401 .112Maximum Dev -.444 1.515!Maximum Devi 1.547 .312
Smaller Variable SetStructure Coefficients
I II III IVRow 1 05/12 00/42 -02/62 00/64
2 00/12 32/25 -04/63 00/653 02/70 03/58 24/20 -19/194 01/72 -03/57 -23/20 19/17
Matrix Mean -.137 .125!Matrix Mean! .487 .144Maximum Dev -.428 1.501!Maximum Dev! 1.523 .335
Function CoefficientsI II III IV
Row 1 04/03 01/42 -02/65 00/672 00/06 33/24 -04/65 00/673 02/70 03/59 28/20 -19/234 01/71 -03/58 -24/24 24/17
Matrix Mean -.142 .125!Matrix Mean! .493 .145Maximum Dev -.390 1.526!Maximum Devi 1.536 .342
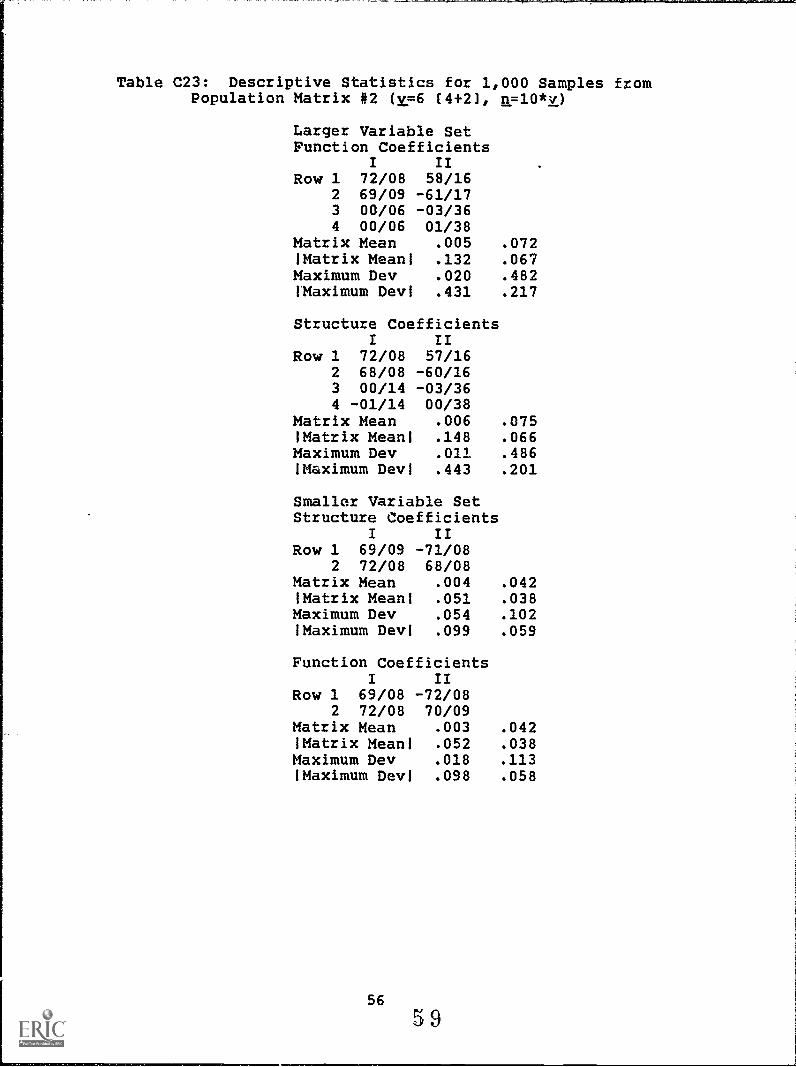
Table C23: Descriptive Statistics for 1,000 Samples fromPopulation Matrix #2 (v=6 (4+2), n=10*y)
Larger Variable SetFunction Coefficients
I IIRow 1 72/08 58/16
2 69/09 -61/173 00/06 -03/364 00/06 01/38
Matrix Mean .005 .072!Matrix Mean! .132 .067Maximum Dev .020 .482!Maximum Dev! .431 .217
Structure CoefficientsI II
Row 1 72/08 57/162 68/08 -60/163 00/14 -03/364 -01/14 00/38
Matrix Mean .006 .075!Matrix Meanl .148 .066Maximum Dev .011 .486!Maximum Dev! .443 .201
Smaller Variable SetStructure Coefficients
I IIRow 1 69/09 -71/08
2 72/08 68/08Matrix Mean .004 .042!Matrix Meant .051 .038Maximum Dev .054 .102!Maximum Devi .099 .059
Function CoefficientsI II
Row 1 69/08 -72/082 72/08 70/09
Matrix Mean .003 .042!Matrix Meanl .052 .038Maximum Dev .018 .113!Maximum Devl .098 .058
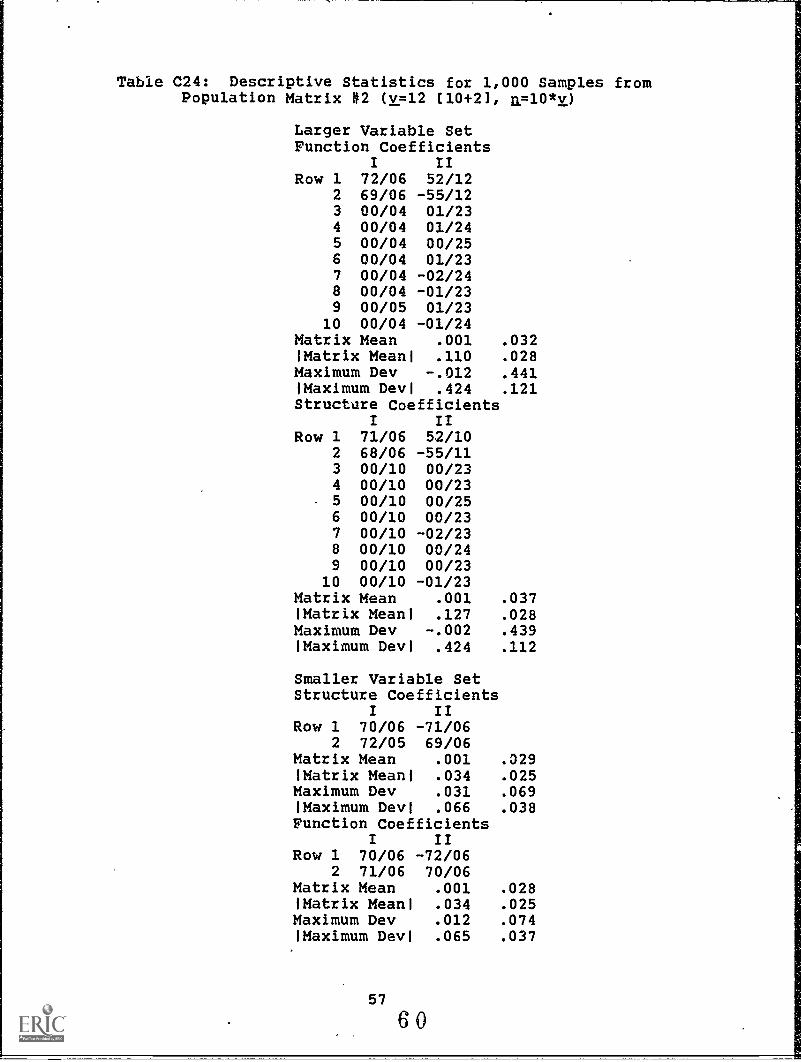
Table C24: Descriptive Statistics for 1,000 Samples fromPopulation Matrix 02 (v=12 (10+2], n=10*v)
Larger Variable SetFunction Coefficients
I IIRow 1 72/06 52/12
2 69/06 -55/123 00/04 01/234 00/04 01/245 00/04 00/256 00/04 01/237 00/04 -02/248 00/04 -01/239 00/05 01/23
10 00/04 -01/24Matrix Mean .001 .032'Matrix Mean' .110 .028Maximum Dev -.012 .441IMaximum Devi .424 .121Structure Coefficients
I IIRow 1 71/06 52/10
2 68/06 -55/113 00/10 00/234 00/10 00/235 00/10 00/256 00/10 00/237 00/10 -02/238 00/10 00/249 00/10 00/23
10 00/10 -01/23Matrix Mean .001 .037'Matrix Mean' .127 .028Maximum Dev -.002 .439'Maximum Devi .424 .112
Smaller Variable SetStructure Coefficients
I IIRow 1 70/06 -71/06
2 72/05 69/06Matrix Mean .001 .329'Matrix Mean' .034 .025Maximum Dev .031 .069'Maximum Devi .066 .038Function Coefficients
I IIRow 1 70/06 -72/06
2 71/06 70/06Matrix Mean .001 .028'Matrix Meani .034 .025Maximum Dev .012 .074'Maximum Devi .065 .037

Table C25: Descriptive Statistics for 1,000 Samples fromPopulation Matrix #2 (v=12 (6+6), n=25*v)
Larger Variable SetFunction Coefficients
I II III IV V VIRow 1 00/72 00/62 00/20 00/16 -05/14 03/13
2 00/69 00/65 00/21 01/17 05/15 -03/143 00/03 01/22 00/49 31/39 00/48 01/504 00/03 00/22 35/35 02/49 03/50 -01/485 00/03 10/20 -02/48 00/50 00/49 01/506 00/03 00/21 00/46 -01/49 -01/50 02/51
Matrix Mean -.069 .066'Matrix Meanl .334 .052Maximum Dev -.402 1.514'Maximum Devl 1.551 .210Structure Coefficients
I II III IV V VIRow 1 00/72 00/62 00/19 00/15 -05/13 03/12
2 00/69 00/65 0J/20 00/15 05/13 -03/123 00/06 01/23 -01/49 31/38 00/47 01/494 00/06 00/22 35/35 02/48 03/49 -01/475 00/06 10/21 -02/47 00/49 00/48 00/496 01/06 00/22 00/46 00/48 00/50 02/50
Matrix Mean -.068 .066'Matrix Meanl .334 .051Maximum Dev -.440 1.497!Maximum Devl 1.545 .210
Smaller Variable SetStructure Coefficients
I II III IV V VIRow 1 02/06 -01/22 -01/47 00/49 -02/49 00/50
2 00/06 16/14 -03/48 00/48 01/50 -04/493 00/06 00/23 42/26 02/48 03/49 02/474 00/06 01/24 -01/48 42/26 -01/47 02/495 00/70 00/64 00/20 00/15 10/10 -09/106 00/72 00/63 00/19 00/15 -10/10 09/09
Matrix Mean -.073 .065'Matrix Mean! .369 .066Maximum Dev -.311 1.518'Maximum Devi 1.533 .219Function Coefficients
I II III IV V VIRow 1 02/02 -01/22 -01/47 00/50 -02/50 00/51
2 00/03 16/13 -03/48 00/48 01/50 -04/503 00/02 00/22 42/26 02/49 03/50 02/484 00/03 01/23 00/49 43/26 -01/48 02/505 00/70 00/64 00/21 00/16 12/09 - 09/116 00/71 00/63 00/20 00/16 -10/12 11/08
Matrix Mean -.074 .066'Matrix Mean! .370 .066Maximum Dev -.281 1.529'Maximum Devl 1.538 .220
58
61
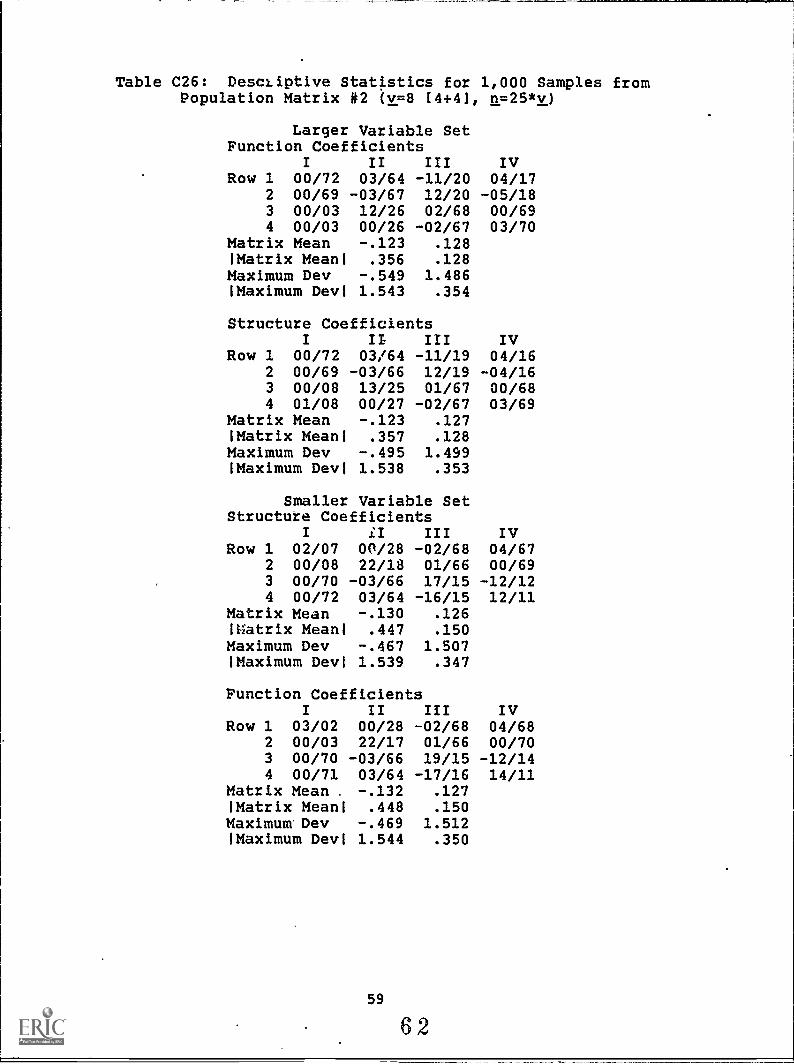
Table C26: Descriptive Statistics for 1,000 Samples fromPopulation Matrix 02 (v=8 (4+41, n=25*v)
Larger Variable SetFunction Coefficients
I II III IVRow 1 00/72 03/64 -11/20 04/17
2 00/69 -03/67 12/20 -05/183 00/03 12/26 02/68 00/694 00/03 00/26 -02/67 03/70
Matrix Mean -.123 .128!Matrix MeanI .356 .128Maximum Dev -.549 1.486Maximum Devi 1.543 .354
Structure CoefficientsI I1 III IV
Row 1 00/72 03/64 -11/19 04/162 00/69 -03/66 12/19 -04/163 00/08 13/25 01/67 00/684 01/08 00/27 -02/67 03/69
Matrix Mean -.123 .127!Matrix MeanI .357 .128Maximum Dev -.495 1.499'Maximum Devi 1.538 .353
Smaller Variable SetStructure Coefficients
I iI III IVRow 1 02/07 00/28 -02/68 04/67
2 00/08 22/18 01/66 00/693 00/70 -03/66 17/15 -12/124 00/72 03/64 -16/15 12/11
Matrix Mean -.130 .126Matrix Meant .447 .150Maximum Dev -.467 1.507!Maximum Devi 1.539 .347
Function CoefficientsI II III IV
Row 1 03/02 00/28 -02/68 04/682 00/03 22/17 01/66 00/703 00/70 -03/66 19/15 -12/144 00/71 03/64 -17/16 14/11
Matrix Mean . -.132 .127!Matrix Mean' .448 .150Maximum' Dev -.469 1.512!Maximum Devi 1.544 .350
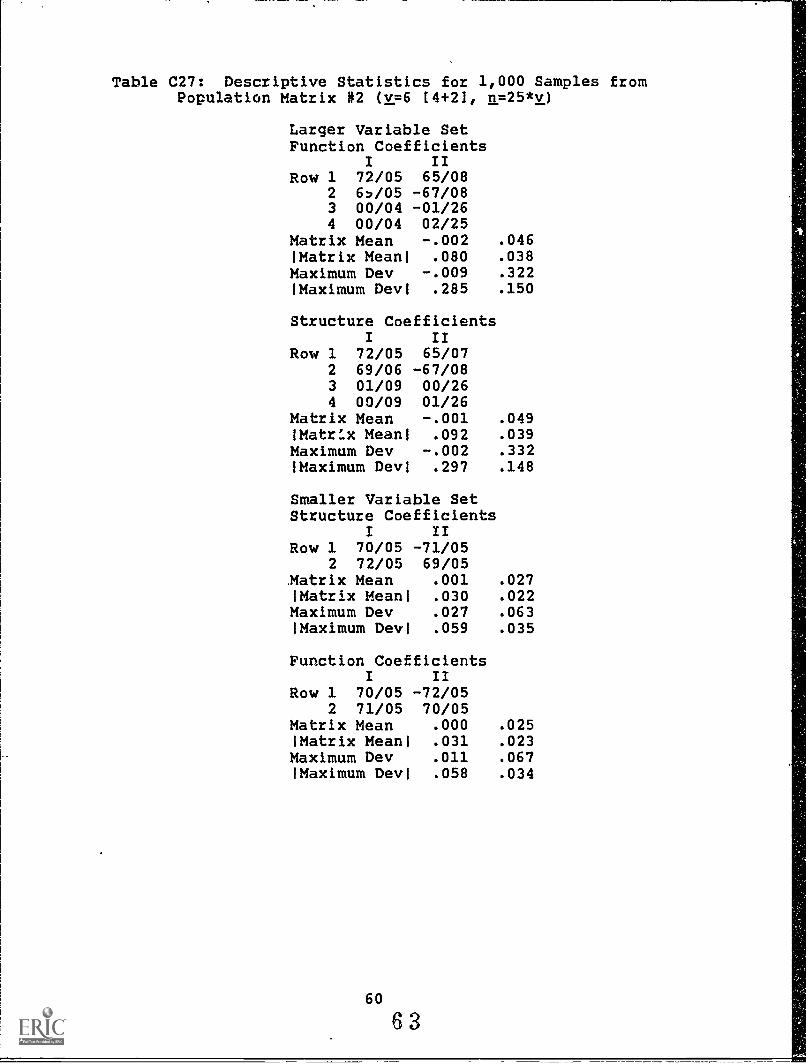
Table C27: Descriptive Statistics for 1,000 Samples fromPopulation Matrix N2 tv=6 [4+2], n=25*v)
Larger Variable SetFunction Coefficients
I IIRow 1 72/05 65/08
2 6/05 -67/083 00/04 -01/264 00/04 02/25
Matrix Mean -.002 .046!Matrix Mean! .080 .038Maximum Dev -.009 .322!Maximum Devi .285 .150
Structure CoefficientsI II
Row 1 72/05 65/072 69/06 -67/083 01/09 00/264 00/09 01/26
Matrix Mean -.001 .049IMatrf.x Meanl .092 .039Maximum Dev -.002 .332!Maximum Devi .297 .148
Smaller Variable SetStructure Coefficients
I IIRow 1 70/05 -71/05
2 72/05 69/05Matrix Mean .001 .027!Matrix Mean! .030 .022Maximum Dev .027 .063!Maximum Devi .059 .035
Function CoefficientsI II
Row 1 70/05 -72/052 71/05 70/05
Matrix Mean .000 .025!Matrix Meanl .031 .023Maximum Dev .011 .067!Maximum Devi .058 .034
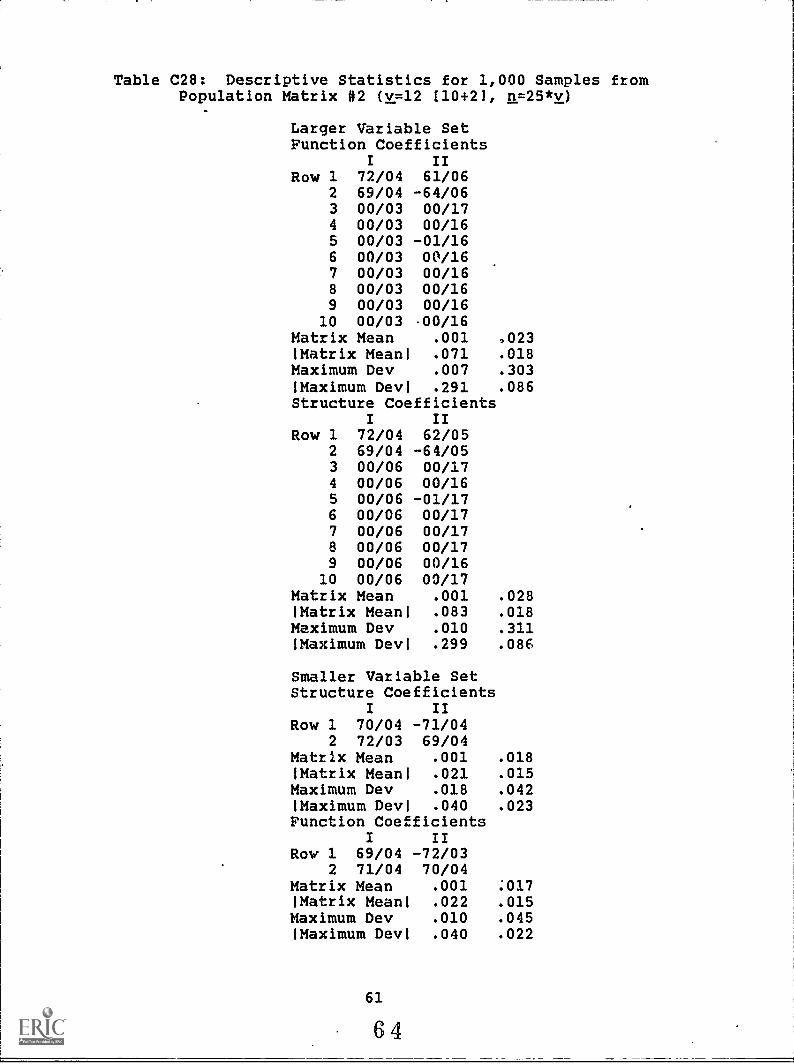
Table C28: Descriptive Statistics for 1,000 Samples fromPopulation Matrix #2 (v=12 (10+21, n=25*v)
Larger Variable SetFunction Coefficients
I IIRow 1 72/04 61/06
2 69/04 -64/063 00/03 00/174 00/03 00/165 00/03 -01/166 00/03 00/167 00/03 00/168 00/03 00/169 00/03 00/16
10 00/03 -00/16Matrix Mean .001 ,023!Matrix Meanl .071 .018Maximum Dev .007 .303'Maximum Devi .291 .086Structure Coefficients
I IIRow 1 72/04 62/05
2 69/04 -64/053 00/06 00/174 00/06 00/165 00/06 -01/176 00/06 00/177 00/06 00/178 00/06 00/179 00/06 00/16
10 00/06 00/17Matrix Mean .001 .028Matrix Meanl .083 .018Maximum Dev .010 .311'Maximum Devl .299 .08E
Smaller Variable SetStructure Coefficients
I IIRow 1 70/04 -71/04
2 72/03 69/04Matrix Mean .001 .018'Matrix Meanl .021 .015Maximum Dev .018 .042'Maximum Devi .040 .023Function Coefficients
I IIRow 1 69/04 -72/03
2 71/04 70/04Matrix Mean .001 .017'Matrix Meanl .022 .015Maximum Dev .010 .045Maximum Devi .040 .022
61
64
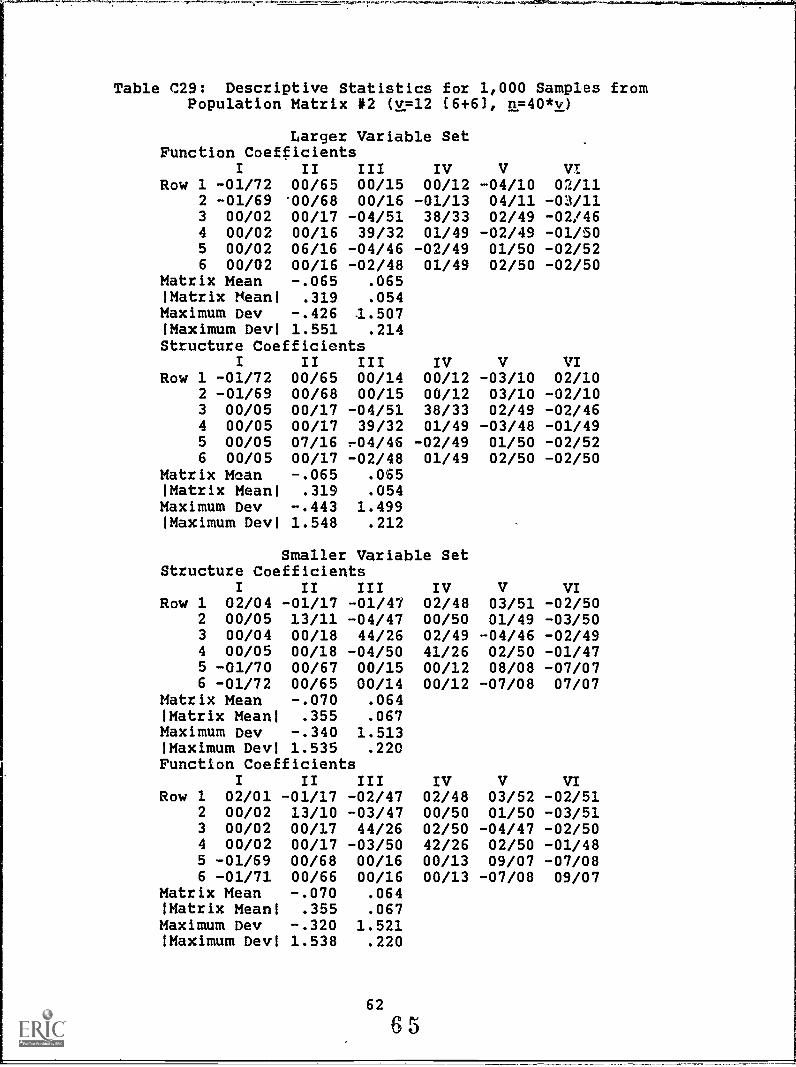
Table C29: Descriptive Statistics for 1,000 Samples fromPopulation Matrix #2 (v=12 (6+6], n=40*v)
Larger. Variable SetFunction Coefficients
I II III IV V VIRow 1 -01/72 00/65 00/15 00/12 -04/10 02/11
2 -01/69 '00/68 00/16 -01/13 04/11 -03/113 00/02 00/17 -04/51 38/33 02/49 -02/464 00/02 00/16 39/32 01/49 -02/49 -01/505 00/02 06/16 -04/46 -02/49 01/50 -02/526 00/02 00/16 -02/48 01/49 02/50 -02/50
Matrix Mean -.065 .065!Matrix Mean! .319 .054Maximum Dev -.426 .1.507(Maximum Dev! 1.551 .214Structure Coefficients
I II III IV V VIRow 1 -01/72 00/65 00/14 00/12 -03/10 02/10
2 -01/69 00/68 00/15 00/12 03/10 -02/103 00/05 00/17 -04/51 38/33 02/49 -02/464 00/05 00/17 39/32 01/49 -03/48 -01/495 00/05 07/16 -04/46 -02/49 01/50 -02/526 00/05 00/17 -02/48 01/49 02/50 -02/50
Matrix Mean -.065 .065(Matrix Mean! .319 .054Maximum Dev -.443 1.499!Maximum Dev! 1.548 .212
Smaller Variable SetStructure Coefficients
I II III IV V VIRow 1 02/04 -01/17 -01/47 02/48 03/51 -02/50
2 00/05 13/11 -04/47 00/50 01/49 -03/503 00/04 00/18 44/26 02/49 -04/46 -02/494 00/05 00/18 -04/50 41/26 02/50 -01/475 -01/70 00/67 00/15 00/12 08/08 -07/076 -01/72 00/65 00/14 00/12 -07/08 07/07
Matrix Mean -.070 .064!Matrix Mean! .355 .067Maximum Dev -.340 1.513!Maximum Dev! 1.535 .220Function Coefficients
I II III IV V VIRow 1 02/01 -01/17 -02/47 02/48 03/52 -02/51
2 00/02 13/10 -03/47 00/50 01/50 -03/513 00/02 00/17 44/26 02/50 -04/47 -02/504 00/02 00/17 -03/50 42/26 02/50 -01/485 -01/69 00/68 00/16 00/13 09/07 -07/086 -01/71 00/66 00/16 00/13 -07/08 09/07
Matrix Mean -.070 .064!Matrix Mean! .355 .067Maximum Dev -.320 1.521!Maximum Dev! 1.538 .220
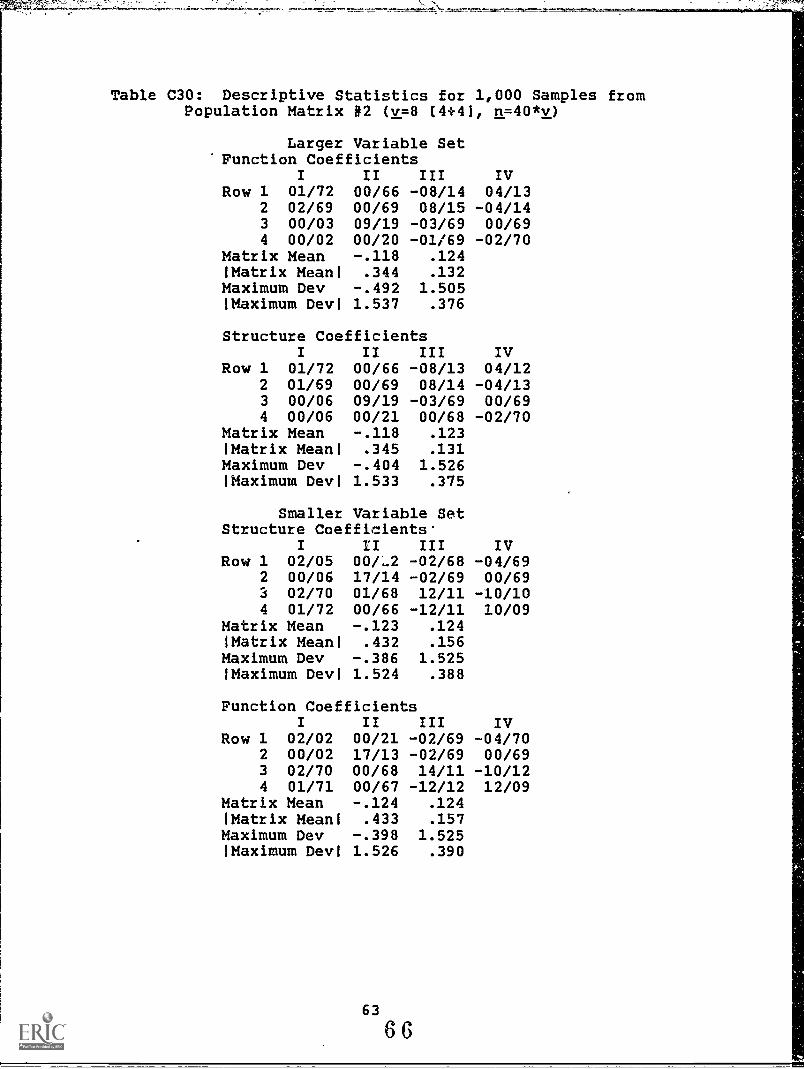
Table C30: Descriptive Statistics for 1,000 Samples fromPopulation Matrix #2 (v=8 (4+4), n=40*v)
Larger Variable SetFunction Coefficients
I II III IVRow 1 01/72 00/66 -08/14 04/13
2 02/69 00/69 08/15 -04/143 00/03 09/19 -03/69 00/694 00/02 00/20 -01/69 -02/70
Matrix Mean -.118 .124'Matrix Meanl .344 .132Maximum Dev -.492 1.505'Maximum Devl 1.537 .376
Structure CoefficientsI II III IV
Row 1 01/72 00/66 -08/13 04/122 01/69 00/69 08/14 -04/133 00/06 09/19 -03/69 00/694 00/06 00/21 00/68 -02/70
Matrix Mean -.118 .123'Matrix Mean' .345 .131Maximum Dev -.404 1.526'Maximum Devl 1.533 .375
Smaller Variable SetStructure Coefficients'
I II III IVRow 1 02/05 00/..2 -02/68 -04/69
2 00/06 17/14 -02/69 00/693 02/70 01/68 12/11 -10/104 01/72 00/66 -12/11 10/09
Matrix Mean -.123 .124'Matrix Meanl .432 .156Maximum Dev -.386 1.525'Maximum Devl 1.524 .388
Function CoefficientsI II III IV
Row 1 02/02 00/21 -02/69 -04/702 00/02 17/13 -02/69 00/693 02/70 00/68 14/11 -10/124 01/71 00/67 -12/12 12/09
Matrix Mean -.124 .124'Matrix Meanl .433 .157Maximum Dev -.398 1.525'Maximum Devi 1.526 .390
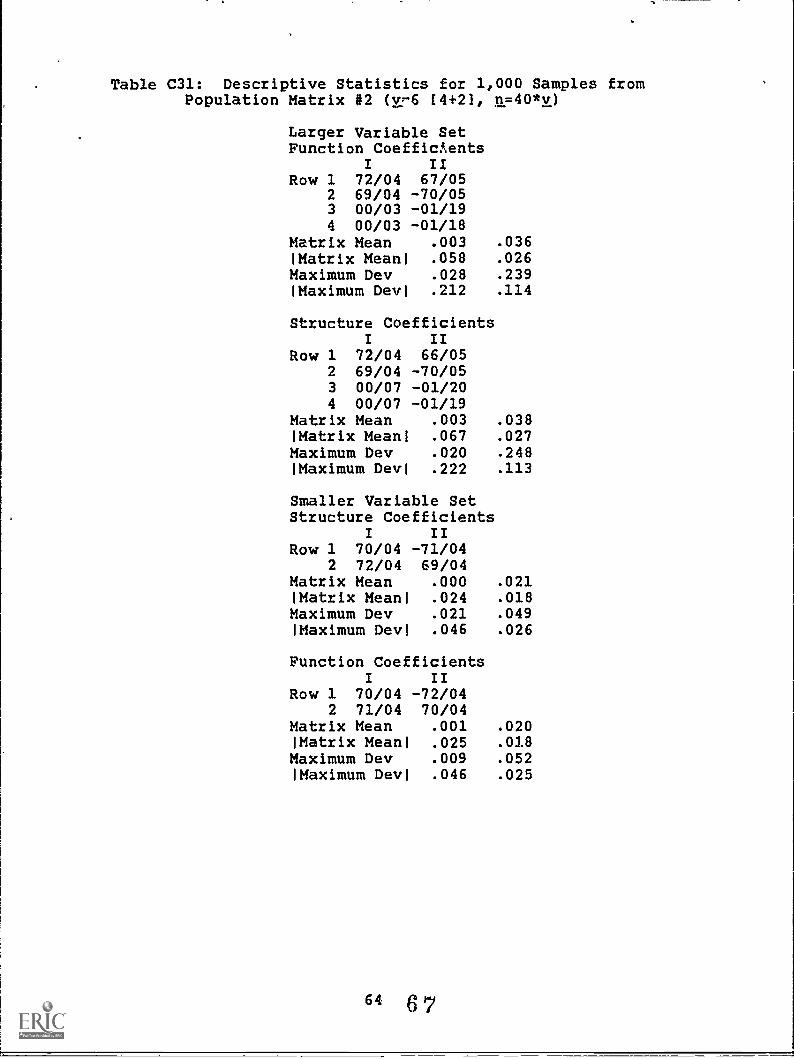
Table C31: Descriptive Statistics for 1,000 Samples fromPopulation Matrix #2 (v,..6 [4+21, n=40*v)
Larger Variable SetFunction Coefficients
I IIRow 1 72/04 67/05
2 69/04 -70/053 00/03 -01/194 00/03 -01/18
Matrix Mean .003 .036Matrix Meanl .058 .026Maximum Dev .028 .239!Maximum Dev) .212 .114
Structure CoefficientsI II
Row 1 72/04 66/052 69/04 -70/053 00/07 -01/204 00/07 -01/19
Matrix Mean .003 .038Matrix Mean! .067 .027Maximum Dev .020 .248Maximum Devi .222 .113
Smaller Variable SetStructure Coefficients
I IIRow 1 70/04 -71/04
2 72/04 69/04Matrix Mean .000 .021Matrix Meanl .024 .018Maximum Dev .021 .049Maximum Devl .046 .026
Function CoefficientsI II
Row 1 70/04 -72/042 71/04 70/04
Matrix Mean .001 .020Matrix Meanl .025 .018Maximum Dev .009 .052Maximum Devl .046 .025
64 67

Table C32: Descriptive Statistics for 1,000 Samples fromPopulation Matrix N2 (v=12 (10+2), n=40*v)
Larger Variable SetFunction Coefficients
I IIRow 1 72/03 64/04
2 69/03 -67/043 00/02 00/134 00/02 00/135 00/02 00/136 00/02 01/137 00/02 00/148 00/02 00/139 00/02 00/13
10 00/02 -01/13Matrix Mean .000 .017!Matrix Mean' .055 .014Maximum Dev .007 .245'Maximum Devi .235 .069Structure Coefficients
I IIRow 1 72/03 64/04
2 69/03 -67/043 00/05 00/134 00/04 00/145 00/05 00/146 00/05 01/137 00/05 00/148 00/05 00/149 00/04 00/14
10 00/05 -01/13Matrix Mean .00n .021'Matrix Mean' .065 .015Maximum Dev .003 .254'Maximum Devi .244 .072
Smaller Variable SetStructure Coefficients
I IIRow 1 70/03 -71/03
2 72/03 70/03Matrix Mean -.001 .014'Matrix Mean' .016 .011Maximum Dev .011 .034'Maximum Devi .031 .017Function Coefficients
I IIRow 1 70/03 -72/03
2 71/03 70/03Matrix Mean .000 .013(Matrix Mean' .016 .011Maximum Dev .005 .035'Maximum Devi .031 .017
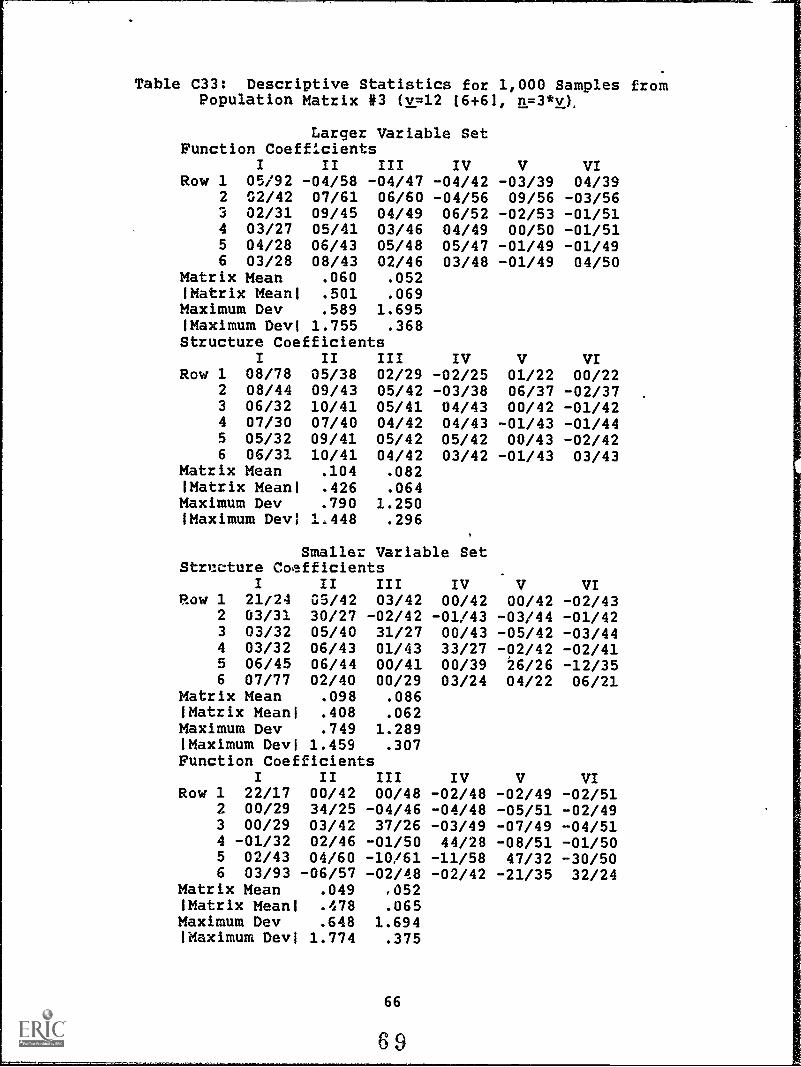
Table C33: Descriptive Statistics for 1,000 Samples fromPopulation Matrix #3 (v=12 (6+61, n=3*v),
Larger Variable SetFunction Coefficients
I II III IV V VIRow 1 05/92 -04/58 -04/47 -04/42 -03/39 04/39
2 02/42 07/61 06/60 -04/56 09/56 -03/563 02/31 09/45 04/49 06/52 -02/53 -01/514 03/27 05/41 03/46 04/49 00/50 -01/515 04/28 06/43 05/48 05/47 -01/49 -01/496 03/28 08/43 02/46 03/48 -01/49 04/50
Matrix Mean .060 .052'Matrix Mean! .501 .069Maximum Dev .589 1.695'Maximum Devi 1.755 .368Structure Coefficients
I II III IV V VIRow 1 08/78 05/38 02/29 -02/25 01/22 00/22
2 08/44 09/43 05/42 -03/38 06/37 -02/373 06/32 10/41 05/41 04/43 00/42 -01/424 07/30 07/40 04/42 04/43 -01/43 -01/445 05/32 09/41 05/42 05/42 00/43 -02/426 06/31 10/41 04/42 03/42 -01/43 03/43
Matrix Mean .104 .082!Matrix Mean' .426 .064Maximum Dev .790 1.250'Maximum Devi 1.448 .296
Smaller Variable SetStructure Coefficients
I II III IV V VIRow 1 21/24 05/42 03/42 00/42 00/42 -02/43
2 03/31 30/27 -02/42 -01/43 -03/44 -01/423 03/32 05/40 31/27 00/43 -05/42 -03/444 03/32 06/43 01/43 33/27 -02/42 -02/415 06/45 06/44 00/41 00/39 26/26 -12/356 07/77 02/40 00/29 03/24 04/22 06/21
Matrix Mean .098 .086'Matrix Mean' .408 .062Maximum Dev .749 1.289'Maximum Devi 1.459 .307Function Coefficients
I II III IV V VIRow 1 22/17 00/42 00/48 -02/48 -02/49 -02/51
2 00/29 34/25 -04/46 -04/48 -05/51 -02/493 00/29 03/42 37/26 -03/49 -07/49 -04/514 -01/32 02/46 -01/50 44/28 -08/51 -01/505 02/43 04/60 -10/61 -11/58 47/32 -30/506 03/93 -06/57 -02/48 -02/42 -21/35 32/24
Matrix Mean .049 ,052!Matrix Mean! .478 .065Maximum Dev .648 1.694!Maximum Devi 1.774 .375
66
69
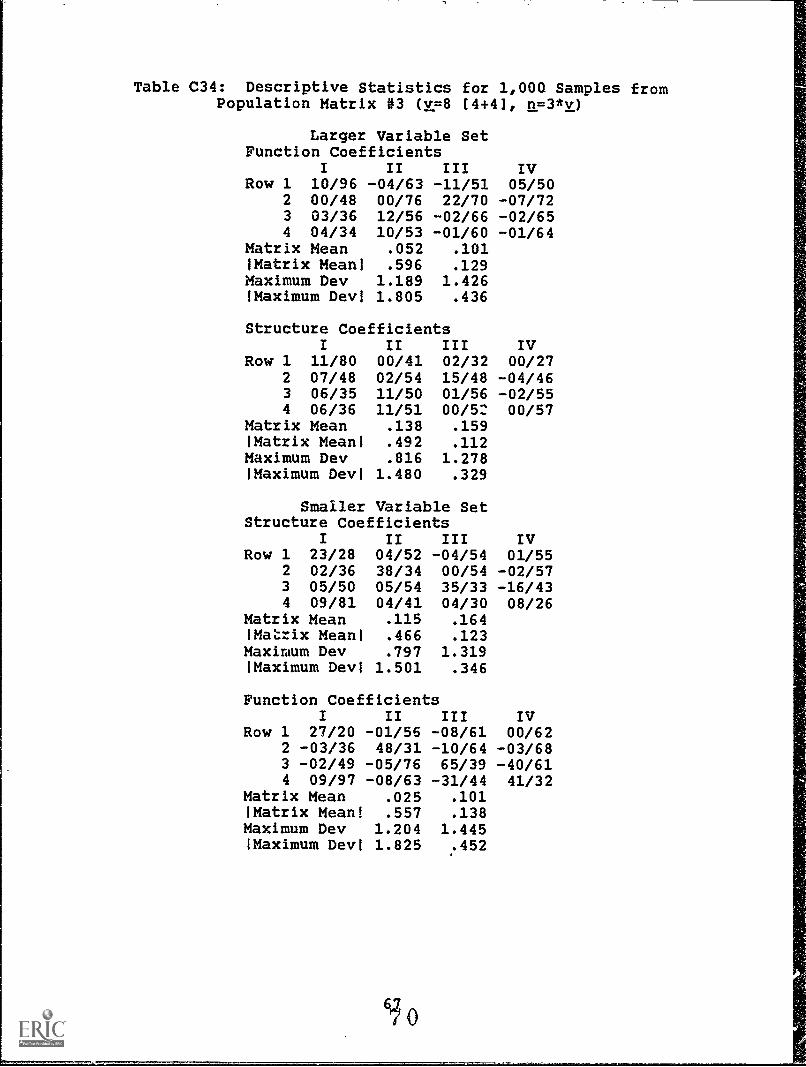
Table C34: Descriptive Statistics for 1,000 Samples fromPopulation Matrix #3 (v=8 (4+4), n=3*v)
Larger Variable SetFunction Coefficients
I II III IVRow 1 10/96 -04/63 -11/51 05/50
2 00/48 00/76 22/70 -07/723 03/36 12/56 -02/66 -02/654 04/34 10/53 -01/60 -01/64
Matrix Mean .052 .101!Matrix Mean! .596 .129Maximum Dev 1.189 1.426!Maximum Dev! 1.805 .436
Structure CoefficientsI II III IV
Row 1 11/80 00/41 02/32 00/272 07/48 02/54 15/48 -04/463 06/35 11/50 01/56 -02/554 06/36 11/51 00/52 00/57
Matrix Mean .138 .159!Matrix Meanl .492 .112Maximum Dev .816 1.278!Maximum Devl 1.480 .329
Smaller Variable SetStructure Coefficients
I II III IVRow 1 23/28 04/52 -04/54 01/55
2 02/36 38/34 00/54 -02/573 05/50 05/54 35/33 -16/434 09/81 04/41 04/30 08/26
Matrix Mean .115 .164!Matrix Meanl .466 .123Maximum Dev .797 1.319!Maximum Devi 1.501 .346
Function CoefficientsI II III IV
Row 1 27/20 -01/56 -08/61 00/622 -03/36 48/31 -10/64 -03/683 -02/49 -05/76 65/39 -40/614 09/97 -08/63 -31/44 41/32
Matrix Mean .025 .101!Matrix Mean! .557 .138Maximum Dev 1.204 1.445!Maximum Dev! 1.825 .452
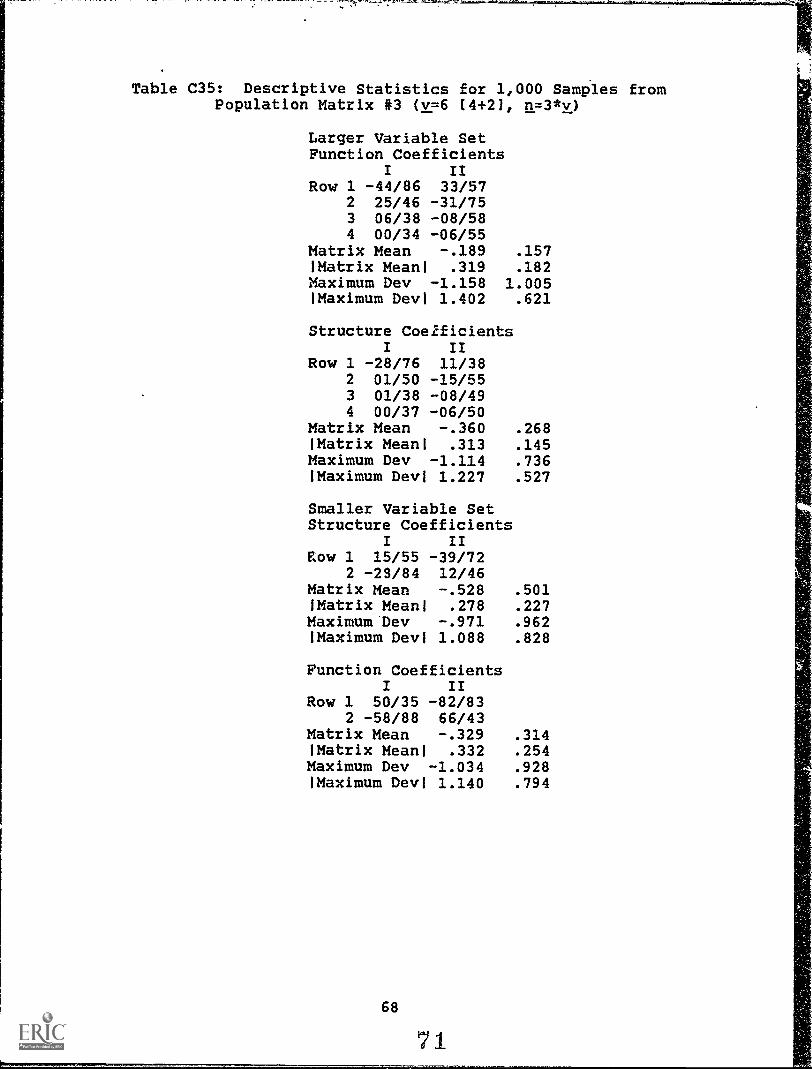
Table C35: Descriptive Statistics for 1,000 Samples fromPopulation Matrix #3 (v=6 (4+21, n=3*v)
Larger Variable SetFunction Coefficients
I IIRow 1 -44/86 33/57
2 25/46 -31/753 06/38 -08/584 00/34 -06/55
Matrix Mean -.189 .157'Matrix Meant .319 .182Maximum Dev -1.158 1.005'Maximum Devi 1.402 .621
Structure CoefficientsI II
Row 1 -28/76 11/382 01/50 -15/553 01/38 -08/494 00/37 -06/50
Matrix Mean -.360 .268!Matrix Meant .313 .145Maximum Dev -1.114 .736!Maximum Devi 1.227 .527
Smaller Variable SetStructure Coefficients
I IIEow 1 15/55 -39/72
2 -29/84 12/46Matrix Mean -.528 .501'Matrix Meant .278 .227Maximum Dev -.971 .962'Maximum Devi 1.088 .828
Function CoefficientsI II
Row 1 50/35 -82/832 -58/88 66/43
Matrix Mean -.329 .314Matrix Meant .332 .254Maximum Dev -1.034 .928'Maximum Devi 1.140 .794
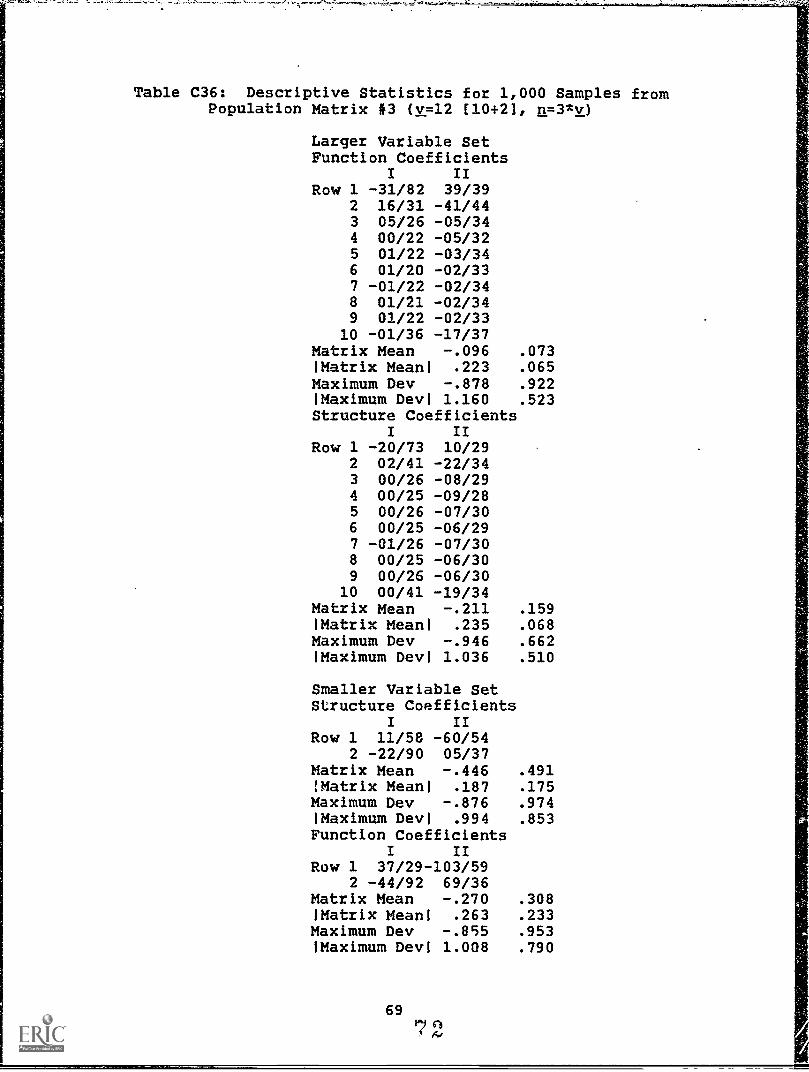
Table C36: Descriptive Statistics for 1,000 Samples fromPopulation Matrix 13 (v=12 (10+21, n=3*v)
Larger Variable SetFunction Coefficients
I IIRow 1 -31/82 39/39
2 16/31 -41/443 05/26 -05/344 00/22 -05/325 01/22 -03/346 01/20 -02/337 -01/22 -02/348 01/21 -02/349 01/22 -02/33
10 -01/36 -17/37Matrix Mean -.096 .073'Matrix Mean' .223 .065Maximum Dev -.878 .922'Maximum Devi 1.160 .523Structure Coefficients
I IIRow 1 -20/73 10/29
2 02/41 -22/343 00/26 -08/294 00/25 -09/285 00/26 -07/306 00/25 -06/297 -01/26 -07/308 00/25 -06/309 00/26 -06/30
10 00/41 -19/34Matrix Mean -.211 .159'Matrix Mean' .235 .068Maximum Dev -.946 .662'Maximum Devi 1.036 .510
Smaller Variable SetStructure Coefficients
I IIRow 1 11/58 -60/54
2 -22/90 05/37Matrix Mean -.446 .491'Matrix Mean' .187 .175Maximum Dev -.876 .974'Maximum Devi .994 .853Function Coefficients
I IIRow 1 37/29-103/59
2 -44/92 69/36Matrix Mean -.270 .308!Matrix Mean' .263 .233Maximum Dev -.855 .953'Maximum Del,' 1.008 .790
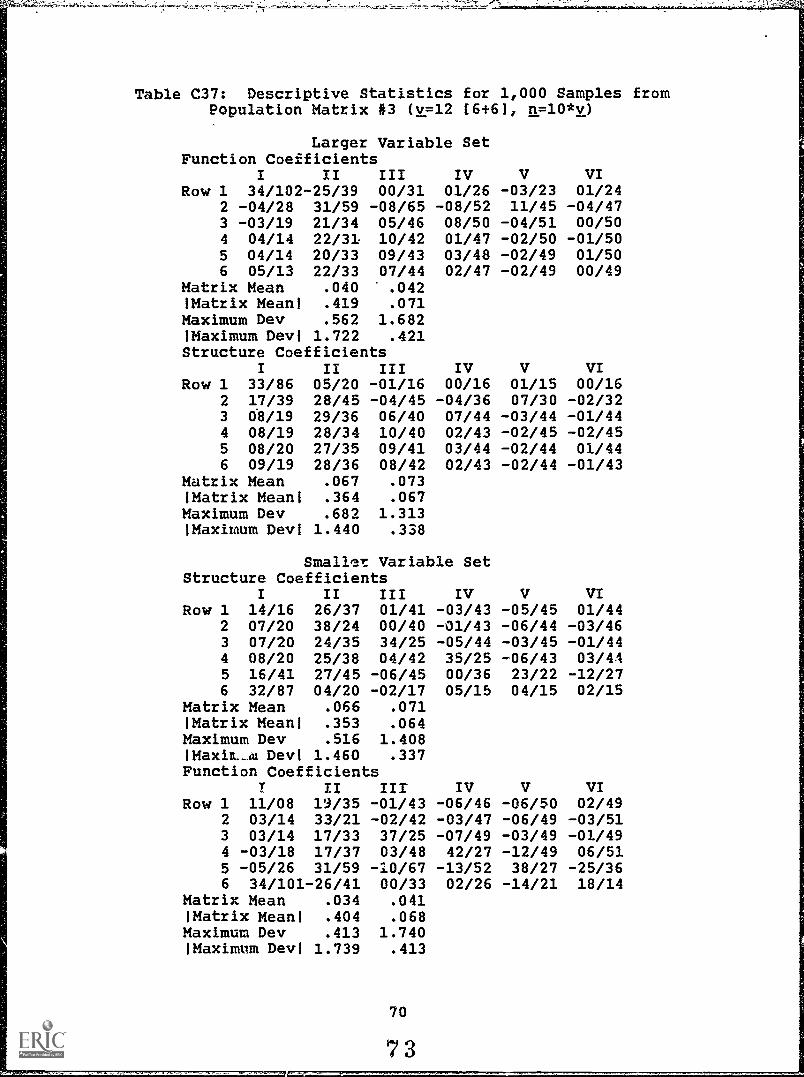
Table C37: Descriptive Statistics for 1,000 Samples fromPopulation Matrix #3 (v=12 (6+6), n=10*v)
Larger Variable SetFunction Coefficients
I II III IV V VIRow 1 34/102-25/39 00/31 01/26 -03/23 01/24
2 -04/28 31/59 -08/65 -08/52 11/45 -04/473 -03/19 21/34 05/46 08/50 -04/51 00/504 04/14 22/31 10/42 01/47 -02/50 -01/505 04/14 20/33 09/43 03/48 -02/49 01/506 05/13 22/33 07/44 02/47 -02/49 00/49
Matrix Mean .040 .042!Matrix Mean' .419 .071Maximum Dev .562 1.682'Maximum Devi 1.722 .421Structure Coefficients
I II III IV V VIRow 1 33/86 05/20 -01/16 00/16 01/15 00/16
2 17/39 28/45 -04/45 -04/36 07/30 -02/323 08/19 29/36 06/40 07/44 -03/44 -01/444 08/19 28/34 10/40 02/43 -02/45 -02/455 08/20 27/35 09/41 03/44 -02/44 01/446 09/19 28/36 08/42 02/43 -02/44 -01/43
Matrix Mean .067 .073(Matrix Mean' .364 .067Maximum Dev .682 1.313'Maximum Devi 1.440 .338
Smaller Variable SetStructure Coefficients
I II III IV V VIRow 1 14/16 26/37 01/41 -03/43 -05/45 01/44
2 07/20 38/24 00/40 -01/43 -06/44 -03/463 07/20 24/35 34/25 -05/44 -03/45 -01/444 08/20 25/38 04/42 35/25 -06/43 03/445 16/41 27/45 -06/45 00/36 23/22 -12/276 32/87 04/20 -02/17 05/15 04/15 02/15
Matrix Mean .066 .071'Matrix Mean' .353 .064Maximum Dev .516 1.408IMaxin_at Dev( 1.460 .337Function Coefficients
II III IV V VIRow 1 11/08 19/35 -01/43 -06/46 -06/50 02/49
2 03/14 33/21 -02/42 -03/47 -06/49 -03/513 03/14 17/33 37/25 -07/49 -03/49 -01/494 -03/18 17/37 03/48 42/27 -12/49 06/515 -05/26 31/59 -0/67 -13/52 38/27 -25/366 34/101-26/41 00/33 02/26 -14/21 18/14
Matrix Mean .034 .041'Matrix Meant .404 .068Maximum Dev .413 1.740'Maximum Devi 1.739 .413
70
7 3

Table C38: Descriptive Statistics for 1,000 Samples fromPopulation Matrix #3 (v=8 (4+4], n=101tv)
Larger Variable SetFunction Coefficients
I II III IVRow 1 27/107-08/46 -15/32 04/30
2 -04/32 08/86 41/56 -07/573 -02/22 20/45 -14/62 04/694 04/16 17/45 -04/61 -02/65
Matrix Mean .033 .092(Matrix Meanl .487 .150Maximum Dev 1.171 1.432(Maximum Devi 1.766 .551
Structure CoefficientsI II III IV
Row 1 24/89 04/26 05/19 01/192 12/41 11/66 27/38 -04/393 05/21 22/46 -06/56 02/614 06/21 19/47 -03/58 -02/60
Matrix Mean .104 .155!Matrix Meanl .418 .134Maximum Dev .819 1.307(Maximum Devi 1.481 .427
Smaller Variable SetStructure Coefficients
I II III IVRow 1 14/18 13/49 -10/56 -01/60
2 04/22 39/31 -06/58 -01/603 11/43 11/64 38/30 -19/344 24/90 07/24 07/19 00/19
Matrix Mean .103 .151(Matrix Meanl .413 .148Maximum Dev .829 1.313(Maximum Devi 1.485 .454
Function CoefficientsII III IV
Row 1 13/10 10/49 -13/59 00/652 -04/21 40/27 -16/63 02/693 -05/32 04/87 59/36 -34/484 26/107-09/49 -22/28 25/19
Matrix Mean .026 .090(Matrix Mean( .477 .160Maximum Dev 1.300 1.364(Maximum Devi 1.793 .577
71
7 4
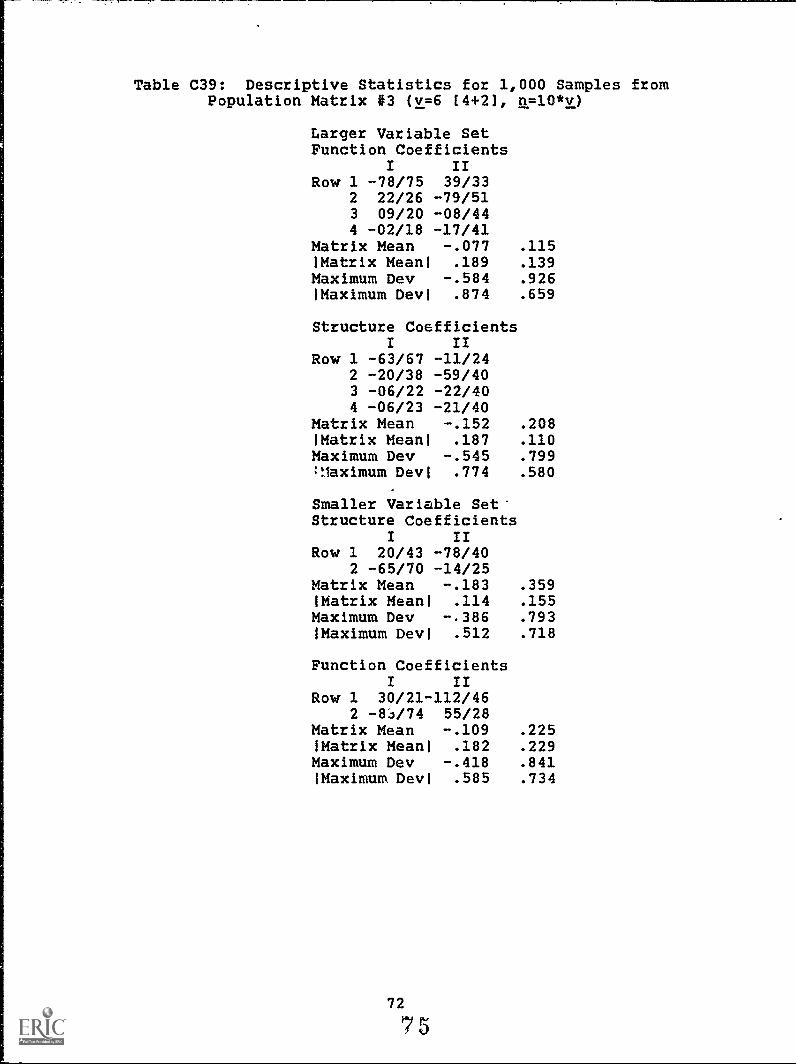
Table C39: Descriptive Statistics for 1,000 Samples fromPopulation Matrix #3 (v=6 (4+23, n=10*v)
Larger Variable SetFunction Coefficients
I IIRow 1 -78/75 39/33
2 22/26 -79/513 09/20 -08/444 -02/18 -17/41
Matrix Mean -.077 .115'Matrix Mean! .189 .139Maximum Dev -.584 .926!Maximum Devi .874 .659
Structure CoefficientsI II
Row 1 -63/67 -11/242 -20/38 -59/403 -06/22 -22/404 -06/23 -21/40
Matrix Mean -.152 .208!Matrix Mean! .187 .110Maximum Dev -.545 .799:Maximum Devi .774 .580
Smaller Variable Set-Structure Coefficients
I IIRow 1 20/43 -78/40
2 -65/70 -14/25Matrix Mean -.183 .359'Matrix Mean! .114 .155Maximum Dev -.386 .793!Maximum Devi .512 .718
Function CoefficientsI II
Row 1 30/21-112/462 -83/74 55/28
Matrix Mean -.109 .225!Matrix Mean! .182 .229Maximum Dev -.418 .841Maximum Devi .585 .734
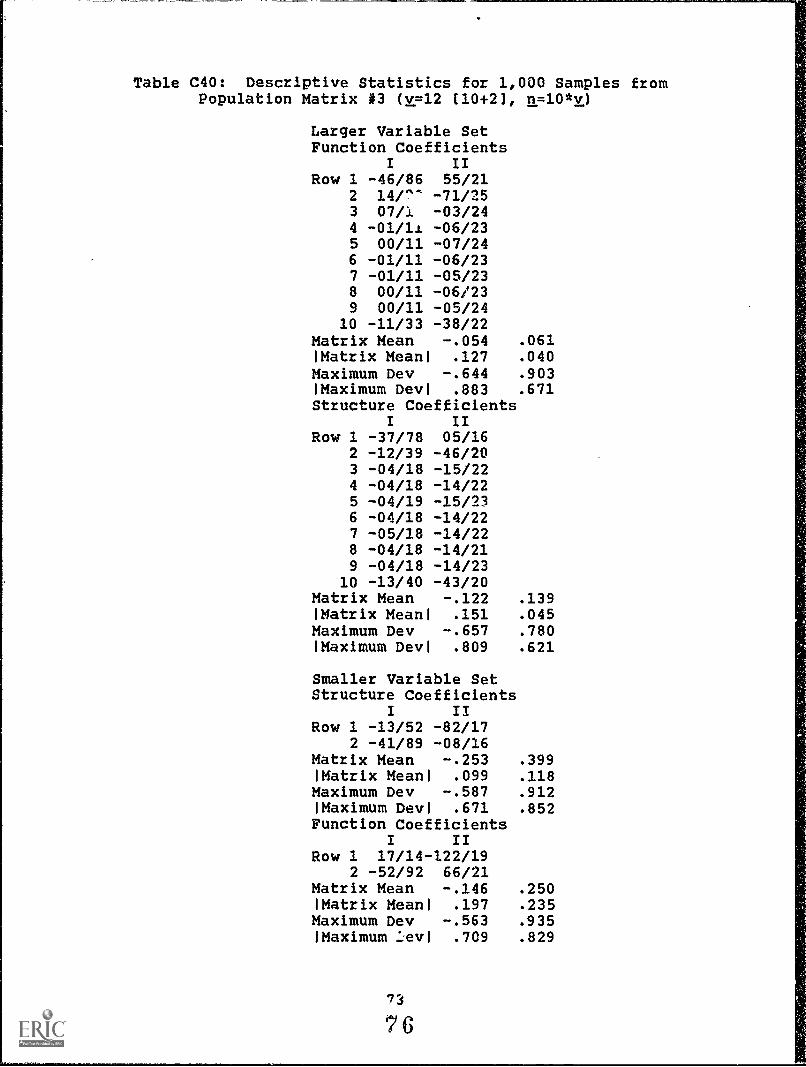
Table C40: Descriptive Statistics for 1,000 Samples fromPopulation Matrix #3 (v=12 (10+21, n=10*v)
Larger Variable SetFunction Coefficients
I IIRow 1 -46/86 55/21
2 14/'" -71/253 07/1 -03/244 -01/11 -06/235 00/11 -07/246 -01/11 -06/237 -01/11 -05/238 00/11 -06/239 00/11 -05/24
10 -11/33 -38/22Matrix Mean -.054 .061'Matrix Meanl .127 .040Maximum Dev -.644 .903'Maximum Devl .883 .671Structure Coefficients
I IIRow 1 -37/78 05/16
2 -12/39 -46/203 -04/18 -15/224 -04/18 -14/225 -04/19 -15/236 -04/18 -14/227 -05/18 -14/228 -04/18 -14/219 -04/18 -14/23
10 -13/40 -43/20Matrix Mean -.122 .139'Matrix Meanl .151 .045Maximum Dev -.657 .780'Maximum Devl .809 .621
Smaller Variable SetStructure Coefficients
I IIRow 1 -13/52 -82/17
2 -41/89 -08/16Matrix Mean -.253 .399'Matrix Meanl .099 .118Maximum Dev -.587 .912'Maximum Devl .671 .852Function Coefficients
I IIRow 1 17/14-122/19
2 -52/92 66/21Matrix Mean -.146 .250'Matrix Meanl .197 .235Maximum Dev -.563 .935!Maximum .evl .709 .829
73
76
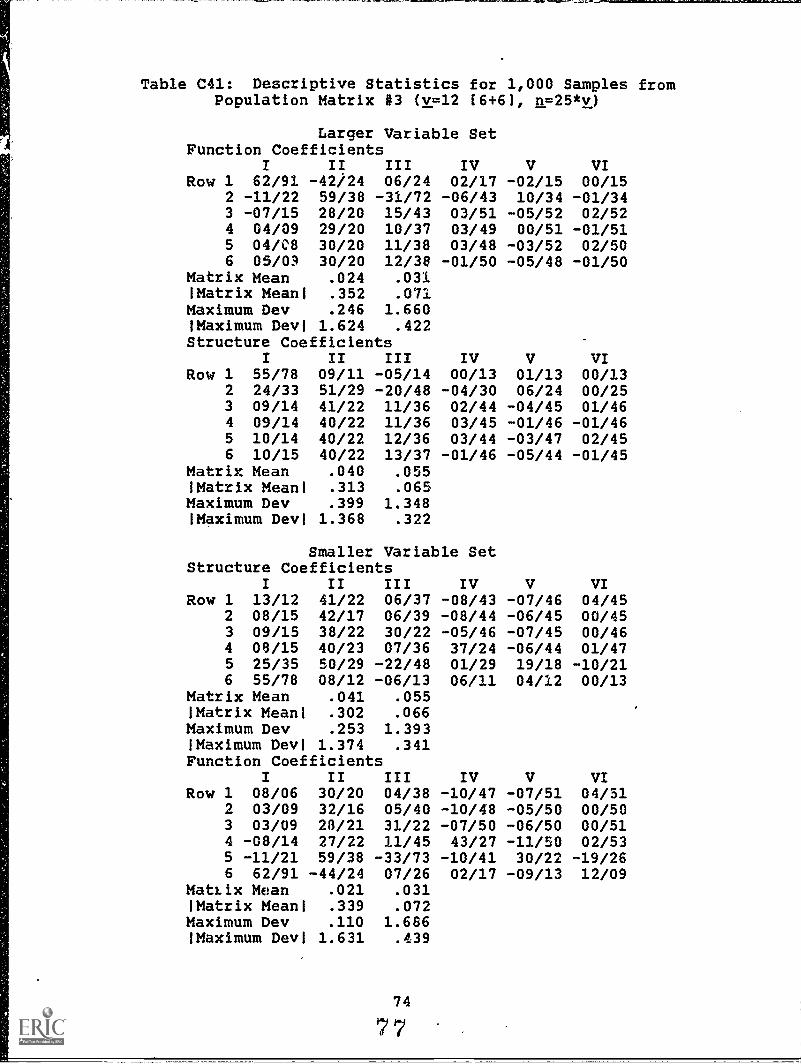
Table C41: Descriptive Statistics for 1,000 Samples fromPopulation Matrix #3 (v=12 (6+6), n=25*v)
Larger Variable SetFunction Coefficients
I II III IV V VIRow 1 62/91 -42)24 06/24 02/17 -02/15 00/15
2 -11/22 59/38 -31/72 -06/43 10/34 -01/343 -07/15 28/20 15/43 03/51 -05/52 02/524 04/09 29/20 10/37 03/49 00/51 -01/515 04/C8 30/20 11/38 03/48 -03/52 02/506 05/03 30/20 12/38 -01/50 -05/48 -01/50
Matrix Mean .024 .031Matrix Meanl .352 .071Maximum Dev .246 1.660!Maximum Devl 1.624 .422Structure Coefficients
I II III IV V VIRow 1 55/78 09/11 -05/14 00/13 01/13 00/13
2 24/33 51/29 -20/48 -04/30 06/24 00/253 09/14 41/22 11/36 02/44 -04/45 01/464 09/14 40/22 11/36 03/45 -01/46 -01/465 10/14 40/22 12/36 03/44 -03/47 02/456 10/15 40/22 13/37 -01/46 -05/44 -01/45
Matrix Mean .040 .055'Matrix Meanl .313 .065Maximum Dev .399 1.348Maximum Devl 1.368 .322
Smaller Variable SetStructure Coefficients
I II III IV V VIRow 1 13/12 41/22 06/37 -08/43 -07/46 04/45
2 08/15 42/17 06/39 -08/44 -06/45 00/453 09/15 38/22 30/22 -05/46 -07/45 00/464 08/15 40/23 07/36 37/24 -06/44 01/475 25/35 50/29 -22/48 01/29 19/18 -10/216 55/78 08/12 -06/13 06/11 04/12 00/13
Matrix Mean .041 .055Matrix Meanl .302 .066Maximum Dev .253 1.393!Maximum Devl 1.374 .341Function Coefficients
I II III IV V VIRow 1 08/06 30/20 04/38 -10/47 -07/51 04/51
2 03/09 32/16 05/40 -10/48 -05/50 00/503 03/09 23/21 31/22 -07/50 -06/50 00/514 -08/14 27/22 11/45 43/27 -11/50 02/535 -11/21 59/38 -33/73 -10/41 30/22 -19/266 62/91 -44/24 07/26 02/17 -09/13 12/09
MatLix Mean .021 .031!Matrix Meanl .339 .072Maximum Dev .110 1.686!Maximum Devl 1.631 .439
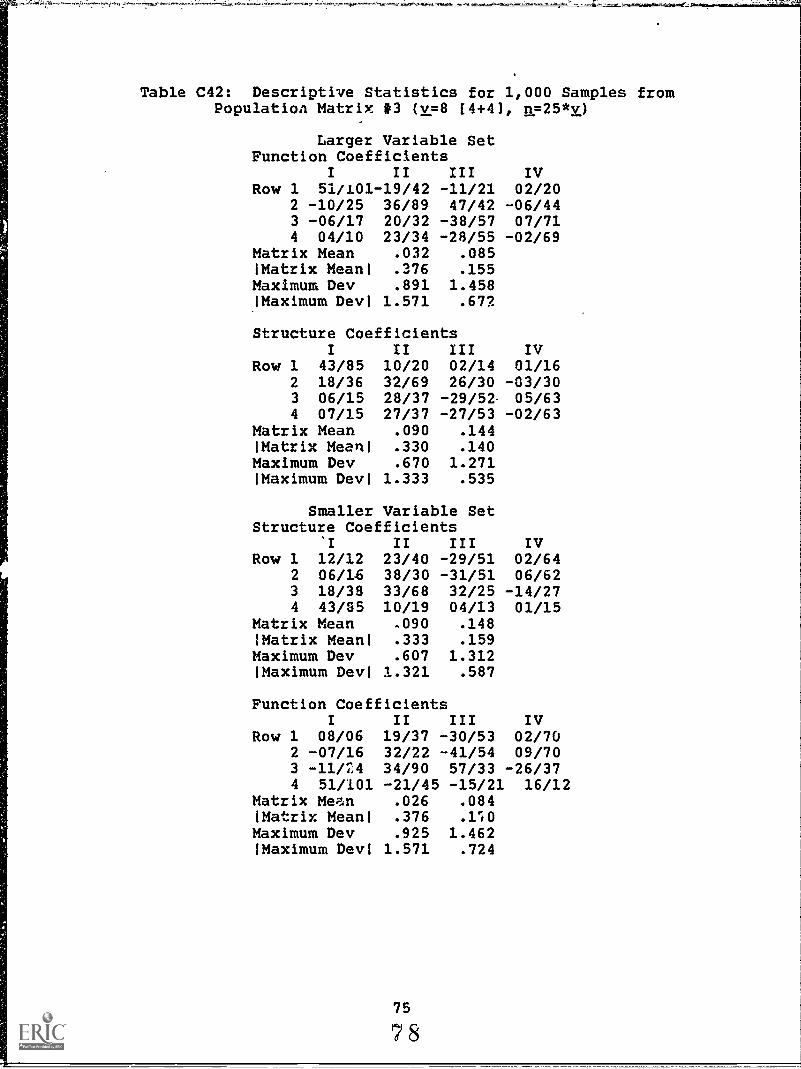
Table C42: Descriptive Statistics for 1,000 Samples fromPopulation Matrix #3 (v=8 (4+41, n=25*v)
Larger Variable SetFunction Coefficients
I II III IVRow 1 51/101-19/42 -11/21 02/20
2 -10/25 36/89 47/42 -06/443 -06/17 20/32 -38/57 07/714 04/10 23/34 -28/55 -02/69
Matrix Mean .032 .085!Matrix Meanl .376 .155Maximum Dev .891 1.458!Maximum Devi 1.571 .672
Structure CoefficientsI II III IV
Row 1 43/85 10/20 02/14 01/162 18/36 32/69 26/30 -03/303 06/15 28/37 -29/52. 05/634 07/15 27/37 -27/53 -02/63
Matrix Mean .090 .144!Matrix Mean! .330 .140Maximum Dev .670 1.271!Maximum Devi 1.333 .535
Smaller Variable SetStructure Coefficients
'I II III IVRow 1 12/12 23/40 -29/51 02/64
2 06/16 38/30 -31/51 06/623 18/38 33/68 32/25 -14/274 43/85 10/19 04/13 01/15
Matrix Mean .090 .148!Matrix Meanl .333 .159Maximum Dev .607 1.312!Maximum Devi 1.321 .587
Function CoefficientsI II III IV
Row 1 08/06 19/37 -30/53 02/702 -07/16 32/22 -41/54 09/703 -11/24 34/90 57/33 -26/374 51/101 -21/45 -15/21 16/12
Matrix Mean .026 .084!Matrix Meanl .376 .110Maximum Dev .925 1.462!Maximum Devi 1.571 .724
75
78
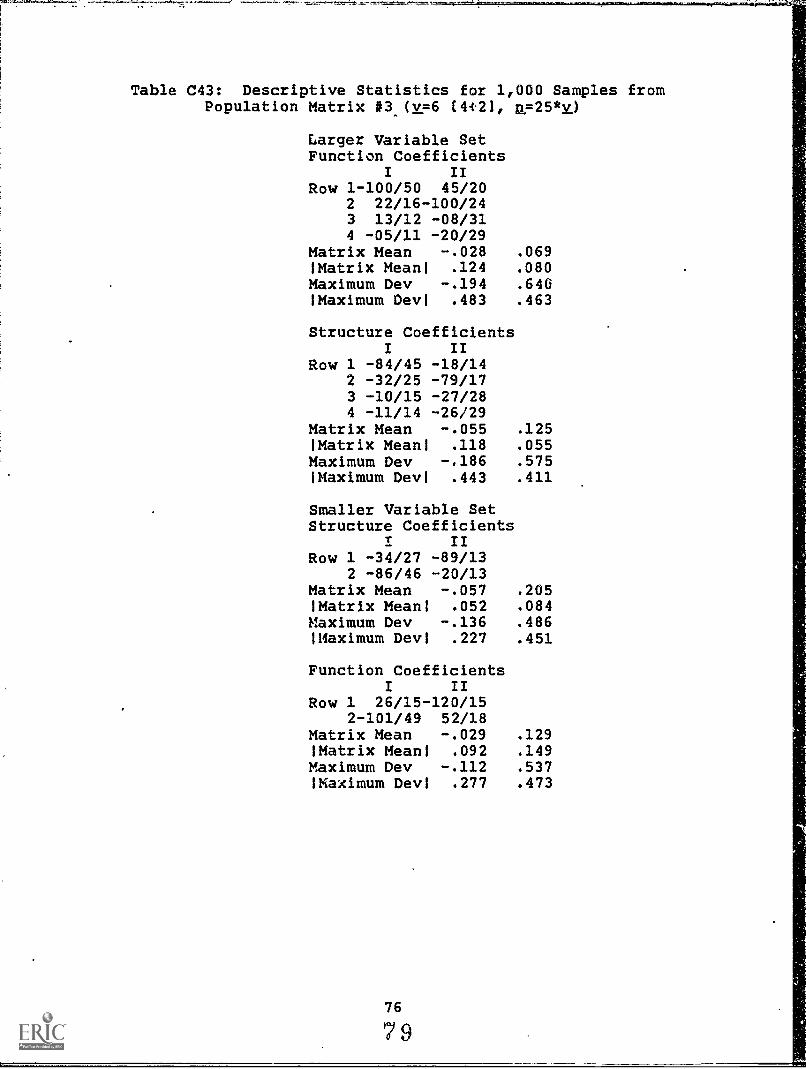
Table C43: Descriptive Statistics for 1,000 Samples fromPopulation Matrix #3.(v=6 (4.121, n=25*v)
Larger Variable SetFunction Coefficients
I IIRow 1-100/50 45/20
2 22/16-100/243 13/12 -08/314 -05/11 -20/29
Matrix Mean -.028 .069'Matrix Mean' .124 .080Maximum Dev -.194 .640'Maximum Devi .483 .463
Structure CoefficientsI II
Row 1 -84/45 -18/142 -32/25 -79/173 -10/15 -27/284 -11/14 -26/29
Matrix Mean -.055 .125'Matrix Mean' .118 .055Maximum Dev -.186 .575'Maximum Devi .443 .411
Smaller Variable SetStructure Coefficients
I IIRow 1 -34/27 -89/13
2 -86/46 -20/13Matrix Mean -.057 .205'Matrix Meant .052 .084Maximum Dev -.136 .486'Maximum Devi .227 .451
Function CoefficientsI II
Row 1 26/15-120/152-101/49 52/18
Matrix Mean -.029 .129'Matrix Mean' .092 .149Maximum Dev -.112 .537'Maximum Devi .277 .473
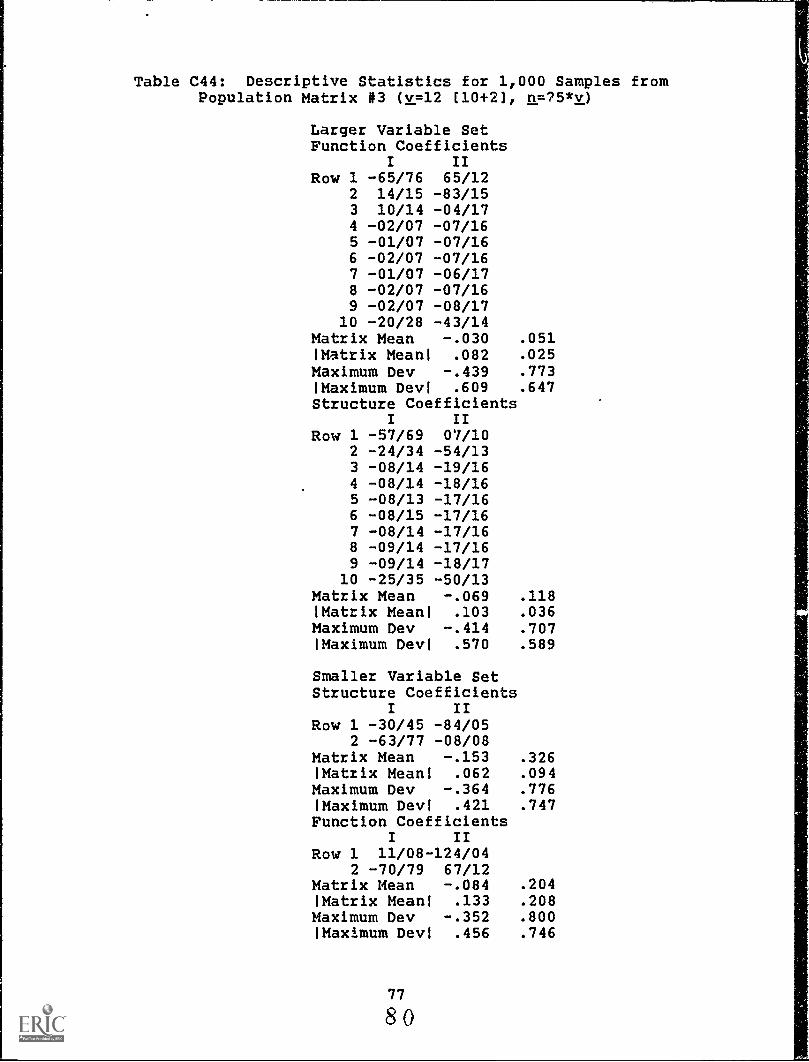
Table C44: Descriptive Statistics for 1,000 Samples fromPopulation Matrix #3 (v=12 (10+2)1 n=75*v)
Larger Variable SetFunction Coefficients
I IIRow 1 -65/76 65/12
2 14/15 -83/153 10/14 -04/174 -02/07 -07/165 -01/07 -07/166 -02/07 -07/167 -01/07 -06/178 -02/07 -07/169 -02/07 -08/17
10 -20/28 -43/14Matrix Mean -.030 .051!Matrix Meanl .082 .025Maximum Dev -.439 .773!Maximum Devl .609 .647Structure Coefficients
I II
Row 1 -57/69 0'1 /10
2 -24/34 -54/133 -08/14 -19/164 -08/14 -18/165 -08/13 -17/166 -08/15 -17/167 -08/14 -17/168 -09/14 -17/169 -09/14 -18/17
10 -25/35 -50/13Matrix Mean -.069 .118!Matrix Meanl .103 .036Maximum Dev -.414 .707!Maximum Devi .570 .589
Smaller Variable SetStructure Coefficients
I IIRow 1 -30/45 -84/05
2 -63/77 -08/08Matrix Mean -.153 .326!Matrix Meanl .062 .094Maximum Dev -.364 .776!Maximum Devi .421 .747Function Coefficients
I IIRow 1 11/08-124/04
2 -70/79 67/12Matrix Mean -.084 .204!Matrix Meanl .133 .208Maximum Dev -.352 .800!Maximum Devl .456 .746

Table C45: Descriptive Statistics for 1,000 Samples fromPopulation Matrix #3 (v=12 (6+61, n=40*v)
Larger Variable SetFunction Coe'ficients
I II III IV V VIRow 1 76/80 -47/15 13/20 01/13 -03/12 00/12
2 -14/18 66/24 -57/66 -04/34 08/29 00/263 -09/12 29/14 25/38 02/52 -04/51 00/534 05/07 32/13 16/31 02/50 02/51 -02/545 05/07 32/14 15/33 02/51 -03/52 -01/496 05/07 34/14 19/31 -01/50 -02/50 02/51
Matrix Mean .015 .025!Matrix Mean! .315 .066Maximum Dev .160 1.580!Maximum Devi 1.536 .399Structure Coefficients
I II III IV V VIRow 1 66/69 09/09 -08/12 00/12 01/12 00/12
2 29/29 56/18 -37/44 -03/24 05/22 00/203 11/12 44/14 17/30 01/46 -03/46 00/474 11/12 43/14 17/31 02/45 02/46 -01/485 11/12 44/14 16/32 02/46 -03/48 -01/446 11/12 44/15 20/30 00/46 -01/45 02/46
Matrix Mean .026 .045!Matrix Meanl .285 .051Maximum Dev .296 1.318!Maximum Devi 1.316 .304
Smaller Variable SetStructure Coefficients
I II III IV V VIRow 1 13/10 44/14 13/32 -10/44 -05/46 02/47
2 11/12 45/12 16/31 -10/45 -06/45 03/463 11/12 43/15 29/19 -10/45 -03/46 00/464 11/13 44/14 14/32 39/24 -03/46 00/465 30/31 55/18 -38/43 04/23 15/16 -09/186 67/69 09/08 -09/11 07/10 03/11 00/11
Matrix Mean .028 .044!Matrix Meanl .274 .062Maximum Dev .183 1.342!Maximum Devi 1.313 .330Function Coefficients
I II III IV V VIRow 1 07/05 33/14 11/33 -12/48 -05/51 02/52
2 04/07 34/12 14/32 -11/50 -06/50 03/513 04/07 32/14 29119 -11/50 -03/51 -01/524 -09/11 28/15 22/40 44/27 -06/52 02/525 -14/18 67/24 -59/67 -07/33 24/18 -16/226 76/81 -49/16 15/22 02/14 -07/10 10/07
Matrix Mean .013 .024!Matrix Mean! .303 .067Maximum Dev .023 1.596!Maximum Devi 1.538 .425
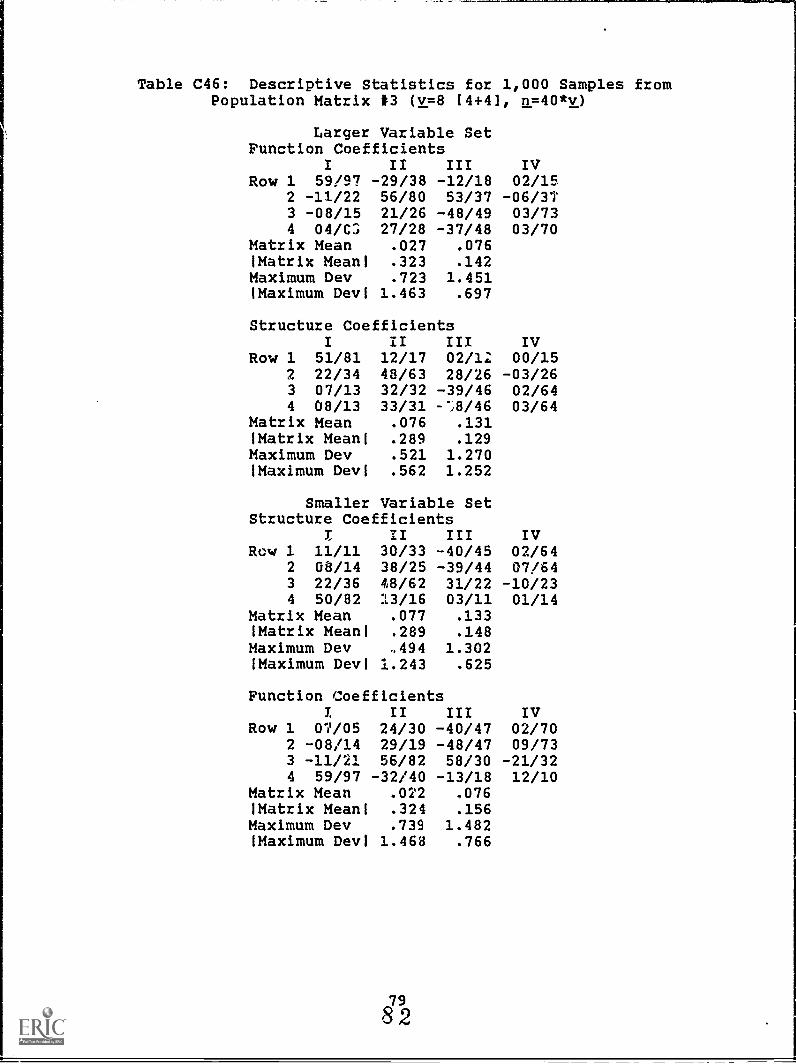
Table C46: Descriptive Statistics for 1,000 Samples fromPopulation Matrix #3 (v=8 (4+4)1 n=40*v)
Larger Variable SetFunction Coefficients
I II III IVRow 1 59/97 -29/38 -12/18 02/15
2 -11/22 56/80 53/37 -06/373 -08/15 21/26 -48/49 03/734 04/03 27/28 -37/48 03/70
Matrix Mean .027 .076Matrix Meanl .323 .142Maximum Dev .723 1.451'Maximum Devi 1.463 .697
Structure CoefficientsI II III IV
Row 1 51/81 12/17 02/12 00/152 22/34 48/63 28/26 -03/263 07/13 32/32 -39/46 02/644 08/13 33/31 -",8/46 03/64
Matrix Mean .076 .131!Matrix Meanl .289 .129Maximum Dev .521 1.270'Maximum Devi .562 1.252
Smaller Variable SetStructure Coefficients
I II III IVRow 1 11/11 30/33 -40/45 02/64
2 08/14 38/25 -39/44 07/643 22/36 48/62 31/22 -10/234 50/82 :13/16 03/11 01/14
Matrix Mean .077 .133!Matrix Meanl .289 .148Maximum Dev ,,494 1.302'Maximum Devl 1.243 .625
Function CoefficientsI II III IV
Row 1 07/05 24/30 -40/47 02/702 -08/14 29/19 -48/47 09/733 -11/21 56/82 58/30 -21/324 59/97 -32/40 -13/18 12/10
Matrix Mean .02'2 ,076Matrix Mean! .324 .156Maximum Dev .739 1.482'Maximum Devi 1.468 .766
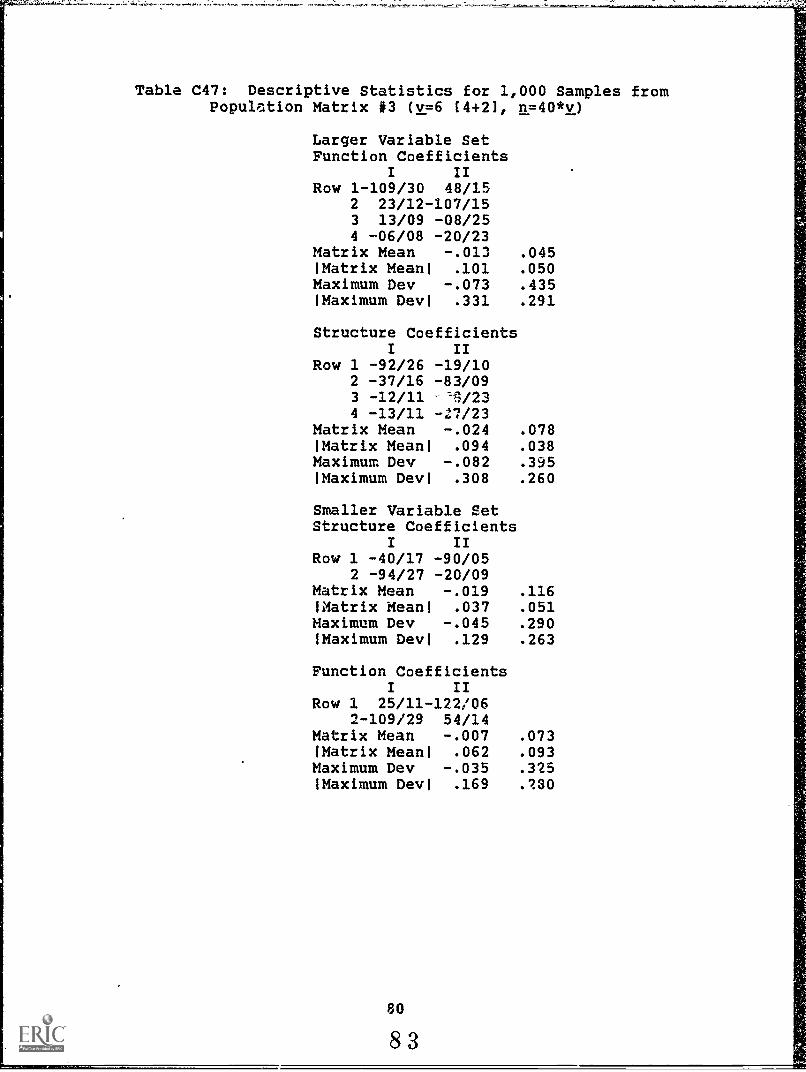
Table C47: Descriptive Statistics for 1,000 Samples fromPopulation Matrix #3 (v=6 (4+21, n=40*v)
Larger Variable SetFunction Coefficients
I IIRow 1-109/30 48/15
2 23/12-107/153 13/09 -08/254 -06/08 -20/23
Matrix Mean -.013 .045'Matrix Meanl .101 .050Maximum Dev -.073 .435'Maximum Devi .331 .291
Structure CoefficientsI II
Row 1 -92/26 -19/102 -37/16 -83/093 -12/11 -W234 -13/11 -27/23
Matrix Mean -.024 .078'Matrix Meanl .094 .038Maximum Dev -.082 .395'Maximum Devl .308 .260
Smaller Variable SetStructure Coefficients
I IIRow 1 -40/17 -90/05
2 -94/27 -20/09Matrix Mean -.019 .116!atrix Mean! .037 .051Maximum Dev -.045 .290'Maximum Devi .129 .263
Function CoefficientsI II
Row 1 25/11-122/062-109/29 54/14
Matrix Mean -.007 .073'Matrix Meant .062 .093Maximum Dev -.035 .325'Maximum Devl .169 .130
80
83
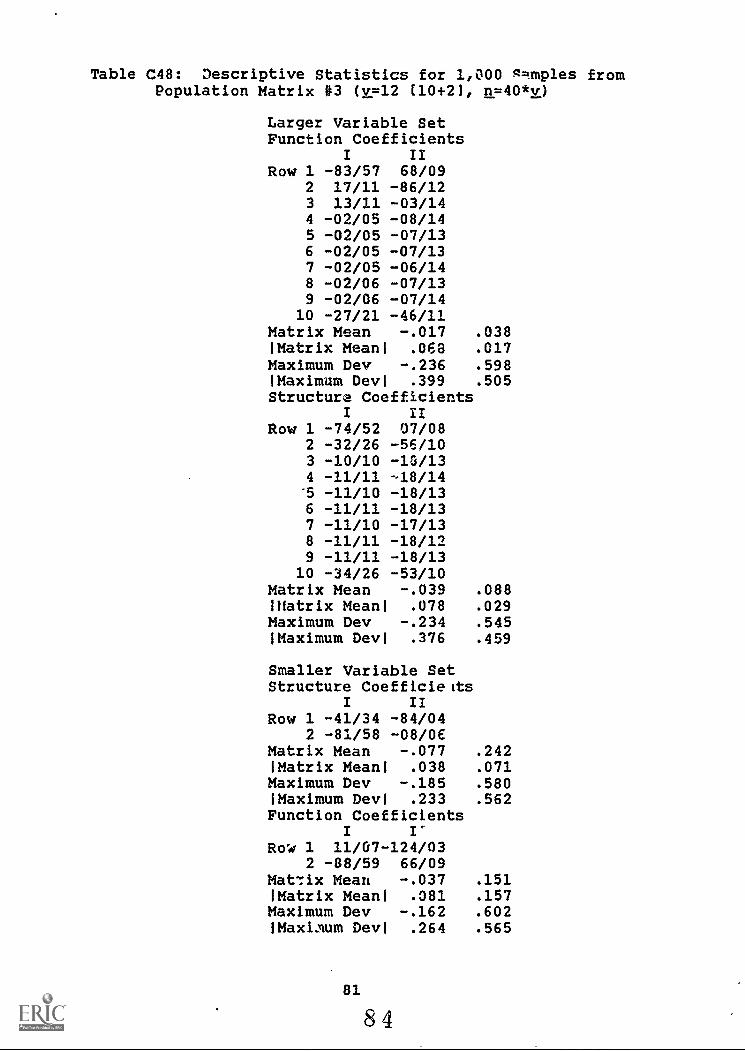
Table C48: Descriptive Statistics for 1,000 Q=mples fromPopulation Matrix 113 (v=12 [10+2), n=40*v)
Larger Variable SetFunction Coefficients
I II
Row 1 -83/57 68/092 17/11 -86/123 13/11 -03/144 -02/05 -08/145 -02/05 -07/136 -02/05 -07/137 -02/05 -06/148 -02/06 -07/139 -02/06 -07/14
10 -27/21 -46/11Matrix Mean -.017 .038!Matrix Mean! .063 .017Maximum Dev -.236 .598!Maximum Devi .399 .505Structure Coefficients
I IIRow 1 -74/52 07/08
2 -32/26 -56/103 -10/10 -10/134 -11/11 -18/14-5 -11/10 -18/136 -11/11 -18/137 -11/10 -17/138 -11/11 -18/129 -11/11 -18/13
10 -34/26 -53/10Matrix Mean -.039 .088!Matrix Mean! .078 .029Maximum Dev -.234 .545!Maximum Devi .376 .459
Smaller Variable SetStructure Coefficients
I IIRow 1 -41/34 -84/04
2 -81/58 -08/06Matrix Mean -.077 .242IMatrix Meant .038 .071Maximum Dev -.185 .580[Maximum Devi .233 .562Function Coefficients
Row 1 11/07-124/032 -88/59 66/09
Mat7:ix Mean -.037 .151Matrix Mean! .081 .157Maximum Dev -.162 .602!Maximum Devi .264 .565
81
8 4
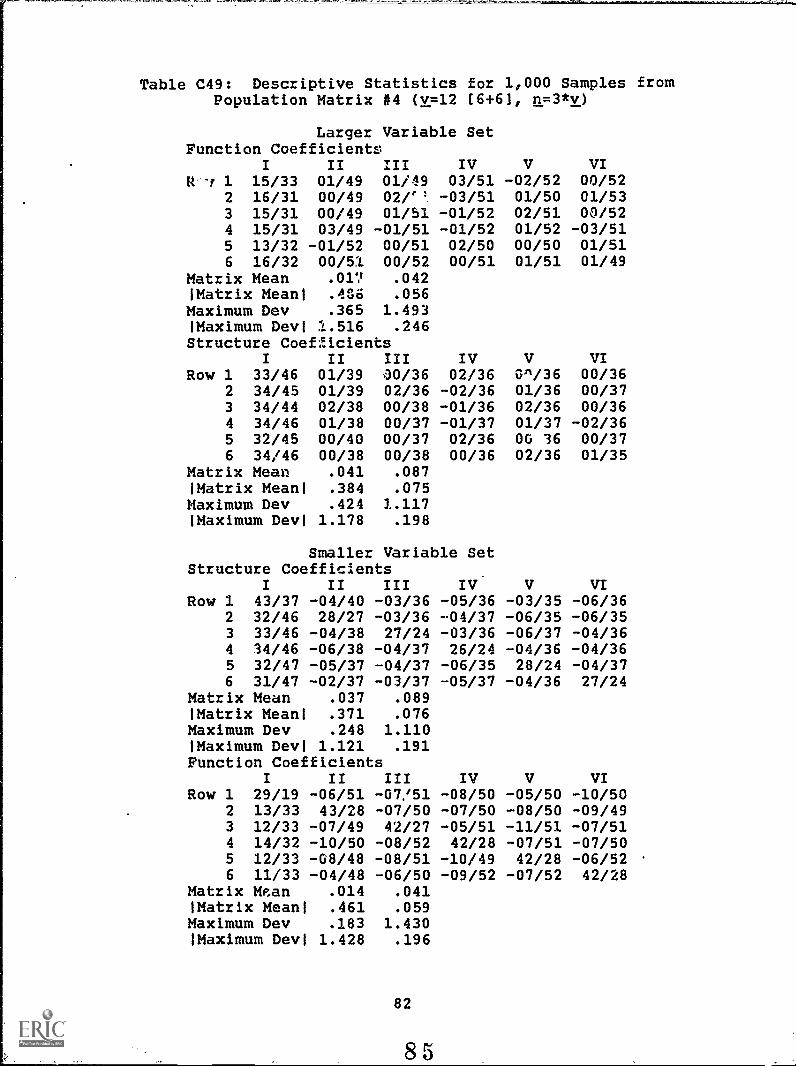
Table C49: Descriptive Statistics for 1,000 Samples fromPopulation Matrix 14 (v=12 [6+6], n=3*v)
Larger Variable SetFunction Coefficients
I II III IV V VIR -r 1 15/33 01/49 01/49 03/51 -02/52 00/52
2 16/31 00/49 02/'' -03/51 01/50 01/533 15/31 00/49 01/51 -01/52 02/51 00/524 15/31 03/49 -01/51 -01/52 01/52 -03/515 13/32 -01/52 00/51 02/50 00/50 01/516 16/32 00/51 00/52 00/51 01/51 01/49
Matrix Mean .017 .042IMatrix Meani ASO .056Maximum Dev .365 1.493Maximum Devi 1.516 .246Structure Coefficients
I II III IV V VIRow 1 33/46 01/39 00/36 02/36 021/36 00/36
2 34/45 01/39 02/36 -02/36 01/36 00/373 34/44 02/38 00/38 -01/36 02/36 00/364 34/46 01/38 00/37 -01/37 01/37 -02/365 32/45 00/40 00/37 02/36 00 36 00/376 34/46 00/38 00/38 00/36 02/36 01/35
Matrix Mean .041 .087!Matrix Mean! .384 .075Maximum Dev .424 1.117Maximum Devi 1.178 .198
Smaller Variable SetStructure Coefficients
I II III IV V VIRow 1 43/37 -04/40 -03/36 -05/36 -03/35 -06/36
2 32/46 28/27 -03/36 - 04/37 -06/35 -06/353 33/46 -04/38 27/24 -03/36 -06/37 -04/364 34/46 -06/38 -04/37 26/24 -04/36 -04/365 32/47 -05/37 -04/37 -06/35 28/24 -04/376 31/47 -02/37 -03/37 -05/37 -04/36 27/24
Matrix Mean .037 .089IMatrix Mean' .371 .076Maximum Dev .248 1.110Maximum Devi 1.121 .191Function Coefficients
I II III IV V VIRow 1 29/19 -06/51 -07/51 -08/50 -05/50 -10/50
2 13/33 43/28 -07/50 -07/50 -08/50 -09/493 12/33 -07/49 42/27 -05/51 -11/51 -07/514 14/32 -10/50 -08/52 42/28 -07/51 -07/505 12/33 -08/48 -08/51 -10/49 42/28 -06/526 11/33 -04/48 -06/50 -09/52 -07/52 42/28
Matrix Mean .014 .041IMatrix Means .461 .059Maximum Dev .183 1.430!Maximum Devi 1.428 .196
82
85
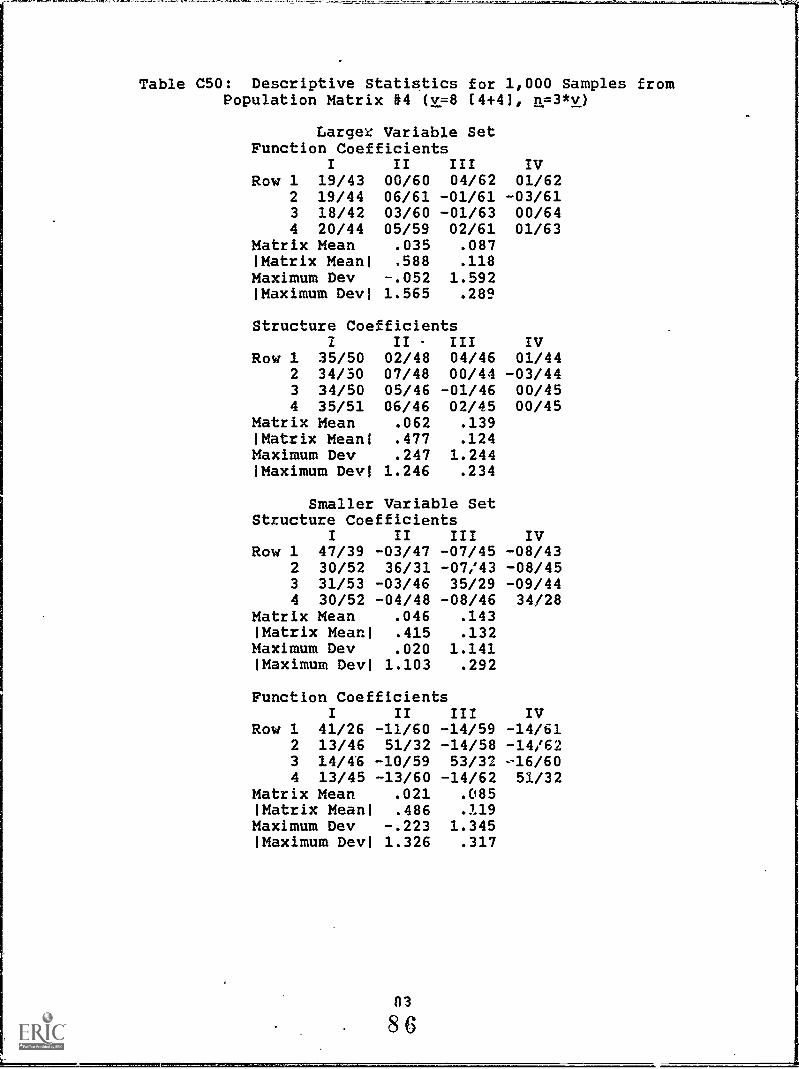
Table C50: Descriptive Statistics for 1,000 Samples fromPopulation Matrix #4 (v=8 (4+41, n=3*v)
Larger Variable SetFunction Coefficients
I II III IVRow 1 19/43 00/60 04/62 01/62
2 19/44 06/61 -01/61 -03/613 18/42 03/60 -01/63 00/644 20/44 05/59 02/61 01/63
Matrix Mean .035 .087'Matrix Mean' ,588 .118Maximum Dev -.052 1.592'Maximum Devi 1.565 .289
Structure CoefficientsII - III IV
Row 1 35/50 02/48 04/46 01/442 34/30 07/48 00/44 -03/443 34/50 05/46 -01/46 00/454 35/51 06/46 02/45 00/45
Matrix Mean .062 .139'Matrix Mean' .477 .124Maximum Dev .247 1.244'Maximum Dev' 1.246 .234
Smaller Variable SetStructure Coefficients
I II III IVRow 1 47/39 -03/47 -07/45 -08/43
2 30/52 36/31 -07/43 -08/453 31/53 -03/46 35/29 -09/444 30/52 -04/48 -08/46 34/28
Matrix Mean .046 .143'Matrix Means .415 .132Maximum Dev .020 1.141'Maximum Des!' 1.103 .292
Function CoefficientsI II III IV
Row 1 41/26 -11/60 -14/59 -14/612 13/46 51/32 -14/58 -14/623 14/46 -10/59 53/32 -16/604 13/45 -13/60 -14/62 51/32
Matrix Mean .021 .085'Matrix Mean' .486 .119Maximum Dev -.223 1.345'Maximum Dev 1.326 .317
03
86
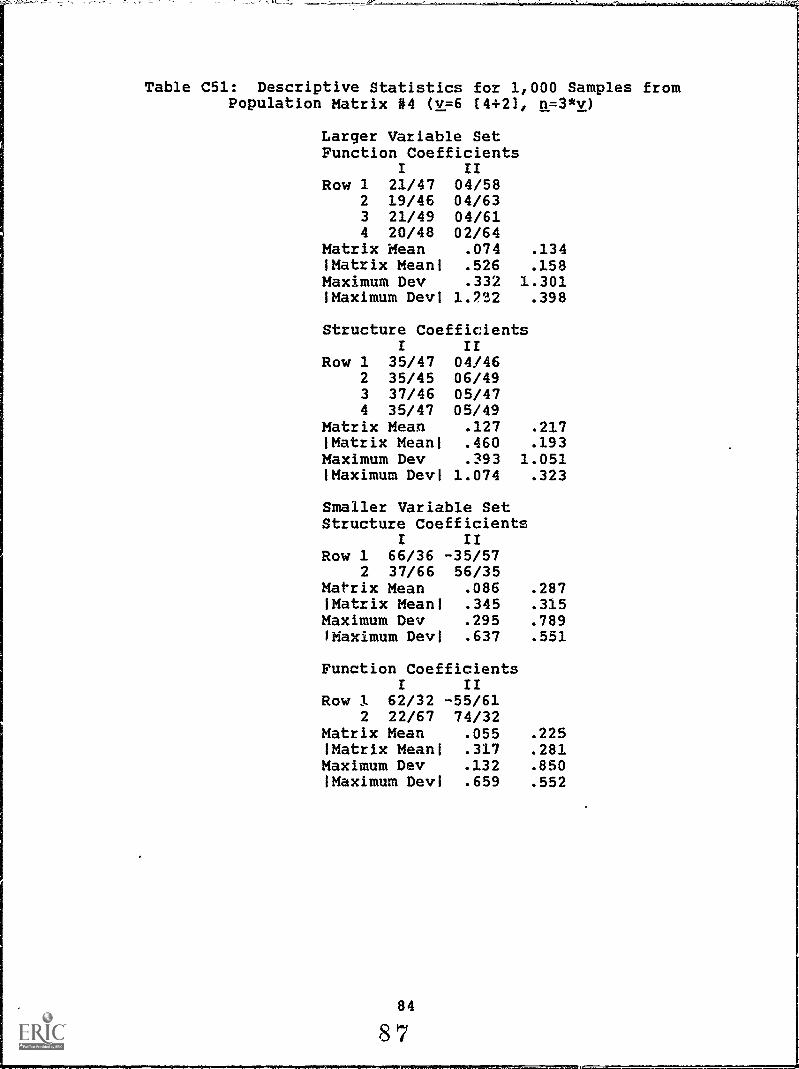
Table C51: Descriptive Statistics for 1,000 Samples fromPopulation Matrix #4 [v=6 [4+21, n=3*v)
Larger Variable SetFunction Coefficients
I IIRow 1 21/47 04/58
2 19/46 04/633 21/49 04/614 20/48 02/64
Matrix Mean .074 .134!Matrix Meant .526 .158Maximum Dev .332 1.301!Maximum Devi 1.7'.1,2 .398
Structure CoefficientsI II
Row 1 35/47 04/462 35/45 06/493 37/46 05/474 35/47 05/49
Matrix Mean .127 .217!Matrix Mean! .460 .193Maximum Dev .393 1.051Maximum Dev! 1.074 .323
Smaller Variable SetStructure Coefficients
I IIRow 1 66/36 -35/57
2 37/66 56/35Matrix Mean .086 .287!Matrix Meant .345 .315Maximum Dev .295 .789(Maximum Devi .637 .551
Function CoefficientsI II
Row 1 62/32 -55/612 22/67 74/32
Matrix Mean .055 .225IMatrix Meant .317 .281Maximum Dev .132 .850'Maximum Devi .659 .552
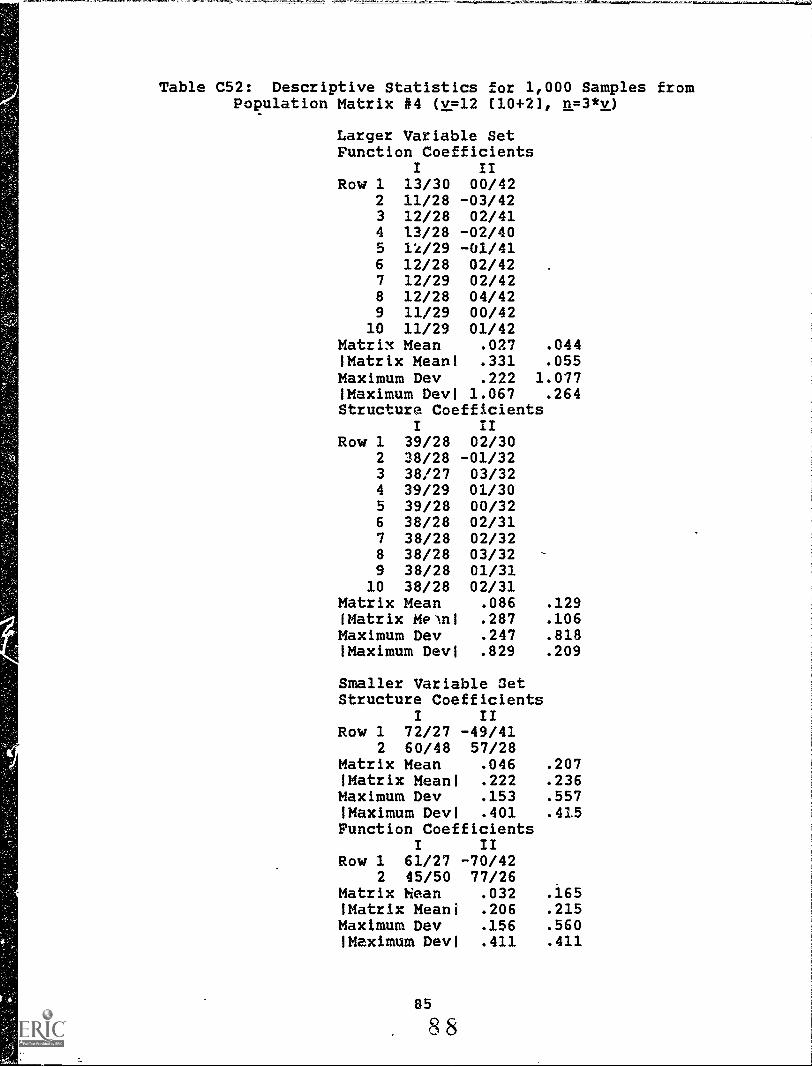
Table C52: Descriptive Statistics for 1,000 Samples fromPopulation Matrix #4 (v=12 (10+2], n=3*v)
Larger Variable SetFunction Coefficients
I IIRow 1 13/30 00/42
2 11/28 -03/423 12/28 02/414 13/28 -02/405 li/29 -01/416 12/28 02/427 12/29 02/428 12/28 04/429 11/29 00/42
10 11/29 01/42Matrix Mean .027 .044'Matrix Mean! .331 .055Maximum Dev .222 1.077'Maximum Devi 1.067 .264Structure Coefficients
I IIRow 1 39/28 02/30
2 38/28 -01/323 38/27 03/324 39/29 01/305 39/28 00/326 38/28 02/317 38/28 02/328 38/28 03/329 38/28 01/31
10 38/28 02/31Matrix Mean .086 .129!Matrix MeAn1 .287 .106Maximum Dev .247 .818'Maximum Devi .829 .209
Smaller Variable SetStructure Coefficients
I IIRow 1 72/27 -49/41
2 60/48 57/28Matrix Mean .046 .207'Matrix Mean) .222 .236Maximum Dev .153 .557'Maximum Devi .401 .415Function Coefficients
I IIRow 1 61/27 -70/42
2 45/50 77/26Matrix Mean .032 .165'Matrix Mean' .206 .215Maximum Dev .156 .560!Maximum Devi .411 .411
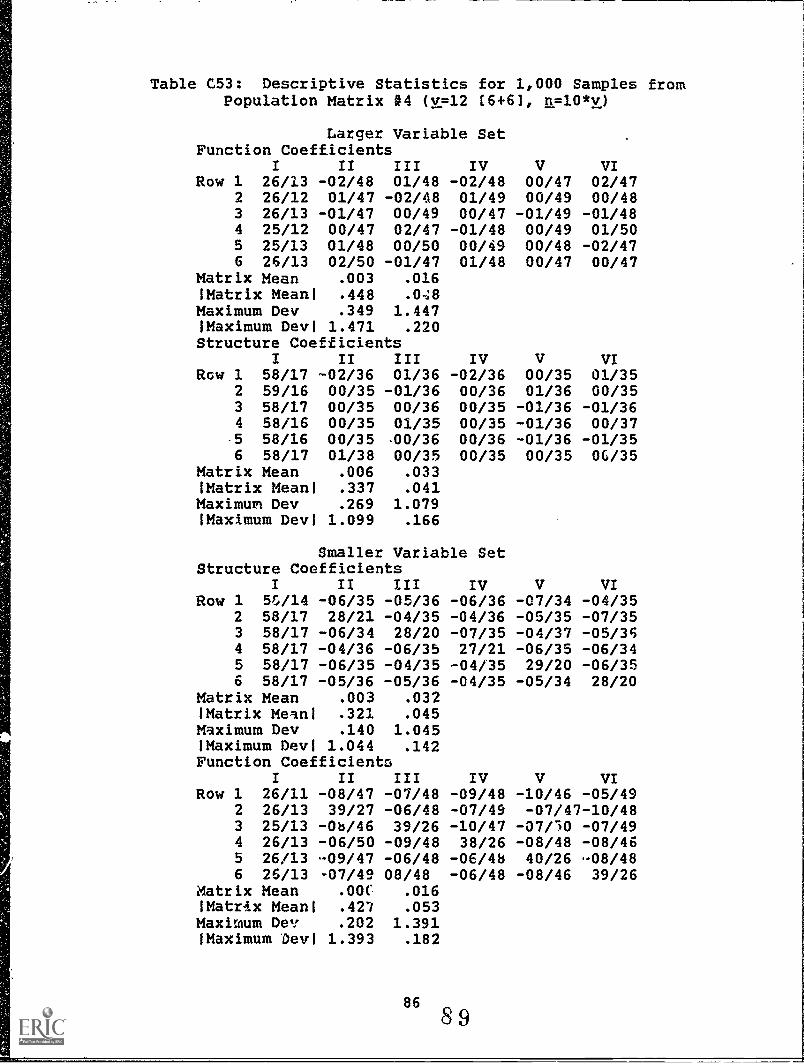
Table C53: Descriptive Statistics for 1,000 Samples fromPopulation Matrix #4 (v=12 [6+6], n=10*v)
Larger Variable SetFunction Coefficients
I II III IV V VIRow 1 26/13 -02/48 01/48 -02/48 00/47 02/47
2 26/12 01/47 -02/48 01/49 00/49 00/483 26/13 -01/47 00/49 00/47 -01/49 -01/484 25/12 00/47 02/47 -01/48 00/49 01/505 25/13 01/48 00/50 00/69 00/48 -02/476 26/13 02/50 -01/47 01/48 00/47 00/47
Matrix Mean .003 .016!Matrix Meanl .448 .048Maximum Dev .349 1.447'Maximum DevI 1.471 .220Structure Coefficients
I II III IV V VIRcw 1 58/17 -02/36 01/36 -02/36 00/35 01/35
2 59/16 00/35 -01/36 00/36 01/36 00/353 58/17 00/35 00/36 00/35 -01/36 -01/364 58/16 00/35 01/35 00/35 -01/36 00/37-5 58/16 00/35 00/36 00/36 -01/36 -01/356 58/17 01/38 00/35 00/35 00/35 06/35
Matrix Mean .006 .033'Matrix Meanl .337 .041Maximum Dev .269 1.079'Maximum Devl 1.099 .166
Smaller Variable SetStructure Coefficients
I II III IV V VIRow 1 5&/14 -06/35 -05/36 -06/36 -07/34 -04/35
2 58/17 28/21 -04/35 -04/36 -05/35 -07/353 58/17 -06/34 28/20 -07/35 -04/37 -05/354 58/17 -04/36 -06/35 27/21 -06/35 -06/345 58/17 -06/35 -04/35 -04/35 29/20 -06/356 58/17 -05/36 -05/36 -04/35 -05/34 28/20
Matrix Mean .003 .032!Matrix Mean' .321 .045Maximum Dev .140 1.045'Maximum Devi 1.044 .142Function Coefficients
I II III IV V VIRow 1 26/11 -08/47 -07/48 -09/48 -10/46 -05/49
2 26/13 39/27 -06/48 -07/49 -07/47-10/483 25/13 -Ob/46 39/26 -10/47 -07/10 -07/494 26/13 -06/50 -09/48 38/26 -08/48 -08/465 26/13 -09/47 -06/48 -06/48 40/26 -08/486 26/13 -07/49 08/48 -06/48 -08/46 39/26
Matrix Mean .00( .016IMatrAx Meanl .427 .053Maximum Des: .202 1.391'Maximum Devi 1.393 .182
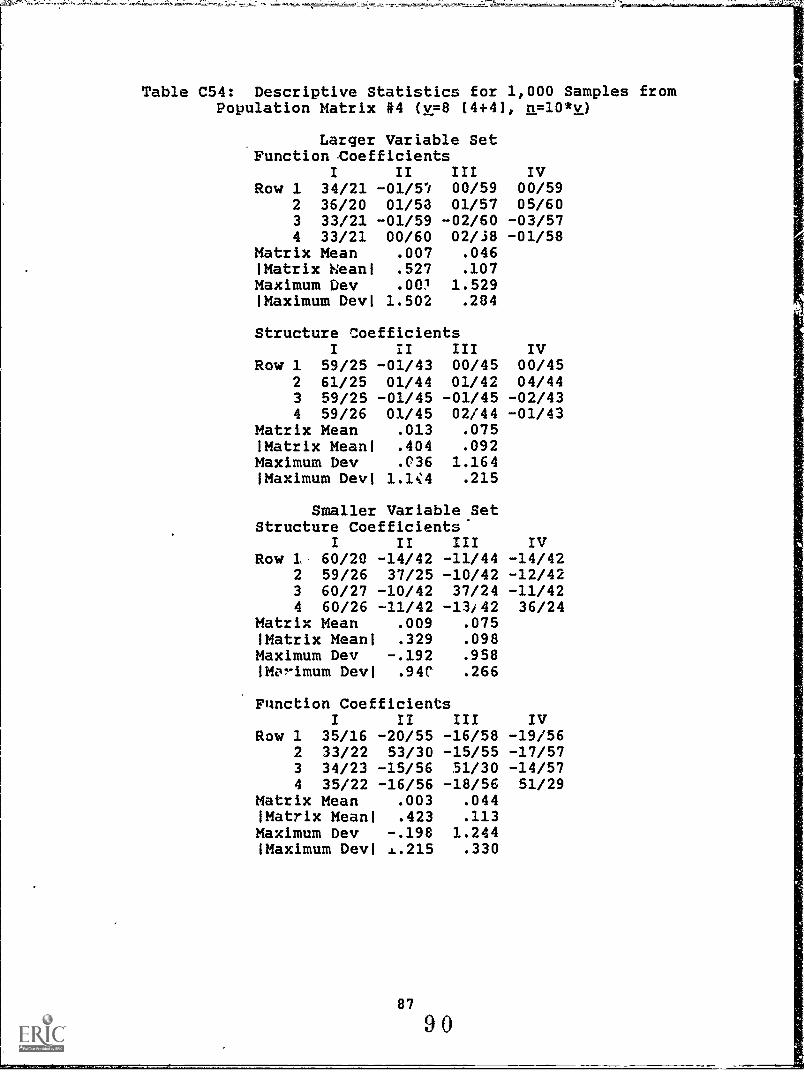
Table C54: Descriptive Statistics for 1,000 Samples fromPopulation Matrix #4 (v=8 (4+4), n=10*v)
Larger Variable SetFunction Coefficients
I II III IVRow 1 34/21 -01/57 00/59 00/59
2 36/20 01/53 01/57 05/603 33/21 -01/59 -02/60 -03/574 33/21 00/60 02/38 -01/58
Matrix Mean .007 .046Matrix Wean) .527 .107Maximum Dev .001 1.529Maximum Devi 1.502 .284
Structure CoefficientsI II III IV
Row 1 59/25 -01/43 00/45 00/452 61/25 01/44 01/42 04/443 59/25 -01/45 -01/45 -02/434 59/26 01/45 02/44 -01/43
Matrix Mean .013 .075!Matrix Meanl .404 .092Maximum Dev .C36 1.164!Maximum Devi 1.1,Z4 .215
Smaller Variable SetStructure Coefficients'
I II III IVRow 1. 60/20 -14/42 -11/44 -14/42
2 59/26 37/25 -10/42 -12/423 60/27 -10/42 37/24 -11/424 60/26 -11/42 -13,42 36/24
Matrix Mean .009 .075!Matrix Mean) .329 .098Maximum Dev -.192 .958IMot-imum Devi .94C .266
Function CoefficientsI II III IV
Row 1 35/16 -20/55 -16/58 -19/562 33/22 53/30 -15/55 -17/573 34/23 -15/56 51/30 -14/574 35/22 -16/56 -18/56 51/29
Matrix Mean .003 .044Matrix Meanl .423 .113Maximum Dev -.198 1.244'Maximum Devi .L.215 .330

Table C55: Descriptive Statistics for 1,000 Samples fromPopulation Matrix 64 (v=6 (4+21, n=10*v)
Larger Variable SetFunction Coefficients
I II
Row 1 33/25 01/582 32/25 -04/593 33/28 01/584 35/25 -01/57
Matrix Mean .028 .075'Matrix Meaal .415 .130Maximum Dev .300 1.245'Maximum Devi 1.196 .458
Structure CoefficientsI II
Row 1 57/26 00/462 58/25 -04/453 58/27 00/454 59/25 -01/44
Matrix Mean .050 .127'Matrix MGanl .332 .126Maximum Dev .303 .967'Maximum Devi ,947 .358
Smaller Variable SetStructure Coefficients
I IIRow 1 74/21 -58/26
2 71/32 58/23Matrix Mean .031 .160'Matrix Means .147 .164Maximum Dev .097 .368'Maximum Devi .257 .281
Function CoefficientsI II
Row 1 60/22 -78/252 57/34 78/20
Matrix Mean .022 .128'Matrix Means .138 .147Maximum Dev .124 .359'Maximum Devl .264 .274
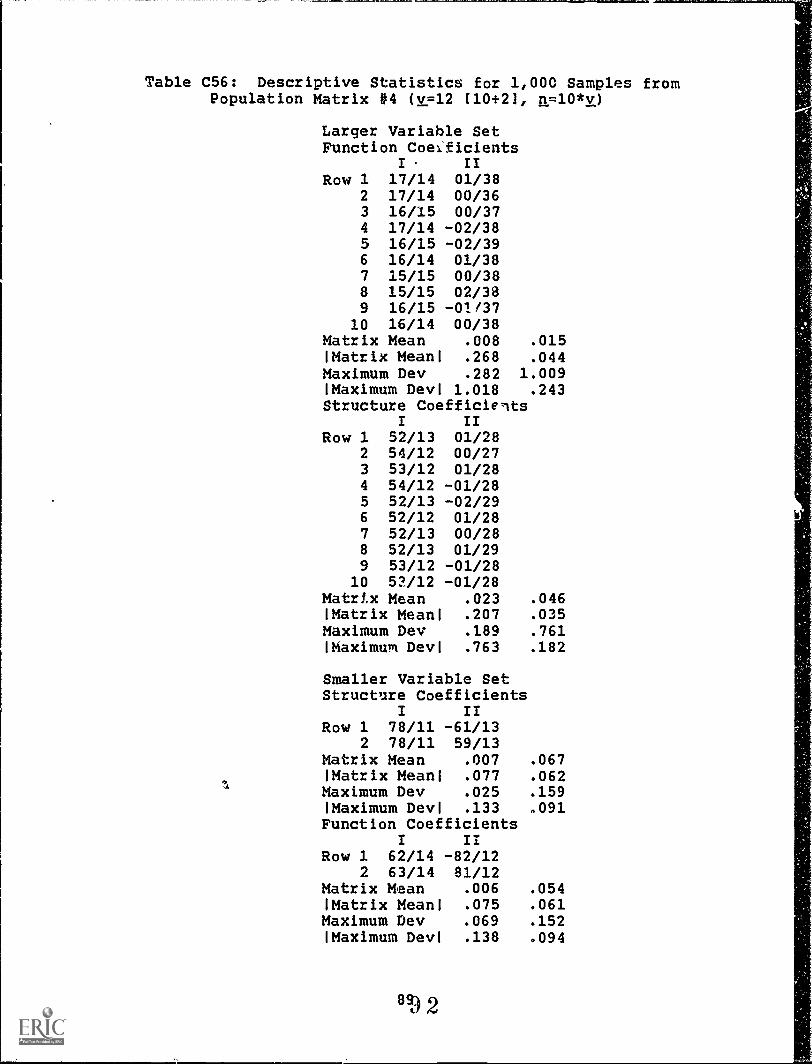
Table C56: Descriptive Statistics for 1,000 Samples fromPopulation Matrix 04 (v=12 (10+21, n=10*v)
Larger Variable SetFunction Coefficients
I II
Row 1 17/14 01/382 17/14 00/363 16/15 00/374 17/14 -02/385 16/15 -02/396 16/14 01/387 15/15 00/388 15/15 02/389 16/15 -01/37
10 16/14 00/38Matrix Mean .008 .015!Matrix Meanl .268 .044Maximum Dev .282 1.009!Maximum Devi 1.018 .243Structure Coefficients
I IIRow 1 52/13 01/28
2 54/12 00/273 53/12 01/284 54/12 -01/285 52/13 -02/296 52/12 01/287 52/13 00/288 52/13 01/299 53/12 -01/28
10 52/12 -01/28Matrix Mean .023 .046'Matrix Meanl .207 .035Maximum Dev .189 .761!Maximum Devi .763 .182
Smaller Variable SetStructure Coefficients
1 IIRow 1 78/11 -61/13
2 78/11 59/13Matrix Mean .007 .067'Matrix Mean! .077 .062Maximum Dev .025 .159!Maximum Devl .133 .091Function Coefficients
I IIRow 1 62/14 -82/12
2 63/14 81/12Matrix Mean .006 .054'Matrix Mean! .075 .061Maximum Dev .069 .152'Maximum Devl .138 .094
8934 2

Table C57: Descriptive Statistics for 1,000 Samples fromPopulation Matrix 04 (v=12 (6+61, n=25*v)
Larger Variable SetFunction Coefficients
I II III IV V VIRow 1 27/06 00/47 02/48 01/47 00/48 02/47
2 28/06 -01/49 00/46 00/47 -03/47 -01/473 27/06 00/47 00/48 02/48 01/47 02/474 26/06 -02/46 00/48 -01/49 02/47 -01/495 27/06 02/48 -01/47 -01/47 -01/48 00/476 27/06 00/48 -01/48 -02/47 01/47 -01/47
Matrix Mean .000 .008'Matrix Mean! .437 .048Maximum Dev .508 1.399'Maximum Devi 1.470 .229Structure Coefficients
I II III IV V VIRow 1 60/06 00/35 02/36 01/35 00/36 02/36
2 61/06 00/36 00/34 00/35 -02/35 -01/353 60/06 00/36 00/36 01/36 01/35 01/354 60/06 -01/34 00/35 -01/36 02/35 -01/365 61/06 02/36 00/35 -01/35 -01/36 00/356 60/06 00/36 00/36 -02/35 01/35 -01/36
Matrix Mean .001 .014'Matrix Mean' .329 .036Maximum Dev .353 1.053'Maximum Devi 1.097 .171
Smaller Variable SetStructure, Coefficients
I II III IV V VIRow 1 61/06 -03/36 -03/35 -05/34 -06/35 -04/35
2 61/06 29/20 -05/16 -07/35 -06/34 -06/353 60/06 -05/35 -06/35 -07/36 -04/354 61/06 -06/36 -06/34 29/19 -07/34 -06/355 61/06 -07/33 -07/34 -06/36 29/19 -07/366 61/06 -07/35 -06/36 -05/35 -03/35 28/20
Matrix Mean .000 .014!Matrix Mean' .311 .039Maximum Dev .225 1.001'Maximum Devi 1.018 .129Function Coefficients
I II III IV V VIRow 1 27/06 -04/48 -04/47 -07/47 -08/47 -06/48
2 27/07 40/26 -07/48 -09/47 -07/46-08/473 26/07 -07/47 39/25 -08/47 -09/49 -06/474 27/07 -09/48 -09/46 40/25 -09/47 -08/475 27/07 -10/45 -09/46 -09/48 39/26 -10/486 27/07 -09/47 -08/48 -07/47 -05/47 39/26
Matrix Mean .000 .007'Matrix Mean! .417 .052Maximum Dev .325 1.336'Maximum Devi 1.364 .171
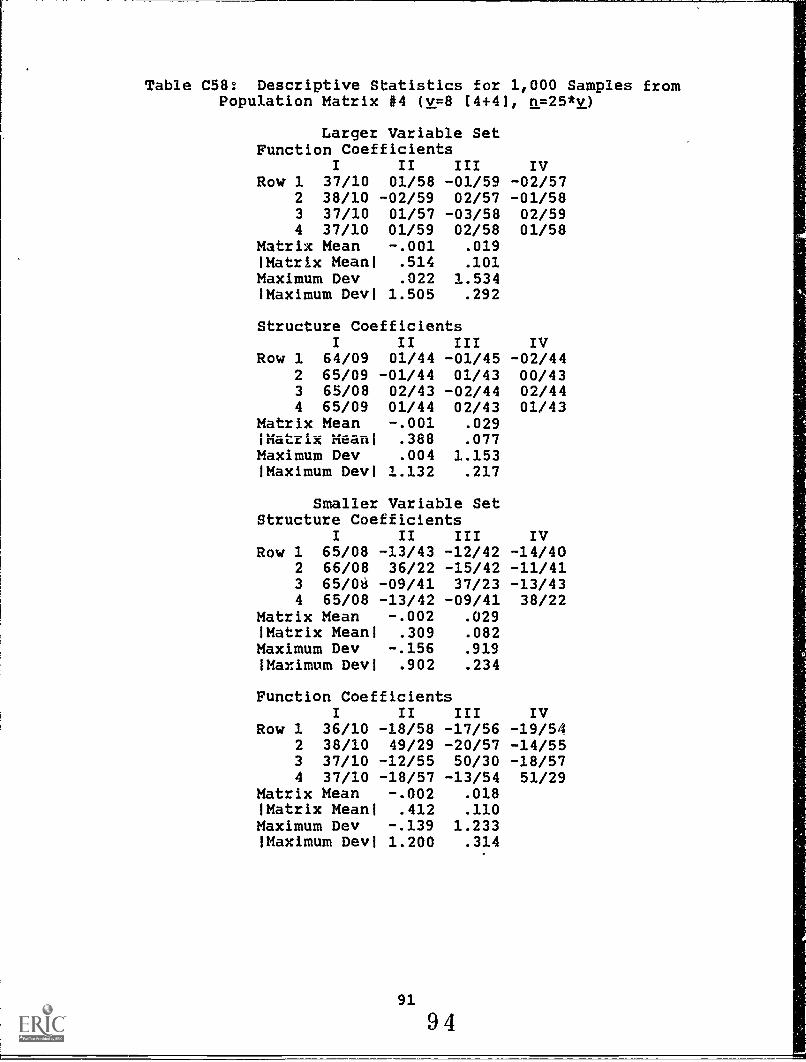
Table C58: Descriptive Statistics for 1,000 Samples fromPopulation Matrix #4 (v=8 (4+4), n=25*v)
Larger Variable SetFunction Coefficients
I II III IVRow 1 37/10 01/58 -01/59 -02/57
2 38/10 -02/59 02/57 -01/583 37/10 01/57 -03/58 02/594 37/10 01/59 02/58 01/58
Matrix Mean -.001 .019!Matrix Meanl .514 .101Maximum Dev .022 1.534'Maximum Devi 1.505 .292
Structure CoefficientsI II III IV
Row 1 64/09 01/44 -01/45 -02/442 65/09 -01/44 01/43 00/433 65/08 02/43 -02/44 02/444 65/09 01/44 02/43 01/43
Matrix Mean -.001 .0291Matxix Mean' .388 .077Maximum Dev .004 1.153'Maximum Dev) 1.132 .217
Smaller Variable SetStructure Coefficients
I II III IVRow 1 65/08 -13/43 -12/42 -14/40
2 66/08 36/22 -15/42 -11/413 65/08 -09/41 37/23 -13/434 65/08 -13/42 -09/41 38/22
Matrix Mean -.002 .029'Matrix Meanl .309 .082Maximum Dev -.156 .919'Maximum Devl .902 .234
Function CoefficientsI II III IV
Row 1 36/10 -18/58 -17/56 -19/542 38/10 49/29 -20/57 -14/553 37/10 -12/55 50/30 -18/574 37/10 -18/57 -13/54 51/29
Matrix Mean -.002 .018'Matrix Meanl .412 .110Maximum Dev -.139 1.233'Maximum Devi 1.200 .314
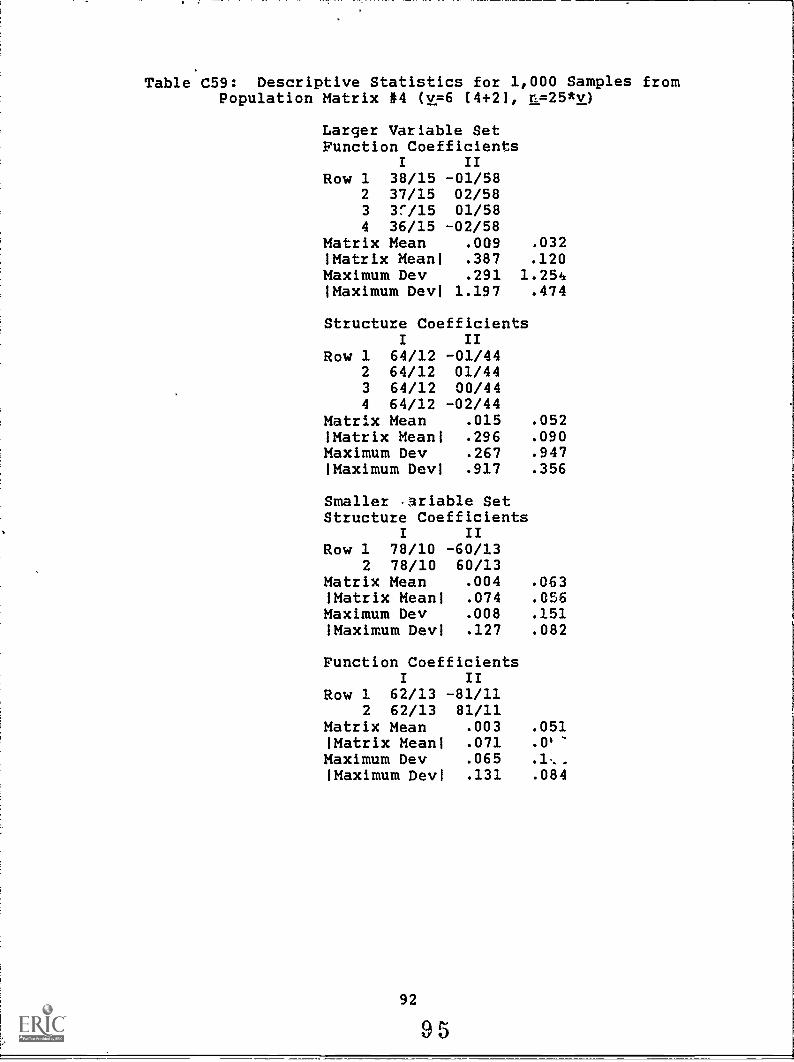
Table C59: Descriptive Statistics for 1,000 Samples fromPopulation Matrix #4 (v=6 (4+2),
Larger Variable SetFunction Coefficients
I II
n=25*v)
Row 1 38/15 -01/582 37/15 02/583 3r/15 01/584 36/15 -02/58
Matrix Mean .009 .032Matrix Mean' .387 .120Maximum Dev .291 1.2512'Maximum Devi 1.197 .474
Structure CoefficientsI II
Row 1 64/122 64/123 64/124 64/12
-01/4401/4400/44
-02/44Matrix Mean .015 .052Matrix Mean1 .296 .090Maximum Dev .267 .947Maximum Devi .917 .356
Smaller ariable SetStructure Coefficients
I IIRow 1 78/10 -60/13
2 78/10 60/13Matrix Mean .004 .063Matrix Mean1 .074 .056Maximum Dev .008 .151(Maximum Devi .127 .082
Function CoefficientsI II
Row 1 62/13 -81/112 62/13 81/11
Matrix Mean .003 .051Matrix Mean1 .071 .0'"Maximum Dev .065 .1,..
!Maximum Devi .131 .084
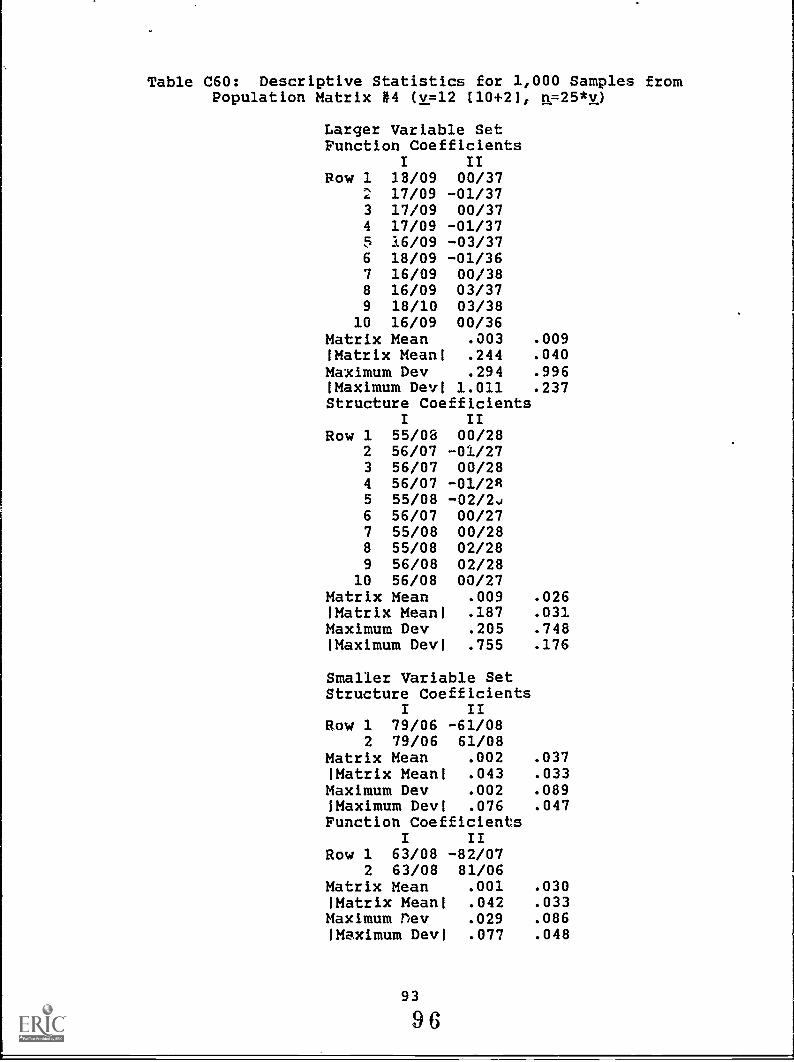
Table C60: Descriptive Statistics for 1,000 Samples fromPopulation Matrix N4 (v=12 (10+2), n=25*v)
Larger Variable SetFunction Coefficients
I IIRow 1 13/09 00/37
2 17/09 -01/373 17/09 00/374 17/09 -01/375 16/09 -03/376 18/09 -01/367 16/09 00/388 16/09 03/379 18/10 03/38
10 16/09 00/36Matrix Mean .003 .009!Matrix Mean! .244 .040Maximum Dev .294 .996!Maximum Devi 1.011 .237Structure Coefficients
I IIRow 1 55/08 00/28
2 56/07 -01/273 56/07 00/284 56/07 -01/285 55/08 -02/2.J6 56/07 00/277 55/08 00/288 55/08 02/289 56/08 02/28
10 56/08 00/27Matrix Mean .009 .026!Matrix Meanl .187 .031Maximum Dev .205 .748!Maximum DevI .755 .176
Smaller Variable SetStructure Coefficients
I IIRow 1 79/06 -61/08
2 79/06 61/08Matrix Mean .002 .037!Matrix Meanl .043 .033Maximum Dev .002 .089!Maximum DevI .076 .047Function Coefficients
I IIRow 1 63/08 -82/07
2 63/08 81/06Matrix Mean .001 .030!Matrix Meanl .042 .033Maximum rev .029 .086Maximum DevI .077 .048

Table C61: Descriptive Statistics for 1,000 Samples fromPopulation Matrix 14 (v=12 [6+6], n=40*v)
Larger Variable SetFunction Coefficients
I II III IV V VIRow 1 27/05 01/46 02/48 00/48 00/48 -01/47
2 28/05 03/46 00/48 01/47 -01/47 -02/483 27/05 00/47 -03/47 -02/49 04/48 01/454 27/05 -06/47 02/47 01/47 00/47 02/485 26/05 02/48 -01/47 -02/48 -02/48 -01/476 27/05 00/49 00/46 00/46 -01/47 01/48
Matrix Mean .000 .006Matrix Meant .434 .048Maximum Dev .308 1,431!Maximum Devi 1.446 .224Structure Coefficients
I II III IV V VIRow 1 60/05 01/35 01/36 00/36 00/36 -01/35
2 62/04 03/34 00/36 01/35 00/35 -01/363 61/04 00/35 -02/35 -01/36 03/36 01/344 61/04 -04/35 01/35 01/35 00/35 01/365 61/05 02/36 -01/35 -01/35 -01/36 -01/356 61/05 00/37 00/34 00/34 00/35 01/36
Matrix Mean' .000 .012!Matrix Mean! .326 .036Maximum Bev .220 1.072!Maximum Devi 1.082 .167
Smaller Variable SetStructure Coefficients
I II III IV V VIRow 1 61/05 -06/37 -06/34 -06/35 -05/33 -07/34
2 61/05 29/20 -07/35 -06/34 -04/35 -05/353 60/05 -07/34 30/19 -07/34 -06/36 -08/354 62/05 -04/34 -03/35 31/20 -06/34 -04/355 61/05 -06/34 -06/34 -05/36 30/20 -05/346 61/05 -06/35 -06/34 -06/33 -07/35 31/19
Matrix Mean -.001 .011!Matrix Meant .308 .041Maximum Dev .198 1.000!Maximum Devi 1.010 .134Function Coefficients
I II III IV V VIRow 1 27/05 -08/49 -08/46 -08/47 -07/45 -09/46
2 27/05 40/26 -10/48 -09/46 -06/47 -07/473 26/05 -10/45 41/25 -10/46 -08/48 -11/474 27/05 -05/46 -04/47 42/26 -09/46 -06/475 27/05 -09/46 -09/46 -08/48 41/26 -07/466 27/05 -03/47 -09/46 -08/45 -10/47 41/26
Matrix Mean -.001 .006Matrix Meant .413 .055Maximum Dev .313 1.331!Maximum Devl 1.355 .178
94
97
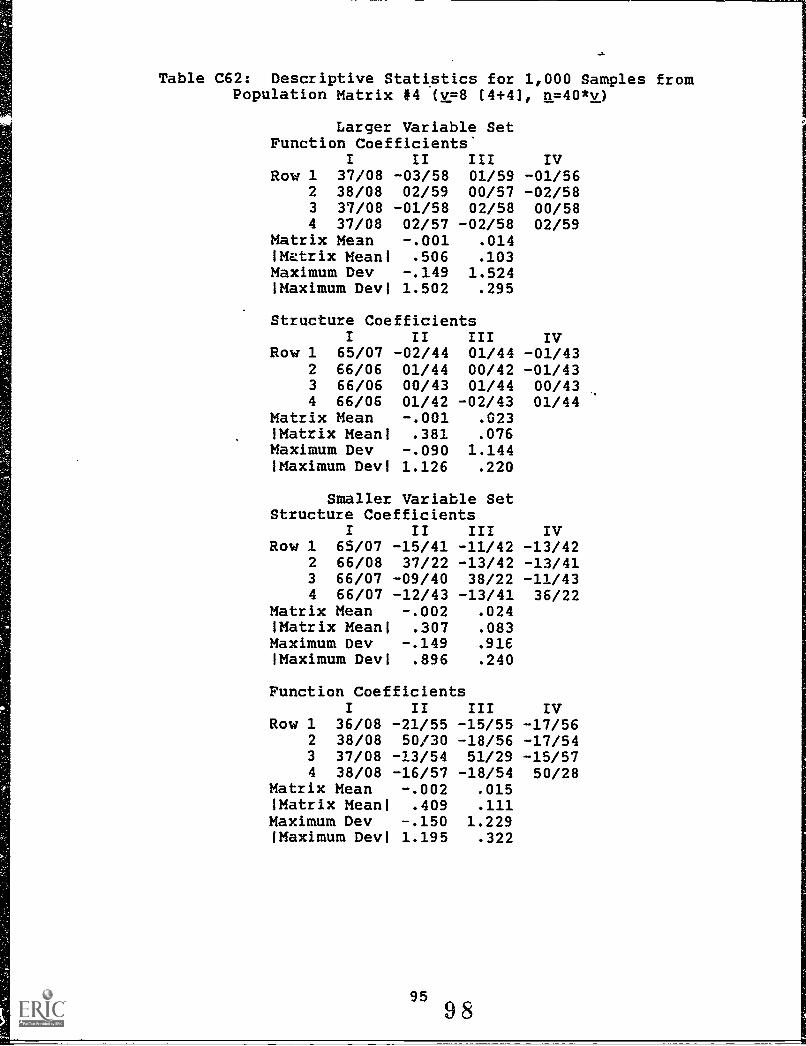
Table C62: Descriptive Statistics for 1,000 Samples fromPopulation Matrix #4 (v=8 (4+41, n=40*v)
Larger Variable SetFunction Coefficients'
I II III IVRow 1 37/08 -03/58 01/59 -01/56
2 38/08 02/59 00/57 -02/583 37/08 -01/58 02/58 00/584 37/08 02/57 -02/58 02/59
Matrix Mean -.001 .014IMetrix Meant .506 .103Maximum Dev -.149 1.524!Maximum Devi 1.502 .295
Structure CoefficientsI II III IV
Row 1 65/07 -02/44 01/44 -01/432 66/06 01/44 00/42 -01/433 66/06 00/43 01/44 00/434 66/06 01/42 -02/43 01/44
Matrix Mean -.001 .023(Matrix Meant .381 .076Maximum Dev -.090 1.144!Maximum Devi 1.126 .220
Smaller Variable SetStructure Coefficients
I II III IVRow 1 65/07 -15/41 -11/42 -13/42
2 66/08 37/22 -13/42 -13/413 66/07 -09/40 38/22 -11/434 66/07 -12/43 -13/41 36/22
Matrix Mean -.002 .024Matrix Meant .307 .083Maximum Dev -.149 .916'Maximum Devi .896 .240
Function CoefficientsI II III IV
Row 1 36/08 -21/55 -15/55 -17/562 38/08 50/30 -18/56 -17/543 37/08 -13/54 51/29 -15/574 38/08 -16/57 -18/54 50/28
Matrix Mean -.002 .015!Matrix Mean! .409 .111Maximum Dev -.150 1.229Maximum Devi 1.195 .322
95
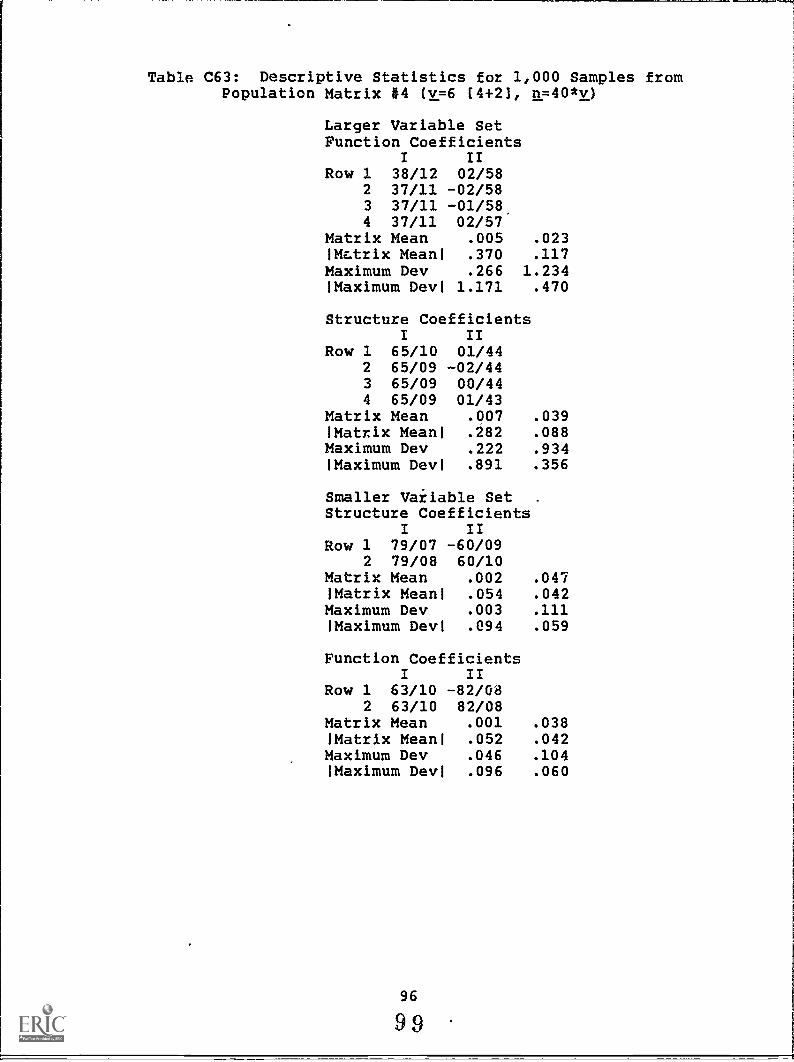
Table C63: Descriptive Statistics for 1,000 Samples fromPopulation Matrix #4 (v=6 (4+2], n=40*v)
Larger Variable SetFunction Coefficients
I IIRow 1 38/12 02/58
2 37/11 -02/583 37/11 -01/58,4 37/11 02/57
Matrix Mean .005 .023'Matrix Mean' .370 .117Maximum Dev .266 1.234'Maximum Devi 1.171 .470
Structure CoefficientsI II
Row 1 65/10 01/442 65/09 -02/443 65/09 00/444 65/09 01/43
Matrix Mean .007 .039(Matrix Mean' .282 .088Maximum Dev .222 .934'Maximum Devi .891 .356
Smaller Variable SetStructure Coefficients
I IIRow 1 79/07 -60/09
2 79/08 60/10Matrix Mean .002 .047'Matrix Mean' .054 .042Maximum Dev .003 .111'Maximum Devi .094 .059
Function CoefficientsI II
Row 1 63/10 -82/082 63/10 82/08
Matrix Mean .001 .038'Matrix Meant .052 .042Maximum Dev .046 .104'Maximum Devi .096 .060
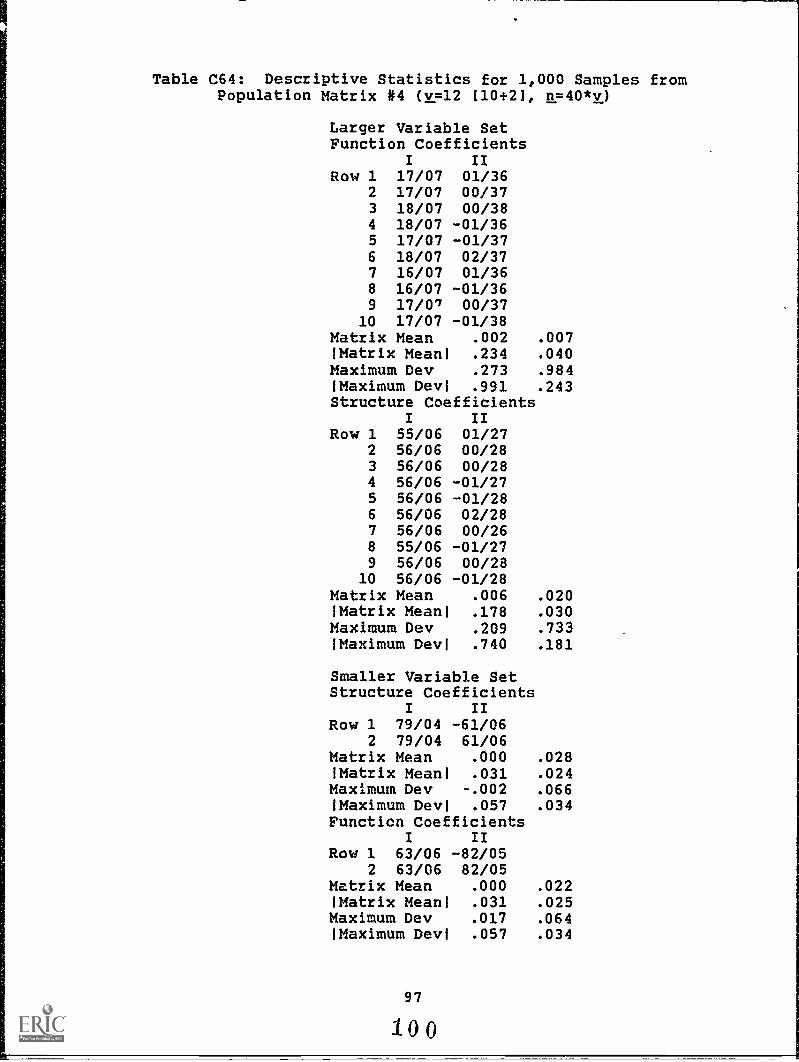
Table C64: Descriptive Statistics for 1,000 Samples fromPopulation Matrix #4 (v=12 (10+2), n=40*v)
Larger Variable SetFunction Coefficients
I IIRow 1 17/07 01/36
2 17/07 00/373 18/07 00/384 18/07 -01/365 17/07 -01/376 18/07 02/377 16/07 01/368 16/07 -01/369 17/07 00/37
10 17/07 -01/38Matrix Mean .002 .007IMatrix Mean! .234 .040Maximum Dev .273 .984!Maximum Devi .991 .243Structure Coefficients
I IIRow 1 55/06 01/27
2 56/06 00/283 56/06 00/284 56/06 -01/275 56/06 -01/286 56/06 02/287 56/06 00/268 55/06 -01/279 56/06 00/28
10 56/06 -01/28Matrix Mean .006 .020IMatrix Mean! .178 .030Maximum Dev .209 .733!Maximum Dev! .740 .181
Smaller Variable SetStructure Coefficients
I IIRow 1 79/04 -61/06
2 79/04 61/06Matrix Mean .000 .028IMatrix Mean! .031 .024Maximum Dev -.002 .066!Maximum Devi .057 .034Function Coefficients
I IIRow 1 63/06 -82/05
2 63/06 82/05Matrix Mean .000 .022IMatrix Mean! .031 .025Maximum Dev .017 .064!Maximum Devi .057 .034
97
100
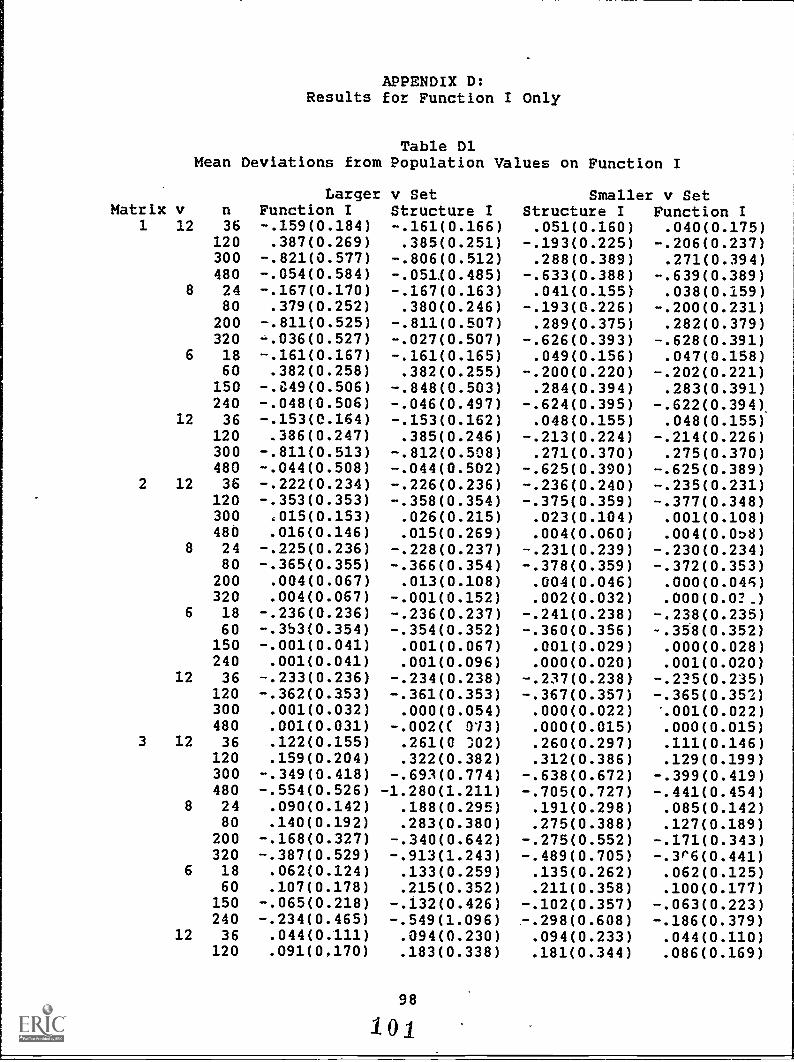
APPENDIX D:Results for Function I Only
Table D1Mean Deviations from Population Values on Function I
Matrix v nLarger v Set
Function I Structure ISmaller v Set
Structure I Function I1 12 36 -.159(0.184) -.161(0.166) .051(0.160) .040(0.175)
120 .387(0.269) .385(0.251) -.193(0.225) -.206(0.237)300 -.821(0.577) -.806(0.512) .288(0.389) .271(0.394)480 -.054(0.584) -.051(0.485) -.633(0.388) -.639(0.389)
8 24 -.167(0.170) -.167(0.163) .041(0.155) .038(0.159)80 .379(0.252) .380(0.246) -.193(0.226) -.200(0.231)
200 -.811(0.525) -.811(0.507) .289(0.375) .282(0.379)320 -.036(0.527) -.027(0.507) -.626(0.393) -.628(0.391)
6 18 -.161(0.167) -.161(0.165) .049(0.156) .047(0.158)60 .382(0.258) .382(0.255) -.200(0.220) -.202(0.221)
150 -.849(0.506) -.848(0.503) .284(0.394) .283(0.391)240 -.048(0.506) -.046(0.497) -.624(0.395) -.622(0.394)
12 36 -.153(0.164) -.153(0.162) .048(0.155) .048(0.155)120 .386(0.247) .385(0.246) -.213(0.224) -.214(0.226)300 -.811(0.513) - .812(0.508) .271(0.370) .275(0.370)480 -.044(0.508) -.044(0.502) -.625(0.390) -.625(0.389)
2 12 36 -.222(0.234) -.226(0.236) -.236(0.240) -.235(0.231)120 -.353(0.353) -.358(0.354) -.375(0.359) -.377(0.348)300 015(0.153) .026(0.215) .023(0.104) .001(0.108)480 .016(0.146) .015(0.269) .004(0.060) .004(0.058)
8 24 -.225(0.236) -.228(0.237) -.231(0.239) -.230(0.234)80 -.365(0.355) -.366(0.354) -.378(0.359) -.372(0.353)200 .004(0.067) .013(0.108) .004(0.046) .000(0.046)320 .004(0.067) -.001(0.152) .002(0.032) .000(0.02_)
6 18 -.236(0.236) -.236(0.237) -.241(0.238) -.238(0.235)60 -.3b3(0.354) -.354(0.352) -.360(0.356) -.358(0.352)
150 -.001(0.041) .001(0.067) .001(0.029) .000(0.028)240 .001(0.041) .001(0.096) .000(0.020) .001(0.020)
12 36 -.233(0.236) -.234(0.238) -.237(0.238) -.225(0.235)120 -.362(0.353) -.361(0.353) -.367(0.357) -.365(0.352)300 .001(0.032) .000(0.054) .000(0.022) %001(0.022)480 .001(0.031) -.002(C 073) .000(0.015) .000(0.015)
3 12 36 .122(0.155) .261(0 302) .260(0.297) .111(0.146)120 .159(0.204) .322(0.382) .312(0.386) .129(0.199)300 -.349(0.418) -.693(0.774) -.638(0.672) -.399(0.419)480 -.554(0.526) -1.280(1.211) -.705(0.727) -.441(0.454)
8 24 .090(0.142) .188(0.295) .191(0.298) .085(0.142)80 .140(0.192) .283(0.380) .275(0.388) .127(0.189)
200 -.168(0.327) -.340(0.642) -.275(0.552) -.171(0.343)320 -.387(0.529) -.913(1.243) -.489(0.705) -.3r6(0.441)
6 18 .062(0.124) .133(0.259) .135(0.262) .062(0.125)60 .107(0.178) .215(0.352) .211(0.358) .100(0.177)
150 -.065(0.218) -.132(0.426) -.102(0.357) -.063(0.223)240 -.234(0.465) -.549(1.096) -.298(0.608) -.186(0.379)
12 36 .044(0.111) .094(0.230) .094(0.233) .044(0.110)120 .091(0,170) .183(0.338) .181(0.344) .086(0.169)
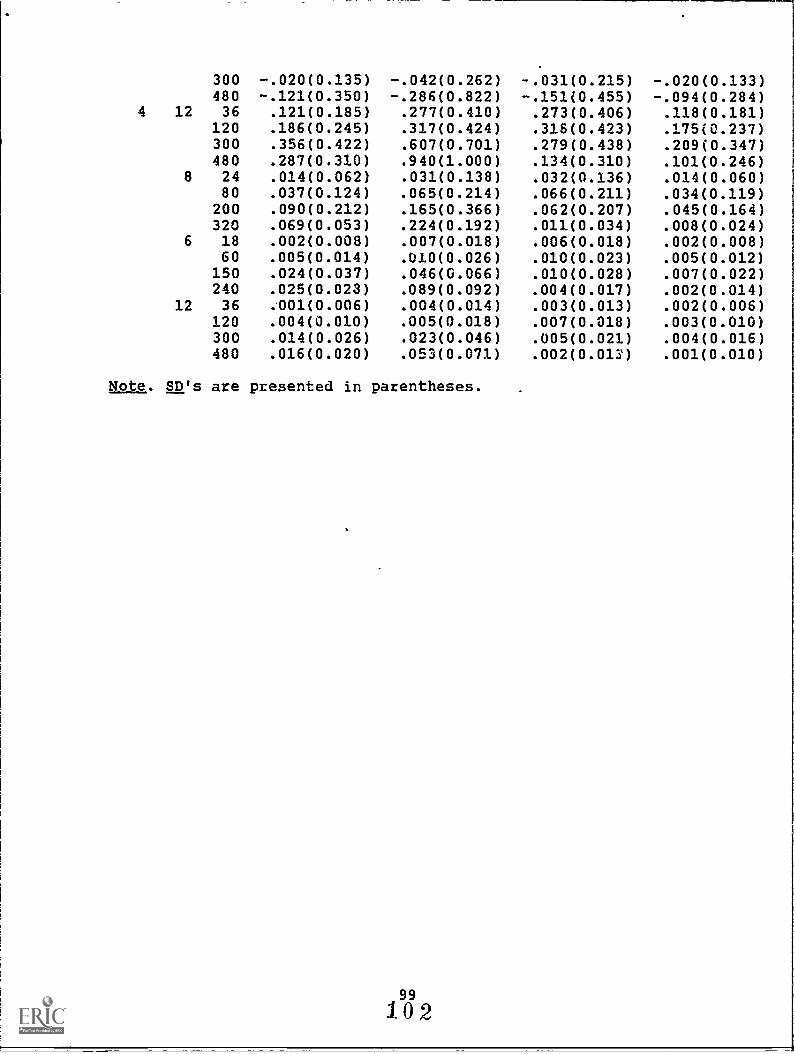
4 12
8
6
12
30048036
1203004802480
2003201860
15024036
120300480
-.020(0.135)-.121(0.350).121(0.185).186(0.245).356(0.422).287(0.310).014(0.062).037(0.124).090(0.212).069(0.053).002(0.008).005(0.014).024(0.037).025(0.023).001(0.006).004(0.010).014(0.026).016(0.020)
-.042(0.262)-.286(0.822).277(0.410).317(0.424).607(0.701).940(1.000).031(0.138).065(0.214).165(0.366).224(0.192).007(0.018).010(0.026).046(0.066).089(0.092).004(0.014).005(0.018).023(0.046).053(0.071)
-.031(0.215)-.151(0.455).273(0.406).318(0.423).279(0.438).134(0.310).032(0.136).066(0.211).062(0.207).011(0.034).006(0.018).010(0.023).010(0.028).004(0.017).003(0.013).007(0.318).005(0.021).002(0.013)
-.020(0.133)-.094(0.284).118(0.181).175(0.237).209(0.347).101(0.246).014(0.060).034(0.119).045(0.164).008(0.024).002(0.008).005(0.012).007(0.022).002(0.014).002(0.006).003(0.010).004(0.016).001(0.010)
Note. SD's are presented in parentheses.
99
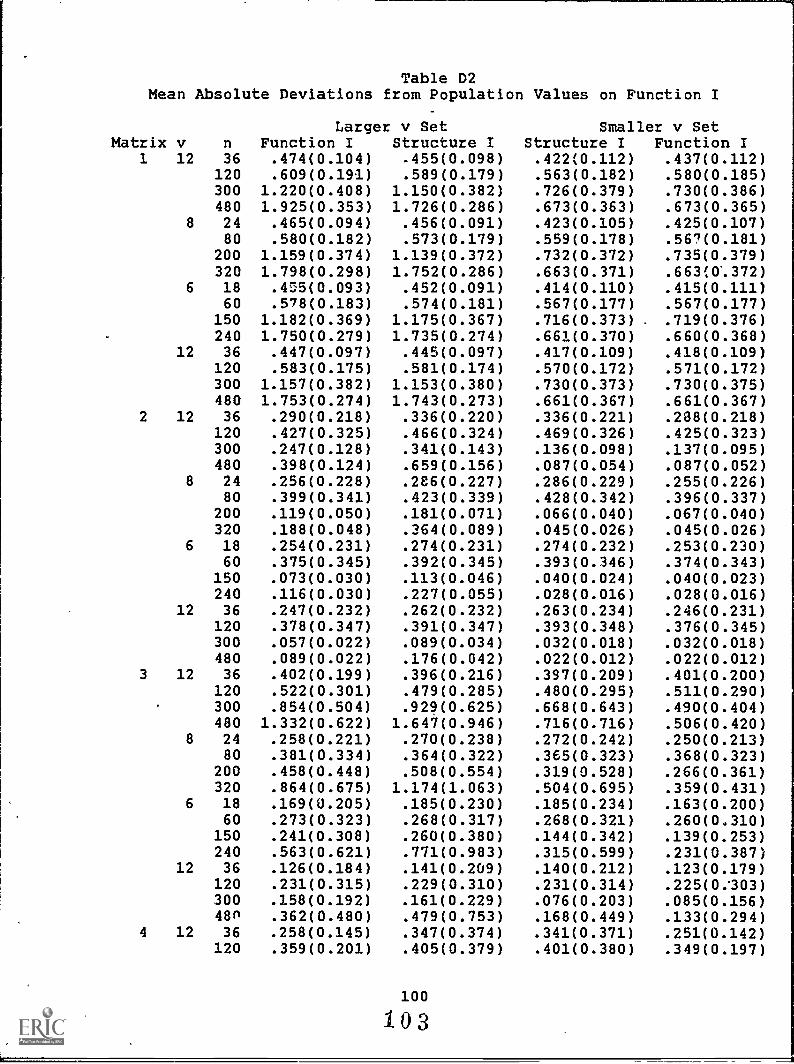
Table D2Mean Absolute Deviations from Population Values on Function I
Matrix v nLarger v Set
Function I Structure ISmaller v Set
Structure I Function1 12 36 .474(0.104) .455(0.098) .422(0.112) .437(0.112)
120 .609(0.191) .589(0.179) .563(0.182) .580(0.185)300 1.220(0.408) 1.150(0.382) .726(0.379) .730(0.386)480 1.925(0.353) 1.726(0.286) .673(0.363) .673(0.365)
8 24 .465(0.094) .456(0.091) .423(0.105) .425(0.107)80 .580(0.182) .573(0.179) .559(0.178) .567(0.181)
200 1.159(0.374) 1.139(0.372) .732(0.372) .735(0.379)320 1.798(0.298) 1.752(0.286) .663(0.371) .663(0..372)
6 18 .455(0.093) .452(0.091) .414(0.110) .415(0.111)60 .578(0.183) .574(0.181) .567(0.177) .567(0.177)
150 1.182(0.369) 1.175(0.367) .716(0.373) .719(0.376)240 1.750(0.279) 1.735(0.274) .661(0.370) .660(0.368)
12 36 .447(0.097) .445(0.097) .417(0.109) .418(0.109)120 .583(0.175) .581(0.174) .570(0.172) .571(0.172)300 1.157(0.382) 1.153(0.380) .730(0.373) .730(0.375)480 1.753(0.274) 1.743(0.273) .661(0.367) .661(0.367)
2 12 36 .290(0.218) .336(0.220) .336(0.221) .288(0.218)120 .427(0.325) .466(0.324) .469(0.326) .425(0.323)300 .247(0.128) .341(0.143) .136(0.098) .137(0.095)480 .398(0.124) .659(0.156) .087(0.054) .087(0.052)
8 24 .256(0.228) .2E6(0.227) .286(0.229) .255(0.226)80 .399(0.341) .423(0.339) .428(0.342) .396(0.337)
200 .119(0.050) .181(0.071) .066(0.040) .067(0.040)320 .188(0.048) .364(0.089) .045(0.026) .045(0.026)
6 18 .254(0.231) .274(0.231) .274(0.232) .253(0.230)60 .375(0.345) .392(0.345) .393(0.346) .374(0.343)
150 .073(0.030) .113(0.046) .040(0.024) .040(0.023)240 .116(0.030) .227(0.055) .028(0.016) .028(0.016)
12 36 .247(0.232) .262(0.232) .263(0.234) .246(0.231)120 .378(0.347) .391(0.347) .393(0.348) .376(0.345)300 .057(0.022) .089(0.034) .032(0.018) .032(0.018)480 .089(0.022) .176(0.042) .022(0.012) .022(0.012)
3 12 36 .402(0.199) .396(0.216) .397(0.209) .401(0.200)120 .522(0.301) .479(0.285) .480(0.295) .511(0.290)300 .854(0.504) .929(0.625) .668(0.643) .490(0.404)480 1.332(0.622) 1.647(0.946) .716(0.716) .506(0.420)
8 24 .258(0.221) .270(0.238) .272(0.242) .250(0.213)80 .381(0.334) .364(0.322) .365(0.323) .368(0.323)
200 .458(0.448) .508(0.554) .319(0.528) .266(0.361)320 .864(0.675) 1.174(1.063) .504(0.695) .359(0.431)
6 18 .169(0.205) .185(0.230) .185(0.234) .163(0.200)60 .273(0.323) .268(0.317) .268(0.321) .260(0.310)
150 .241(0.308) .260(0.380) .144(0.342) .139(0.253)240 .563(0.621) .771(0.983) .315(0.599) .231(0.387)
12 36 .126(0.184) .141(0.209) .140(0.212) .123(0.179)120 .231(0.315) .229(0.310) .231(0.314) .225(0;303)300 .158(0.192) .161(0.229) .076(0.203) .085(0.156)48n .362(0.480) .479(0.753) .168(0.449) .133(0.294)
4 12 36 .258(0.145) .347(0.374) .341(0.371) .251(0.142)120 .359(0.201) .405(0.379) .401(0.380) .349(0.197)
100
103
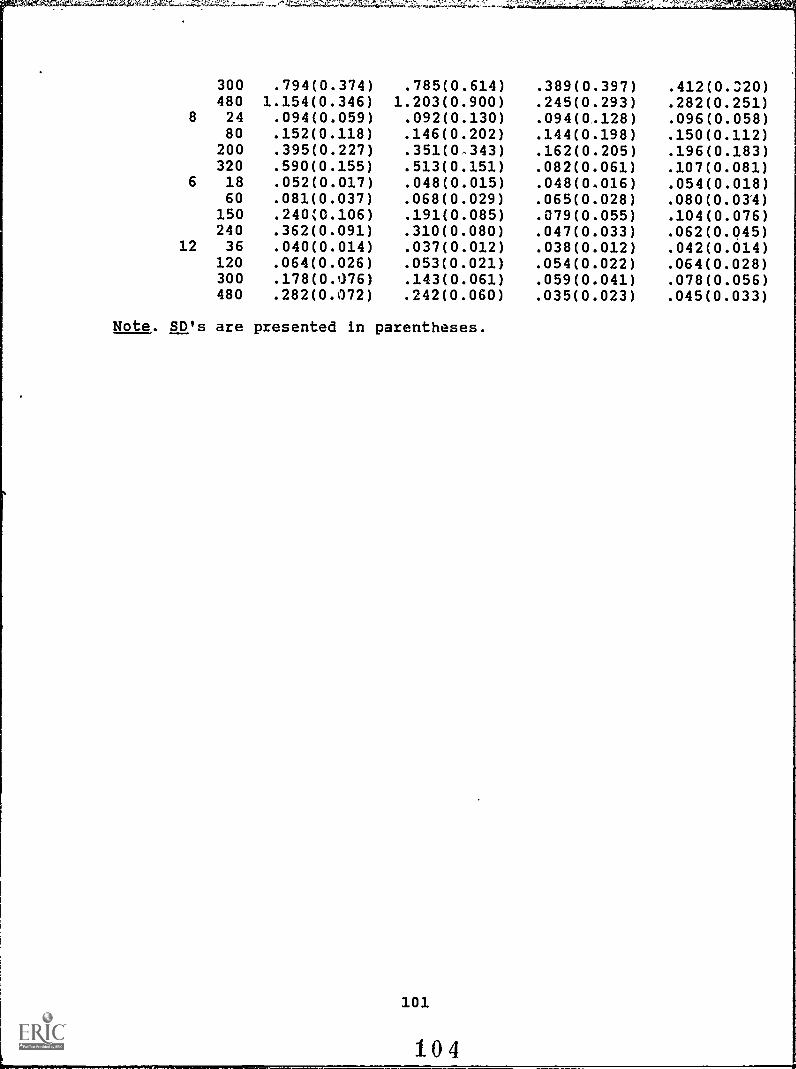
300 .794(0.374) .785(0.614) .389(0.397) .412(0.320)480 1.154(0.346) 1.203(0.900) .245(0.293) .282(0.251)
8 24 .094(0.059) .092(0.130) .094(0.128) .096(0.058)80 .152(0.118) .146(0.202) .144(0.198) .150(0.112)
200 .395(0.227) .351(0343) .162(0.205) .196(0.183)320 .590(0.155) .513(0.151) .082(0.061) .107(0.081)
6 18 .052(0.017) .048(0.015) .048(0,016) .054(0.018)60 .081(0.037) .068(0.029) .065(0.028) .080(0.034)
150 .240;0.106) .191(0.085) .079(0.055) .104(0.076)240 .362(0.091) .310(0.080) .047(0.033) .062(0.045)
12 36 .040(0.014) .037(0.012) .038(0.012) .042(0.014)120 .064(0.026) .053(0.021) .054(0.022) .064(0.028)300 .178(0.076) .143(0.061) .059(0.041) .078(0.056)480 .282(0.072) .242(0.060) .035(0.023) .045(0.033)
Note. SD's are presented in parentheses.
101
104
![Chem. 1983, 22, 939-949 939 · Chem. 1983, 22, 939-949 939 ... [Im][PhSH]. Analysis of H2 evolution rates in the [4-] ... M. Bull. Chem. SOC. Jpn. 1981, 54, 3794. (IS)](https://img.pdfslide.net/doc/110x75/5ad1937b7f8b9a05208bd0b3/chem-1983-22-939-949-939-1983-22-939-949-939-imphsh-analysis-of.jpg)