Embed Size (px)
Citation preview
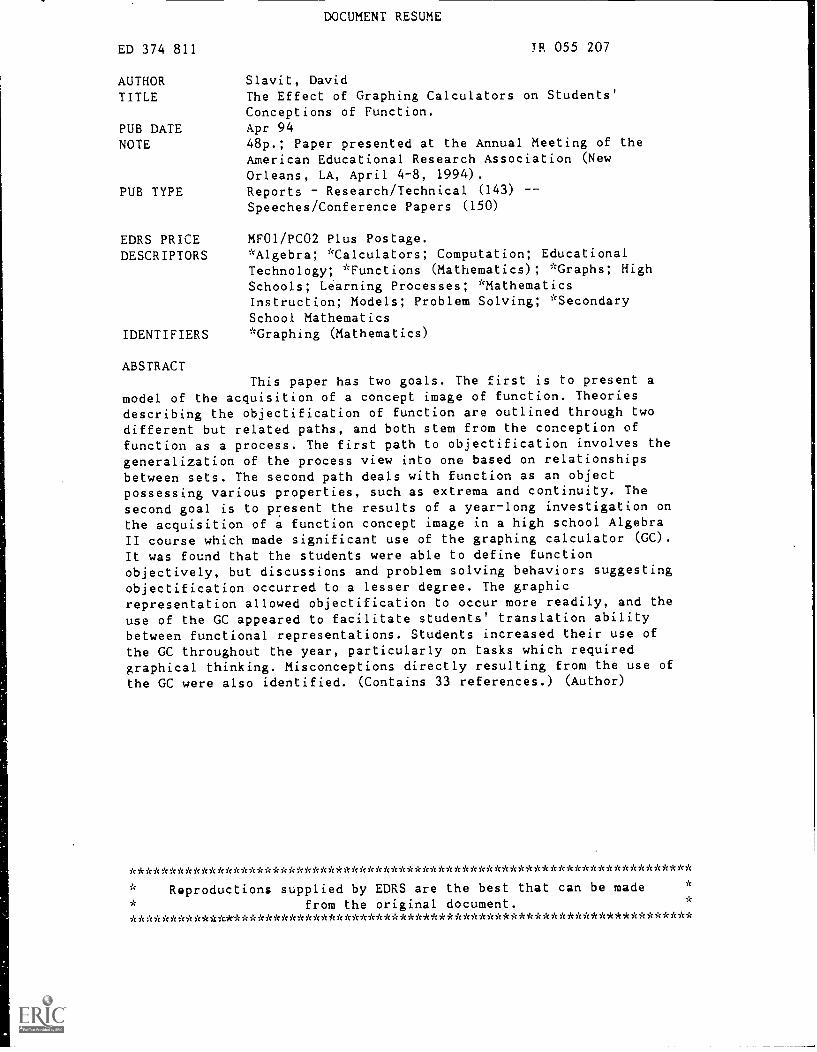
DOCUMENT RESUME
ED 374 811 TR 055 207
AUTHOR Slavit, DavidTITLE The Effect of Graphing Calculators on Students'
Conceptions of Function.PUB DATE Apr 94NOTE 48p.; Paper presented at the Annual Meeting of the
American Educational Research Association (NewOrleans, LA, April 4-8, 1994).
PUB TYPE Reports Research/Technical (143)Speeches /Conference Papers (150)
EDRS PRICE MF01/PCO2 Plus Postage.DESCRIPTORS *Algebra; *Calculators; Computation; Educational
Technology; *Functions (Mathematics); *Graphs; HighSchools; Learning Processes; *MathematicsInstruction; Models; Problem Solving; *SecondarySchool Mathematics
IDENTIFIERS *Graphing (Mathematics)
ABSTRACTThis paper has two goals. The first is to present a
model of the acquisition of a concept image of function. Theoriesdescribing the objectification of function are outlined through twodifferent but related paths, and both stem from the conception offunction as a process. The first path to objectification involves thegeneralization of the process view into one based on relationshipsbetween sets. The second path deals with function as an objectpossessing various properties, such as extrema and continuity. Thesecond goal is to present the results of a year-long investigation onthe acquisition of a function concept image in a high school AlgebraII course which made significant use of the graphing calculator (GC).
It was found that the students were able to define functionobjectively, but discussions and problem solving behaviors suggestingobjectification occurred to a lesser degree. The graphicrepresentation allowed objectification to occur more readily, and theuse of the GC appeared to facilitate students' translation abilitybetween functional representations. Students increased their use ofthe GC throughout the year, particularly on tasks which requiredgraphical thinking. Misconceptions directly resulting from the use ofthe GC were also identified. (Contains 33 references.) (Author)
***********************************************************************
Reproductions supplied by EDRS are the best that can be madefrom the original document.
***********************************************************************

U.S DEPARTMEPiT OF EDUCATIONOrrice of Educational Research and improvement
EDUCATIONAL. RESOURCES INFORMATIONCENTER (ERIC)
C This document has been reproduced asreceived from the person or orgeofzIftiOaoriginating it
C Minot changes have been made to improvereproduction Quality
Points of view or 00iniOnS slated lo tholOOCo'meal do not necessarily represent officialOE RI positron or pohCy
The Effect of Graphing Calculators
on Students' Conceptions of Function
David SlavitUniversity of Delaware
Paper presented at the annual meeting of the American EducationalResearch Association, New Orleans, April, 1994
The author wishes to acknowledge Dan Neale, Diana Wearne, Ron Wenger,and especially Jim Hiebert for their invaluable assistance throughout theentire process of preparing this document. Additional thanks are alsogiven to Rodney McNair.
BEST COPY AVAILABLE
"PERMISSION TO REPRODUCE THISMATERIAL HAS BEEN GRANTED BY
David Slavit
TO THE EDUCATIONAL RESOURCESINFORMATION CENTER (ERIC)...

ABSTRACT
This paper has two goals. The first is to present a model of the acquisitionof a concept image of function. Theories describing the objectification of functionare outlined through two different but related paths, and both stem from theconception of function as a process. The first path to objectification involves thegeneralization of the.process view into one based on relationships between sets.The second path deals with function as an object possessing various properties,such as extrema and continuity.
The second goal is to present the results of a year-long investigation onthe acquisition of a function concept image in a high school Algebra II coursewhich made significant use of the graphing calculator (GC). It was found that thestudents were able to define function objectively, but discussions and problemsolving behaviors suggesting objectification occurred to a lesser degree. Thegraphic representation allowed objectification to occur more readily, and the useof the GC appeared to facilitate students' translation ability between functionalrepresentations. Students increased their use of the GC throughout the year,oarticularly on tasks which required graphical thinking. Misconceptionsdirectly resulting from the use of the GC were also identified.
INTRODUCTION
Recent discussions of algebraic instruction by educational researchers have centered on
reconsidering the central topics and features of instruction at this level (NCTM, 1989; Brown
et. al., 1988). Studies have shown that traditional instruction is lacking in the development of
algebraic concepts (Brown et. al., 1988; Kieran, 1992). The secondary school results from
the fourth NAEP mathematics assessment (Brown et. al., 1988) state that students view
mathematics in
a procedural, rule-based manner. Further, they state that:
Secondary school students are not able to apply (algebraic) knowledge in problem-solving situations, nor do they appear to understand many of the structures underlyingthese mathematical concepts and skills.
The Curriculum Standards (NCTM, 1989) of the National Council of Teachers of Mathematics
ech these remarks. However, despite these efforts, the content and instructional techniques of
high scl. )ol algebra have changed very little over the years (Kieran, 1992).
1

The increased availability of mathematical instructional software, computer games, and
graphing packages has prompted the use of more visual instructional approaches to algebra.
Because educators are now realizing the differences between graphing utilities and educational
software (Goldenberg, 1991), these technological aids provide the mathematics community
with a chance to incorporate visually-based problem solving tools into the classroom. The
Algebra Too lkit (Schwartz, Yerushalmy, and Harvey, 1991), Function Probe (Confrey, 1991),
and numerous other computer graphing utilities are being devised, implemented, and monitored
by researchers as part of a new wave of more modern mathematics instruction. We are
presently at the dawn of this movement, and information is vitally needed to help in our
understanding of the benefits and weaknesses of this form of instruction.
Kaput (1989) maintains that visual representations of computer technologies can be
intertwined with other representations to allow for innovative, effective teaching. Evidence
exists that these techniques can be effective in developing structural understandings of algebra
(Romberg, Carpenter, and Fennema, 1993). Limitations of graphing technologies exist, as the
visual representations can lead to misconceptions, particularly the common "graph as picture"
interpretation (Goldenberg, 1988; Mokros and Tinker, 1987). Evidence also exists (Slavit,
1993) that students who use graphing technology can treat the graph as an additional
representation rather than as a more central part of their function concept image. However, the
students in this study had prior training through more traditional means, and evidence was
provided to indicate that this was a factor in these conceptions.
One popular instructional device is the portable and relatively inexpensive graphing
calculator. The graphing calculator (GC) facilitates the production of a graphic representation,
and it allows for numeric problem solving techniques. Key potential benefits of the GC include
its portability and the ability to present and analyze a given function in a multi-
representational framework. The relative inexpensiveness of several models of graphing
2
4
calculators, along with their portability, has made the GC quite popular in high school and
college classrooms.
The graphing calculator has been available to the mathematics community for
approximately ten years. There exists only a small amount of research regarding its
effectiveness on learning and instruction (Leinhardt et al, 1990), but available evidence
suggests that the GC has a significant impact on the development of concepts (Estes, 1990; Rich,
1990; Teles, 1989). Ruthven (1990) found some evidence that the GC promotes the
recognition of classes of functions both graphically and symbolically, but this may occur only
with extended use. Apparently, students introduced to graphing calculators for only a short
period of time can have difficulty adjusting to the instruction (Giamati, 1990).
One of the potential benefits of using the GC in algebra instruction is that its visual
capabilities may support the development of important functional concepts. If we think of
understanding as building networks between related concepts (Davis, 1984, 1992; Hiebert and
Carpenter, 1992), an understanding of function would involve translating information across
different representational systems. To understand how this development may occur, it is
helpful to consider the ways in which function can be conceived.
Process View of Function
Evidence exists that students initially acquire a process view of function (Sfard, 1989,
1991). This involves function as a linear operation which exists dynamically. Procedural
conceptions of function involve actions such as an arithmetic process, a "function machine", or
an algorithmic view.
Structural View of Function
The process view can evolve into a more permanent structural view. The following
description of the structural view involves 1) relationships between sets, and 2) an awareness
of specific functional properties which exist in a variety of representations. These two views
3

CausalityF(X)
Dependency
Figure 1. Function as a relationship between sets.
describe routes through which students may objectify the function concept, and we may think of
these different views as various pieces of the student's overall concept image (Vinner, 1983).
What is essential in a structural view is that function is thought of as an object which can be
manipulated and acted upon (Dubinsky and Harel, 1992; Kaput, 1992; Moschkovich,
Schoenfeld, and Arcavi,1993; Sfard, 1991, 1992).
View 1: Function as a Dependency Relation Between Two Sets. In a relational view,
function is thought of in terms of the correspondences between sets of inputs and outputs. No
longer is function thought of solely in terms of the production of individual outputs. Instead, the
dependence relationship between domain and range "connects" these sets into a single construct.
This single construct can then in turn be operated on (such as through a translation).
A relational view involves the notions of causality and dependency. There is evidence
that children as young as six years old possess some qualitative notions of function based on
causality (Piaget et. al., 1977; Case, 1982; Halford, 1982). For example, a child can
understand how a weight causes a string to stretch. These "left-to-right" conceptions (x turns
into y) are appropriate at this intuitive level, but "right-to-left" conceptions (y depends on
x) are also needed to understand the relational view of function (see Figure 1).
4

View 2: Function as an Object Possessing Various Properties. Through an intensive look
at elementary functions, students may understand function to be a related set of procedures and
functional properties in a variety of functional representations. These representations are
commonly a symbolic equation, graph, and table of values. The procedures performed on
functions give rise to an understanding of functional properties. These properties can be
specific to a function class (such as linear slope) or generalize to several function classes (such
as symmetry). A student can then conceive of function as an object possessing or not possessing
these properties. I hypothesize that this property-oriented view develops in three stages which
correspond to the instructional sequencing of a typical elementary functions course.
Stage 1: Equivalence of Procedures Across Representations. The first stage of the
functional property view involves an ability to realize the equivalence of procedures which
exist in different representations. Prerequisite to this ability are translation skills (Janvier,
1987). Noting that the processes of symbolically solving f(x) = 0 and graphically finding x-
intercepts are structurally equivalent demonstrates this awareness. It is here that the student
first begins to deeply understand the underlying mathematical purposes of the procedures by
making connections between analogous procedures across different representations.
Stage 2: Equivalence of procedures across function classes. A view of function as a
related set of properties also involves the ability to generalize procedures across classes of
functions. Students at this second stage can translate procedures across representations (Stage
1), but are also beginning to realize that some of these procedures have analogues in other
function classes. For example, the symbolic algorithms used to solve linear and quadratic
equations are different, but they are equivalent when discussed in terms of finding zeroes of
functions. Moreover, these procedures are identical in a graphic setting, and they are
structurally the same across symbolic and graphic representations. Properties of symmetry
shared by quadratic and trigonometric functions provide another example, as do the
5

monotonicity of linear functions and the basic exponential and logarithmic functions. Finding
extrema, general growth behavior, periodicity, domain, range, and intervals of increase and
decrease are further examples of topics which can be explored using procedures in various
representations, but which are equivalent in terms of the interpretations one can make from
them across function classes. Hence, the ability to translate procedures across representations
combined with a knowledge of various function classes yields a more general understanding of
the conceptual result of a procedure and defines this stage of structural thought.
Stage 3: Procedural Networks as Permanent Constructs. The final stage of this process
extends the student's ability to identify functional properties. Once functional properties are
identified, the student can "see" a function as an object either with or without these functional
properties. For example, a quadratic function could be viewed as a continuous function with
exactly one extrema that is symmetric about a vertical line (with, of course, second-degree
growth). Seeing a function as possessing these properties would allow the student to view the
function as a well-defined object. Schwartz and Yerushalmy (1992) state that symbolic
representations more often give rise to procedural conceptions, and graphic representations
more often give rise to structural conceptions. This view of function requires an enormous
amount of prior knowledge and familiarity with specific examples of functions and their
properties, as well as advanced translation skills.
A Note on Terminology
Sfard refers to the process view as an "action" conception, but associates this with the
process of computation. Dubinsky reserves the term "procedural" to describe, what is in my
terminology, a more structural view of function (similar to the property-oriented View 2).
Moschkovich, Schoenfeld, and Arcavi (1993) use the term "process perspective" to define a
relational conception, where sets of inputs and outputs correspond (similar to the relational
6
8

View 1). Kieran (1992) uses the term "procedural" in a manner similar to Sfard and myself.
It is quite evident that a universal terminology of these conceptions would be quite useful.
Synthesis of the Views
It should be noted that the previous views of function are not presented as a
developmental stage theory of function. Instead, I hypothesize that although Views 1 and 2 may
grow out of the process view of function, the two views may be independent of each other. It is
quite possible that View 1 may be the first structural view of function that the student
possesses, but it is also possible that it may be the last. Instruction is likely to influence the
sequencing of this development.
These views of function are in line with instruction which makes use of symbolic,
graphic, and numeric properties and representations. Because of the manner which graphing
calculators can facilitate connections between different functional representations,
incorporating them into the instructional process may benefit student development of a function
concept image. Students who acquire a structural view can investigate functional contexts
without a reliance on procedures and local function behaviors. Instead, emphasis can be placed
on global behaviors such as growth rate or on relationships between specific local properties.
Further, a structural view allows the student to better understand actions performed on a
function, such as a "shift" translation (e.g., changing f(x) to f(x + 3)) or taking a derivative.
METHOD
Sample
This year-long study investigated the effects of graphing calculators on students'
development of a function concept image. The study was conducted in two Algebra II classrooms
at a private, mid-Atlantic high school which generally serves families of high socio-economic
status. The graduating class of the sample consisted of 126 students, with PSAT scores above the
norm (Verbal = 44.4 and Math = 48.5). The cumulative SAT scores of the graduating classes at
7

this school are normally around 1075, and 99% of the graduating class of 1993 entered a four-
year college.
The two Algebra II classrooms were designated as Honors and consisted of students
planning to take AP Calculus. The students were required to purchase a TI-81 graphing
calculator which was used extensively in the instruction and course assignments.
Data were collected in the sections of the course taught by Lee Brook (see below,
Instructor). Lee Brook (pseudonyms are used throughout) taught one section during the first
semester and both sections during the second semester. Hence, year-long data were collected in
one section of the course which contained 18 students. This group will be labeled the primary
sample or primary section. During the second semester, data were collected in both sections
which collectively contained a total of 36 students. It was concluded that the instructor
approached each section quite similarly, using the same teaching strategies, materials, and often
the same explanations. Although slight differences existed between the sections, I decided to
include data from the secondary section in the analysis of student development wherever this
seemed appropriate.
Case Study Participants. Using background information on the students provided by Lee
Brook, as well as two preliminary classroom observations, three students were selected and
agreed to participate in a series of interviews throughout the school year.
Erica. Erica was a sophomore who enrolled in the Algebra II course the previous year,
but dropped midway through the first semester into an Algebra I course. During this time she
gained one year's experience in working with the TI-81 graphing calculator. Erica received an
A during the first semester, and a B+ during the final semester.
Curt. Curt was a freshmen who tested into the Honors Algebra II course. Because of this,
he had no prior experience with the GC. However, he quickly learned the mechanics of. the TI-
81 and stated that he enjoyed working with it. Curt received a B+ for each semester.
8
10

Keith. Keith was a sophomore who transferred in at the beginning of the school year.
Keith indicated to me that his previous schooling focussed heavily on procedures, did not use
graphing calculators, and made little or no use of graphic representations. It did not take long
for Keith to learn the mechanics of the GC, but he never seemed to "take to it" over the course of
the year. Keith received a B and a B+ in the course during the two semesters.
Instructor. The instructor, Lee Brook, is an experienced classroom teacher and recipient
of several teaching awards, including the Presidential Teaching Award. Lee Brook has 26 years
of high school mathematics teaching experience, with the last 24 years at his current position.
He received both the B.S. and M.A. in Mathematics, and occasionally teaches night courses at
local colleges in addition to his high school duties. More detailed descriptions of Lee Brook, as
well as the case study participants, appear in the next section.
Graphing Calculator. The graphing calculator used in this study was the Texas
Instruments TI-81, one of the more affordable graphing calculators at the time this study was
conducted. It has the ability to simultaneously graph four functions of the form y = f(x) on a
viewing screen approximately one inch by two inches. The TRACE feature places a cursor on a
particular point on the graph and identifies the coordinates of that point at the bottom of the
view;r,g screen. The user is allowed to move the cursor along the graph, and the coordinates of
the points are continuously displayed. This feature allows the user to link the numeric and
graphic representations in an immediate and dynamic fashion.
The user can alter the portion of the graph displayed by the GC through the use of the
ZOOM feature. ZOOM changes the range of the x- and y-limits of the viewing rectangle, allowing
the user to either ZOOM in on a small piece of the graph (by narrowing the range of the
coordinates) or ZOOM out to capture a broader view of the function (by enlarging the range of
the coordinates). Local functional behaviors (such as intercepts) can be found by ZOOMing in on
the relevant portion of the graph and using the TRACE feature to identify the coordinates of the
9

desired point. Global functional properties (such as growth behavior and asymptotes) can be
observed by ZOOMing out. The TI-81 also has programming capabilities, but these are limited
by small memory capacity. The TI-81 is also capable of performing regression techniques,
statistical analysis, and matrix may 'pulation.
Data Collection Procedures
Data on student development were collected through a series of written tests, individual
interviews, and questionnaires conducted throughout the school year. The tests and interviews
were included in three Unit Investigations (UI), and were conducted shortly before and after
each unit's instruction. The Uls, approximately two weeks in length, consisted of three
different classes of functions (linear, polynomial, and exponential). The linear unit occurred
during early October, the polynomial unit during February, and the exponential unit took place
in May. Hence, every student in the sample participated in Ul#2 and UI #3, while each student
in the primary sample participated in all three Unit Investigations.
Each written test required the student to define function. discuss "what the idea of
function" meant to them, and to provide an example. Some test items dealt with skills related to
specific properties of the unit's function class, while other items allowed for investigations of
more than one property. The students were also asked to make connections between tasks
written in different representations, and a quiz given between UI#2 and Ul#3 dealt with this as
well.
Student interviews began with tasks in which students' could exhibit their strategies
when translating across functional representations (see Figure 2). This was followed by
problem solving tasks designed to determine the case study participants' structural conceptions
of function, as well as uses of the graphing calculator. For example, tasks involving maxima
were given in different functional representations and classes, and the students were asked to
discuss commonalities in their solutions. The participants were also given function recognition
10

Card 12)<
I C.a.rci 2 I
I Carcl 4- I
Figure 2. Translation task.
tasks to help determine their View 1 structural conceptions. Each interview ended with a
discussion of function or use of the GC.
Class-wide questionnaires were given outside of the Unit Investigations, during both
November and May, which dealt with uses of the graphing calculator and the concept of function.
The GC Questionnaire focussed on determining the types of tasks on which students would most
likely use the graphing calculator. The Function Questionnaire determined if the students agreed
more with a process or relational view of function. Periodic classroom observations were
conducted weekly and provided descriptive information on the instructional process.
Analyses focussed on determining the students' concept image of function. Since function
View 2 is dependent on generalizations across function classes, student work was examined
across the year. This analysis also allowed for observing changes in students' conceptions of
function.
RESULTS
Although this paper focusses on evidence relative to learning outcomes, a brief overview
of the instructional process from this study will now be given. The GC provided the instructor a
11
J3

.so
means of quickly changing symbolic function parameters in order to better discuss global
functional properties of a given function class. For example, simultaneously graphing the
functions f(x) = 2x and f(x) = .5x allowed for discussions of exponential increase and decrease.
The TRACE feature allowed these graphic representations to be quickly tied to numeric ones, and
the instructor was careful to relate the symbolic expressions to these as well. Hence, the GC
facilitated explorations from a multi-representational viewpoint. The need for the symbolic
expression when graphing a function on the GC helped to "force" these connections into the
lesson. The instructor used this to his advantage throughout the year, but he increased his use
of the GC as the year progressed and as more novel topics and function classes were being
introduced. The GC also allowed the instructor to explore textbook problems in his own fashion,
changing them into explorations which were more pertinent to the lives of the students. For
example, the ability to quickly change the symbolic parameter of a linear function allowed for
investigations into the operating costs of cars with varying as mileage.
Development of a Structural View of Function
Six times throughout the year each student in the sample was asked for their thoughts on
the concept of function, once before and after each of the three Unit Investigations. Specifically,
the following questions were asked:
1. (Definition item) Give a precise definition of function.2. (Discussion item) In your own words, relate what the idea of function means to you.3. (Example) Give an example of a function.
The students' initial conceptions of function primarily dealt with speciffr; productions of
outputs, usually from a symbolic formula (see Tables 1 and 2). This result is in line with
prior research (Sfard, 1991) and we have previously referred to this as a process view of
function.
Insert Tables 1 and 2 About Here
12
14

Tables 1 and 2 indicate that students' formal definitions of function contained more
references to a relational view of function than did their informal discussions of function. For
example, on the posttest of Ul#1, CK wrote the following when answering these items:
1. (Definition) A function is a relationship where each input has one output. The domain of afunction is the input, the range is the output.2. (Discussion) A function is where you substitute a number for a variable and get one answer.
CK's definition was written in relational terms, but he had procedural thoughts on the nature of
function since they dealt with the computing of specific outputs. On the pretest of Ul#2, LJ
wrote the following (both were classified as relational responses):
1. Any relation where for every input there is only one output.2. An equation where for every x there is only one y.
Other students, such as MR, gave a similar response for the Definition item, but for the
Discussion item used numeric terms such as "Every number you put into this equation you will
get back only one number". Because of the direct reference to the production of specific
outputs, this response was classified procedural.
Throughout the year, many other students defined function and personalized a discussion
of function in a similar fashion as CK. Relational terms were used in the definition, but
procedural terms were used to discuss what it meant. The fact that the rise in relational terms
is sharpest during Ul#1 is due to the fact that this is where Lee Brook first gave a formal
definition of function, stating, "It's a relationship, it's not just sticking in an x". Lee Brook
followed this with a toll bridge metaphor, analogous to the more common function machine.
Student responses appeared to be framed in part by this instruction, even though rote knowledge
of the definition was never stressed. Students used terms such as "input", "output", and
"relationship" to define function, but the intended meanings of many of these definitions
involved only the production of single outputs and not the connection between domain and range,
or even connections between specific elements of the domain and range (ordered pairs). In
13
1 5

addition, by the end of the year, 22 out of 34 students defined function without the use of a
functional representation, but instead used terms such as "inputs and outputs". However, 21
out of 34 students used symbolic language in discussions of function. All but one example of
function given by the students throughout the entire year was in symbolic form, and most were
examples of linear expressions.
These data indicate that the students increased their awareness of the relational
properties of function over the course of the year, but to a limited degree. This evidence is
supported by the Function Questionnaire items in Table 3 which illustrate the procedural view
of function the students carried with them throughout the year, as 85% of the students
continued to agree more with function as a computation than as a correspondence between sets.
Insert Table 3 About Here
To further illustrate, let us consider the comments of Erica, one of the case study
participants.
Pre-Task Interview #1DS: What do you think of when you hear the word function?Erica: Urn, I think I think of y, y values. Urn, f(x), and kind of dealing with graphing.
Post-Task Interview #2DS: Can you tell me what a function is.Erica: Well, its an equation in which certain numbers are put into, urn, which will give you oneanswer overall. Each input can produce one and only one output.DS: Ok, that's a good definition, but beyond the definition, how do you think about what afunction is? Is there anything besides just that definition?Erica: Urn, (long pause) I guess just like, urn, an equation that can be applied to numbers.
Post-Task Interview #3DS: Part A (Definition item) on the written tests was always "state the definition of function",and the second part was "state what the idea of function means to you". Did those mean differentthings to you?Erica: To me they were pretty much the same. You have the technical definition, but minemeans the same, just in easier terms to comprehend I guess.DS: OK, do you remember the "in your words", what you said for that?Erica: (pause) Um, I think it was something like, urn, for any number put in the equation therecan only be one answer that develops.
14
16
These comments indicate the procedural manner in which Erica's definition of "each input can
produce one and only one output" should be interpreted, and how this changed very little over
the course of the year. Keith made similar comments at the end of Ul#3.
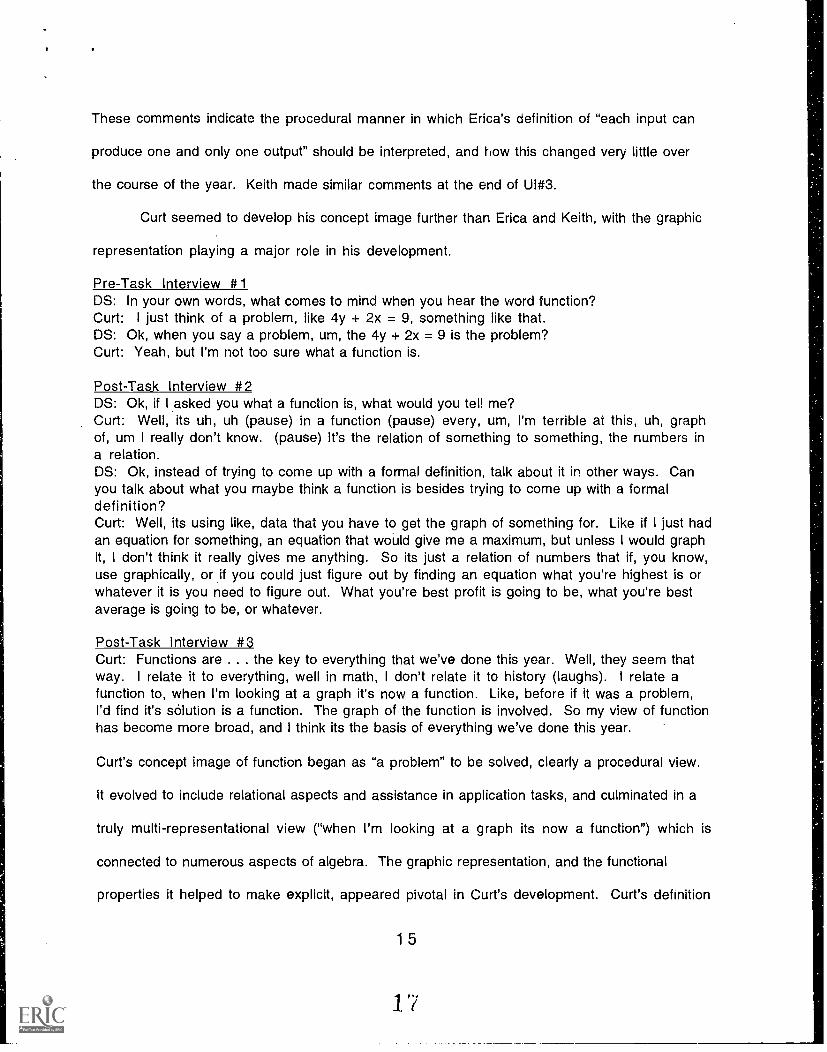
Curt seemed to develop his concept image further than Erica and Keith, with the graphic
representation playing a major role in his development.
Pre-Task Interview #1DS: In your own words, what comes to mind when you hear the word function?Curt: I just think of a problem, like 4y + 2x = 9, something like that.DS: Ok, when you say a problem, um, the 4y + 2x = 9 is the problem?Curt: Yeah, but I'm not too sure what a function is.
Post-Task Interview #2DS: Ok, if I asked you what a function is, what would you tell me?Curt: Well, its uh, uh (pause) in a function (pause) every, urn, I'm terrible at this, uh, graphof, um I really don't know. (pause) It's the relation of something to something, the numbers ina relation.DS: Ok, instead of trying to come up with a formal definition, talk about it in other ways. Canyou talk about what you maybe think a function is besides trying to come up with a formaldefinition?Curt: Well, its using like, data that you have to get the graph of something for. Like if I just hadan equation for something, an equation that would give me a maximum, but unless I would graphit, I don't think it really gives me anything. So its just a relation of numbers that if, you know,use graphically, or if you could just figure out by finding an equation what you're highest is orwhatever it is you need to figure out. What you're best profit is going to be, what you're bestaverage is going to be, or whatever.
Post-Task Interview #3Curt: Functions are . . . the key to everything that we've done this year. Well, they seem thatway. I relate it to everything, well in math, I don't relate it to history (laughs). I relate afunction to, when I'm looking at a graph it's now a function. Like, before if it was a problem,I'd find it's solution is a function. The graph of the function is involved. So my view of functionhas become more broad, and I think its the basis of everything we've done this year.
Curt's concept image of function began as "a problem" to be solved, clearly a procedural view.
It evolved to include relational aspects and assistance in application tasks, and culminated in a
truly multi-representational view ("when I'm looking at a graph its now a function") which is
connected to numerous aspects of algebra. The graphic representation, and the functional
properties it helped to make explicit, appeared pivotal in Curt's development. Curt's definition
15
17

also reflected an emphasis on problem solving which was consistent with the instruction of Lee
Brook.
Since only 12 of 34 students discussed function in the same relational terms as Curt on
the Discussion item of the posttest in U143 (Table 2), generalizations to the entire class cannot
be made. In addition, the second time the Function Questionnaire was given, Curt was 1 of only 5
students who agreed more with the correspondence view of function than the computational view
of function. These data indicate that the instruction was lacking in regard to the development of
a View 1 structural conception. Although the graphic images of the GC provide opportunities for
discussions of the relational aspects of function, these were not emphasized by the instructor
throughout the year.
Task analyses of the case study participants provided more in-depth information in
regard to the attainment of a View 1 conception. Tasks were given during the Post-Interview of
U142 which consisted of 12 sets of cards depicting two examples and non-examples of function
in each of the numeric, graphic, and symbolic representations. The participants received no
formal instruction on the majority of the function examples in these tasks (they were not the
elementary functions common to the course), and all but one of the graphs were discontinuous.
All three of the case study participants provided accurate reasons for the numeric
examples and non-examples of functions. All of the participants successfully identified each of
the symbolic examples with the exception of Card 8 (x2 + y2 = 16), although somewhat faulty
reasoning was used on some. For example, Erica and Keith indicated that x2 + y2 = 16 was a
function, stating that it could be "solved for y". The GC requires an expression of the form y =
f(x) in order to produce a graph, and this may have been a source of the students' thinking.
This reason was used by Erica and Keith for all four symbolic examples. Here, Erica reveals
her thinking on Card 1 (x = y2 -2y + 5):
16

Erica: No because it would have to be y by itself, I guess you could get it by itself.DS: Ok, you mean y= something?Erica: Yeah.DS: Ok, suppose you couldn't get y= something, then is it a function?Erica: Then (pause) urn, it wouldn't be a function.
Only Curt stated that the two non-examples, Cards 1 and 8, would violate the univalence
criteria. Keith was the only participant to indicate that Card 1 could be interpreted as a
function x = f(y).
Explanations on the graphic examples were much more diverse. All three participants
were fooled by graphic properties and behaviors not associated with the elementary functions
used in the course. Both examples of function were not identified by all three participants, as
they were misled by the finiteness of the graph or the discontinuity. On Card 5 (see Figure 3)
Erica stated:
Erica: It's not a function.DS: How come?Erica: It has to be continuous (pause).DS: If I connected these points would that be a function?Erica: No, you can't really get an equation that would give you that. It's more like a slope.DS: Ok, so is the fact that its not continuous or that you can't get an equation . . .
Erica: Both.
On that same card, Curt stated:
17
l9

Curt: This one, urn (pause) from what I know, I guess, these continue out right?DS: No, that's where it stops.Curt: Oh, well then no, because they don't continue out.DS: Ok, what if they did continue out?Curt: Well, if it did continue out I'd say technically I guess, well, maybe, I'm just guessing butfrom what I know I guess it would be a function, but it doesn't really look like one at all.DS: Why do you say it is?Curt: Well, because there is one y-value for every x-value, but I'm not sure if there has to bea y for every x. It doesn't really look like a function, but it fits the requirements I know of.
Curt seemed to be doubting his own feelings due to the unusual behavior of the graph. By this
time his written definition of function was "exactly one output for each input", but his last
statement in this passage seems to indicate confusion on what this really meant. The "gap" in
the graph of Card 10 (see Figure 4) caused similar confusion:
Curt: I would say (it's not a function) because there's not a y-value for every x.DS: If that was connected would it be.Curt: Urn (pause) I don't think ao, well, maybe. Urn, the only question is the sharp turn, but Iwould think so, if it was connected (it would be a function).
The students' concept image of the graph of a function clearly involved continuous
functions with infinite domains which can be represented by a symbolic expression y = f(x).
The GC requires a symbolic expression, solved fcr y, in order to produce a graphic
representation. Erica's reasoning that "you can't really get an equation" indicates that the
requirement of a symbolic representation is a misconception the GC can foster. In addition, the
graphic images that the students normally viewed on their GC did not resemble the functions on
18
20
these cards, as the instruction predominantly dealt with elementary functions. This also may
have led to the other misconceptions involving the discontinuities of the graphic examples.
Discussion. The students in this study, like those of Sfard (1991), appeared to have
difficulty generalizing a process view of function into an object-oriented relation which dealt
more with set-based conceptions. The evidence indicated that most students were able to define
function as a relationship between sets, but this conception was less prevalent when discussing
what this meant. In other words, the students were able to produce a set-based, relational
definition of function, but these conceptions were less prevalent in discussions or problem
solving situations. The exclusive use of elementary functions when working with the graphing
calculator may have hindered this development, as it appeared to foster misconceptions in
regard to the nature of graphic functional relations. We now examine if a property-oriented
View 2 structural conception was achieved.
Structural View 2
One way in which students might have developed structural View 2 would have been to
focus on the type of function (linear, exponential, etc.) and relate this to various graphic,
numeric, or symbolic features. Since the GC allows for problem solving strategies in each of
these representations, incorporating it into the instruction would seem to facilitate a View 2
conception.
The written tests of UI #2 and Ul#3 contained tasks which asked the students to analyze a
function given in symbolic, numeric, or graphic form. The tests of Ul#2 were designed to focus
more on the use of the GC for tasks written symbolically, and UI#3 dealt more with differences
in problem solving strategies amongst tasks written in different representations. Every student
was required to indicate whether or not they used the GC in the solution process and to discuss
the manner in which they solved a particular task. Questionnaire items were also used to
determine the level of GC use of the class.
19
2i

OC Questionnaire. Responses to the GC Questionnaire indicated that the students made
extensive use of the GC for tasks which asked them to produce or analyze a graph (see Table 4).
The students increased their tendency to initiate the use of the GC and graphical analysis from
59% to 85% over the course of the year, and similar increases were found in the students' view
of the necessity of the GC in the solution process. Hence, the students indicated that they
increased their use of the GC the most on tasks which implicitly called for graphical analysis.
Solving the expression x2-5x+4=0 graphically would illustrate this problem solving behavior.
These data indicate that the GC had an effect on the students' problem solving tendencies, and it
may have had an effect on their property-oriented view of function. To help determine the
latter, we now describe specific uses of the GC over the final two Uls.
Insert Tables 4 and 5 About Here
Unit Investigation #2. The students increased their use of the GC following the
instruction of Ul#2 (see Table 5), particularly on items which called for finding zeroes of
functions. This supports the data from the GC Questionnaire in that increases were greatest for
tasks involving graphical analysis. A closer examination of the students' strategies indicated
that they made great use of the ZOOM and TRACE features of the GC when using it in the problem
solving process. They also combined symbolic, graphic, and numeric techniques to find
solutions. For example, on the task "Find the zeroes of f(x) = x3 - 19x + 30" from the
posttest of Ul#2, 31 out of 32 students indicated that they used the GC to solve the problem. The
following strategies were given:
JG: I graphed it and zoomed in and checked by substituting the numbers in.MM: I graphed the function, listed the possible zeros of the function, and picked -5. I evaluatedthe function for -5 on my calculator, and it equalled zero. Then I factored (x+5) out of thefunction using synthetic division. I factored the resulting quadratic function to get the other twozeroes.
20
')

CR: I Traced to find the place where the graph crossed the x-axis.BC: Boom, boom, boom and zoom, zoom ,Graph and ZOOM).MD: I found possible rational solutions, graphed it, narrowed the solutions down, and pluggedthem in.
All of the students' strategies reflected one of the above, with ZOOMing in on the x-axis of a
graph being the most popular. Note that MM and MD made use of the Rational Root Theorem, a
strategy Lee Brook used in class prior to introducing graphic techniques. Multiple functional
representations were also used in their solutions -- the fact that the polynomial has three
zeroes came from t. degree of the expression, the possible zeroes came from the Rational Root
Theorem, and the answers came from TRACing the graph on the GC and using the possible
rational roots as a guide.
Some students (37%) still preferred symbolic strategies when solving relatively
simple tasks like "Find the zeroes of f(x) = x2 - 4x - 32" (see Table 5). Two of the students
who did not usea graph stated that they used the quadratic formula, while the rest "simply
factored it". Even though the success rate stayed virtually the same on this item, the number of
students who switched from symbolic to graphic methods increased considerably.
Insert Table 6 About Here
On a task which was possibly worded toward symbolic methods, "Factor f(x) = x3 + 3x2 -
4x - 12", 41% of the students solved it with the GC by graphically finding tne zeroes of the
function (see Table 5). Table 6 indicates that this task was by far the most missed item on the
written tests of UI#2. However, on the pretest, 8 of the 11 students who used the GC in the
solution of the problem were correct, and 13 out of 13 students were correct on the posttest.
BL stated, "I tound the zeroes on the calculator and used them to factor down the equation."
Another item, "Find all values of x such that 5x2 + 9x 3 > 4x + 5x2", also had very low usage
21
23

of the GC in its solution. The success rate for those who did and did not use the GC were similar,
with GC users correctly answering 3 out of 5 on the pretest and 7 out of 8 on the posttest.
The above results support the findings from the GC Questionnaire on students' problem
solving tendencies with the GC. The students preferred to use the GC on most problems, but still
Figure 5. Graph of f(x)= -x5 +12x4 +10x3 -120x2 -9x +108using the standard viewing window.
were capable of solutions which did not make use of graphic representations. The factoring item
suggests that the students were, at times, more able to find a correct solution when using the GC.
This accuracy also held true, in part, on the graph construction items (see Table 7). I
designed functions in which significant portions of the graph occurred outside of the default
viewing window. If using the standard viewing window, both graphs of UI#2 would appear as
disconnected vertical lines (see Figure 5). This could only be corrected if changes were made to
the range values of the y-coordinates. In addition, item 1 contained an extrema and an x-
intercept outside of the [-10,10] range for the x-coordinates, forcing changes along this axis
as well. The students were forced to use their knowledge of the behavior of the function class in
order to recognize that the default graph was incomplete.
22

Insert Table 7 About Here
Table 7 indicates that most students were capable of recognizing the need to extend the
range of the y-values in order to display a continuous graph, but less capable of investigating
graphic behavior outside of the default range of the x-coordinates. This is likely due to the fact
that the students initially saw the graph in Figure 5, understood that the "lines" were merely
parts of the graph which eventually must connect, and changed the range of the y-coordinates
accordingly. Of the students who expanded the range of the y-coordinates, less than 15% still
drew a discontinuous graph for item 1 on the pretest. No one on the posttest drew a
discontinuous graph for item 2. This indicates that the students were successful in investigating
graphic behaviors outside of the default range for the y-coordinates. However, on the posttest,
two-thirds of the students continued to fail to investigate the graph of item 1 outside of the [-
10,10] range for the x-coordinates. This is despite receiving instruction on the number of
intercepts a fifth-degree polynomial should have. It also should be mentioned that
approximately one-third of the students who included all five intercepts in their graph did so in
a discontinuous manner. Therefore, the number of discontinuous graphs may have been higher
if more students had included all of the intercepts in their graph of item 1. Hence, when
constructing a graph, students were much more attentive to a function's continuity than the
number of zeroes it may have. It also may be true that students are more likely to examine
functions vertically and investigate behaviors for large values of the range (y-coordinates),
and less likely to expand a graphic image horizontally to investigate behaviors for large values
of the domain (x-coordinates).
Unit Investigation #3. Responses on the written tests in Ul#3 indicate the flexibility in
the students' problem solving strategies. They also may indicate that the students did not always
23
2 .5
view the GC as essential for success, as only minor increases were found in the use of the GC on
the written tests of UI#3 across the unit. It should first be noted that these items were written
in symbolic, graphic, or numeric representations. In addition, unlike the tasks of UI#2, some
of these items were written in narrative form.
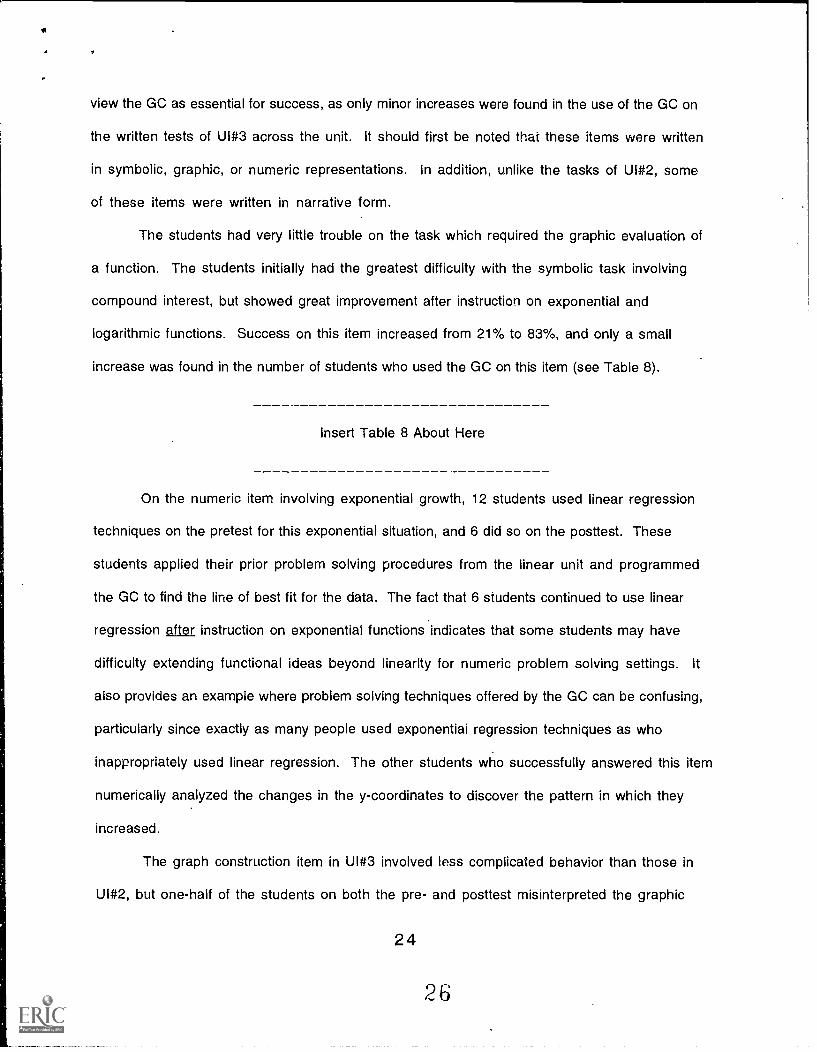
The students had very little trouble on the task which required the graphic evaluation of
a function. The students initially had the greatest difficulty with the symbolic task involving
compound interest, but showed great improvement after instruction on exponential and
logarithmic functions. Success on this item increased from 21% to 83%, and only a small
increase was found in the number of students who used the GC on this item (see Table 8).
Insert Table 8 About Here
On the numeric item involving exponential growth, 12 students used linear regression
techniques on the pretest for this exponential situation, and 6 did so on the posttest. These
students applied their prior problem solving procedures from the linear unit and programmed
the GC to find the line of best fit for the data. The fact that 6 students continued to use linear
regression after instruction on exponential functions indicates that some students may have
difficulty extending functional ideas beyond linearity for numeric problem solving settings. It
also provides an example where problem solving techniques offered by the GC can be confusing,
particularly since exactly as many people used exponential regression techniques as who
inappropriately used linear regression. The other students who successfully answered this item
numerically analyzed the changes in the y-coordinates to discover the pattern in which they
increased.
The graph construction item in Ul#3 involved less complicated behavior than those in
UI#2, but one-half of the students on both the pre- and posttest misinterpreted the graphic
24
26
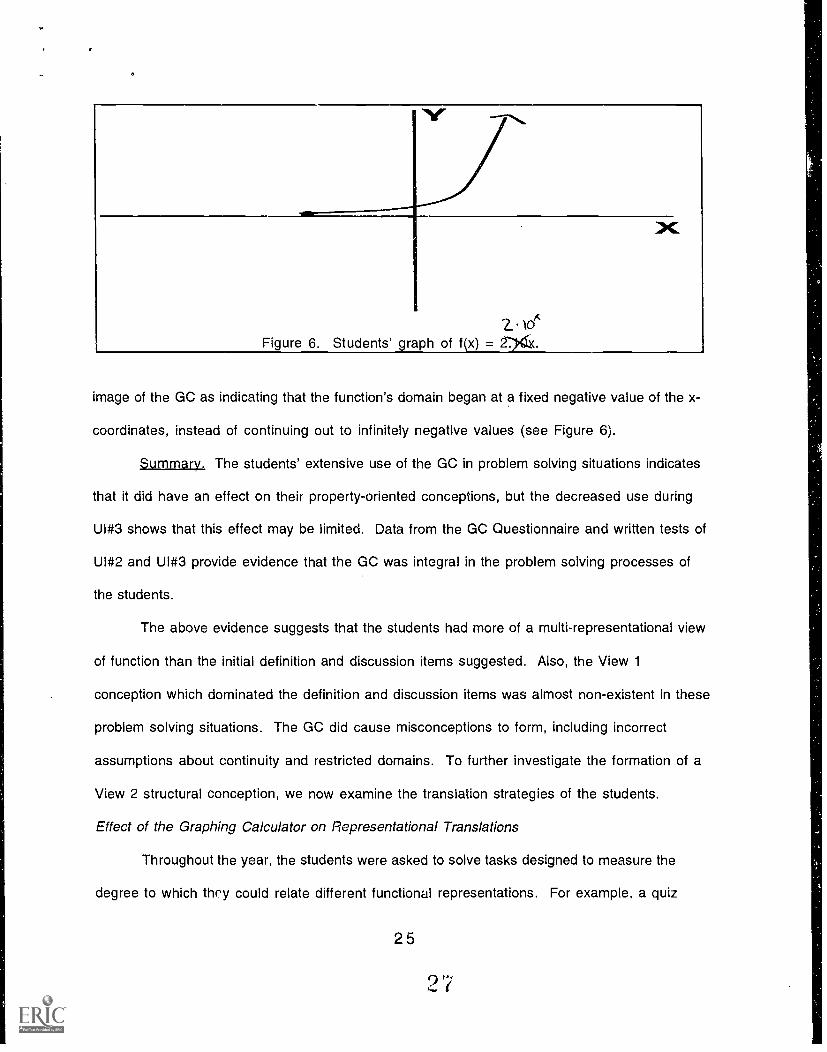
2.* lo'`Figure 6. Students' graph of f(x) =
image of the GC as indicating that the function's domain began at a fixed negative value of the x-
coordinates, instead of continuing out to infinitely negative values (see Figure 6).
Summary. The students' extensive use of the GC in problem solving situations indicates
that it did have an effect on their property-oriented conceptions, but the decreased use during
Ul#3 shows that this effect may be limited. Data from the GC Questionnaire and written tests of
Ul#2 and Ul#3 provide evidence that the GC was integral in the problem solving processes of
the students.
The above evidence suggests that the students had more of a multi-representational view
of function than the initial definition and discussion items suggested. Also, the View 1
conception which dominated the definition and discussion items was almost non-existent in these
problem solving situations. The GC did cause misconceptions to form, including incorrect
assumptions about continuity and restricted domains. To further investigate the formation of a
View 2 structural conception, we now examine the translation strategies of the students.
Effect of the Graphing Calculator on Representational Translations
Throughout the year, the students were asked to solve tasks designed to measure the
degree to which they could relate different functional representations. For example, a quiz
25

given between Ul#2 and UI#3 asked the students to discuss any commonalities in their solutions
to tasks involving zeroes of functions which were written in three different functional
representations. 62% of the students explicitly mentioned the structural similarity of these
tasks. LJ stated:
LJ: All of the questions asked for the zeroes of the equation. The solutions were, where on agraph the line crosses the x-axis. You could put a graph to all of the problems in order to findthe zeroes. Two of the solutions were estimations.
Note the use of the graphic representation to describe similarities in the tasks, something
common to many of the responses. These comments indicate that the students' concept images
were often in multiple representations, which allowed the students flexibility in choosing an
appropriate problem solving strategy. LJ's emphasis on the graphic representation suggests
that he made this his "anchor" representation, and his ability to equate procedures across
function classes and representations is evidence of an evolving View 2 structural conception.
During the Pretask Interview of UI #2, the case study participants solved tasks in
symbolic, numeric, and graphic representations, all involving maximization. When asked to
discuss similarities in these tasks, Erica and Curt recognized the similarity in the goal of the
tasks (maximization) despite the different representations, and discussed this using graphic
language.
Erica: Oh, each problem involves a vertex I guess, and it represents the maximum point of each.Like on this one you wanted the vertex itself, and this one the maximum profit, and this onewanted his best scoring season, so uh, the vertex that way. Um, these two are parabolas, but theprofit one I'm not too sure about.
Curt went a bit further discussing the use of a graphic representation:
Curt: If I just had an equation for what Jimmy Jumpshot plays, how his scoring went, anequation that would give me a maximum, but unless I would graph it, I don't think it really givesme anything.
26
23

It appears that Erica and Curt relied heavily on the graphic representation in problem solving,
as well as in making connections between representations. Like LJ, they used the graph as an
anchor with which to think about the maximizing characteristics of the tasks.
The most extensive information on translation strategies involved tasks given to the case
study participants before and after each of the three Unit Investigations. The tasks involved
cards containing functions in different representations, and the students were asked to
determine any similarities or differences in the functions (see Figure 2). Attention was given
to the manner in which they related the various representations of a given function. Only minor
differences were found in regard to the success at which each of the students translated between
two particular representations of the same function, with a slightly higher success rate for
translations involving symbolic equations (E) and numeric tables of values (T). No major
differences were found in the success rates across Unit Investigations, but all three students
were more able to correctly translate between each pair of functional representations after the
instruction in each UI (with the exception of Keith during Ul#2).
Of greater interest is the manner in which these translations were made. Generally,
students either translated on a local, point-by-point basis or used global properties and
behaviors. A local translation strategy would involve the student checking several values of the
domain on each representation and determining if they have identical range values. This
approach would correspond to a procedural view of function. A behavior oriented strategy
would discuss things such as "the same slope and intercepts" or "both grow exponentially in the
same way" and would correspond to a more structural view of function. Sometimes the students
would combine these strategies. For example, when translating between two representations of
a linear function, a student may notice that each has the same y-intercept (without evaluating a
function or plotting a point) and then check "any other point".
27
2 1.-1

An analysis of these tasks revealed that the students were much more inclined to use local
"point-checking" strategies when relating Equation-Numeric Table (ET) representational
pairs, and more likely to use global properties when relating Graphic-Equation (GE) pairs.
Erica used local strategies more often when translating between Graph-Numeric Table (GT)
pairs, while no pattern was found in the strategies of Curt and Keith on these tasks. A summary
of the observed translation strategies of Keith can be found in Table 9. Since the GC requires a
symbolic expression in order to produce a graph, this may have facilitated the advanced
translation strategies between these representations. In any event, the fact that the translation
strategies were most advanced for these representational pairings is further evidence of the
positive influence of the graphic representation on a View 2 structural conception.
The strategies of Curt and Erica went from local to global after the instruction in Ul#1.
Similar changes during the other Unit Investigations were not as noticeable. Several of the local
strategies involved the use of intercepts, especially on GE and GT pairings of linear functions.
Very little difference was found in the translation strategies of the students for different
function classes, as their strategies stayed consistent throughout the year. Hence, the functional
representation appeared to be more of a factor than the function class in determining the
strategy used.
The following comments of Erica during UI #1 help to illustrate the advancement in the
students' translation strategies. During the Pretask Interview of Ul#1, a task involved the
graph and equation of the functions y = x + 8 and y = -2x + 8 (see Figure 2):
Erica: (long pause)DS: Which ones are you comparing now.Erica: Cards 2 and 1, they both have the y-intercept the same, and it appears that would be thesolution, uh, yeah, uh (pause) Card 3 has the same intercept too, urn, (pause) oh Card 3 is thesolution to Card 2, urn (pause) Card 1 wouldn't be but it does have the same y-intercept . . .
well all of them share the same y-intercept as Card 2. Eight is the y-intercept, urn (pause) andCard 1 would be the solution to Card 4.DS: How are you comparing these?Erica: Urn, well its kind of hard to see, but I was just putting numbers in.
28

DS: Ok, which numbers?Erica: For Cards 1 and 4 I guess I put zero in for y and it would have to be four, which is whatthe x is on here.DS: OK, in general, any similarities or differences?Erica: Just that the y-intercept was the same with all of them.DS: OK.
We see evidence that Erica is concerned with important aspects of the linear function, namely
the intercepts, but her translations rely on point-checking strategies. After the instruction in
Ul#1, Erica faced a similar task. Here, Cards 2 and 3 relate the graph and equation of the
function y = x + 3, while cards 4 and 5 represent the numeric and symbolic representations of
x-y= -1:
Erica: (pause) Cards 3 and 2, um, Card 3 would be the equation of the line.DS: How did you know that one?Erica: Urn, because three is the y-intercept of the equation and it runs through three, and then,um, if the slope is just one the line would intercept at negative three.DS: Ok.Erica: (pause) Cards 5 and 4, the x and y's fit into the equation.DS: How did you check that?Erica: I just plugged the numbers in.
Here we see how Erica is beginning to use the property of slope to make connections between the
representations. However, she used slope to check the point (-3,0), not as a defining property
of the function. We also notice how she used local properties on the ET pairing. Erica's
strategies continued to get more sophisticated, as evidenced by the following task given before
UI#2. Cards 3 and 4 are the graphic and symbolic representations of the function y = -2x + 4:
Erica: Card 4 is the equation for Card 3, they both have y-intercept of four and slope is -2.
Here we see that Erica is satisfied that both cards represent the same function without any
reliance on point-plotting or evaluation. It also shows that she is beginning to objectify linear
functions, as they Ire completely determined by the two properties of slope and y-intercept.
29
31

Curt showed similar development during UI#2 in regard to polynomials. In this task,
Cards 1, 2, and 4 represent either the graph or equation of a fourth-degree polynomial, and
Card 3 is the equation of a third-degree polynomial:
Curt: Urn, let's see, I'd have to say that I don't think Card 3 has anything to do with the otherones because I think it has different humps, I don't know. Cards 1 and 2, well obviously theyaren't related so I'll try, urn, Cards 4 and 2. Urn, I don't know about any of these.DS: Can you make any general comments?Curt: Just that, (pause) no (laughs).DS: Ok, how come you think you had so much trouble with those?Curt: Because I really, there's no way I could figure them out, I mean there's no coordinates oranything.
Although it appears that Curt is somewhat familiar with the behavior of third- and fourth-
degree polynomials, this final comment indicates that he is still dependent on sets of ordered
pairs and point-plotting strategies when translating between different representations of this
function class. This dependency waned by the end of UI#2. Here, Curt indicates that Cards 2 and
3 represent the graph and equation of different third-degree polynomials:
Curt: Uh, Card 2, well let's see, urn, I don't see any similarities other than Card 3 could be thegraph of a third- degree equation, but it's going from positive to negative so it couldn't be thegraph of Card 2 ... Well, Cards 2 and 3, if you stuck a negative in front of the x3 it might work.
Curt also used global strategies during this interview on a GT pair:
Curt: Ok, well, looking at Cards 2 and 3, Card 2 could be the graph of Card 3 because looking atit, the point (0,0) in Card 2 is a point as it is in Card 3, and both of them look to besymmetrical over the y-axis. Yeah, both of them, and also, except for zero, all the points arenegative on both, it goes from negative to negative and never crosses the x-axis, so the y's arepositive.
Here Curt initially focussed on a single point, but then used symmetry, the position of the graph
below the x-axis, and the general shape of the graph (starting and ending "at" negative
infinity) to translate between representations. These data illustrate the effects of the
previously discussed explorations with the graphic images of the GC on Curt's conceptions of
function.
30
32

During the final interview, the participants were asked to discuss the methods in which
they made translations. By the end of the year, Curt stated that he was more comfortable with
pairs involving graphic representations due to his ability to recognize and relate growth
behavior.
Curt: Some of the tougher ones I've had to relate them, you know, where it was tougher to plugthings into stuff.DS: Were those tougher when you couldn't plug in?Curt: Well, it would be tougher to figure out an exact answer, but in general it would be just aseasy.DS: Ok, how about a graph and a corresponding table of values, talk about how you related those.Curt: Well there, ok, that's easy, because you can just tell, the first thing I would look at is thedirection of the graph from the values, so they're related that way. I mean, because with thesteepness that I was just looking at, and then with the graph you learn alot from the direction itgoes, and the values, as opposed to an equation, you can really see more which direction it goes.DS: Ok, how about the equation and a table of values, how did you relate them?Curt: They're a little tougher to relate for myself, but its kind of easy. Well, you get the ideafrom working with the equation, but they're the toughest because with the graph, saying itsrelated, well you're looking at a picture, but these two when you say they are related its becausethe values are corresponding, you have to do work other than use your eyes to decide.
Here, Curt explicitly stated his use of local translation strategies on ET pairings, and how by the
end of the year this was less efficient than concentrating on global, property-oriented strategies
which he commonly used on pairs involving a graphic representation.
It appears that the graphic representation most often gave rise to structural translation
strategies, and the numeric representation most often gave rise to procedural translation
strategies. This indicates that graphs are vital in the students' advancement towards functional
View 2. A deep understanding of functional properties, and the objectification of function as an
object containing these properties, would seem to be highly dependent on the graphic
representation. The manner in which the GC can facilitate graphic investigations appears to be
beneficial to this type of understanding.
31
33

DISCUSSION
Curriculum planners have little evidence on which to base decisions regarding the use of
the graphing calculator in algebra courses. This study has attempted to address this need by
providing information on the learning outcomes in a high school Honors Algebra II course which
made extensive use of the graphing calculator.
Students' Conceptions of Function
The students' ability to objectify function was examined at two distinct levels; 1) as a
causal and dependency relationship between two sets (View 1), and 2) as a connected network of
functional properties in a variety of classes and representations (View 2). Many of the students
failed to objectify the concept of function from a relational perspective, although the written
definitions they provided would suggest otherwise. The students also did not appear to objectify
the concept of function beyond quadratics in terms of functional properties. Specific function
classes were objectified, but the general notion of function as an object possessing a variety of
properties was not made. However, evidence existed that the students were beginning to deepen
their property-oriented conceptions after the instruction on exponential functions at the end of
the year, and continuous rises in a relational conception were also seen.
The extensive use of the graphic representation provided by the GC enabled the students
to more readily focus on global function properties, thereby fostering the development of a View
2 structural conception. The strongest evidence for this came from analysis of the strategies
used by the case study participants to translate between functional representations. Pairs
involving graphs allowed for global translation strategies, and those which involved a symbolic
representation led more to local strategies. Evidence indicated that the case study participants
obtained procedural translation ability (PTA) for all classes of functions, but acquired
structural translation ability (STA) only for linear, and possibly quadratic, functions.
Procedural translation ability allows one to move the function definition across symbol systems.
32
34

Graphing a function given its equation, writing the equation of a line given two points, and
graphically finding zeroes of functions are examples of PTA. Structural translation ability
involves the relating of meanings and functional properties across symbol systems.
Numerically understanding why f(x)=1/(x-1) has a vertical asymptote at x=1, how the
numeric value of the slope relates to its graph, and why the graphs of f(x) and f(x+3) are
similar illustrate examples of STA. The fact that the case study participants predominantly used
point checking strategies on all but the EG pairings indicates limited STA, as properties had to
be translated one point at a time. In other words, general properties had to be viewed on a very
local level (point-wise) in one representation, translated, then generalized in this other
representation in order for the meaning to be sent across the symbol systems (if meaning was
sent across at all). These data also provide further support of the positive effect of the graphic
representation on STA, as well as on the general understanding of function.
The manner in which the students defined function was somewhat inconsistent with the
manner in which it was discussed, both in terms of representation and emphasis on relational
properties. The students were able to define function in a structural manner, but informal
discussions revealed that these conceptions developed to a more limited degree. Whereas
evidence regarding property-oriented conceptions came strictly from an analysis of problem
solving tasks, evidence on a relational view of function came mainly from analysis of the
students' written definitions and discussions of function. These multiple data sources allowed
for a broader view of the total concept image, and future studies of students' conceptions of
function would benefit from this type of analysis (see Figure 7)
Effect of the GC on Learning
Student responses to the GC Questionnaire and written tests provided strong evidence that
the students relied on the GC in numerous problem solving situations. These tendencies had

Function as a Relation Between Sets
ProcessConception
DependenceCausationUnivalenceSet-based Relations
Translation acrossRepresentations
STAAwareness of
Properties
Property-Oriented View
Function as an ObjectPossessing Various Properties
Objectificationof Function
Figure 7. Students' Total Concept Image of Function.
34
36

their greatest increase on tasks which implicitly called for graphical analysis. An analysis of
the problem solving strategies on the written tests provided evidence that students' uses of the
GC allowed them to approach tasks with a wealth of available procedures. The ability to relate
functions and functional properties in different representations provided evidence that a View 2.
structural conception was forming. Hence, evidence was found to indicate the following effects
of the GC on student learning:
1 ) The GC facilitated multi-representational problem solving strategies.2 ) The graphic images of the GC were a factor in strengthening the students' structural views offunction.3 ) The students increased their use of the GC the most over the course of the year on taskswhich implicitly called for graphical analysis.
However, the following misconception was also found in the case study participants, and wasprobably due to the use of the GC:
1) The students' concept image of the graph of a function involved continuous functions withinfinite domains, and which could be represented by a symbolic expression of the form y = f(x).
Very few examples of non-elementary functions were used as examples throughout the
course. Hence, the students almost exclusively thought about the properties of polynomial and
exponential functions since they were the only ones to which they were exposed. This presents
educators with a dilemma in regard to the use of the graphing calculator, as well as some other
types of graphing software. On one hand, we would like students to be able to generate their own
views of function, their own examples of function, and to discuss the variety of functions which
occur in everyday life. Many of these examples, however, are not readily produced using the
GC, and some do not even have approximations which would readily be produced. The price of a
postage stamp, the velocity of a plane during a flight, the water level of a draining sink, and the
temperature inside a refrigerator are all examples of functions which would be quite difficult to
produce using a GC. Graphing software, especially the GC, can be very restraining on the
amount of student investigation it allows with regard to a variety of function exemplars.
35
3 7

Therefore, even though data previously presented showed that the GC can be a boon to the
students' property-oriented development (both on a local and global basis), it also may restrict
the students' View 2 conception in regard to the range of properties a function is allowed to take
on. The case study participants refusal to accept as functions those equations which could not be
"solved for y", as well as those graphs which were discontinuous or had unusually restricted
domains, provides support for this claim
Overall, it appears that the GC positively influenced the learning outcomes of the
classroom in this study. Additional long-term studies which investigate the effects of graphing
software (including the GC) on instruction and learning are greatly needed. These studies should
focus on all aspects of the students' concept image, including computational/relational
distinctions as well as the formation of procedural networks across function classes and
representations.
36
38

Table 1Procedural and Relational Distinctions in Students' Definitions of Function throughout the Year
Pretest 1
(n = 16)Posttest 1(n = 17)
Pretest 2(n = 33)
Posttest 2(n = 30)
Pretest 3(n = 33)
Posttest 3(n = 34)
Procedural 1 2 1 5 8 1 0 1 1 6References
Relational 3 1 2 2 3 1 7 2 0 2 8References
Neither 1 0 2 3 2 0
Table 2Procedural and Relational Distinctions in Students' Discussions of Function throughout the Year
Pretest 1
(n = 16)Posttest 1
(n = 17)Pretest 2(n = 35)
Posttest 2(n = 28)
Pretest 3(n = 36)
Posttest 3(n = 34)
Procedural 12 10 20 18 19 20References
Relational 3 7 9 7 1 3 1 2
References
Neither 1 0 6 3 4 2
Table 3Function Questionnaire Item on Procedural (computation) versus Relational (correspondence)Aspects of Function
October May(n = 16) (n = 34)
A function is a computational process which when givenone value of a variable (normally x) produces one valueof another variable (normally y).
A function is a correspondence between values of oneset and values of another set.
94% (15) 85% (29)
6% (1) 15% (5)

Table 4GC Questionnaire Items on Students' Use of the Graphing Calculator
October May(n = 17) (n = 34)
I prefer to use the graphing features of thecalculator for problems which ask me to graph afunction.
I prefer to graph by hand problems which ask me tograph a function.
prefer to use the graphing features of thecalculator for problems which ask me to analyze afunction.
I prefer to solve by hand problems which ask me toanalyze a function.
I prefer to use the graphing features cf thecalculator for most problems which do notexplicitly ask me to create a graph or analyze agraph, but where a graph may help.
I prefer to solve by hand most problems which donot explicitly ask me to create a graph or analyze agraph, but where a graph may help.
I use the graphing features of the calculator whenworking many of my homework problems.
I use the graphing features of the calculator whenworking very few of my homework problems.
I solve many problems with the graphing calculatorwhich I could not solve otherwise.
I solve very few problems with the graphingcalculator which I could not solve otherwise.
87% (14) 91% (31)
13% (2) 9% (3)
76% (13) 71% (24)
24% (4) 29% (10)
59% (10) 85% (29)
41% (7) 15% (5)
82% (14) 82% (28)
18% (3) 18% (6)
47% (8) 71% (24)
53% (9) 29% (10)
40

Table 5Percentage of Student Use of the Graphing Calculator on Written Test items of Ul#2
Yes = Yes, I used the graphing features of the graphing calculator in the solution of this problem.
No = No, I did not use the graphing features of the graphing calculator in the solution of this problem.
Pretest(n = 35)
Yes No
Posttest(n = 36)
Yes No
Graph f(x) = x5 81x 97% 3% 100% 0%
Graph f(x) = -x5 + 12x4 + 10x3 - 120x2 - 9x + 108 87% 13% 100% 0%
Find the zeroes of f(x)=x3-7x-6 79% 21% 97% 3%
Find the zeroes of f(x) = x2 8x - 20 37% 63% 63% 37%
Find all values of x such that 14% 86% 25% 75%5x2 + 9x - 3 > 4x + 5)(2
Factor f(x) = x3 + 3x2 - 4x - 12 32% 68% 41% 59%
Table 6Percentage of Student Correctness on Written Test items of Ul#2
Pretest(n = 35)
Correct Incorrect
Posttest(n = 36)
Correct Incorrect
Find the zeroes of f(x)=x3-7x-6 83% 17% 88% 12%
Find the zeroes of f(x) = x2 8x 20 89% 11% 94% 16%
Find all values of x such that 77% 23% 78% 22%5x2 + 9x - 3 > 4x + 5x2
Factor f(x) = x3 + 3x2 - 4x - 12 48% 52% 56% 44%
4i

Table 7Student Responses on Graph Construction Itemson Written Tests of UI #2
f(x) = -x5 + 12x4 + 10x3 - 120x2 - 9x + 108
Blank
42
Pretest(n = 35)
Posttest(n = 31)
4 7
19 20
3 3
2 1
3 0
4

Table 7 (cont.)Student Responses on Graph Construction Items on Written Tests of Ul#2.
f(x) = x5 -81x Pretest(n = 35)
Posttest(n = 31)
20 28
5 3
5 0
Other 4 0
Blank 1
4 3

Table 8Percentage of Student Use of the Graphing Calculator on Written Test items of Ul#3
Yes = Yes, I used the graphing features of the graphing calculator in the solution of this problem.
No = No, I did not use the graphing features of the graphing calculator in the solution of this problem.
Find the x-intercepts of f(x) = 2X 4.
Graph f(x) = 2.10x
The graph to the right represents the population P(x)of a U. S. city. where x is the number of years after1990 (for example, x=3 corresponds to the year1993). According to this graph, the city'spopulation was 15,000 in 1990. In what year do youexpect the population to reach 30,000?
Pretest(n = 35)
Yes No
Posttest(n = 36)
Yes No
76% 24% 71% 29%
97% 3% 91% 9%
6% 94% 9% 91%
$5000 is invested in a bank at 5% interest 42% 58% 44% 56%compounded continuously. The amount of money A(t)after t years is given by the formula A(t) =5000e.05t. How many years will it take for theinvestment to double?
Harry's Hamburger Stand had 40 customers during 56% 44% 44% 56%its first week of operation. The deliciousness ofHarry's hamburgers spread across town, and thenumber of customers during the first five weeks ofoperation are given in the table to the right. Usingthis information, how many customers do you expectHarry to have during the sixth week? Explain yourreasoning.

Table 9Identified Translation Strategies used by Keith During Each Unit Investigation
Interview Strategy ET GT
Pretask #1LocalGlobal
Combination3
Posttask #1Local 6 2Global 1 1 4Combination
Pretask #2Local 5
Global5Combination
Posttask #2Local 3
1Global4Combination
Pretask #3Local 2 2Global
1 3Combination1
Posttask #3Local 5 1
Global1Combination 1
1 1

'4
REFERENCES
Briedenbach, D.E., Dubinsky, E., Hawks, J., & Nichols, D. (1992). Development of the processconception of function. Educational Studies in Mathematics, 23, 247-285.
Brown, C.A., Carpenter, T.P., Kouba, V.L., Lindquist, M.M., & Reys, R.E. (1988). Secondaryschool results for the fourth NAEP mathematics assessment: Algebra, geometry, mathematicalmethods, and attitudes. Mathematics Teacher, 81, 337-347.
Case, R. (1982). The search for horizontal structure in children's development. GeneticEpistemologist, 11, 1-2.
Confrey, Jere (1991). Function Probe [Software]. Ithaca, NY: Department of Education,Cornell University.
Davis, Robert B. (1984). Learning Mathematics: The Cognitive Science Approach toMathematics Education. London: Routledge.
Davis, Robert B. (1992). Understanding "Understanding". Journal of Mathematical Behavior,11(3), 225-242.
Dubinsky, Ed & Harel, Guershon (1992). The nature of the process conception of function. In
G. Harel & E. Dubinsky (Eds.) The Concept of Function: Aspects of Epistemology and Pedagogy.Washington, DC: Mathematical Association of America.
Estes, Karen (1990). Graphics technologies as instructional tools in applied calculus: Impacton instructor, students, and conceptual and procedural achievement. Dissertation AbstractsInternational, 51, 1147A.
Giamati, Claudia (1990). The effect of graphing calculator use on students' understanding ofvariations on a family of equations and the transformations of their graphs. DissertationAbstracts International, 52, 103A.
Goldenberg, E.P. (1988). Mathematics, metaphors, and human factors: Mathematical,technical, and pedagogical challenges in the educational use of graphic representations offunction. Journal of Mathematical Behavior, 7, 135-173.
Goldenberg, E. Paul (1991). The difference between graphing software and educationalgraphing software. In Zimmerman & Cunningham (Eds.), Visualization in Teaching andLearning Mathematics. Washington, DC: Mathematical Association of America.
Halford, G.S. (1982). The Development of Thought. Hillsdale, NJ: Erlbaum.
Hiebert, James & Carpenter, Thomas P. (1992). Learning and teaching with understanding. In
D. Grouws (Ed.), Handbook of Research on Mathematics Teaching and Learning (65-97). NewYork: Macmillan Publishing Co.

Janvier, Claude (1987). Translation processes in mathematics education. In C. Janvier (Ed.),Problems of Representation in the Teaching and Learning of Mathematics (27-32). Hillsdale,NJ: Lawrence Erlbaum Associates, Inc.
Kaput, James J. (1989). Linking representations in the symbol system of algebra. In C.Kieran & S. Wagner (Eds.), A Research Agenda for the Learning and Teaching of Algebra. Reston,VA: The Council.
Kaput, James J. (1992). Patterns in student construction of algebraic patterns in numericaldata. In G. Harel & E. Dubinsky (Eds.) The Concept of Function: Aspects of Epistemology andPedagogy. Washington, DC: Mathematical Association of America.
Kieran, Carolyn (1992). The learning and teaching of school algebra. In D. Grouws (Ed.),Handbook of Research on Mathematics Teaching and Learning (390-419). New York:Macmillan Publishing Co.
Leinhardt, Gaea, Zaslaysky, Orit, & Stein, Mary Kay (1990). Functions, graphs, and graphing:Tasks, learning and teaching. Review of Educational Research, 60(1), 1-64.
Mokros, Janice R., & Tinker, Robert F. (1987). The impact of microcomputer-based labs onchildren's ability to interpret graphs. Journal of Research in Science Teaching, 24(4), 369-383 .
Moschkovich, J., Schoenfeld, A. H., & Arcavi, A. (1993). Aspects of understanding: On multipleperspectives and representations of linear relations and connections among them. In T. A.Romberg, T. P. Carpenter, & E. Fennema (Eds.) Integrating Research on the GraphicalRepresentation of Functions. Hillsdale, NJ: Erlbaum, pp 69-100.
National Council of Teachers of Mathematics (1989). Curriculum and Evaluation Standards forSchool Mathematics. Reston, VA: The Council.
Piaget, J., Grize, J., Szeminska, A, & Bang, V. (1977). Epistemology and Psychology ofFunctions. Boston: Reidel.
Rich, Beverly (1990). The effect of the use of graphing calculators on the learning of functionconcepts in precalculus mathematics. Dissertation Abstracts International, 52, 835A.
Romberg, T.A., Carpenter, T.P., & Fennema, E. (Eds., 1993). Integrating Research on theGraphical Representation of Functions. Hillsdale, NJ: Erlbaum.
Ruthven, Kenneth (1990). The influence of graphic calculator use on translation from graphicto symbolic forms. Educational Studies in Mathematics, 21(5), 431-450.
Schwartz, Judah, Yerushalmy, Michal, & Harvey, W. (1991). The Algebra Toolkit [Software].Pleasantville, NY: Sunburst Communications, Inc.
Schwartz, Judah & Yerushalmy, Michal (1992). Getting students to function in and withalgebra. In G. Harel & E. Dubinsky (Eds.), The Concept of Function: Aspects of Epistemology andPedagogy. Washington, DC: Mathematical Association of America.

k
v
Sfard, Anna (1989). Transition from operational to structural conception: The notion offunction revisited. In G. Vergnaud, J. Rogalski, & M. Artigue (Eds.), Proceedings of theThirteenth International Conference for the Psychology of Mathematics Education (Vol. III, pp.162-169). Montreal, Canada: University of Montreal.
Sfard, Anna (1991). On the dual nature of mathematical conceptions: Reflections on processesand objects as different sides of the same coin. Educational Studies in Mathematics, 22, 1-36.
Sfard, Anna (1992). Operational origins of mathematical objects and the quandary ofreification - The case of function. In G. Harel & E. Dubinsky (Eds.) The Concept of Function:Aspects of Epistemology and Pedagogy. Washington, DC: Mathematical Association of America.
Slavit, David (February, 1993). Structural Understanding via Instruction Integrated with theGraphing Calculator: The Case of Function. Paper presented at the annual meeting of the EasternEducational Research Association, Clearwater, Fla.
Teles, E. J. (1989). Numerical and graphical presentation of functions in precalculus.Dissertation Abstracts International, 51, 777A.
Vinner, S.. (1983). Concept definition, concept image and the notion of function. InternationalJournal of Mathematics Education in Science and Technology, 14(3), 293-305.