Embed Size (px)
Citation preview
DOCUMENT RESUME
ED 390 866 SP 036 430
AUTHOR Snyder, John F.; And Otherr;TITLE Teacher Supply and Demand, A 1995 MAASCUS Research
Report.INSTITUTION Association for School, College, and University
Staffing, Madison, Wis.PUB DATE 95
NOTE 34p.
PUB TYPE Reports Research/Technical (143)
EDRS PRICE MFOI/PCO2 Plus Postage.DESCRIPTORS *Career Choice; Elementary Secondary Education;
Higher Education; *Labor Market; *Minority GroupTeachers; *Teacher Certification; *TeacherEmployment; *Teacher Supply and Demand
IDENTIFIERS Career Alternatives; United States (Mid AtlanticStates)
ABSTRACTThis publication examines the perceptions of school
administrators in the Mid-Atlantic Association for School, Collegeand University Staffing (MAASCUS) region, which includes Delaware,the District of Columbia, Maryland, New Jersey, New York,Pennsylvania, Virginia, and West Virginia. The report begins with anextensive literature review examining issues of teacher supply anddemand. Certain certification areas have experienced a surplus ofteachers, while others have experienced a shortage; some positionsmay require multiple certifications; needs also vary by geographicarea. The paper explores the complexities and demands of teaching,the number of teachers needed, and student and teacher demographics.A total of 2,100 districts were sent surveys, with 380 responding.Data tables highlight teacher supply and demand by teaching fieldwithin each of the eight states in the study, categorizing teachingfields by curplus and shortage. Further analysis focusses onavailability of employment opportunities; minority candidateavailability; factors impacting 1995-96 employer needs, includingfunding, retirements, legislative mandates, demographics, studentenrollment, private or home schooling, class size, and militarymobilization; and sources of new hires. The report concludes thatemployment opportunities for teachers are influenced by certificationarea(s), geographic flexibility, school enrollment and diversity, andpersonal skills and abilities. Some of the most popular certificationareas--elementary education, English, social studies, and health andphysical education--have a significant surplus of teachers in theMAASCUS area that is likely to continue for the next several years.The market for minority teacher candidates, however, should befavorable since the supply of minority candidates is not increasingwhile the student population is becoming more diverse. (Contains 24references.) (ND)
Reproductions supplied by EDRS are the best that can be madefrom the original d cument. *
MAASCUSWho-Atlantic Association
forSchool, College and University Staffing
Teacher Supply and Demand,A 1995 MAASCUS Research Report
November 1995
BEST COPY AVAILABLE
This report was made possible by grants from MAASCUS and ASCUS.
US pic:PAI,41.MI,N Of-. EIi1JCA1 ION
IDllAPPNA1 ...0t1111,14 '4)151( )I4IN1wit4(.1 44 IL 14 .1111( 1
U liii 4),) )11114 tII Ii, I 1111111/11. 10 .Iovelved horn 111/1.1,1)/ 0,1.1
,111/10).)1.tm )1
h.1%, 1,0,11,01 i.),/),011not-11, :11,1) fp
nip., I)..). )), ,.1.01-1 11),.)1) pli tI) (1.) 1)1
014 1.11 /11 gi/ t), 1,11
PERMISSION TO REPRODUCE I HI!,MATE RIAL HAS BEEN GRANTED BY
2 vie
1HE LOLICA1 lONAL RESOURC'NEORMAT ION (ANTE R E MCI
1995 MAASCUS Research Report Committee
John F. SnyderChair
Slippery Rock University of Pennsylvania
Kathleen M. EngHarford County Public Schools, Maryland
David EvansBaltimore County Public Schools, Maryland
Helen H. CopelandFairfax County Public Schools, Virginia
Acknowledgements
For professional assistance:Andy Stoughton, Systems Analyst, User Services, Slippery Rock University
For hours of work inputting data and assisting with word processing and charts:Rebecca Boron, Julie Fennick, John Leonard, Jennifer Pauole
student workers, Slippery Rock University
For financial support:MAASCUS, Mid-Atlantic Association for School, College and University Staffing
ASCUS, Association for School, College and University Staffing
7or printing:Robert Lutz, Bonnie Montgomery, Sara Foust, Lewis Greenawalt, Lee Regotti,
Printing Services, Slippery Rock University
Copyright 0 1995, Mid-Atlantic Association for School, College and University Staffing
Permission is granted to reproduce this report provided that any reproduction includes thecopyright credit line.
Another report which may be of interest is Perceptions of Preservice Teachers: The Job Market, WhyTeaching, and Alternatives to Teaching. This report is available, while supplies last, by sending a9x12" self-addressed envelope with $3.00 of postage attached to John F. Snyder, Office of CareerServices, Slippery Rock University, Slippery Rock, PA 16057. Be sure to indicate what report you arerequesting. For ordering information about the annual ASCUS Teacher Supply and Demand in theUnited States report and other publications, contact ASCUS at 820 Davis Street, Suite 222, Evanston,IL 60201-4445. MAASCUS and ASCUS are not-for-profit associations serving career services officialsand school personnel administrators.
TEACHER SUPPLY AND DEMAND, A 1995 MAASCUS RESEARCH REPORT
The issue of teacher supply and demand is a complex one that goes beyond simply comparingthe number of yearly vacancies to the number of newly prepared teachers. Teachers earn a certificateto teach in specific subject areas; all teachers are not allowed to teach all subjects. Thus supp!y anddemand calculations must consider the certification area(s) in which teacher candidates are prepared.The Association for School, College and University Staffing (ASCUS) has tracked the supply anddemand of educators according to teaching fields for several years based on the perceptions of collegeand university career services professionals.
Certain certification areas have experienced a surplus of teachers while others have experienceda shortage of teachers. Social Studies, Physical Education, Health Education, and ElementaryEducation are areas in which there are more teacher candidates than positions; Speech Pathology,Bilingual Education, and Special Education are areas that have a shortage of teacher candidates(ASCUS,1995). A recent Maryland study of supply and demand shows a need for teachers in
Computer Science; English for Speakers of Other Languages; Mathematics; Science areas of Chemistry,General Science and Physical Science; Spanish; Special Education areas of Generic Special Educationinfant-grade 3, Generic Special Education grades 6-12, Severely and Profoundly Handicapped;Technology Education; and Speech Pathology (Mary lano State Department of Education, 1994).
Since a school district vacancy may require teaching two or more subjects, an administratormay seek an individual who is certified to teach in two or more areas (ASCUS, 1995). The educationmajor earning two or more certifications, however, typically has to invest additional time and moneyin preservice training. The education major, therefore, may not be able to afford the extra collegecredits necessary to earn multiple certifications.
Another factor in teacher supply and demand is geographic location. Just as some certificationareas have a need for teachers, some geographic areas have grown in population while other areashave lost population. Generally, areas of increasing population experience a growth in schoolenrollment creating a need for more teachers. On the other hand, school districts experiencingdecreased enrollment, may not replace teachers who leave (ASCUS, 1995) or may lay-off teachers.Even a need for teachers, however, does not mean that school districts will hire additional teachers.If budgets do not allow hiring, schools may increase class size or the number of periods taught, himsubstitute or part-time teachers, or reassign staff (Choy, 1993).
This Mid-Atlantic Association for School, College and University Staffing (MAASCUS) TeacherSuoply and Demand Report examines the perceptions of school administrators in the MAASCUS region,which includes Delaware, the District of Columbia, Maryland, New Jersey, New York, Pennsylvania,Virginia, and West Virginia.
THE PROFESSION OF TEACHING
In additional to teaching, schools provide a wide range of community programs from healthclinics to food service to adult education. Teachers also are expected to be competent in a wide rangeof areas. The American Association of School Personnel Administrators (AASPA), acknowledging thatsociety and the student population have become more complex and diverse, assigned a committee toexamine the skills and knowledge teachers should possess to be effective educators. As a result ofthis examination, AASPA identifies 9 most critical knowledge areas, 11 most critical skills, and 66 mostcritical evidences of those knowledge areas and skills needed by a desired educator employee in thenext five to 10 years (AASPA, 1995). See Table 1 on the next page.
The AASPA statements illustrate the complexities and demands of teaching. Choy (1993)examines data from 1987-88 and finds that 28% of newly qualified teachers do not even apply forteaching jobs. Twenty-one percent (21%) of these teachers want to obtain more education beforeapplying for a teaching position and 5% feel they were not yet ready for a job. Other reasons fo. notentering the job market include: 21% have no interest in teaching; 6% are discouraged by their studentteaching experiences; 7% are offered jobs with larger salaries or more prestige; 6% do not like their
z&s.324net 1.18.14n,.,....friatmayamea
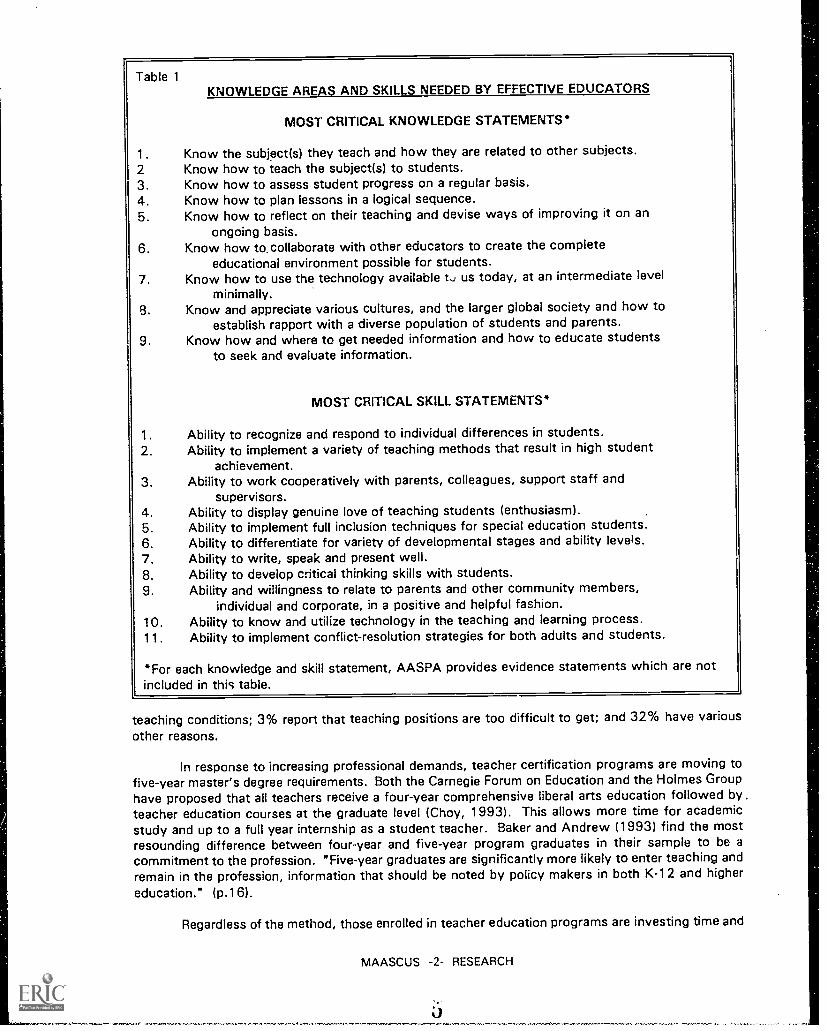
Table 1KNOWLEDGE AREAS AND SKILLS NEEDED BY EFFECTIVE EDUCATORS
MOST CRITICAL KNOWLEDGE STATEMENTS
1. Know the subject(s) they teach and how they are related to other subjects.2 Know how to teach the subject(s) to students.3. Know how to assess student progress on a regular basis.4. Know how to plan lessons in a logical sequence.
Know how to reflect on their teaching and devise ways of improving it on anongoing basis.
Know how to. collaborate with other educators to create the completeeducational environment possible for students.
Know how to use the technology available t.J us today, at an intermediate level
minimally.Know and appreciate various cultures, and the larger global society and how to
establish rapport with a diverse population of students and parents.Know how and where to get needed information and how to educate students
to seek and evaluate information.
MOST CRITICAL SKILL STATEMENTS*
Ability to recognize and respond to individual differences in students.Ability to implement a variety of teaching methods that result in high student
achievement.Ability to work cooperatively with parents, colleagues, support staff and
supervisors.4. Ability to display genuine love of teaching students (enthusiasm).5. Ability to implement full inclusion techniques for special education students.6. Ability to differentiate for variety of developmental stages and ability levels.7. Ability to write, speak and present well.8. Ability to develop critical thinking skills with students.9. Ability and willingness to relate to parents and other community members,
individual and corporate, in a positive and helpful fashion.10. Ability to know and utilize technology in the teaching and learning process.11. Ability to implement conflict-resolution strategies for both adults and students.
*For each knowledge and skill statement, AASPA provides evidence statements which are notincluded in this table.
teaching conditions; 3% report that teaching positions are too difficult to get; and 32% have various
other reasons.
In response to increasing professional demands, teacher certification programs are moving tofive-year master's degree requirements. Both the Carnegie Forum on Education and the Holmes Group
have proposed that all teachers receive a four-year comprehensive liberal arts education followed byteacher education courses at the graduate level (Choy, 1993). This allows more time for academicstudy and up to a full year internship as a student teacher. Baker and Andrew (1993) find the mostresounding difference between four-year and five-year program graduates in their sample to be acommitment to the profession. "Five-year graduates are significantly more likely to enter teaching andremain in the profession, information that should be noted by policy makers in both K-12 and higher
education." (p.16).
Regardless of the method, those enrolled in teacher education programs are investing time and
MAASCUS -2- RESEARCH
money preparing for a complex and demanding profession, and they want a teaching job as a resultof their efforts (Zimpher, 1989; Herbster, et al, 1991).
NUMBER OF TEACHERS NEEDED
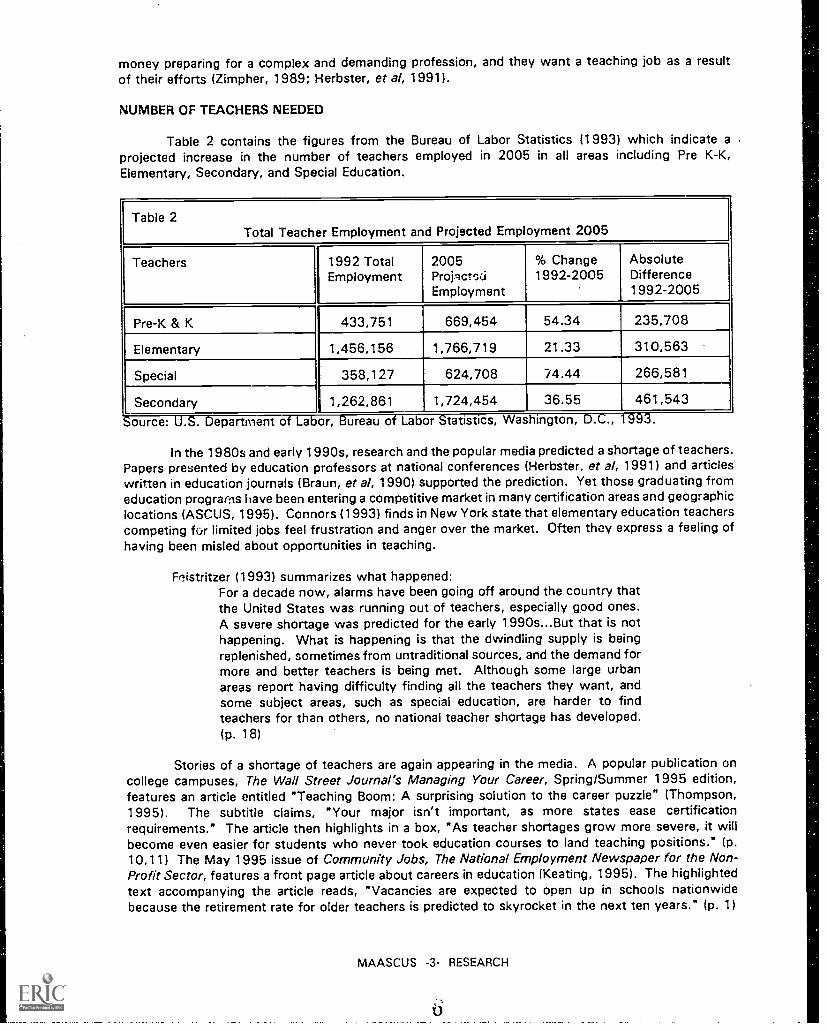
Table 2 contains the figures from the Bureau of Labor Statistics (1993) which indicate a .
projected increase in the number of teachers employed in 2005 in all areas including Pre K-K,Elementary, Secondary, and Special Education.
Table 2Total Teacher Employment and Projected Emp oyment 2005
Teachers 1992 TotalEmployment
2005ProjactsjEmployment
% Change1992-2005
AbsoluteDifference1992-2005
Pre-K & K 433,751 669,454 54.34 235,708
Elementary 1,456,156 1,766,719 21.33 310,563
Special 358,127 624,708 74.44 266,581
Secondary 1,262,861 1,724,454 36.55 461,543
ource: U.S. Department o Labor, Bureau of Labor Statistics, Washington, D.C., 1 993.
In the 1980s and early 1990s, research and the popular media predicted a shortage of teachers.Papers presented qy education professors at national conferences (Herbster, et a/, 1991) and articleswritten in education journals (Braun, et al, 1990) supported the prediction. Yet those graduating fromeducation programs have been entering a competitive market in many certification areas and geographiclocations (ASCUS, 1995). Connors (1993) finds in New York state that elementary education teacherscompeting for limited jobs feel frustration and anger over the market. Often they express a feeling ofhaving been misled about opportunities in teaching.
Feistritzer (1993) summarizes what happened:For a decade now, alarms have been going off around the country thatthe United States was running out of teachers, especially good ones.A severe shortage was predicted for the early 1990s...But that is nothappening. What is happening is that the dwindling supply is beingreplenished, sometimes from untraditional sources, and the demand formore and better teachers is being met. Although some large urbanareas report having difficulty finding all the teachers they want, andsome subject areas, such as special education, are harder to findteachers for than others, no national teacher shortage has developed.(p. 18)
Stories of a shortage of teachers are again appearing in the media. A popular publication oncollege campuses, The Wall Street Journal's Managing Your Career, Spring/Summer 1995 edition,features an article entitled "Teaching Boom: A surprising solution to the career puzzle" (Thompson,1995). The subtitle claims, "Your major isn't important, as more states ease certificationrequirements." The article then highlights in a box, "As teacher shortages grow more severe, it willbecome even easier for students who never took education courses to land teaching positions." (p.10,11) The May 1995 issue of Community Jobs, The National Employment Newspaper for the Non-Profit Sector, features a front page article about careers in education (Keating, 1995). The highlightedtext accompanying the article reads, "Vacancies are expected to open up in schools nationwidebecause the retirement rate for older teachers is predicted to skyrocket in the next ten years." (p. 1)
MAASCUS -3- RESEARCH
The numbers indicating a need for more teachers can be misleading, however, because newhires do not necessarily mean they are newly certified teachers (Choy, 1993; Feistritzer, 1993).Feistritzer points out that previous projections of a shortage of teachers were based on an unspokenassumption that "new teacher" meant "new teacher graduate." However, NCES data show thatbetween 1988 and 1991, both public and private schools hired proportionally more first-time teachersand proportionally fewer reentrants. (NCES, 1995).
Still, several studies indicate that the reserve pool of teachers, which includes those substituteteaching, those certified but not teaching, and those returning to teaching after an absence, willprovide a significant supply for most anticipated future needs (Arnold & Bobbitt, 1993; OregonDepartment of Education, 1992: New York State Department of Education, 1992; Babbitt, et al, 1994).
The reserve pool may continue to replenish many needs since 14.7% of public school teacherswho left the profession in 1 990-1 992 (Bobbitt, et al, 1994) and 18% who left in 1 987-1 989 plan toreturn to teaching (Choy, 1993). Data from NCES and the National Center for Education Informationshow that about one-third of new teachers are actually former teachers coming back into theprofession (Feistritzer, 1993). Transfers from one school to another account for 54.1% of new hires.The 1 987 NCES's Schools and Staffing Surveys show that new teacher graduates actually constituteonly about 10.5% of new hires (Choy, 1993). Of teachers transferring from one school to another,47.2% of private school transfers move to public schools providing another source of teachers farpublic schools. Only 5.7% of public school teacher transfers move to private schools (Bobbitt, et al,
1994).
Caution must be used in estimating the reserve pool since not all individuals who are certifiedwant to teach (Choy, 1993). Studies in New York (New York State Department of Education, 1992),Pennsylvania (Strauss, 1993), Indiana (Grissmer & Kirby, 1991), and Oregon (Oregon Department ofEducation, 1992), however, conclude that reserve pools in these states should cover any projectedshortages. Strauss (1993) writes about Pennsylvania, "By the close of the decade, Pennsylvania'spublic school districts may turn over between 48% to 80% of their current inventory of teachers ...While there is likely to be significant more hiring done in the remainder of this decade, when onecompares these projections of teacher demand to the likely sources of teacher supply -- newly trainedteachers and the inven'ory of certificated individuals who are not teaching -- it is difficult to concludethere will be teacher sl'ortages in the sense that districts will be unable to find certificated teachers."(p. 93) He also writes, onwev( r, "Given the generally aging of the teacher force in the 1980's and theprojected enrollment growth in the balance of the decade, it is not clear whether or not the historicalrelationships of excess supply found in the 1980's will continue into the 1990's." (p. 67)
STUDENT AND TEACHER DEMOGRAPHICS
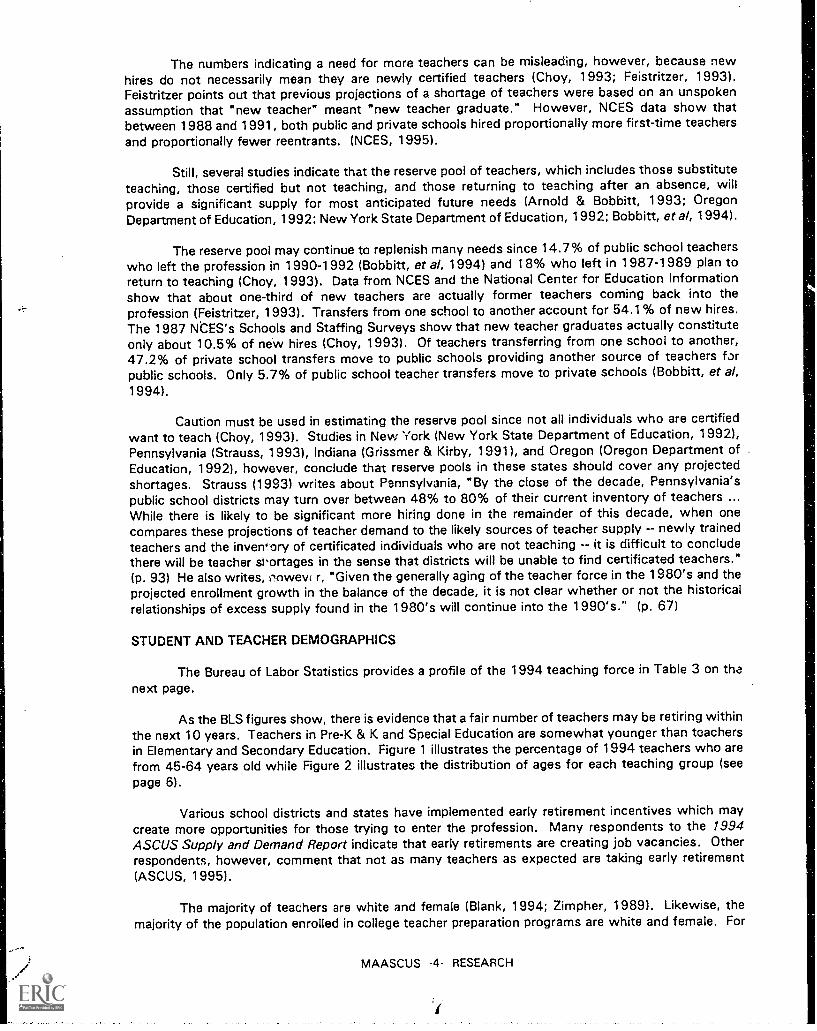
The Bureau of Labor Statistics provides a profile of the 1994 teaching force in Table 3 on thanext page.
As the BLS figures show, there is evidence that a fair number of teachers may be retiring withinthe next 10 years. Teachers in Pre-K & K and Special Education are somewhat younger than teachersin Elementary and Secondary Education. Figure 1 illustrates the percentage of 1994 teachers who arefrom 45-64 years old while Figure 2 illustrates the distribution of ages for each teaching group (seepage 6).
Various school districts and states have implemented early retirement incentives which maycreate more opportunities for those trying to enter the profession. Many respondents to the 1.994ASCUS Supply and Demand Report indicate that early retirements are creating job vacancies. Otherrespondents, however, comment that not as many teachers as expected are taking early retirement(ASCUS, 1996).
The majority of teachers are white and female (Blank, 1994; Zimpher, 1989). Likewise, themajority of the population enrolled in college teacher preparation programs are white and female. For
MAASCUS -4- RESEARCH
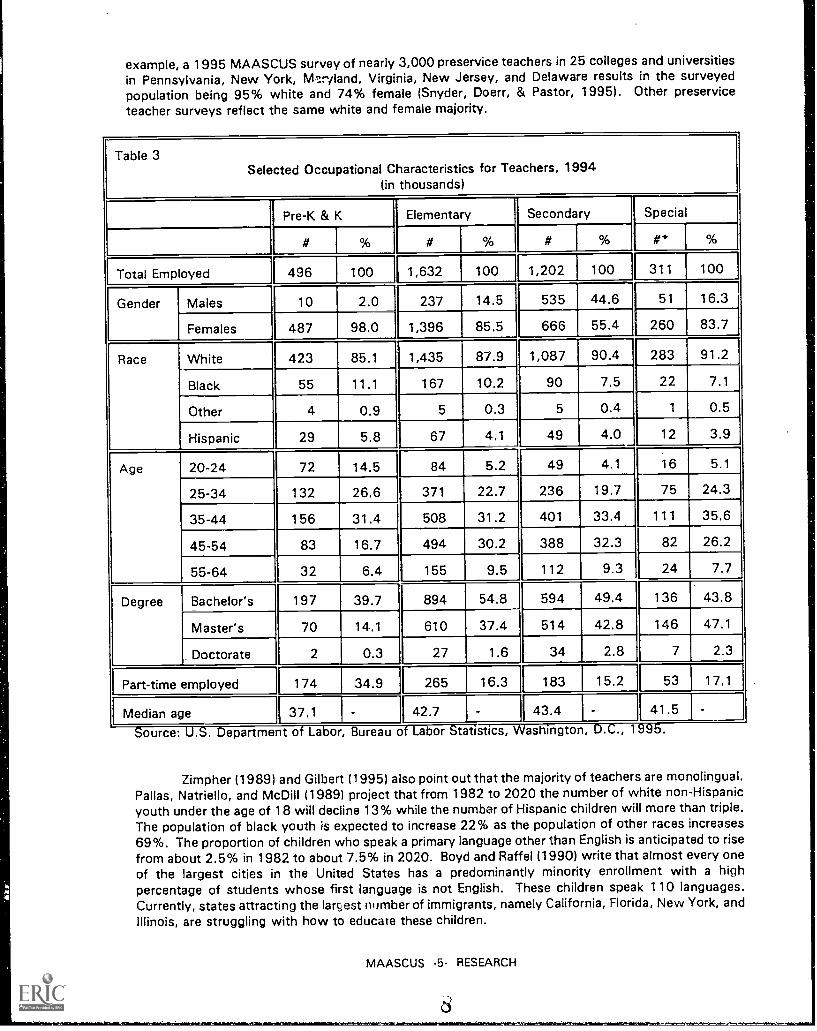
example, a 1995 MAASCUS survey of nearly 3,000 preservice teachers in 25 colleges and universitiesin Pennsylvania, New York, Wry land, Virginia, New Jersey, and Delaware results in the surveyedpopulation being 95% white and 74% female (Snyder, Doerr, & Pastor, 1995). Other preserviceteacher surveys reflect the same white and female majority.
Table 3Selected Occupational Characteristics for Teachers, 1994
(in thousands)
Pre-K & K Elementary Secondary Special
# % # % # % #* %
Total Employed 496 100 1,632 100 1,202 100 311 100
Gender Males 10 2.0 237 14.5 535 44.6 51 16.3
Females 487 98.0 1,396 85.5 666 55.4 260 83.7
Race White 423 85.1 1,435 87.9 1,087 90.4 283 91.2
Black 55 11.1 167 10.2 90 7.5 22 7.1
Other 4 0.9 5 0.3 5 0.4 1 0.5
Hispanic 29 5.8 67 4.1 49 4.0 12 3.9
Age 20-24 72 14.5 84 5.2 49 4.1 16 5.1
25-34 132 26.6 371 22.7 236 19.7 75 24.3
35-44 156 31.4 508 31.2 401 33.4 111 35.6
45-54 83 16.7 494 30.2 388 32.3 82 26.2
55-64 32 6.4 155 9.5 112 9.3 24 7.7
Degree Bachelor's 197 39.7 894 54.8 594 49.4 136 43.8
Master's 70 14.1 610 37.4 514 42.8 146 47.1
Doctorate 2 0.3 27 1.6 34 2.8 7 2.3
Part-time employed 174 34.9 265 16.3 183 15.2 53 17.1
Median age 37.1 - 42.7 - I 43.4 - 41.5 -
ource: U.S. Department of Labor, Bureau of Libor Statistics, Washington, D.C., 1995.
Zimpher (1989) and Gilbert (1995) also point out that the majority of teachers are monolingual.Pallas, Natriello, and McDill (1989) project that from 1982 to 2020 the number of white non-Hispanicyouth under the age of 18 will decline 13% while the number of Hispanic children will more than triple.The population of black youth is expected to increase 22% as the population of other races increases69%. The proportion of children who speak a primary language other than English is anticipated to risefrom about 2.5% in 1982 to about 7.5% in 2020. Boyd and Raffel (1990) write that almost every oneof the largest cities in the United States has a predominantly minority enrollment with a highpercentage of students whose first language is not English. These children speak 110 languages.Currently, states attracting the larcjest number of immigrants, namely California, Florida, New York, andIllinois, are struggling with how to educate these children.
MAASCUS -5- RESEARCH
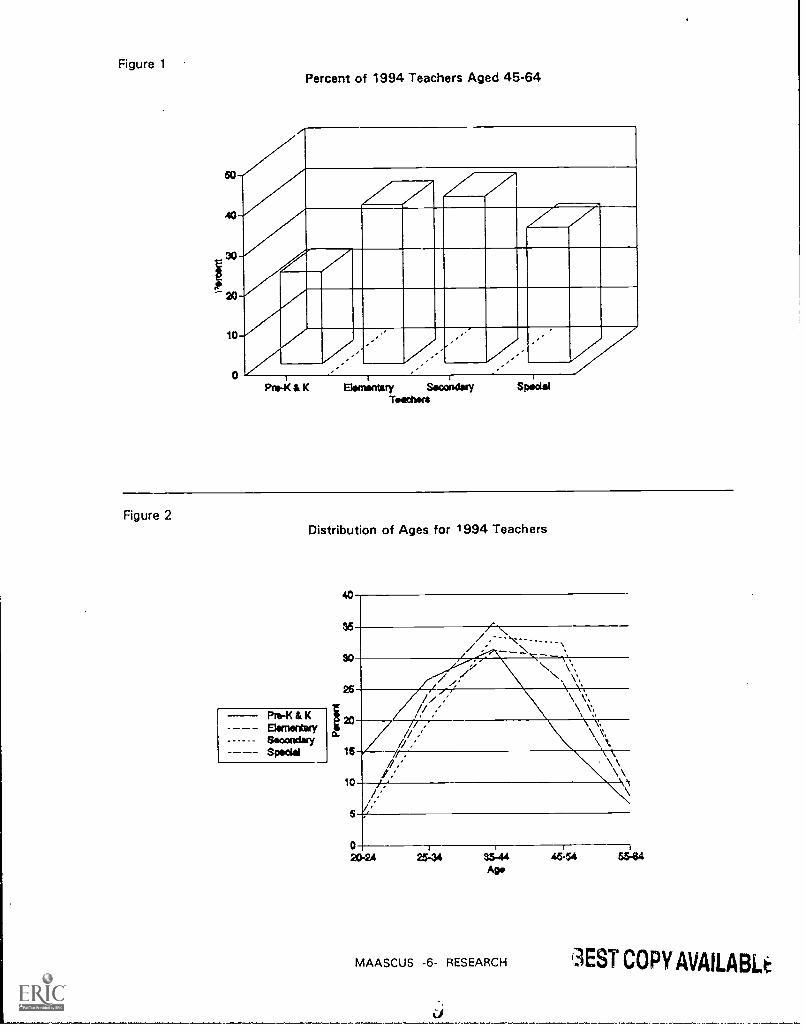
Figure '1Percent of 1994 Teachers Aged 45-64
r7z10
z
Pm-K & KTeachers
Spoli0
Figure 2Distribution of Ages for 1994 Teachers
Pm-K & K
&woodsy
,,,
96
N, V,
20,
15
10
n \ \
5 4'
,
0 1 I 1
20-2A 25-34
MAASCUS -6- RESEARCH
46-54 55-04
3EST COPY AVAILABLt
While the school enrollment is becoming more diversified, the current teachers employed andpreservice teachers enrolled in teacher education programs are not (Choy, 1993; Zimpher, 1989;ASCUS, 1995). The reserve pool also lacks a significant number of minority teachers (Arnold &Bobbitt, 1993; Oregon Department of Education, 1992). In order to balance teaching staffs in termsof race and gender, administrators often seek minorities for teaching positions. Minority teachingcandidates may be in demand even in certification areas with a surplus of teachers. For example, anadministrator may actively seek a male elementary e ,ucation teacher (Connors, 1993). The numberof minority teaching candidates entering teacher education programs has not increased despite local,
state, and national recruitment eons (Zimpher, 1989; ASCUS, 1995).
According to 1990-91 NCES data, 15,358 school districts deliver education to 41,223,804students. Only 0.1% (21 of 15,358) of all school districts in the United States enroll 11.2% of allstudents. Adding school districts that enroll 10,000 students and up results in 4.5% of all schooldistricts enrolling almost half (47.1%) of all the total students enrolled. More than half (8,260) of allschool districts enroll fewer than 1,000 students each and account for only 7.3% of the total schoolenrollment (Feistritzer, 1993). Opportunities for employment in these districts are naturally limitedsince they hire relatively few new teachers when compared to the larger districts,
Many of these larger districts are in urban areas where the student popufa tion is more diverse.Data from 1987 show that in 23 of the largest 25 cities, the majority of students come from minoritypopulations (Zimpher, 1989). Most enrolled in teacher preparation programs are from rural or suburban
backgrounds. Often these preservice teachers desire to return to rural or suburban districts asteachers, and most lack any field experiences in urban teaching (Gilbert, 1995). Data from theAmerican Association for Colleges of Teacher Education show that only 4% of preservice teacherswant to teach in inner cities (Feistritzer, 1993). Choy (1993) reports that administrators in urban areas
find it generally difficult to fill teaching vacancies.
Despite what appears to be more than enough of a supply of teachers being trained throughtraditional education programs and the reserve pool, alternative certification programs provide a means
for persons who already have at least a bachelor's degree in a field other than education to earn acertificate to teach. These alternative certification programs attract a larger number of minorities thantraditional education programs. In New Jersey, the state's use of an alternative route has been thebiggest source of minority teachers. In Texas, 43% of teachers entering the profession throughalternative programs are minority. Data show that persons going through alternative certificationprograms are much more interested in working in inner cities. For example, half of alternative-routeteachers in both Texas and New Jersey are teaching in inner cities (Feistritzer, 1993).
The review of literature illustrates the complexities of teacher supply and demand. Althoughthis review does not address all of the issues influencing supply and demand, it does provide astructure by which to keep the results of the 1995 MAASCUS survey in perspective.
MAASCUS -7- RESEARCH
0
Tab
le 4
: 199
5 M
AA
SC
US
Tea
cher
Sup
ply
and
Dem
and
by F
ield
and
Sta
teD
eman
d C
odes
: 5 =
Con
side
rabl
e sh
orta
ge o
f tea
cher
s; 4
= S
ome
shor
tage
; 3 =
Bal
ance
d; 2
= S
ome
surp
lus;
1 =
Con
side
rabl
e su
rplu
s of
teac
hers
The
ave
rage
is p
rovi
ded
as a
thre
e di
git n
umbe
r fo
llow
ed b
y th
e nu
mbe
r of
dis
tric
ts r
espo
ndin
g fo
r th
at fi
eld
in 0
.
Tea
chin
g F
ield
DE
MD
NJ
NY
PA
VA
WV
NO
ID.
Tot
al
1. A
gric
ultu
re3.
63(8
)3.
64(1
1)2.
75(8
)3.
64(2
2)3.
37(2
7)3.
79(1
9)3.
14(7
)4.
50(2
)3.
51(1
04)
2. A
rt/V
isua
l2.
43(7
)2.
67(1
5)2.
27(5
2)2.
26(9
0)2.
53(5
7)2.
90(2
9)2.
50(8
)3.
00(1
)2.
43(2
59)
3. A
udio
logy
4.00
(4)
4 25
(8)
3.39
(13)
3.46
(33)
3.35
(20)
4.06
(16)
4.50
(6)
5.00
(1)
3.68
(101
)
4. B
iling
ual E
duca
tion
3.75
(4)
3.50
(8)
3.93
(40)
3.46
(41)
3.70
(33)
3.59
(17)
4.50
(2)
4.00
(1)
3.69
(146
)
5. B
usin
ess
Edu
catio
n3.
11(9
)2.
50(1
4)2.
13(3
9)2.
46(8
7)2.
85(5
9)2.
53(3
2)2.
25(8
)3.
50(2
)2.
54(2
50)
6. C
ompu
ter
Sci
ence
/Edu
catio
n3.
75(8
)3.
23(1
3)3.
28(5
1)2.
90(8
0)3.
43(6
0)3.
32(2
8)3.
57(7
)3.
50(2
)3.
22(2
49)
7. C
ouns
elor
Edu
catio
n3.
00(9
)3.
07(1
4)2.
95(4
3)2.
63(9
0)2.
98(6
3)3.
ti3(3
3)3.
33(9
)3.
00(2
)2.
88(2
63)
8. D
ance
Edu
catio
n3.
00(1
)3.
33-,
(6)
2.82
(11)
2.29
(17)
3.00
(19)
3.00
0)3.
00(2
)3.
00(1
)2.
81(6
4)
9. D
river
Edu
catio
n3.
13(8
)2.
75(4
)2.
28(1
8)3.
09(4
4)2.
98(4
5)2.
44(2
7)'.
R6
(7)
3.00
(2)
2.79
(155
)
10. E
lem
enta
ry -
Pre
-K2.
29(7
)1.
57(1
4)1.
61(4
1)1.
24(7
1)1.
45(4
9)1.
80(3
0)2.
56(9
)1.
50(2
)1.
54(2
23)
11. E
lem
enta
ry -
Kin
derg
arte
n2.
14(7
)1.
47(1
7)1.
31.(
55)
1.17
(102
)1.
24(6
3)1.
57(3
5)1.
56(9
)1.
50(2
)1.
31(2
90)
12. E
lem
enta
ry -
Prim
ary
1.75
(8)
1.17
(18)
1.17
(60)
1.09
(113
)1.
13(6
7)1.
56(3
6)1.
38(8
)2.
00(2
)1.
20(3
12)
13. E
lem
enta
ry. -
Inte
rmed
iate
1.63
(8)
1.29
(17)
1.27
(55)
1.08
(109
)1.
20(6
6)1.
71(3
4)1.
22(9
)1.
50(2
)1.
25(3
00)
14. E
lem
enta
ry -
Mid
dle
Gra
des
2.13
(8)
1.69
(16)
1.35
(51)
1.24
(93)
1.41
(66)
2.08
(36)
1.25
(8)
3.00
(2)
1.47
(280
)
15. E
nglis
h/La
ngua
ge A
rts
2.50
(10)
1.93
(14)
1.60
(50)
1.70
(96)
1.94
(65)
2.09
(33)
1.89
(9)
3.00
(2)
1.84
(279
)
16. E
nglis
i as
a 2n
d La
ngua
go (
ES
L)3.
57(7
)3
.64
(11)
3.68
(47)
3.27
(63)
3.12
(41)
3.69
(26)
5.00
(2)
4.00
(1)
3.44
(198
)
17. G
ifted
/Tal
ente
d E
duca
tion
3.67
(9)
3.25
(8)
2.88
(48)
2.90
(72)
3.02
(61)
3.42
(26)
3.13
(8)
4.00
(1)
3.04
(233
)
18. H
ealth
Edu
catio
n1.
88(8
)2.
73(1
5)2.
04(5
2)2.
68(9
6)2.
20(5
9)2.
15(2
7)1.
75(8
)3.
00(2
)2.
35(2
67)
19. H
ome
Eco
nom
ics/
Fam
ily S
tudi
es3.
22(9
)3.
86(1
4)2.
50(4
2)2.
98(8
8)3.
07(6
0)3.
12(3
4)2.
38(8
)4.
00(1
)2.
98(2
56)
20. J
ourn
alis
m3.
14(7
)3.
13(8
)2.
44(2
5)2.
29(3
5)2.
56(4
3)2.
73(2
6)3.
14(7
)4.
50(2
)2.
61(1
53)
21. L
angu
ages
- C
lass
ics
3.50
(4)
4.00
(8)
3.13
(24)
3.18
(40)
3.58
(36)
3.37
(19)
4.00
(5)
4.00
(2)
3.40
(138
)
22. L
angu
ages
- F
renc
h3.
29(7
)3.
14(1
4)2.
69(3
5)3.
09(8
7)3.
32(5
7)3.
69(3
2)3.
50(8
)4.
00(2
)3.
19(2
42)
23. L
angu
ages
- G
erm
an3.
40(5
)3.
36(1
1)2.
93(2
8)3.
18(3
9)3.
65(4
8)3.
79(1
9)2.
75(4
)4.
00(2
)3.
37(1
56)
24. L
angu
ages
- J
apan
ese
3.00
(2)
4.00
(5)
3.79
(19)
3.97
(29)
3.91
(23)
4.18
(17)
3.00
(2)
4.00
(2)
3.91
(99)
25. L
angu
ages
- R
ussi
an3.
50(2
)3.
60(5
)3.
58(1
9)3.
72(2
5)4.
19(2
7)4.
13(1
5)3.
00(2
)4.
00(1
)3.
87(9
6)
LE S
I CO
PY
AV
AIL
AB
LE
Tea
chin
g F
ield
71D
EM
DN
JN
YP
AV
AW
VN
O ID
.T
otal
26. L
angu
ages
- S
pani
sh3.
22(9
)4.
00(1
4)2.
65(4
3)2.
94(9
6)3.
15(6
2)3.
76(3
3)3.
50(8
)4.
00(1
)3.
13(2
66)
27. L
ibra
ry S
cien
ce3.
89(9
)3.
94(1
6)3.
33(5
1)3.
43(9
3)3.
32(5
9)3.
88(3
3)2.
88(8
)4.
001,
43.
48(2
71)
28. M
athe
mat
ics
2.90
(10)
3.12
(17)
2.96
(55)
2.66
(96)
2.78
(71)
3.33
(36)
3.11
(9)
3.50
(2)
2.88
(296
)
29. M
usic
- In
stru
men
tal
3.00
(9)
3.07
(14)
2.46
(52)
2.72
(97)
2.77
(60)
3.13
(32)
2.11
(9)
3.00
(2)
2.74
(275
)
30. M
usic
- V
ocal
3.00
(9)
3.13
(15)
2.47
(51)
2.72
(95)
2.68
(60)
2.91
(33)
2.11
(3)
3.00
(2)
2.70
(274
)
31. P
hysi
cal E
duca
tion
1.44
(9)
1.82
(17)
131
(56)
1.77
(101
)1.
86(6
5).
1.77
(34)
1.44
(9)
2.00
(2)
1.77
(293
)
32. P
sych
olog
ist
3.89
(9)
4.00
(13)
3.43
(51)
3.54
(98)
3.54
(54)
3.41
(29)
3.56
(9)
4.50
(2)
3.55
(265
)
33. R
eadi
ng2.
86(7
)3.
36(1
4)2.
57(4
7)2.
51(9
6)2.
85(5
8)3.
13(3
0)2.
89(9
)4.
00(2
)2.
75(2
63)
34. S
cien
ce -
Bio
logy
3.10
(10)
3.08
(12)
3.10
(42)
2.79
(92)
2.80
(61)
3.21
(33)
2.75
(8)
3.50
(2)
2.93
(260
)
35. S
cien
ce -
Che
mis
t, i
3.70
(10)
4.14
(14)
3.66
(38)
3.07
(93)
3.67
(60)
3.66
(32)
3.63
(8)
4.50
(2)
3.48
(257
)
36. S
cien
ce -
Ear
th/P
hysi
cal
3.33
(9)
3.43
(14)
3.37
(41)
3.19
(92)
3.15
(60)
3.76
(33)
3.38
(8)
3.00
(2)
3.30
(259
)
37. S
cien
ce -
Gen
eral
3.00
(9)
2.87
(15)
3.16
(45)
2.61
(89)
2.85
(58)
3.30
(27)
3.25
(8)
3.00
(2)
2.89
(253
)
38. S
cien
ce -
Phy
sics
3.78
(9)
4.07
(14)
3.97
(36)
3.71
(89)
.3.
98(5
9)4.
18(3
3)3.
57(7
)4.
50(2
)3.
90(2
49)
39. S
ocia
l Sci
ence
s/S
tudi
es1.
11(9
)1.
33(1
5)1.
63(4
6)1.
65(9
6)1.
51(6
5)1.
74(3
5)1.
50(8
)2.
00(2
)1.
59(2
76)
40. S
ocia
l Wor
ker
(Sch
ool)
3.00
(4)
3.40
.---
-.,
(5)
2.88
(50)
2.92
(73)
2.90
(31)
3.19
(27)
2.50
(4)
4.00
(2)
2.96
(196
)
Spe
cial
Edu
catio
n 41
-47:
41. B
ehav
iora
l Dis
orde
rs4.
10(1
0)4.
41(1
7)3.
02(4
5)3.
01(7
C)
3.00
(51)
4.16
(32)
4.00
(9)
5.00
(2)
3.36
(242
)
42. H
earin
g Im
paire
d4.
57(7
)3.
73(1
1)3.
39(3
3)3.
39(6
1)3.
44(3
6)4.
21(2
9)4.
17(6
)5.
00(2
)3.
64(1
85)
43. L
earn
ing
Dis
abili
ty4.
00(1
0)4.
20(1
5)3.
14(5
1)2.
74(9
7)2.
86(5
9)3.
94(3
5)3.
11(9
)4.
50(2
)3.
14(2
78)
44. M
enta
lly H
andi
capp
ed4.
00(1
0)4.
17(1
2)3.
03(3
9)2.
88(7
6)2.
94(5
3)3.
77(3
1)3.
22(9
)4.
50(2
)3.
18(2
32)
45. M
ultip
ly H
andi
capp
ed4.
33(6
)4.
33(1
2)2.
98(4
2)3.
13(6
9)3.
07(4
3)4.
30(3
0)3.
63(8
)5.
00(1
)3.
38(2
11)
46. P
hysi
cally
Impa
ired
4.29
(7)
4.33
(12)
2.97
(33)
3.19
(62)
3.15
(40)
4.27
(26)
4.00
(8)
5.00
(2)
3.46
(190
)
47. V
isua
lly Im
paire
d4.
33(6
)4.
50(1
2)3.
13(3
0)3.
32(6
0)3.
47(3
6)4.
21(2
8)4.
33(6
)5.
00(2
)3.
62(1
80)
48. S
peec
h/D
ram
a/T
heat
er2.
50(4
)3.
63(8
)27
1(3
1)2.
51(4
1)2.
87(3
8)3.
00(2
5)3.
33(6
)3.
00(2
)2.
81(1
55)
49. S
pee
,n P
atho
logy
4.75
(8)
4.60
(15)
3.79
(48)
3.51
(85)
3.57
(46)
4.43
(35)
4.56
(9)
5.00
(2)
3.86
(248
)
50. T
echn
olog
y E
duca
tion
(Ind
. Art
s)3.
88(8
)4.
47(1
5)3.
00(4
0)3.
43(9
1)3.
83(6
0)3.
74(2
7)3.
13(8
)4.
00(2
)3.
56(2
51)
51. S
ubst
itute
Tea
cher
s4.
30(1
0)3.
00(9
)2.
59(5
9)2.
66(9
5)2.
82(6
5)3.
18(2
8)2.
88(8
)3.
00(2
)2.
82(2
76)
ot a
ll M
AA
SC
US
sta
tes
requ
re
su s
titut
e te
ache
rs to
hol
d te
achi
ng c
ertif
icat
es.
I1
4
THE MAASCUS SURVEY
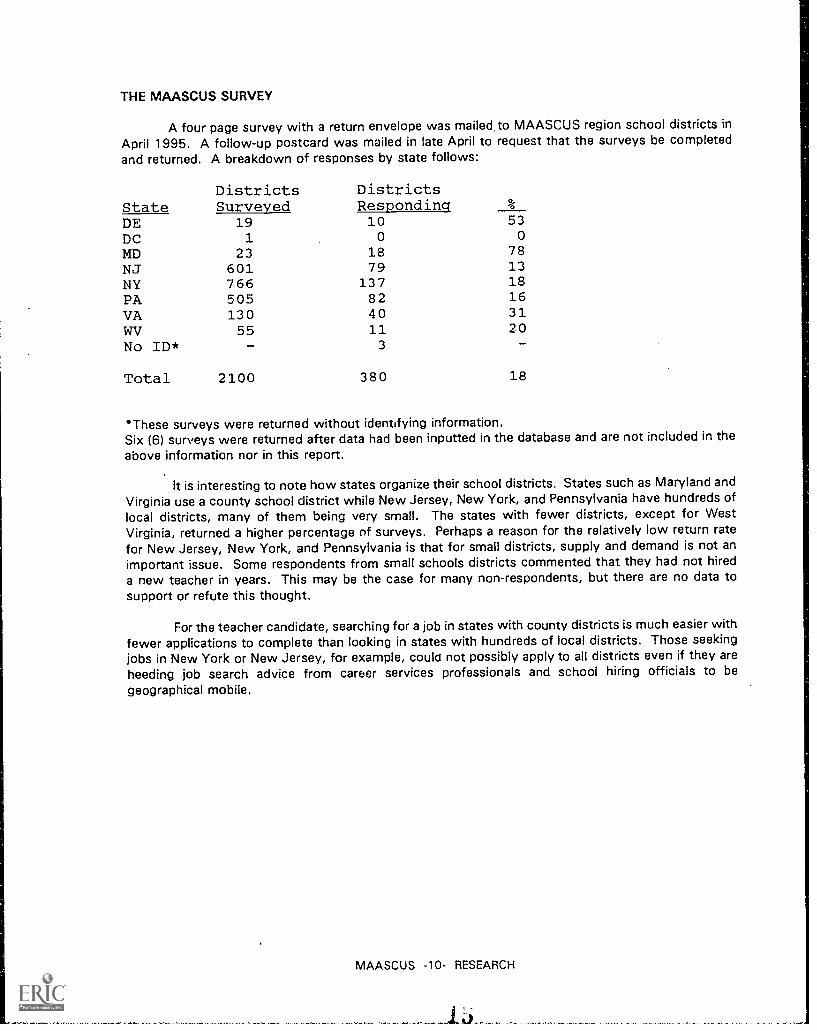
A four page survey with a return envelope was mailed to MAASCUS region school districts inApril 1995. A follow-up postcard was mailed in late April to request that the surveys be completedand returned. A breakdown of responses by state follows:
Districts DistrictsState Surveyed Responding %
DE 19 10 53
DC 1 0 0
MD 23 18 78
NJ 601 79 13
NY 766 137 18
PA 505 82 16
VA 130 40 31
WV 55 11 20
No ID* - 3
Total 2100 380 18
*These surveys were returned without identifying information.Six (6) surveys were returned after data had been inputted in the database and are not included in the
above information nor in this report.
It is interesting to note how states organize their school districts. States such as Maryland and
Virginia use a county school district while New Jersey, New York, and Pennsylvania have hundreds oflocal districts, many of them being very small. The states with fewer districts, except for WestVirginia, returned a higher percentage of surveys. Perhaps a reason for the relatively low return ratefor New Jersey, New York, and Pennsylvania is that for small districts, supply and demand is not animportant issue. Some respondents from small schools districts commented that they had not hired
a new teacher in years. This may be the case for many non-respondents, but there are no data tosupport or refute this thought.
For the teacher candidate, searching for a job in states with county districts is much easier withfewer applications to complete than looking in states with hundreds of local districts. Those seekingjobs in New York or New Jersey, for example, could not possibly apply to all districts even if they areheeding job search advice from career services professionals and school hiring officials to begeographical mobile.
MAASCUS -10- RESEARCH
Li
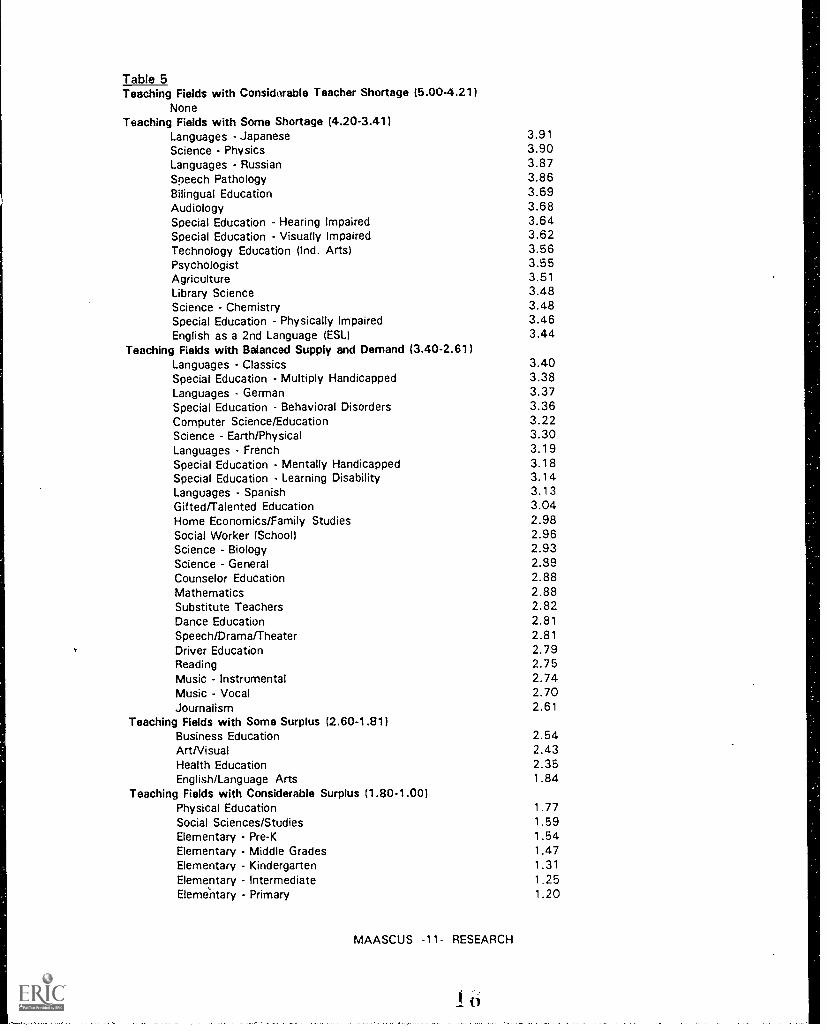
Table 5Teaching Fields with Considorable Teacher Shortage (5.00-4.21)
NoneTeaching Fields with Some Shortage (4.20-3.41)
Languages - Japanese 3.91Science - Physics 3.90Languages Russian 3.87Speech Pathology 3.86Bilingual Education 3.69Audiology 3.68Special Education - Hearing Impaired 3.64Special Education - Visually Impaired 3.62Technology Education (Ind. Arts) 3.56Psychologist 3.55Agriculture 3.51Library Science 3.48Science - Chemistry 3.48Special Education - Physically Impaired 3.46English as a 2nd Language (ESL) 3.44
Teaching Fields with Balanced Supply and Demand (3.40-2.61)Languages Classics 3.40Special Education - Multiply Handicapped 3.38Languages - German 3.37Special Education - Behavioral Disorders 3.36Computer Science/Education 3.22Science - Earth/Physical 3.30Languages - French 3.19Special Education - Mentally Handicapped 3.18Special Education - Learning Disability 3.14Languages - Spanish 3.13Gifted/Talented Education 3.04Home Economics/Family Studies 2.98Social Worker (School) 2.96Science Biology 2.93Science - General 2.89Counselor Education 2.88Mathematics 2.88Substitute Teachers 2.82Dance Education 2.81Speech/Drama/Theater 2.81Driver Education 2.79Reading 2.75Music - Instrumental 2.74Music - Vocal 2.70Journalism 2.61
Teaching Fields with Some Surplus (2.60-1.81)Business Education 2.54Art/Visual 2.43Health Education 2.35English/Language Arts 1.84
Teaching Fields with Considerable Surplus (1.80-1.00)Physical EducationSocial Sciences/StudiesElementary - Pre-KElementary - Middle GradesElementary KindergartenElementary - IntermediateElemehtary - Primary
MAASCUS -11- RESEARCH
1.771.591.541.471.311.251.20
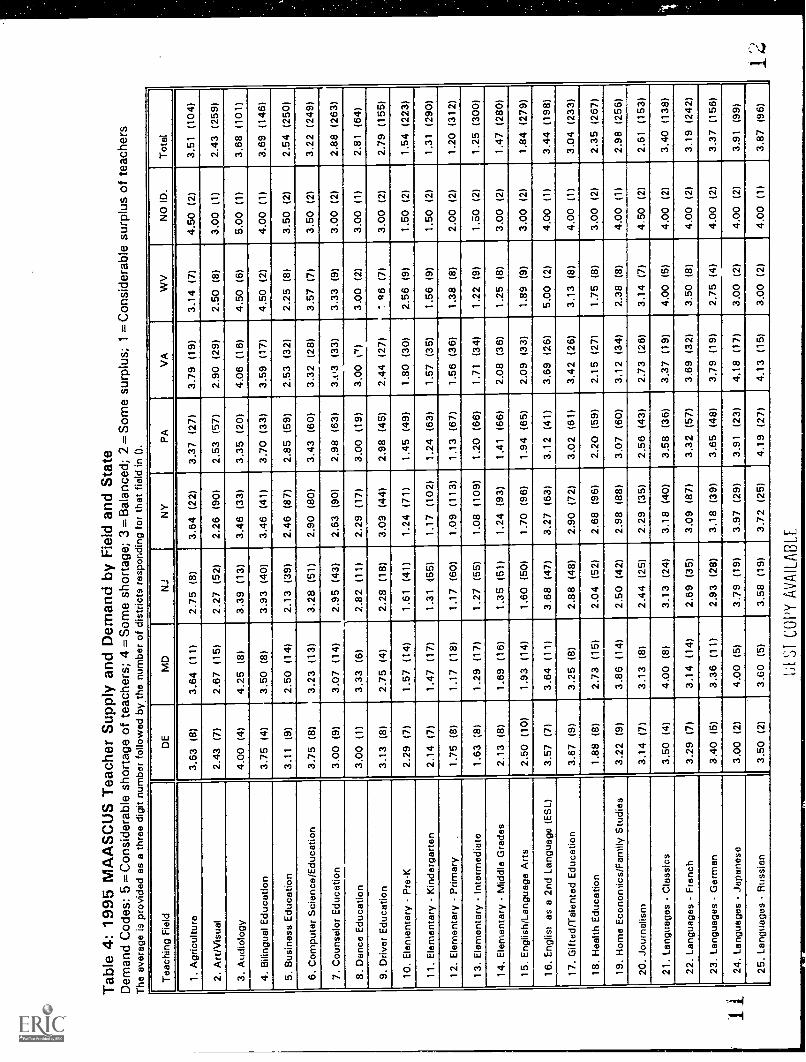
TEACHER SUPPLY AND DEMAND BY FIELD AND STATE
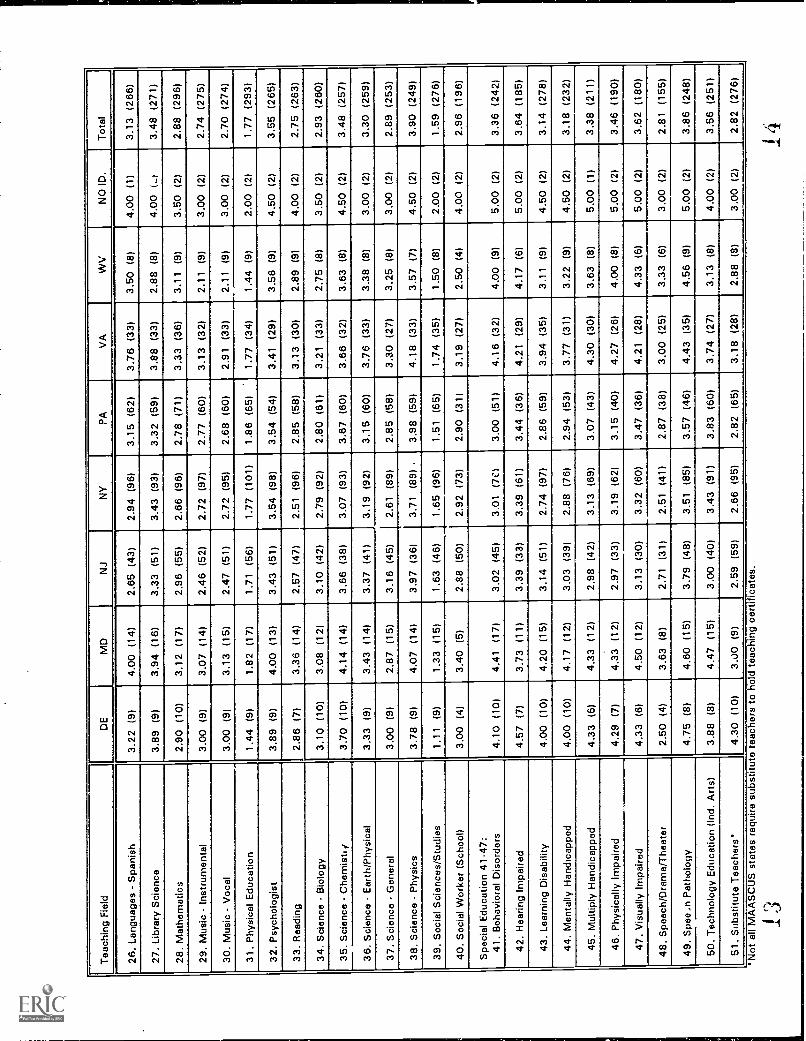
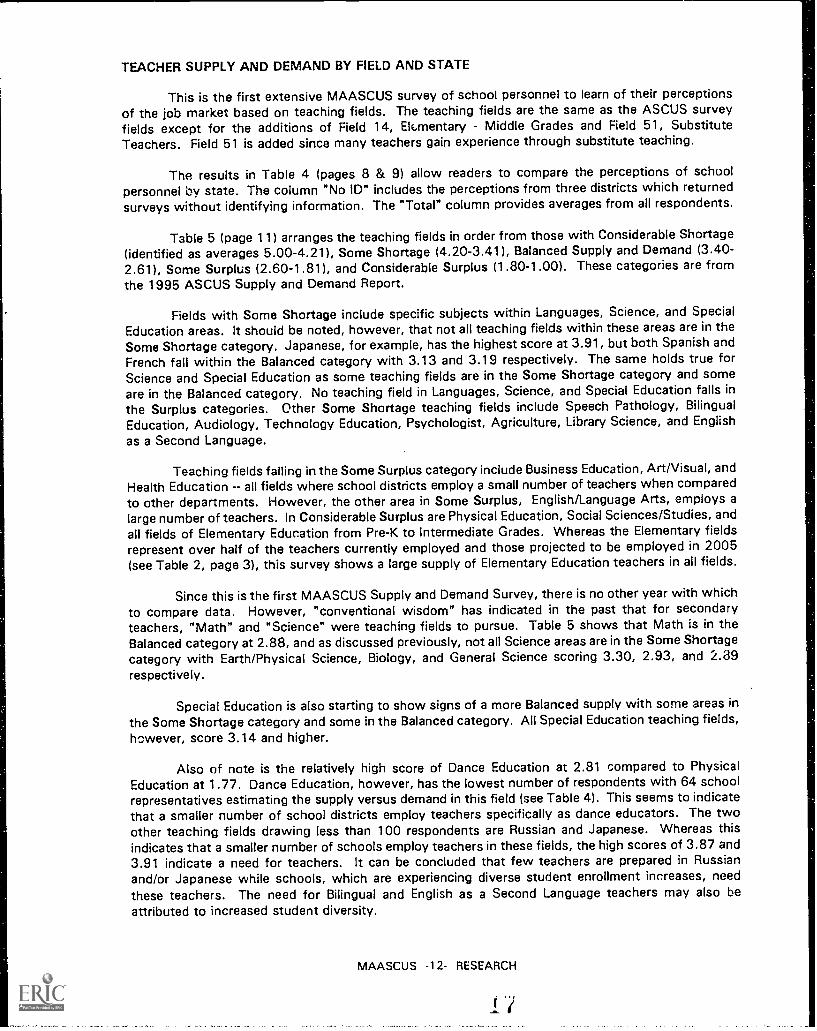
This is the first extensive MAASCUS survey of school personnel to learn of their perceptionsof the job market based on teaching fields. The teaching fields are the same as the ASCUS surveyfields except for the additions of Field 14, Ek,mentary - Middle Grades and Field 51, SubstituteTeachers. Field 51 is added since many teachers gain experience through substitute teaching.
The results in Table 4 (pages 8 & 9) allow readers to compare the perceptions of schoolpersonnel by state. The column "No ID" includes the perceptions from three districts which returnedsurveys without identifying information. The "Total" column provides averages from all respondents.
Table 5 (page 11) arranges the teaching fields in order from those with Considerable Shortage(identified as averages 5.00-4.21), Some Shortage (4.20-3.41), Balanced Supply and Demand (3.40-2.61), Some Surplus (2.60-1.81), and Considerable Surplus (1.80-1.00). These categories are fromthe 1995 ASCUS Supply and Demand Report.
Fields with Some Shortage include specific subjects within Languages, Science, and Special
Education areas. It should be noted, however, that not all teaching fields within these areas are in theSome Shortage category. Japanese, for example, has the highest score at 3.91, but both Spanish andFrench fall within the Balanced category with 3.13 and 3.19 respectively. The same holds true forScience and Special Education as some teaching fields are in the Some Shortage category and some
are in the Balanced category. No teaching field in Languages, Science, and Special Education falls in
the Surplus categories. Other Some Shortage teaching fields include Speech Pathology, BilingualEducation, Audiology, Technology Education, Psychologist, Agriculture, Library Science, and English
as a Second Language.
Teaching fields falling in the Some Surplus category include Business Education, Art/Visual, andHealth Education -- all fields where school districts employ a small number of teachers when comparedto other departments. However, the other area in Some Surplus, English/Language Arts, employs alarge number of teachers. In Considerable Surplus are Physical Education, Social Sciences/Studies, andall fields of Elementary Education from Pre-K to Intermediate Grades. Whereas the Elementary fieldsrepresent over half of the teachers currently employed and those projected to be employed in 2005(see Table 2, page 3), this survey shows a large supply of Elementary Education teachers in all fields.
Since this is the first MAASCUS Supply and Demand Survey, there is no other year with whichto compare data. However, "conventional wisdom" has indicated in the past that for secondaryteachers, "Math" and "Science" were teaching fields to pursue. Table 5 shows that Math is in theBalanced category at 2.88, and as discussed previously, not all Science areas are in the Some Shortagecategory with Earth/Physical Science, Biology, and General Science scoring 3.30, 2.93, and 2.39respectively.
Special Education is also starting to show signs of a more Balanced supply with some areas inthe Some Shortage category and some in the Balanced category. All Special Education teaching fields,however, score 3.14 and higher.
Also of note is the relatively high score of Dance Education at 2.81 compared to PhysicalEducation at 1.77. Dance Education, however, has the lowest number of respondents with 64 schoolrepresentatives estimating the supply versus demand in this field (see Table 4). This seems to indicatethat a smaller number of school districts employ teachers specifically as dance educators. The twoother teaching fields drawing less than 100 respondents are Russian and Japanese. Whereas thisindicates that a smaller number of schools employ teachers in these fields, the high scores of 3.87 and3.91 indicate a need for teachers. It can be concluded that few teachers are prepared in Russianand/or Japanese while schools, which are experiencing diverse student enrollment increases, needthese teachers. The need for Bilingual and English as a Second Language teachers may also beattributed to increased student diversity.
MAASCUS -12- RESEARCH
Other fields in the Some Shortage category worth noting are Technology Education, Agriculture,and Library Science. The need for teachers in these areas is probably not attributed as much toincreased student enrollment as it is to fewer teachers being prepared in these areas. HomeEconomics/Family Studies is a field which may experience this same need for teechers in the future.The Maryland respondents, for example, listed Home Economics in the Some Shortage category witha 3.86 score. Respondents from other states, however, rank this field in the Balanced category.
AVAILABILITY OF EMPLOYMENT OPPORTUNITIES
School administrators rank the availability of employment opportunities for elementary andsecondary teachers by responding to survey questions using a scale with values of much better, better,same, worse, and much worse.
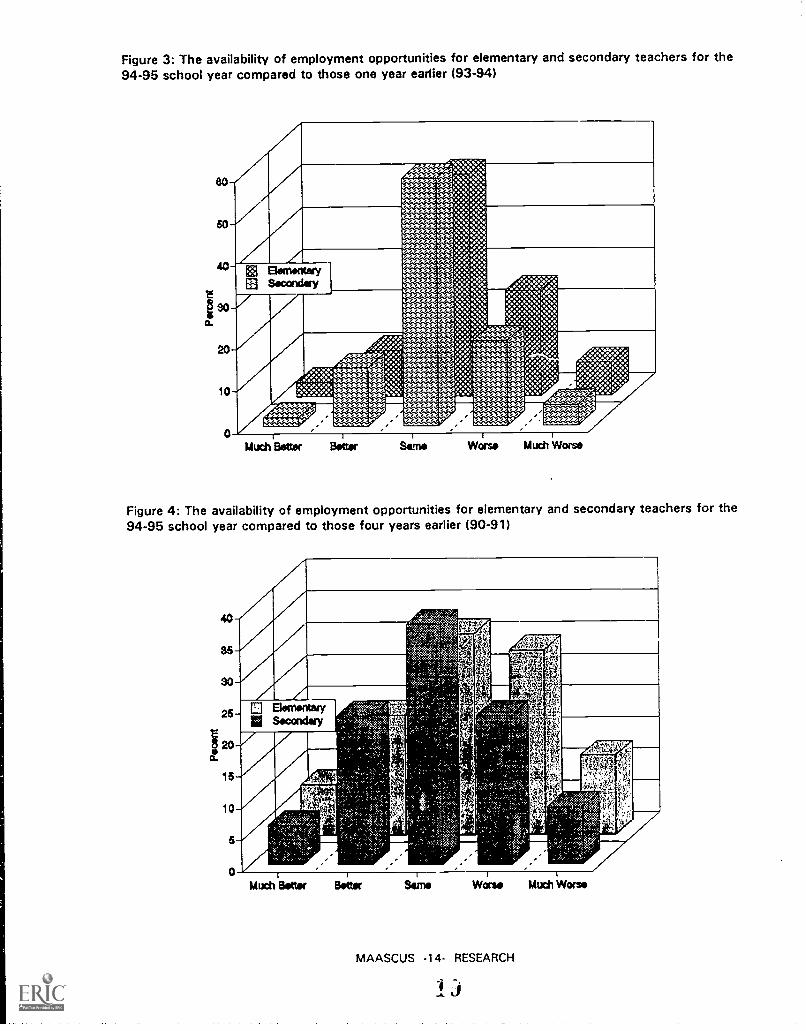
When comparing the availability of employment opportunities for teachers at both theelementary and secondary level for the 1994-95 school year with employment availability for teachersin 1993-94, 52.8% of the school administrators responding to the survey indicate that elementaryteachers have at least the same opportunities; 33.0% see these teachers as having worse or muchworse opportunities for employment than one year earlier; and only 14.3% feel that employmentopportunities for elementary teachers have improved and are better or much better than opportunities
in 1993-94.
The availability of employment opportunities for secondary teachers is noted by 58.9% of therespondents as similar to that of one year earlier. Approximately twenty-five percent (25.2%) of theadministrators think opportunities for employment are worse or much worse. Almost sixteen percent(15.9%) note better or much better employment opportunities for secondary teachers than one yearago. Comparing elementary to secondary teacher candidate employment opportunities, 1.6% of theadministrators responding find the secondary teacher candidates' employment outlook more favorablethan that of elementary teachers for the 1994-95 school year. Overall administrators perceive availableopportunity to be slightly better for secondary teachers than elementary teachers. This slight variancebetween elementary and secondary teacher employment opportunity emanates from the higherpercentage of school administrators' evaluations that secondary teacher candidates have the same orbetter availability of employment opportunity than elementary teacher candidates. These results areshown in Figure 3 on the next page.
The survey results, however, show that school administrators generally do not see improvementin employment opportunities over the last year for teachers. Indeed a high percentage ofadministrators, well over 80%, find that both elementary and secondary teacher candidates have thesame or worse opportunity for employment than just one year ago.
Additionally, the survey results show a similar trend over the past four years. When evaluatingthe availability of employment opportunities for the 1990-91 school year compared to that of 1994-95,school administrators report a slightly higher availability of opportunities for both elementary andsecondary teachers. Over thirty-one percent (31.6%) note that opportunities were the same forelementary teachers with 41.5% stating conditions are worse or much worse. Comparing thesefindings to the figures reported for the 1994-95 school year, a higher percentage, 12.6%, of theteacher candidates in 94-95 have either similar or worse availability of employment opportunities thancandidates in 1990-91. Almost twenty-seven percent (26.8%) indicate that opportunities are betteror much better during the 1994-95 school year than in 1990-91. Interestingly the percentage ofschool administrators perceiving conditions for employment at the extremes of better or worse areconsiderably higher in 1990-91 than just one year ago.
MAASCUS -13- RESEARCH
gRgi
%ft:11,
1:
ft::::ftW
nliiiiilk
MM
; 4iii;:::
111111111 il1
.:4m*SQ
CQ
aftftftliiiiiiiiiih,
ilmilliiiiiim
illitpg4,
11
SSI
111111
Na-, Iton

Figure 5: A comparison of expected employment opportunities for elementary and secondary teachersbetween 1994-95 and the approaching 95-96 school year
Figure 6: The expected availability of minority teaching candidates for the approaching 95-96 schoolyear compared to the 94-95 school year
Much Bohm Bettor 10 WOrso Much WSom orse
MAASCUS -15- RESEARCH
A similar trend is found in the survey results for secondary teacher candidates. Almost thirty-eight percent (37.8%) of the school administrators find opportunities for secondary teacheremployment to be the same four years ago as during the 1994-95 school year. Over thirty-two percent(32.5%) see employment opportunities as worse, a 7.3% increase over the figure shown for 1994-95.Almost thirty percent (29.7%) state employment opportunities ara better today than in 1990-91.These results are shown in Figure 4 on page 14. The survey results for 1994-95 show a decrease of13.8% in the number of school administrators reporting that secondary educators have much moreemployment opportunity availability than in the 1990-91 school year.
The survey results reflect an apparent perception by school administrators that employmentopportunities for teachers at both the elementary and secondary level are generally not improving.Approximately 50% of the administrators responding to the survey see employment opportunities asremaining the same during the last year while only 30% saw conditions remaining the same four years
ago. Additionally, there is at least a 10% drop in the number of administrators reporting better ormuch better employment opportunities during this past year compared to four years earlier.
This same trend is reflected in the projected availability of employment opportunities for theforthcoming school year, 1995-96. When school administrators estimate the availability ofopportunities for employment for teachers for the next year, 85.2% of the respondents note that boththe elementary and secondary teachers will find opportunities either the same or worse than in thepast. Elementary teachers, it is noted by 45.0% of the administrators, have a similar opportunity foremployment next year as during this past school year. Over forty percent (40.2%) state employmentopportunities will be worse or much worse. Fifty percent (50.0%) feel secondary teachers will havethe same opportunity during the 1995-96 school year while 35.2% feel employment opportunity willbe worse or much worse. Slightly less than 15.0% feel that both groups of teachers, elementary andsecondary, have a chance of better employment opportunity availability next year. These results areshown in Figure 5 on page 15.
The school administrators responding to this survey indicate that the trend in employmentopportunities for teachers for the 1995-96 school year will not improve. Although many administratorsreport that opportunities will remain the same, an increasing number report conditions as becomingworse.
Trends in employment opportunity for teachers as reflected in the responses of schooladministrators show little, if any, improvement in availability of teaching positions for teachercandidates. Employment availability is generally expected to remain the same or become worse overthe next year. Unless the projected trend in availability of employment opportunity deviates from thatreported by school administrators, teaching positions are not expected to be readily available to eitherelementary or secondary teachers seeking employment.
MAASCUS -16- RESEARCH
'
MINORITY CANDIDATE AVAILABILITY
School administrators responding note that they expect the availability of minority teachingcandidates to remain the same or to become worse throughout the next year. When comparing theavailability of minority candidates in the 1994-95 school year to that of the 1995-96 school year, 90%of those responding see availability at both the elementary and secondary level as the same or worse;approximately 45% report minority teacher candidate availability as worse or much worse; and onlyabout 10% anticipate an increase in the availability of minority candidates. The number of minoritycandidates available for employment does not appear to be improving. The continued lack of availablecandidates is reflected in the low percentage of school administrators who predict an increase in
availability of minority candidates for the 1995-96 school year. These results are shown in Figure 6
on page 15.
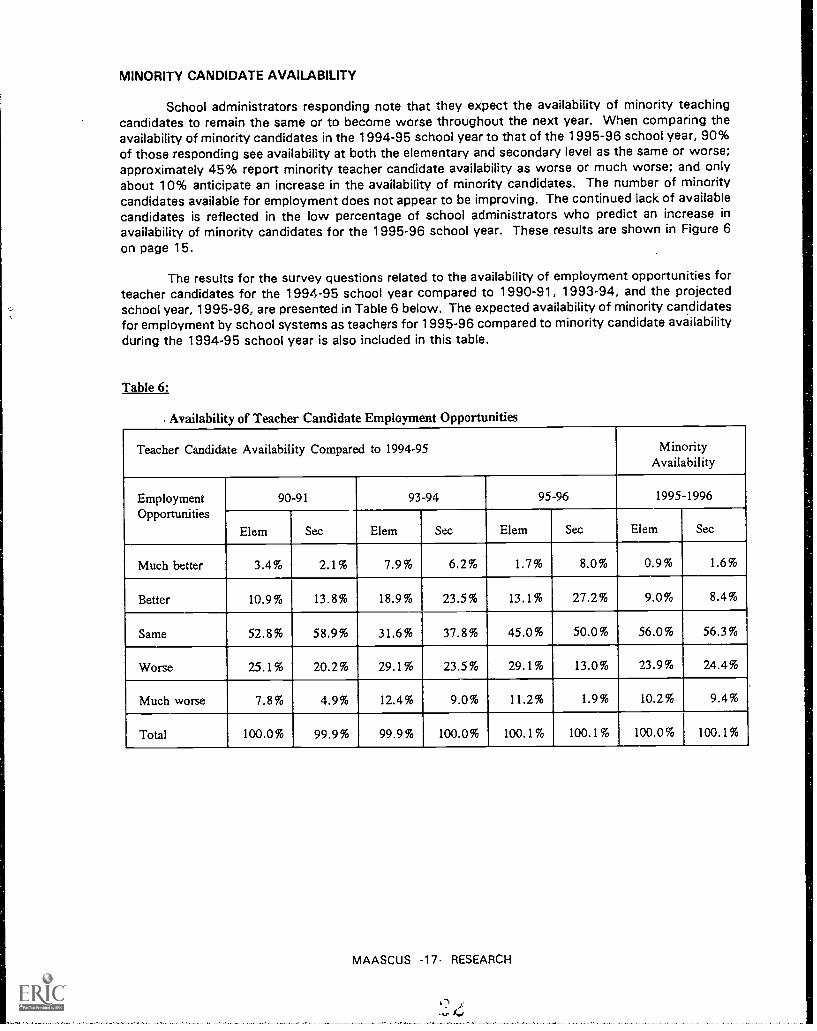
The results for the survey questions related to the availability of employment opportunities forteacher candidates for the 1994-95 school year compared to 1990-91, 1993-94, and the projectedschool year, 1995-96, are presented in Table 6 below. The expected availability of minority candidatesfor employment by school systems as teachers for 1995-96 compared to minority candidate availabilityduring the 1994-95 school year is also included in this table.
Table 6:
. Availability of Teacher Candidate Employment Opportunities
Teacher Candidate Availability Compared to 1994-95 MinorityAvailability
EmploymentOpportunities
90-91 93-94 95-96 1995-1996
Elem Sec Elem Sec Elem Sec Elem Sec
Much better 3.4% 2.1% 7.9% 6.2% 1.7% 8.0% 0.9% 1.6%
Better 10.9% 13.8% 18.9% 23.5% 13.1% 27.2% 9.0% 8.4%
Same 52.8% 58.9% 31.6% 37.8% 45.0% 50.0% 56.0% 56.3%
Worse 25.1% 20.2% 29.1% 23.5% 29.1% 13.0% 23.9% 24.4%
Much worse 7.8% 4.9% 12.4% 9.0% 11.2% 1.9% 10.2% 9.4%
Total 100.0% 99.9% 99.9% 100.0% 100.1% 100.1% 100.0% 100.1%
MAASCUS -17- RESEARCH
421
4.0
FACTORS IMPACTING 1995-96 EMPLOYMENT NEEDS
Table 7
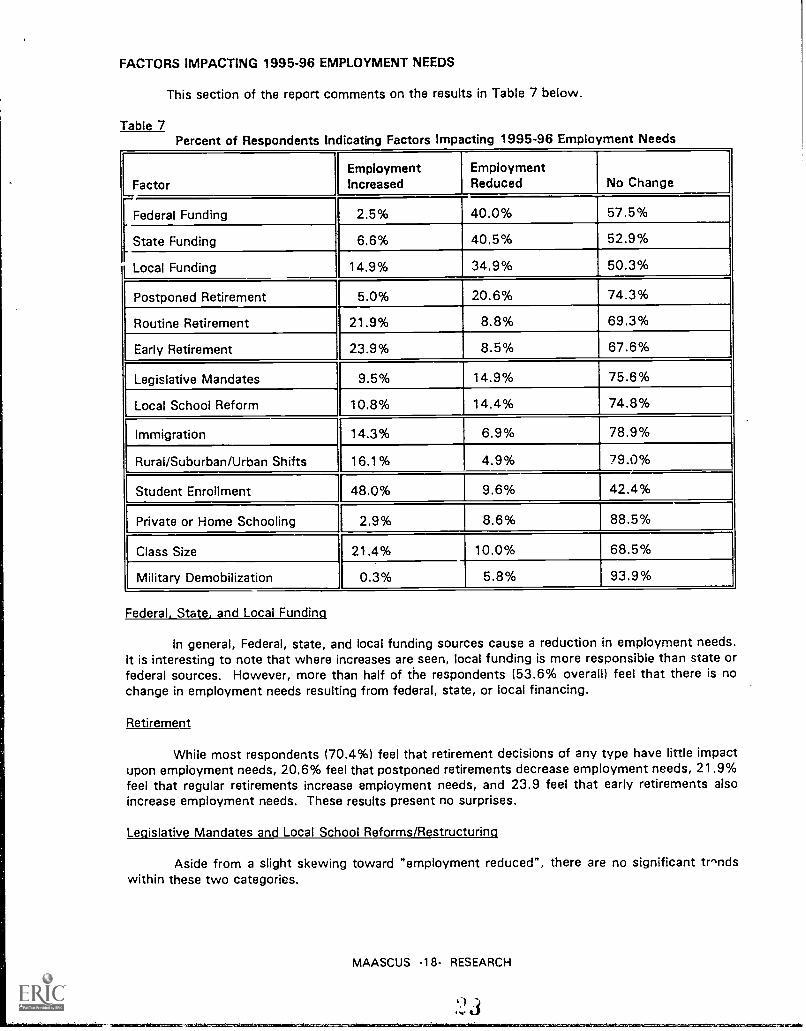
This section of the report comments on the results in Table 7 below.
Percent of Respondents Indicating Factors Impacting 1995-96 Employment Needs
[FactorEmploymentIncreased
EmploymentReduced No Change
Federal Funding 2.5% 40.0% 57.5%
State Funding 6.6% 40.5% 52.9%
Local Funding 14.9% 34.9% 50.3%
Postponed Retirement 5.0% 20.6% 74.3%
Routine Retirement 21.9% 8.8% 69.3%
Early Retirement 23.9% 8.5% 67.6%
Legislative Mandates 9.5% 14.9% 75.6%
Local School Reform 10.8% 14.4% 74.8%
Immigration 14.3% 6.9% 78.9%
Rural/Suburban/Urban Shifts 16.1% 4.9% 79.0%
Student Enrollment 48.0% 9.6% 42.4%
Private or Home Schooling 2.9% 8.6% 88.5%
Class Size 21.4% 10.0% 68.5%
Military Demobilization 0.3% 5.8% 93.9%
Federal, State, and Local Funding
In general, Federal, state, and local funding sources cause a reduction in employment needs.It is interesting to note that where increases are, seen, local funding is more responsible than state orfederal sources. However, more than half of the respondents (53.6% overall) feel that there is nochange in employment needs resulting from federal, state, or local financing.
Retirement
While most respondents (70.4%) feel that retirement decisions of any type have little impactupon employment needs, 20.6% feel that postponed retirements decrease employment needs, 21.9%feel that regular retirements increase employment needs, and 23.9 feel that early retirements alsoincrease employment needs. These results present no surprises.
Legislative Mandates and Local School Reforms/Restructuring
Aside from a slight skewing toward "employment reduced", there are no significant tr^ndswithin these two categories.
MAASCUS -18- RESEARCH
4.)
Demographic Shifts in Population
Respondents view immigration and rural/urban shifts as having influence on employment needs;for the most part, those who indicate an impact see demographic shifts increasing employment needs.
Student Enrollment
By far, student enrollment is seen as having a greater impact on employment needs than anyother factor within this group. Almost fifty-eight percent (57.6%) of the respondents believe thatstudent enrollment causes either increases or decreases in employment needs.
Private or Home Schooling
This factor is seen by respondents as having negligible impact on employment needs.Generally, when an effect is noted, it results in a reduction in employment needs. If private schoolsand home schooling pull students out of the public schools, one expects enrollment to go down whichwill decrease employment needs. The data generally support this. Cases in which employment needsare increased may be the result of reduced enrollment in the private schools. Students leaving someprivate schools may be captured by the public schools, increasing enrollment, and consequently,increasing employment needs.
Class Size
Over thirty-one percent (31.4%) of the respondents experience employment needs which areassociated with class size; most of these are increased needs. This may imply that there is a generaltrend toward decreasing class sizes, since decreasing class sizes usually result in increased employmentneeds. But as stated below, these data invite several interpretations.
Military Mobilization
Only 1 of 380 respondents sees increased employment needs as a result of militarydemobilization. Another 4.8% experience decreased needs as a result of military demobilization. But,overwhelmingly, 93.9% of the respondents feel that military demobilization has no influence upon theirhiring needs.
The data presented in Table 7 are open to considerable interpretation. The results, for the mostpart, may reflect the current condition within a school district rather than a theoretical impact shoulda change in one of the factors occur. For example, a "no change" response to State Funding couldmean: "There is no change in our state funding."
"There a change in our state funding, but it doesn't affect our hiring needs.""We receive no state funding so there is no impact."
For this reason it is prudent to be cautious when drawing cause and effect conclusions about the datapresented here.
SOURCES OF NEW HIRES
School administrators responding to the survey state that their greatest source of new hirescomes from new education graduates from in-state institutions. Over fifty-five percent (55.4%) of theadministrators note in-state graduates comprise 50 to 100% of their new hires. Only 7.2% state theyfind 0 to 9% of their new hires in the ranks of in-state institution graduates.
Out-of-state institutions provide 0 to 9% of the new hires for 47.8% of the schooladministrators. Approximately forty-four percent (44.1%) of the administrators find 10 to 50% of theirnew hires from out-of-state sources. Only 8.1% find out-of-state institutions to be a source of 50 to100% of their new hires. Breaking this figure down further, graduates from out-of-state institutionsprovide 75-100% of the new hires for only 1.2% of the si lool administrators.
MAASCUS -19- RESEARCH
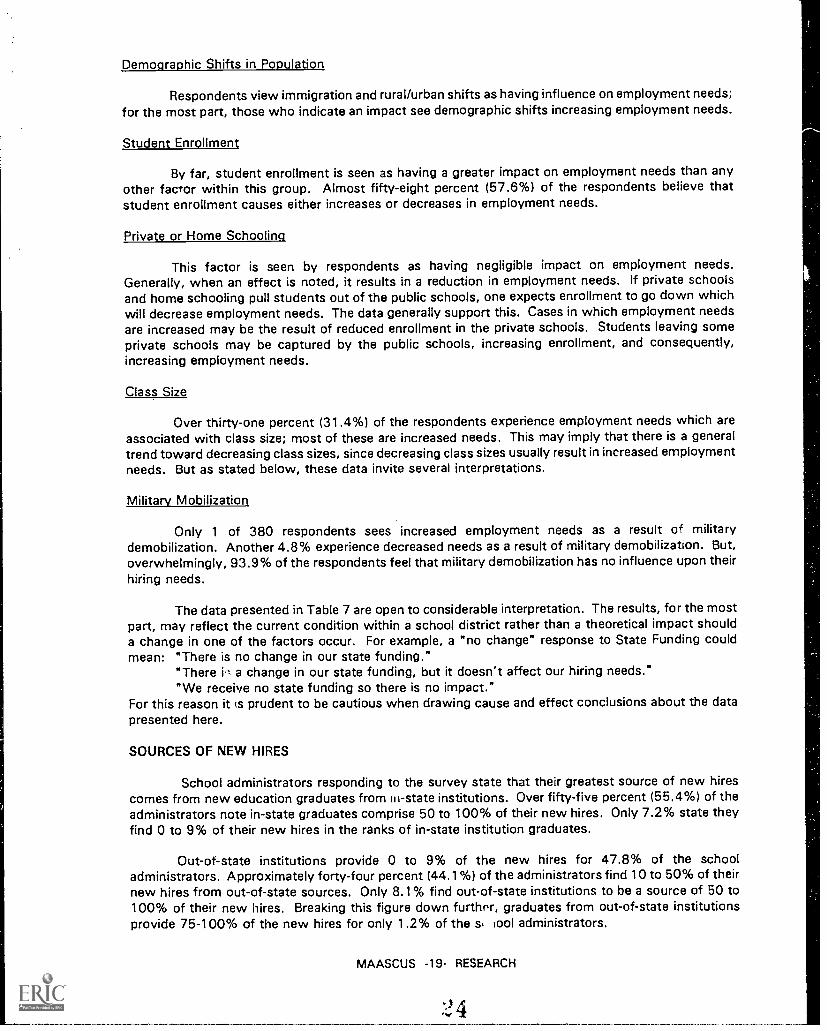
School administrators reiponding to the survey represent school districts frorr various statesin the Mid-Atlantic region. Therefore, it is possible to further delineate the results of the survey toreview each state's reported employment of graduates from out-of-state institutions. Delaware,Maryland, New Jersey, Virginia, and West Virginia employ a moderate number of out-of-statecandidates while New York and Pennsylvania employ a very limited number of out-of-state teachercandidates. Detailed results of employment of out-of-state new education graduates for each state are
shown in Table 8 below.
Table 8Percent of New Education Graduates from In-State and Out-of-State Institutions
(At the top of the table are the percent of new hires for a school district. In the cells below are thepercent of administrators responding. For example, the 10.0% in the cell at the bottom right cornerof the table indicates that 10.0% of the West Virginia administrators report that between 75-100%of their new hires come from out-of-state graduates.)
0-10% 10-24% 25-49% 50-74% 75-100%
In-state
Out-of-state
In-state
Out-of-state
In-state
Out-of-state
In-state
Out-of-state
In-state
Out-of-state
DE 0.0% 10.0% 10.0% 10.0% 50.0% 70.0% 30.0% 10.0% 10.0% 0.0%
MD 0.0% 16.7% 5.6% 22.2% 27.8% 50.0% 55.6% 11.1% 11.1% 0.0%
NJ 11.0% 31.9% 15.1% 27.8% 27.4% 29.2% 32.9% 8.3% 13.7% 2.8%
NY 8.5% 60.5% 17.1% 27.4% 22.5% 6.5% 23.3% 4.8% 28.7% 0.8%
PA 3.8% 69.9% 11.5% 26.0% 19.2% 2.7% 39.7% 1.4% 25.6% 0.0%
VA 7.7% 21.1% 7.7% 39.5% 25.6% 26.3% 51.3% 13.2% 7.7% 0.0%
WV 10.0% 50.0% 10.0% 20.0% 10.0% 10.0% 30.0% 10.0% 40.0% 10.0%
Table 9, page 21, shows the distribution of sources of new hires. Almost sixty-seven percent(66.9%) of the administrators esponding to the survey report that 0 to 9% of their new hires areprevious education graduates with no teaching or substituting experience whereas 31.3% findbetween 10 and 74% of their new hires have no experience. Only 1.8% of the administrators notethat 75 to 100% of their new hires have no teaching or substituting experience. Conversely, 7.2%of those responding to the survey state that teacher candidates with experience comprise 75 to100% of their new hires; 12% note that 0 to 9% of their new hires have experience; about sixtypercent (63.3%) find 10 to 50% of the teacher candidates they employ have experience. Manyadministrators note that, as a source of teachers, a large number of new hires are individuals with noexperience. However, a similarly high number of administrators note that 10 to 50% of their newhires have experience.
Substitute teachers appear to be a good source of new hires. Sixty-four percent (64%) ofthe school administrators responding to the survey note that they obtain between 10 and 74% oftheir new hires from the ranks of substitute teachers. Only 7% report that 75 to 100% of their newly
hired teachers are substitute teachers.
MAASCUS -20- RESEARCH
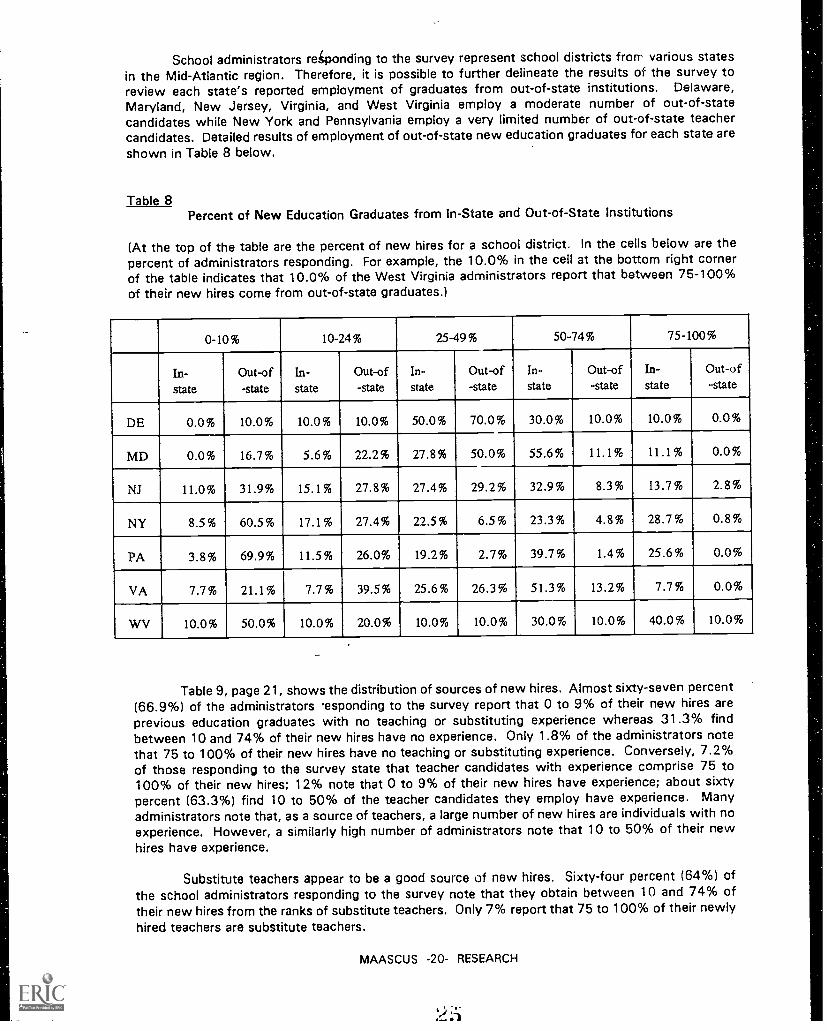
Table 9Distribution of Sources of New Hires
(At the top of the table are the percent of new hires for a school district. In the cells below are thepercent of administrators responding by the sources of new hires. For example, the 21% in the firstcell means that 21% of the responding administrators indicate that new education graduates fromin-state institutions comprise 75-100% of their new hires.)
Sources of new hires 100-75% 74-50% 49-25% 24-10% 9 i%
New education graduates from in-state institutions 21% 34% 24% 14% 7%
New education graduates from out-of-state institutions 1% 7% 17% 27% 48%
Previous ed. grads without teaching/subbing exp 2% 7% 7% 17% 67%
Substitute teachers 7% 18% 18% 29% 29%
Teachers with experience 7% 18% 32% 31% 12%
Teachers from alternative certificate programs 2% 4% 6% 7% 82%
Other 0% 12% 19% 8% 62%
Figure 7: School systems' sources of new hires
oSource al N.* Wes for 50 la 100% of Vacandes
A =New education graduates from in-state institutionsB =New education graduates from out-of-state institutionsC =Previous education graduates without teaching or subbing experienceD = Substitute teachersE =Teachers with experienceF =Teachers from alternative certificate programs
MAASCUS -21- RESEARCH
Alternate certificate programs prove to be a limited source of teacher candidates. This fact isreflected in the high percentage of administrators, 82.2%, reporting that they use the alternatecertification program for teacher candidates in 0 to 9% of their employment situations. Only 16.4%indicate that they take somewhere between 10 to 74% of their new hires from this source whereas
a very low percentage (1.5%) indicate that they use the alternate certification program as a source for
75 to 100% of their new hires.
Overall, teacher candidates that are new graduates from in-state institutions appear to have a
higher potential to obtain employment than candidates from any other source. However, both teachercandidates with previous teaching experience and those that have substitute teaching experienceappear to have a greater chance for employment than teacher candidates without experience, out-of-state new education graduates, or teacher candidates coming from alternate certificate programs. SeeFigure 7 on page 21 for a comparative view of new hire sources.
When school administrators define how they learn of and select qualified candidates for hiringconsideration the highest percentage, 37.0% of the administrators respond that their knowledge ofcandidates comes through print advertising, newspapers and magazines. Almost as manyadministrators, 35.9%, find unsolicited applications to be a good sc tree. For these administrators, 50
to 100% of their knowledge of candidates comes from these sou us. Interestingly 15.7% indicatethat they learn of and select 75 to 100% of their candidates through ,print advertising and unsolicitedapplications. However, print advertisement is a source of 0 to 9% of the knowledge of candidates for27% of the administrators. Over eighteen percent (18.2%) report that unsolicited applications provide
information about 0 to 9% of their candidates.
The next greatest source of learning of and selecting qualified candidates for consideration isfrom substitute teacher lists. Over twenty-five percent (25.2%) of the administrators use this sourcefor knowledge of candidates. However, a slightly higher number of administrators (27.2%) note 0 to9% of their knowledge of candidates come from substitute teacher lists. Thus, these administratorsobtain little, if any, information about candidates from this source.
Approximately twelve percent (12.2%) of the administrators indicate that they learn aboutcandidates from other administrators in 50 to 100% of the cases. Yet, a high percentage (43.2%) find
this not to be true. This second and much larger percentage of administrators note that 0 to 9% oftheir knowledge of candidates comes from other school administrators.
On-campus recruitment, job fairs, and networking with college personnel prove to be amoderate source of learning of and selection for consideration of teacher candidates for schooladministrators. Almost nine percent (8.7%) learn about 50 to 100% of their candidates through on-
campus recruitment. Over ten percent (10.2%) learn about 50 to 100% of their candidates throughjob fairs, and 9.5% learn of the same percentage through college personnel. A much higher numberdo not learn of candidates through these sources. In the case of on-campus recruitment, 61.6% ofthe administrators obtain 0 to 9% of their knowledge of candidates through this source. Job fairs donot represent a source in information for 59.3% of the administrators as they note that 0 to 9% oftheir knowledge of candidates come from this source. Likewise, college personnel provide 0 to 9%of the knowledge about candidates for 54.3% of the administrators.
Recommendations from community members and others provide limited information. Over fifty-eight percent (58.4%) of the school administrators respond that they receive information about 0 to9% of the candidates from community members. Only 5.0% note this as a source for 50 to 100%of their learning about candidates.
MAASCUS -22- RESEARCH
22
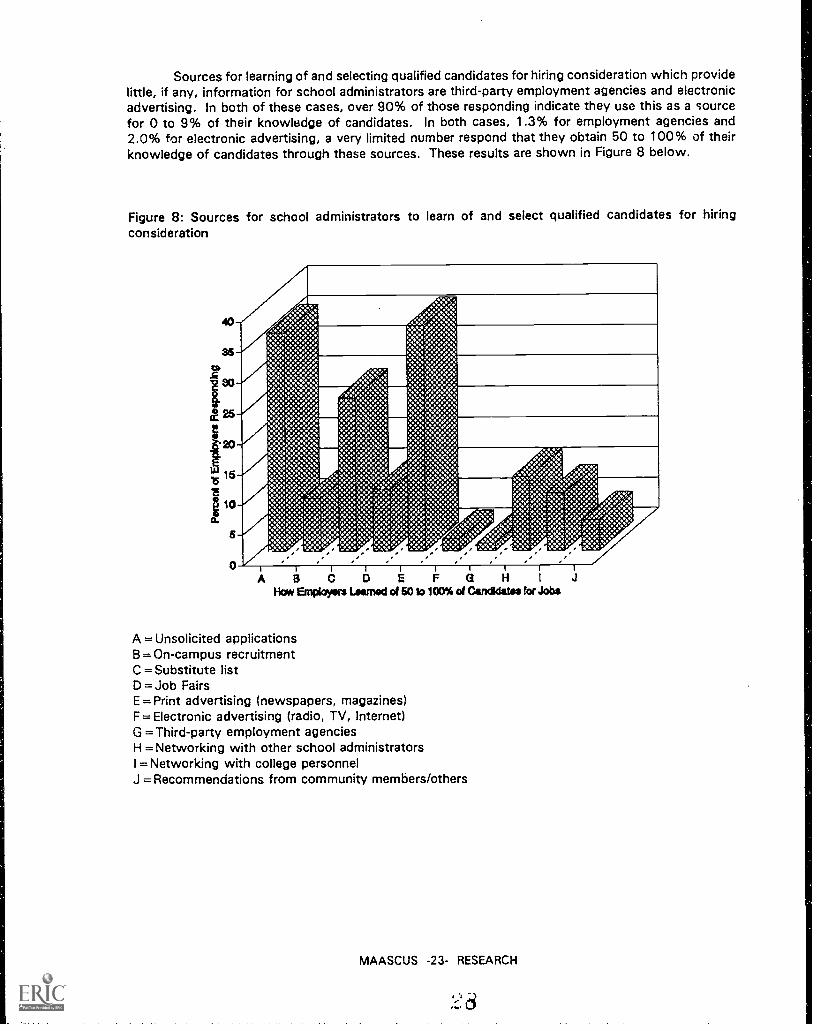
Sources for learning of and selecting qualified candidates for hiring consideration which providelittle, if any, information for school administrators are third-party employment agencies and electronicadvertising. In both of these cases, over 90% of those responding indicate they use this as a sourcefor 0 to 9% of their knowledge of candidates. In both cases, 1.3% for employment agencies and2.0% for electronic advertising, a very limited number respond that they obtain 50 to 100% of theirknowledge of candidates through these sources. These results are shown in Figure 8 below.
Figure 8: Sources for school administrators to learn of and select qualified candidates for hiringconsideration
0 I i 1 1 1 I 1 I 1 I
A B C D E F G H I JHow Erngwom Loomed of 60 10 100,4 of Canc6clatos for Jobs
A = Unsolicited applicationsB = On-campus recruitmentC = Substitute listD =Job FairsE = Print advertising (newspapers, magazines)F = Electronic advertising (radio, TV, Internet)G =Third-party employment agenciesH = Networking with other school administratorsI =Networking with college personnelJ = Recommendations from community members/others
MAASCUS -23- RESEARCH
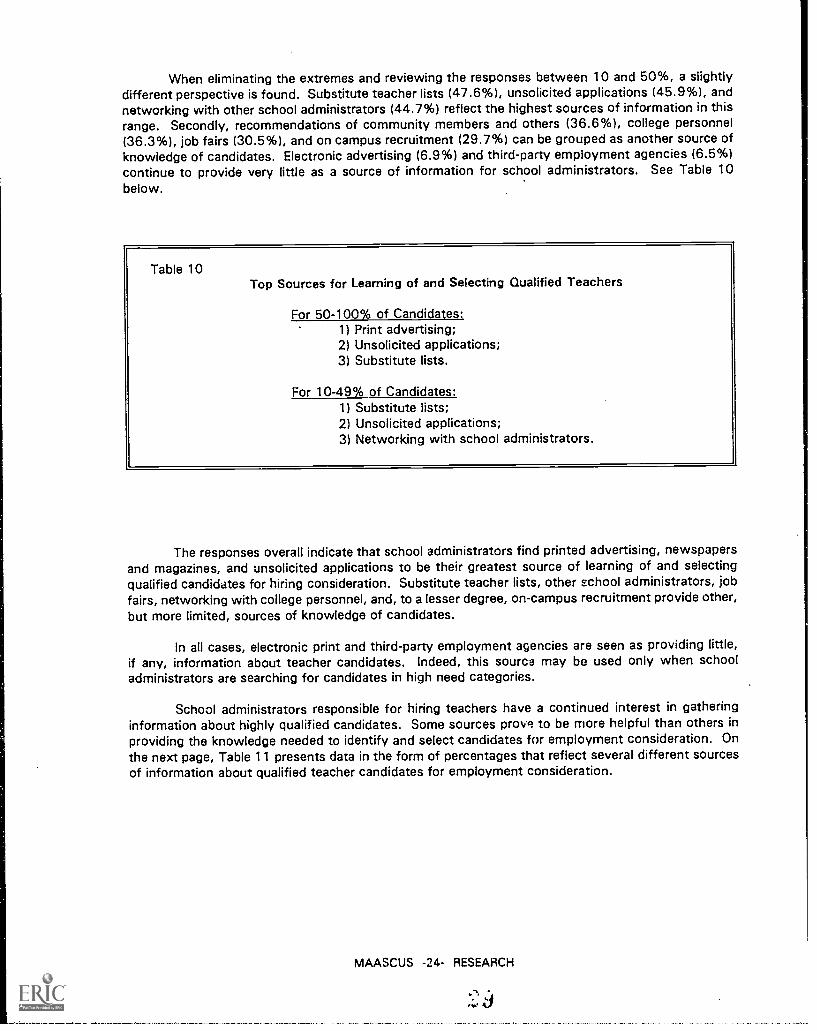
When eliminating the extremes and reviewing the responses between 10 and 50%, a slightlydifferent perspective is found. Substitute teacher lists (47.6%), unsolicited applications (45.9%), andnetworking with other school administrators (44.7%) reflect the highest sources of information in thisrange. Secondly, recommendations of community members and others (36.6%), college personnel(36.3%), job fairs (30.5%), and on campus recruitment (29.7%) can be grouped as another source ofknowledge of candidates. Electronic advertising (6.9%) and third-party employment agencies (6.5%)continue to provide very little as a source of information for school administrators. See Table 10below.
Table 10Top Sources for Learning of and Selecting Qualified Teachers
For 50-100% of Candidates:1) Print advertising;2) Unsolicited applications;3) Substitute lists.
For 10-49% of Candidates:1) Substitute lists;2) Unsolicited applications;3) Networking with school administrators.
The responses overall indicate that school administrators find printed advertising, newspapersand magazines, and unsolicited applications to be their greatest source of learning of and selectingqualified candidates for hiring consideration. Substitute teacher lists, other school administrators, jobfairs, networking with college personnel, and, to a lesser degree, on-campus recruitment provide other,but more limited, sources of knowledge of candidates.
In all cases, electronic print and third-party employment agencies are seen as providing little,if any, information about teacher candidates. Indeed, this source may be used only when schooladministrators are searching for candidates in high need categories.
School administrators responsible for hiring teachers have a continued interest in gatheringinformation about highly qualified candidates. Some sources prove to be more helpful than others inproviding the knowledge needed to identify and select candidates for employment consideration. Onthe next page, Table 11 presents data in the form of percentages that reflect several different sourcesof information about qualified teacher candidates for employment consideration.
MAASCUS -24- RESEARCH
AY
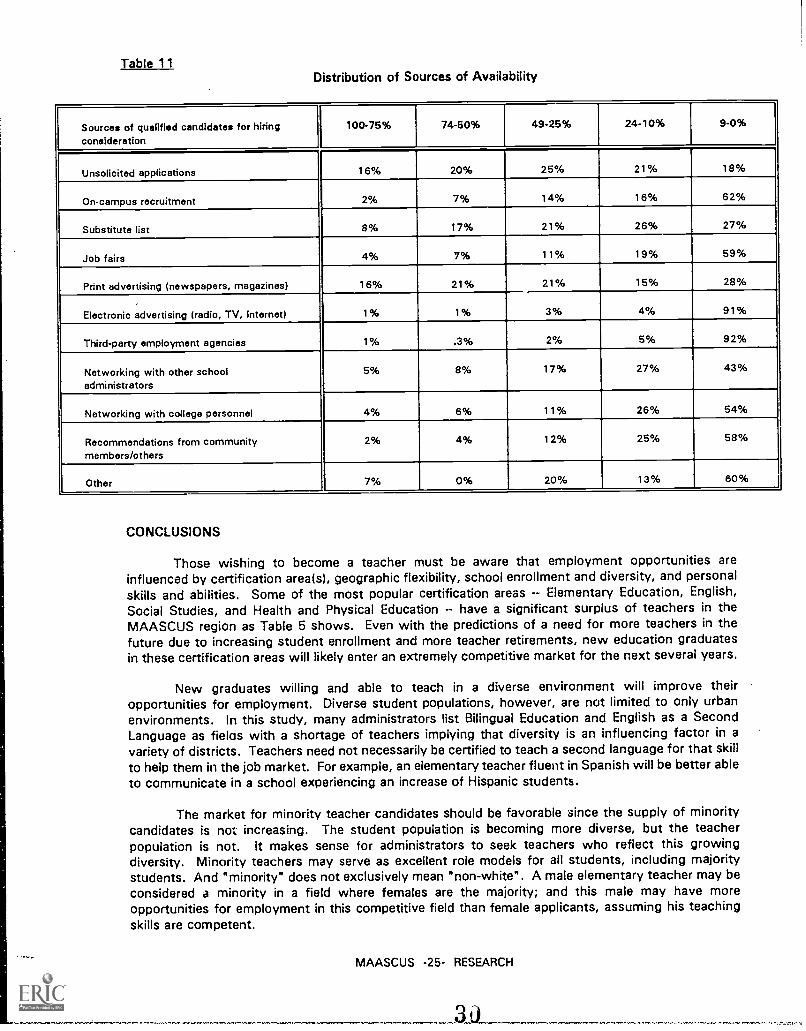
Table 11Distribution of Sources of Availability
Sources of qualified candidates for hiringconsideration
100-75% 74-50% 49-25% 24-10% 9-0%
Unsolicited applications 16% 20% 25% 21% 18%
On-campus recruitment 2% 7% 14% 16% 62%
Substitute list 8% 17% 21% 26% 27%
Job fairs 4% 7% 11% 19% 59%
Print advertising (newspapers, magazines) 16% 21% 21% 15% 28%
Electronic advertising (radio, TV, Internet) 1% 1% 3% 4% 91%
Third-party employment agencies 1% .3% 2% 5% 92%
Networking with other schooladministrators
5% 8% 17% 27% 43%
Networking with college personnel 4% 6% 11% 26% 54%
Recommendations from communitymembers/others
2% 4% 12% 25% 58%
Other 7% 0% 20% 13% 60%
CONCLUSIONS
Those wishing to become a teacher must be aware that employment opportunities areinfluenced by certification area(s), geographic flexibility, school enrollment and diversity, and personalskills and abilities. Some of the most popular certification areas -- Elementary Education, English,Social Studies, and Health and Physical Education -- have a significant surplus of teachers in theMAASCUS region as Table 5 shows. Even with the predictions of a need for more teachers in thefuture due to increasing student enrollment and more teacher retirements, new education graduatesin these certification areas will likely enter an extremely competitive market for the next several years.
New graduates willing and able to teach in a diverse environment will improve theiropportunities for employment. Diverse student populations, however, are not limited to only urbanenvironments. In this study, many administrators list Bilingual Education and English as a SecondLanguage as fielas with a shortage of teachers implying that diversity is an influencing factor in avariety of districts. Teachers need not necessarily be certified to teach a second language for that skillto help them in the job market. For example, an elementary teacher fluent in Spanish will be better ableto communicate in a school experiencing an increase of Hispanic students.
The market for minority teacher candidates should be favorable since the supply of minoritycandidates is not increasing. The student population is becoming more diverse, but the teacherpopulation is not. It makes sense for administrators to seek teachers who reflect this growingdiversity. Minority teachers may serve as excellent role models for all students, including majoritystudents. And "minority" does not exclusively mean "non-white". A male elementary teacher may beconsidered a minority in a field where females are the majority; and this male may have moreopportunities for employment in this competitive field than female applicants, assuming his teachingskills are competent.
- --
MAASCUS -25- RESEARCH
30
The AASPA list of knowledge and skills (Table 1) is a clear illustration of the challenges ofteaching and of the demands placed upon modern educators. The ability of a teacher candidate is amajor determining factor not only in that person's chance of getting a job, but also in his/her chancesof succeeding in that job.
With more opportunities for employment in urban settings, as the literature review suggests,colleges would find it to their advantage and the advantage of their students to provide more training,field experiences, and student teaching in urban schools. Most education majors are from suburbanand rural schools. Without training in an urban environment, they would not serve their students welleven if they wish to teach in an urban school While the results in this survey are not analyzed by thedistrict environment (urban, suburban, rural) and provide no comparison of needs in urban schools toneeds in other schools, it still can be concluded that in the overall competitive market which the resultsdo indicate, anything a college can do to help its graduates be better prepared for all teachingopportunities is worth the effort.
Although on the surface it may seem counterproductive to support alternative teachercertification programs, they may help to equalize the diversity imbalance between students andteachers. Colleges could take a leading role in training career changers to become effective teachers.Many of these people have outstanding skills developed from years of experience in other professions,and with research showing tnat a higher percentage of students enrolled in alternative programs areminority and interested in urban teaching, they may help meet the need for teachers in theseenvironments. While only 6% of the administrators responding in this survey claim to use alternativecertification programs as a source of 50 - 100% of their hires, this method of preparing teachers tomeet areas of need ought not to be ignored, even if only for the sake of the small percentage ofschools using this source. These 6% of administrators may be representing larger districts with manyvacancies to fill each year. Unfortunately, the analysis of the data does not go into such depth toanswer this conjecture.
With the professional demands of teaching becoming more complex, five-year educationprograms should help newly certificated teachers to be more effective educators and to adjustbetterto their first-year jobs. It would be interesting to discover in the future whether candidates completingmore years of training fare better than four-year graduates in the job market. While the research seemsto indicate that those in five-year programs are more committed to teaching than four-year graduates,it could be because five-year graduates committed more time, money, and effort to the training andwant to see such efforts pay off. As school budgets get trimmed (which seems to be a sign of thecurrent political times both at the Federal and state levels), and as supported by Table 7 (which shows40% of administrators seeing Federal and state funding leading to _reduced employment in theirdistricts), some districts may favor first-year bachelor degree teachers over first-year master degreeteachers and their higher salaries. Although this issue is not addressed directly by the data, the resultsin Table 7 imply a warning that economics may play a critical role in teacher hiring despite otherevidence supporting the need for more thorough teacher training.
This speculation that tight budgets may dictate hiring decisions places colleges offering five-year master degree programs in a catch-22 position. On the one hand, colleges and those enrolled inthese programs are trying to meet the demands of schools and society for better teachers. On theother hand, some school officials may prefer bachelor-degree graduates because of budget constraints.This hypothetical situation again illustrates the perplexities of school staffing.
Those considering education as a career must use caution when interpreting job marketstatistics through the media. The article in the Spring/Summer 1995 Managing Your Career magazineseems to indicate through its headlines and highlighted text that the market for teachers is exceedinglygood. Yet the small print in the article 'ndicates some of the same facts highlighted in this report --employment in many ways depends or certification area(s) and geographic location. A glance at thisarticle misleads a reader about the rr arket; a thorough reading of this and other sources provides amore realistic picture.
MAASCUS -26- RESEARCH
I
Common sense dictates that the more geographically flexible a teacher candidate is, the moreopportunities this person will have to find a full-time teaching job. Those who are not able or willingto move will have to explore their local markets to discover the best way to enter the profession. Asurplus of teachers may mean the path to full-time employment is through substitute teaching orserving as a teacher's aide. Although serving as a substitute teacher does not insure a fuil-time job,the administrators in this report hire more substitute teachers than previous graduates without teachingexperience. Substitute teaching may also strengthen networking relationships which rank relativelyhigh in the results in Table 10.
While there are no guarantees for employment, an education major who chooses a field or fieldsin more demand than others fields will increase his/her chances for employment (see Tables 4 and 5).Earning two or more certifications will also increase opportunities for employment. Those who chooseto pursue certification in areas with a surplus of teachers should know of the market conditions. Thissurvey shows that all elementary education areas have a considerable surplus of teachers. Schools dohire elementary education teachers since these fields make up more than half of the teaching force,but the competition for each job is intense. With all elementary education fields having a considerablesurplus of teachers, there must be a large number of these teachers, many of whom are recentgraduates, not having full-time teaching jobs. With such a reserve pool available, it is hard to. believethat opportunities for elementary education graduates in the MAASCUS region will improve significantly
in the next few years.
It is important, however, that an education major chooses a certification field(s) that is ofinterest. A person selecting special education who does not have the interest or the personalqualifications to teach in this field is unlikely to stay in education even if he/she finds a job. It may bethat elementary education is the best choice for a particular person; this person may be the one to land
a job despite intense competition. But this person should know about the market conditions beforemaking a commitment to a certification field(s).
College personnel and faculty who do not acknowledge the challenoes of the market for fieldswith a surplus of teachers are doing a disservice to their students and to the educational community.And the questions must be asked and addressed, "Should there be a limit to the number of graduatesprepared in areas with a surplus of teachers? Do teacher preparation programs have an ethicalobligation to respond to the shortages and surpluses of the market?" They are not easy questions toanswer since there are many influencing factors including the right of qualified students to choose thefield they want to major in regardless of the market.
While concerned about the current job market, those in colleges and schools must be aware
of the future as well. Education majors preparing for teaching careers now will not be entering themarket for two, three, or four or more years. Research has not been able to accurately forecastteacher hiring needs. With the many demands on teachers and the programs that prepare them,implementing a new teacher education track or revising an existing one does not take place rapidly.There may be a need for Russian and Japanese teachers as Tables 4 and 5 show, but how manycolleges employ professors qualified to prepare these teachers? If a college invests the time, effort,and money to design a new program which meets state certification standards, will there be enougheducation majors interested to enter the program to warrant the cost? Will the market still need theseteachers? The actual number of Russian and Japanese teachers needed is probably rather low. Howmany colleges should try and develop programs?
The previous speculation that tight budgets may impact school hiring also comes intoconsideration here. Many colleges preparing elementary education teachers rely on this major to attractstudents and tuition dollars to their campuses. What college will want to eliminate or significantly trima popular major and risk investing limited financial resources to develop programs which may attracta small number of students? The figures from the Bureau of Labor Statistics in Tables 2 and 3 showa projected increase in elementary teachers needed by 2005 and an aging of the current elementaryeducation teaching staff. The alarms of an impending teacher shortage sounded in the late 1980s and
the early 1990s proved false. Even with the reserve pool of teachers, which is very difficult to
MAASCUS -27- RESEARCH
measure, maybe the numbers this time are pointing to a shortage of teachers within 10 years or atleast some improvement in the job market in certain certification fields.
While the questions are complex and difficult to answer, perhaps the first step to meeting thestaffing demands of this profession is for the employers of teachers and the preparers of teachers tomake a genuine effort to understand each other better. This study does not examine cooperativeventures between schools and colleges, but with the results reported here, it certainly can beconcluded that such efforts are needed. At the very least, the information in this report should beshared with education majors so they may make informed decisions about pursuing a career inteaching.
It is clear from this survey that the current market in the MAASCUS region in many fields hasa surplus of teachers. That many administrators learn of qualified candidates through unsolicitedapplications is another indication of a surplus of teachers. Schools do not have to recruit teachersexcept in limited, high need fields. For most administrators responding, third-party employmentagencies serve an extremely limited role in teacher staffing, also implying a surplus of candidates in the
market.
There is some good news for new education graduates. MAASCUS region employers indicatethat they hire a higher percentage of new education graduates (especially from in-state institutions)than they hire teachers with experience.
What is not clear is whether the overall teachers' job market will improve significantly in thenext several years to give hope to education students that there are better times ahead. Projecting thecurrent MAASCUS market into the future casts a dark shadow on the chances of those pursuingcertifications in many popular areas of finding a job once they graduate. Yet, some of the projectionsin the literature review point to more teaching jobs in the next 10 years. Such mixed messages makethe decisions of whether to choose teaching as a career and what certification field to study difficultones for current and future education majors.
REFERFNCES
American Association of School Personnel Administrators Report (1995). Most Critical Knowledgeand Skills of a Future Educator. Sacramento, CA.
America's Teachers Ten Years After "A Nation at Risk" (NCES 95-766). U.S. Department ofEducation. National Center for Education Statistics. (1995). Washington, D.C.
Arnold, C.L. & S.A. Bobbitt (1993). Selected Tables on Teacher Supply and Demand: 1987-88 and1988-89 (NCES 93-141). U.S. Department of Education, National Center for Education Statistics.Washington, D.C.
Association for School, College and University Staffing (1995). Teacher Supply and Demand in theUnited States, 1994 Report. Evanston, IL.
Baker, T.E. & M.D. Andrew (1993). An Eleven Institution Study of Four-Year and Five-YearTeacher Education Program Graduates. Paper presented at the annual meeting of the Associationof Teacher Educators, Los Angeles, CA.
Blank, R. (1994). SASS by State, 1990-91 Schools and Staffing Survey: Selected State Results.U.S. Department of Education, National Center for Education Statistics. Washington, D.C.
Bobbitt, S.A., M.C. Leich, S.D. Whitener & H.F. Lynch (1994). Characteristics of Stayers, Movers,and Leavers: Results from the Teacher Followup Survey: 1991-92 (NCES 94-337). U.S.Department of Education, National Center for Education Statistics. Washington, D.C.
MAASCUS -28- RESEARCH

Boyd, W.L. & J.A. Raffel (1990). "Urban Education Today," Journal of Planning Literature, 5(1),22-28.
Braun, J.A., K. Green, A. Willems & M. Brown (1990). "Getting a Job: Perceptions of SuccessfulApplicants for Teaching Positions," Action in Teacher Education, 12(2), 44-54.
Choy, S.P. (1993). America's Teachers: Profile of a Profession. U.S. Department of Education,National Center for Education Statistics. Washington, D.C.
Connors, W.R. (1993). Teacher Shortages and Surpluses in New York State: Perceptions ofTeaching Candidates and Administrators. State University College of Arts and Sciences,Plattsburgh, NY.
Feistritzer, C.E. (1993). "National Overview of Alternative Teacher Certification," Education andUrban Society, 26(1), 18-28.
Gilbert, S.L. (1995), "Perspectives of Rural Teachers Toward Teaching in Urban Schools," UrbanEducation, 30(3), 290-305.
Grissmer, D.G. & S.N. Kirby. (1991). Patterns of Attrition Among Indiana Teachers (Report No. R-4076-LE). RAND. Santa Monica, CA.
Herbster, D.L., F.J. Abel, D. Bell & E. Sparapani (1991). A Flawless Method for First Year TeacherEmployment. Paper presented at the annual meeting of the Association of Teacher Educators, NewOrleans, LA.
Keating, P. (1995). "Careers in Education," Community Jobs, The National EmploymentNewspaper for the Non-Profit Sector, May 1995, p. 1,4-5.
Maryland State Department of Education (1994). Teacher Supply and Demand in Maryland 1994-1996. Baltimore, MD.
New York State Department of Education (1992). Projections of Public School ClassroomTeachers: New York State 1992-93 to 1996-97. Albany, NY.
Oregon Department of Education (1992). 1992 Educator Reserve Pool Study. Eugene, OR.
Pallas, A.M., G. Natriello & E.L. McDill (1989). "The Changing Nature of the DisadvantagedPopulation Current Dimensions and Future Trends," Educational Researcher, 18(5), 16-22.
Snyder, J.F., A.S. Doerr, & i A. Pastor (1995). Perceptions of Preservice Teachers: The JobMarket, Why Teaching, and /flternatives to Teaching. Slippery Rock University, Slippery Rock, PA.
Strauss, R.P. (1993). Whcf Should Teach in Pennsylvania's Public Schools? Carnegie-MellonUniversity, Pittsburgh, PA.
Thompson, G. (1995). "Teaching Boom: A Surprising Solution to the Career Puzzle," ManagingYour Career, Spring/Summer 1995, p. 10-11.
Zimpher, N.L. (1989). "The RATE Project: A Profile of Teacher Education Students," Journal ofTeacher Education, 40(6), 27-30.
MAASCUS -29- RESEARCH