Embed Size (px)
Citation preview
DOCUMENT RESUME
ED 245 870 RC 014 825
TITLE Washington State Johnson O'Malley Indian EducationAnnual Report 1982-83.
INSTITUTION Washington Office of the State Superintendent ofPublic Instruction, Olympia.
PUB DATE Dec 83NOTE 62p.; For related document, see RC 014 826. For
earlier annual reports see ED 170 086 and ED 141049.
PUB TYPE Reports Descriptive (141)
EDRS PRICE MF01/PC03 Plus Postage.DESCRIPTORS *American Indian Education; Attendance Patterns;
Cultural Awareness; Dropouts; Educational Finance;*Educational Objectives; Elementary SecondaryEducation; *Federal Programs; High School Graduates;Mathematics Skills; Parent Participation; *ProgramDescriptions; *Program Effectiveness; ProgramProposals; Reading Skills; School CommunityRelationship; School Counseling
IDENTIFIERS *Johnson 0 Malley Act; *Washington
ABSTRACTIn 1982-83, the 18 school districts and 1 tribe
receiving Johnson O'Malley funds for American Indian education inWashington attempted to increase reading and mathematics proficiency,improve Native American high school graduation rates, and promotecultural awareness activities in schools with high Native Americanenrollments. By limiting their objectives and using parentvolunteers, the programs kept their comi;ittent to improvingeducational opportunities for Native American children and resultedin a generally steady academic gain, despite reduced funding. JohnsonO'Malley funding'for the projects provided $237,000 (down $27,000from 1981-82) plus $28,690 from 1982 funding for 1,695 students. Theprograms focused on cultural reinforcement (leadership development,career awareness, life skills) and on positive interaction amongparent committees, staff, and local education agency officials. Theprograms had several difficulties during the year. Despite increasedcounseling efforts, high school dropout rates rose. Also, budgetreductions restricted inservice opportunities. Further problemsinvolved improving staff-Native community relations, increasingparent committee participation, and encouraging student participationin school activities. The objectives and evaluations of the 19programs are included. The report includes a directory ,of the lohnsonO'Malley programs and describes other state and federal programsproviding benefits to American Indian public school students. (SB)
***********************************************************************Reproductions supplied by EDRS are the best that can be made
from the original document.***********************************************************************
Wobshington.....:-..--.St ate
Johnson ' alleyU.S. DEPARTMENT OF EDUCATION.
NATIONAL INSTITUTE OF EDUCATION[DUCAT, /ANAL RESOURCES INFORMATION
CENTER (ERIC,V`rhis loci/me/it has been reproduced as
ri.ceivert from the person or organizationoriginating it
Minor changes have been made to reprovereproduction
Points view Of Op.tliOttS sidled in this documen' 'Jo not necessarily epresent official NIEp05.1,00 or policy.
Education Pro
For Indian Children
"PERMISSION TO REPRODUCE THISMATERIAL HAS BEEN GRANTED BY
t;,
t=
ag.ehlttracm
TO THE EDUCATIONAL RESOURCESINFORMATION CENTER (ERIC).-
WASHINGTON STATE
_JOHNSON-O'MALLEY INDIAN EDUCATI
1982-83 ANNUAL REPORT
FRANK B. BROUILLETState Superintendent of Public Instn,
MONA H. BAILEYAssistant Superintendent
Division of Instructional Programs
WILLARD E. -BILLSupervisor of Indian Education
KARLENE GEORGEConsultant
December, 1983
Johnson-O'Nalley Report Letter
The following report reflects the activities of Johnson-O'Nallev (j0M)programs as administered by the Office of Indian Education within theWashington State Superintendent of Public Instruction (SPI) for fiscalYear 1983. Eighteen school districts and one Indian tribe conductedtheir programs in cooperation with SPI ar: the Supervisor of IndianEducation. These 19 programs report to I regarding progress in indi-vidual programs, and this report is a compilation of those documents.
Individual program directors have made the best possible use of diminish-ing educational resources from the JON program. They have had to operatetheir educational programs with fewer funds than they have had in pastyears. Educational funds have also been reduced in Title IV, Part A,which is another of the primary sources of funding for Indian youthattending public schools in Washington State. Even though resourceshave been reduced, program directors have continued to provide individualacademic support to Indian students. Assistance is often in the form oftutoring, counseling, or el:. mral enhancement of self concept. Schooldistricts have often alloca!_-.1 funds from their budgets to offset budgetreductions in JON and other categorical funds for K-12 Indian youth.
In summary, the JON program concentrated on several educational areasduring the 1982-83 school year. First, 19 programs directly aided Indianstudents in grades K-12 (as well as one pre-school operated by the PortCamble Kialiam Tribe) within the State of Washington. Second, the Indianeducation program assisted in the organization and presentation of the"Toward the Year 2000" Conference which addressed eight major educationalissues relevant to multicultural equity education. Third, the servicesand expertise of the Washington State Native Ame can Education AdvisoryCommittee (WSNAEAC) were utilized in providing sLatewide advice to theSupervisor of Indian Education within SPI. Fourth, a research componentwas implemented into the iSPI Indian Education Office in cooperation withgraduate student Craig Landon. Fifth, the process for conducting theFirst Annual Washington State Indian Education Conference was begun.Sixth, the Supervisor of Indian Education served on several SPI educa-tion committees relevant to Indian education. Seventh, the SPI IndianEducation Office disseminated. Indian education inforn'tion to tear-.hersand other interested persons throughout Washington State as well as tomany other states within the United States and persons in Canada.Finally, a working group was formed to develop an American Indian hightechnology policy statement.
Contents
Historical Summary 1- 3
Overview 3-16
--Overall Objectives 7-10
Financial Data 11-14
--Annual Contract Amounts 19
--Breakdown of Fiscal 1982 JOM Carryover Funds Allocatedand Utilized for September, 1983, Program Operation 13
Final. Financial Report for Fiscal 1983 JOM Funds. . 14
Statistical Data 15-17
-Final Summary of Form F -168 16
-Summary of Statistical and T,,.sting Data 17
School District/Tribal Program Descriptions. 18-46
--Map Showing JOM Program Locations 19
--1983 JOM Program Emphases 20-21
--Individual JOM Program Descriptions withEvaluative Results 22-46
Other Special Programs Serving Indian Childrenin Washington Public Schools 47-49
Johnson O'Malley Directory 50-52
Historical Summary of the Johnson-O'Malley Program
The initial relationship of the American Indian to the federal governmentwas that of Nation to Nation.
Recognition of this unique status was Ivistorically documented throuellensuing formal agreements (or treaties) between various Indian natices andthe federal government.
The federal government, in response to specifically documented treaties orthrough assumed moral responsibility, began in the early part of the 19thcentury to make provisions for Indian education, using establishedsectarian schools or, in some cases, federally operated institutions.
Such ':ederal and religiously oriented educational efforts pre-datestatehood in most states, with American Indians generally being considered
subjects of the United States, residing on unorganized territory.
In 1871, Congress discontinued the policy of entering into treaty agree-ments with I.Idian tribes. For the next half century, the federal govern-ment continued to assume the major responsibility for Indian educationthrough the actual operation of "government schools" or by paying theequivalent of non-resident tuition to public school districts enrollingIndian children.
This early effort: was implemented by legislative authority contained in theBureau of Indian Affairs Appropriation Act of February 14, 1920.
Regulations adopted in that Act were nominally in effect as Part 33, Title25--Indians, Code of rederal Regulations (CFR) until the passage of P.L.93-633, the Indian Self-Determination and Educational Assistance Act, whichbecame law on January 4, 1975.
By and large, the educational endeavor of the Bureau of Indian Affairs(BIA) during this period focused priMarily on Indian reservations whichwere surrounded by land in public domain or tceritcrial status.
The transfer of responsibility for Indian education from the federalgovernment to individual states is a direct result of two basic factors:(1) all lands within the continental United States were by this timeorganized into states, each with a constitution or enabling legislationproviding educational opportunities for all state citizens; and (2) theCitizenship Act of 1924 granted American citizenship to all Indiansresiding within the continental Unite.: States.
Therefore, legally (by virtue American citizenship and Indian rirlIt!;under the 14th Amendment of the ee.iteJ States Constitution) the respo:e:i.hility for American Indian (1.1eat n i. kneed by each state and the lealschool districts within.
But financial problems rem,: d, stemming from the tax-exempt status ofIndian-owned lands held in leral trust. T'eaties or agreements exemptingIndian-owned lands from taxa, on curtail the tax base of those school
-1-
districts which rot- 3... e tracts s-ich lands. T:':3.rticuia fleciee
are school rl;sricts that 'tistorigallv inance LOC,12L ca'ti
chrough real property taxes.
Although the legal responsibility of eqviality in American education(regardless of race. color or creed) rests within each state, the __'de cal
goyernrxent recognized its res,ponsHilty for assiL.ting states under certainrcum -
The Johnson-O'Malley (JON) Act of Apri 1 16, 1934 (48 Stat, 596), an ameniedby the Act of June 4, 1936 (49 State. 1458), and by P.L. 93-638, pollidedthe legal authority--among other l-enefits--for financially a.!-:sistin sEattis
in their responsibility for educa.ing Indians vho are one-fourth degree ofIndian blood and recognized by the Sacretary of the Interior as eligiblefor 11IA services.
Before 1958, the Johnson-O' Nallev program was a BASIC federal aid programsrecifically designee; to help public schools educate Indian children fromreservations and other Indian-owned, tax-exempt land.
On August 12, 1958, P.L. 81-874 (administered through the Department ofHealth, Education and Welfare) which provided financial assistance topublic schools, was amended to include assistance for educating children,residing on tax-exempt Indian lands.
This broader-based federal aid program met most of the basic financialneeds of eligible school districts impacted by non-taxed Indian-lands.
Subsequently, the JOM program became a SUPPLEMENTAL aid program geared tooffset the financial deficit of unmet extraordinary and exceptional casesof need.
Johnson-O'Malley funds are node available to states based on separate plansnegotiated between the PIA and the respective states or tribal corporationsfor the express purpose of supplmentirw federal assistance for educationof Indian children in public ,z7hools. These funds, in turn, areTministered by the states Lporations to supplement local
educational programs.
The policy of the BlA between 1-958 and 1975 was to distribute JOM funds ona needs lisis. Each contracting agency received an amount of JOM fundsanally. distributed on the basis of criteria including the size of thenriinn population being served, financial hardship to schoolcaused by tax-exempt Tridim 1:7nds, the degree of educatconal deprivation of11dian student ItH Hprivation of Indian families.
The regulation 'te.r_' pe n :975 to implement P.L. 93-638 introduced a newconcept for t ,try cf services to Indian children through JOM funds.
o The program is community based with decisions made by the Indiancommunity through its parent education committee.
The allocati-Jn of funds to states and other service areas is based onthe number of children to he served through a weighted per capitadistribution formula. Need is not a criterion for the allocation offunds to contracting entities.
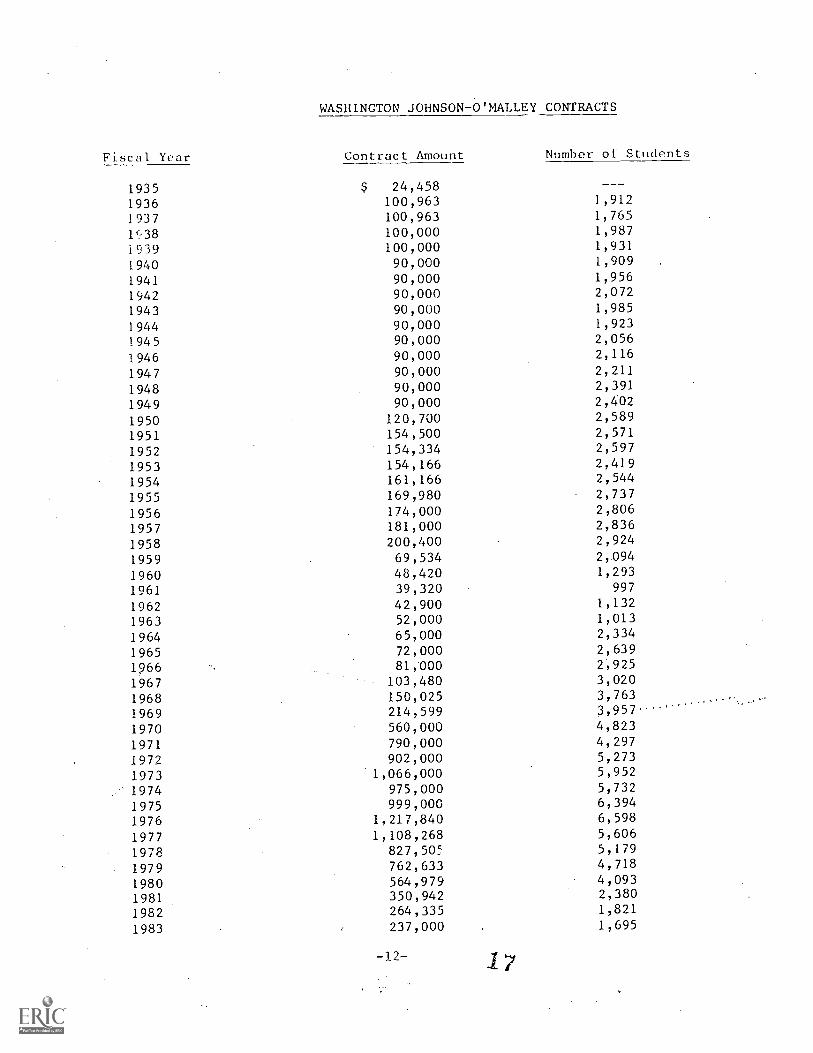
Cai&iornia was the first state to enter into a JOM contract in fiscal year1915. in the sane year, the State of Washington also contracted for andreceived $24,455 in SC'. funds. Washingtc)n has administered JOM funds every-fear sinc-± 1935. The contract for fiscal year 1982 was in the amount of$264,335.
The Duraai presently contracts for services with Indian tribes, tribalcorporations, individual school districts, and state departments ofeducation in four states.
The first two tribal contracts were finalized in 1970. Since the passageof the Indian Self-Determination and Educational Assistance Act (P.L.93-633), aany tribal groups are contracting for JOM services.
Since the regulations give priority to reservation-based Indian students,not all Indian students attending public schools are affected by the JOMAct. However, where Indian parents and school districts identify spec;.alneeds of nonreservation Indian students, they may apply foi funds underP.L. 92-318, Part IV-A.
As of October 1, 1362, there were 5,084 Indiau children eligible for BIAservices enrolled in public schools in Washington. In addition to these,there were 984 such children enrolled in tribal schools within the State,for a total of 6,068.
Overview of Johnson-O'Malley Operations in Washington During 1983Eligibility:
The Washington State Plan for the ed.--lrion of Indian children under theu-O'Malle c: forth ctiteria for eligibility in compliance withA-638 as :ollows:
A. Eligible Age\cies
E;i7.ih!c
organize:,
igible Students
tocal :school districts, Indian parentIndian tribes.
Section 273.12 of P.L. 93-638 provides the criteria for studenteligibility.
"Indian students, from age 3 years through grade(s) 12,except those who are enrolled in Bureau or sectarian;operated schools, shall be eligible for L-Alefits provided bya contract pursuant to this Part if they are 14 or m,rede,g,ri-e Indian blood and recognized by the 1.etary beingel;Aible for Bureau services, Priority shall be given toco.stracts (a) which would serve Indian students on or near
-3-
8
reservations :and (b) where a majority of such Indianstudents will be members of the tribe(s) of suchreservations (as defined in Section 273.2 (o))."
it should be understood that although educational agencies andparent coLlittittees assist in the identification of eligiblestudents, the full responsibility for determining eligibilityrests with the Bureau of Indian Affairs.
.lost of the school districts in Washington State that are eligible toreceive JO!! grants are located in rural or semi-rural areas. Several canbe categorized as remote and necessary. Their financial base does notusually allow for expenditures in excess of what is needed to carry out abasic educational program. Therefore, if the needs of Indian pupils are tobe net adequately, special programs must be undertaken which requiresupplemental funding from sources beyond the ordinary resources of theschool district.
"rioritv in Fundin
The federal law (quoted above) specifies that contracts (a) which wouldserve Indian students on or near reservations and (b) where a majority ofsuch Indian students will be members of the tribe(s) of such reservationshall receive priority. It is the policy of the Superintendent of PublicInstruction to give primary consideration to such contracts.
In addition to the federal priorities, the Superintendent c bli_
Instruction ises the following criteria in considering propo:. is from Locaia' \genrios requesting JOM funds:
i. Documented needs of eligible Indian children2. Geographic isolation of schools and tudents3. Availability and use of other categorcal funds4. Evidence that proposed act `ties are addressed to identified
student needs; see 273.18 (g) (4)5. Evidence of effective cooperation between the school district and
the parent education committee in program development,implementation, ongoing program reporting and evaluation
6. Total'number of eligible students7. 74illingness of the school district to comply with reporting
requirements for JOM programs.
Puruuse
Since the Johnson-O'Malley Act authorizes funds to be expend 2d for theexpress benefit of Indian childton, the thrust of the State JOM program hasbeen directed toward meeting the special needs of these hildren. Programpriorities are established at the ocal school level in a cooperativeeffort between school officials and Indian parents. In Cie programdevelopment and implementation process, it is emphasized that the Indianparent committee must exercise decision-making powers. These powers do not,.preempt the legal authority of the school district and its officers, butserve to guarantee effective Indian input for the JOM program.
Local projects generally are directed toward, but are not necessar ylimited to, the following State JOM program goals:
6NE To identify, develop or adapt, and make available educationalopportunities, activities, materials and services that help Indian childrendevelop language proficiency, cultural and ethnic awareness, career optionawareness, occupational and recreational skills and competence in basicacademic areas.
TWO To provide educational opportunities, .ctivities, materials andservices that conform to each child's individual language, tribal, culturaland ethnic awareness.
THREE lo provide educational opportunities, activities, materials andservices that meet economic anc social needs; that make possible anincrease in each child's successful experiences and a decrease in hisfailures; and that assist each chili to develop and measure the success ofan individual learning style that is self-initiated.
FOUR To train local Indian parent education committees for involvementin tangible, productive ways--in the planning, implementation, andevaluation of opportunities, activities, materials and services providedfor Indian children.
FIVE To provide opportunities, activities, materials and s,rvices thatincrease the pertinent skills and awareness of those who have impact uponIndian children, such as school administrators, teachers, counselors,para-professionals, home staff .1pd other agency or institution personnel.
SIX To provide project monitoring, educational accomplishment auditingand Indian program evaluation that will ensure fiscal and program account-ability at federal, state and district levels; and that will be based uponprecise, continuous measurement of institutional and learner objectives.
SEVEN To provide opportunities, activities, information or services thatwill disseminate project materials relating to educational practices proveneffective for Indian children; and that will promote the spread from oneschool district to another of such proven practices.
Applications and Reports
The format of the JOM application contains the following information:
The top of the cover page contains space for school district identifi-cation, amount requested, amount approved and signatures of the schooldistrict superintendent, the JOM parent euucation committee chairperson andthe State Supervisor of Indian Education.
Part I requests JOM committee names, JCM program staff names and sources ofother fu'ids used in the program, if any.
Part II is an estimate of Indian and non-Indian enrollment for tl-,e programapplication year.
10
P,rt TfT is the _,aside:
columns as follows:
a four-oa:,,2 foldout containing five raral lei
(4. Indian Community Goals 3. Evaluation Procedures
A. broad Educational Coals and C. Project Component (Activities)
Xeasurable Annual Objectives D. Component Cost (Budget)
Components of JON nrogram can be da.veloped in the afortmentionedsequence, showing separate information for each component.
In this format, each local program component or activity can be prioni-
tized, budge!7eJ and evaluated separately.
jUM report F-168 i. an adoption of the Bureau of Indian Affair's enrollment
report tom with some additions. It provides reporting space for alleligible st-:dents by age and grade, transfers in as well as out, number of
dropouts, number of counseling sessions, and achievement scores in reading
and math. The request for average daily attendance was changed to percentof attendance for Indians only. This gives a better basis for district to
district comparisons and yearly totals. The front-page summary of 1..c,rm
F-168 for 19 JON programs is shown elsewhere in this report.
The back of Form provides for the reporting of formal evaluation results in
each district. The form is keyed to the objectives and evaluation criteriastated in the original application. Copies of individual participatingdistrict reports were sent to the Portland Area Office of the Bureau ofIndian Affairs.
The evaluation reports also appear with the individual project descriptionsof this document.
Reporting Procedures
Repotts from JOM programs to the state office are consolidated and listedon a program calendar. Through the response and cooperation of allconcerned, the result of this action is that all the program informationcontained in this report is derived from the previously described documentsreceived from each school district: the program application (Form E-376)
and the final evaluation report (Form F-I68).
Parent Education Committee Activities and Developments
.1()Y. reulaions require "maximum Indian participation in all aspects of
educaton,4.1 program development and implementation." ConsiLtent with this
requirement, the Supervisor of Indian Education made site visitations in
cooperation with all local parent committees several times per year. In
the fall, group inservice training workshops are conducted on a regional
basis to provide information and skills to assist parents in fulfillingtheir role in working with schools for the benefit of their children. In
March and April, the Supervisor of India Education met with each committee
and the local program staff to conduct an annual program review.
-6-
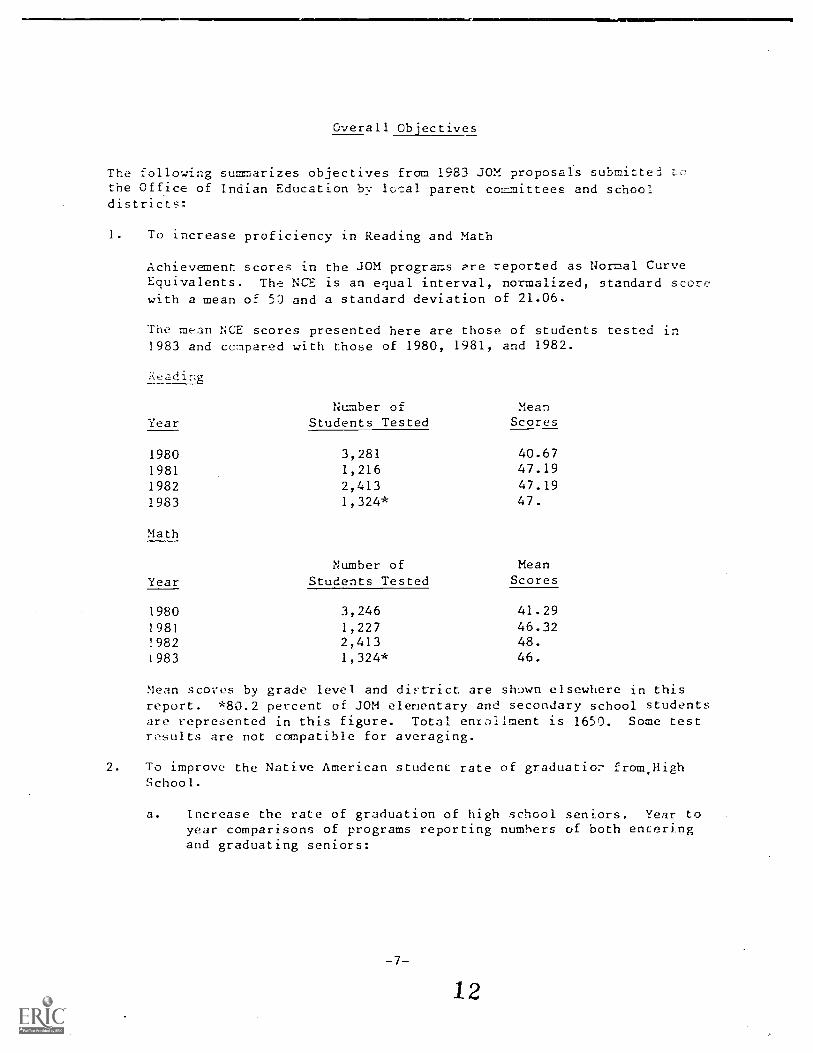
Overall Objectives
The following summarizes objectives from 1983 JOM proposals submitted Lcthe Office of Indian Education by local parent committees and schooldistricts:
1. To increase proficiency in Reading and Math
Achievement scores in the JOM programs Pre reported as Normal CurveEquivalents. The NCE is an equal interval, normalized, standard scorewith a mean of 50 and a standard deviation of 21.06.
The mean NCE scores presented here are those of students tested in1983 and compared with those of 1980, 1981, and 1982.
ceding
Number of MeanYear Students Tested Scores
1980 3,281 40.67
1981 1,216 47.19
1982 2,413 47.19
1983 1,324* 47.
Math
Year
1980
198119821983
Number of MeanStudents Tested Scores
3,2461,2272,4131,324*
41.2946.3248.46.
Mean scores by grade level and diFurict are shown elsewhere in thisreport. *80.2 percent of JOM elementary and secondary school studentsare represented in this figure. Total enrollment is 1650. Some testresults are not compatible for averaging.
2. To improve the Native American student rate of graduation from,HighSchool.
a. Increase the rate of graduation of high school seniors. Year toyear comparisons of programs reporting numbers of both enteringand graduating seniors:
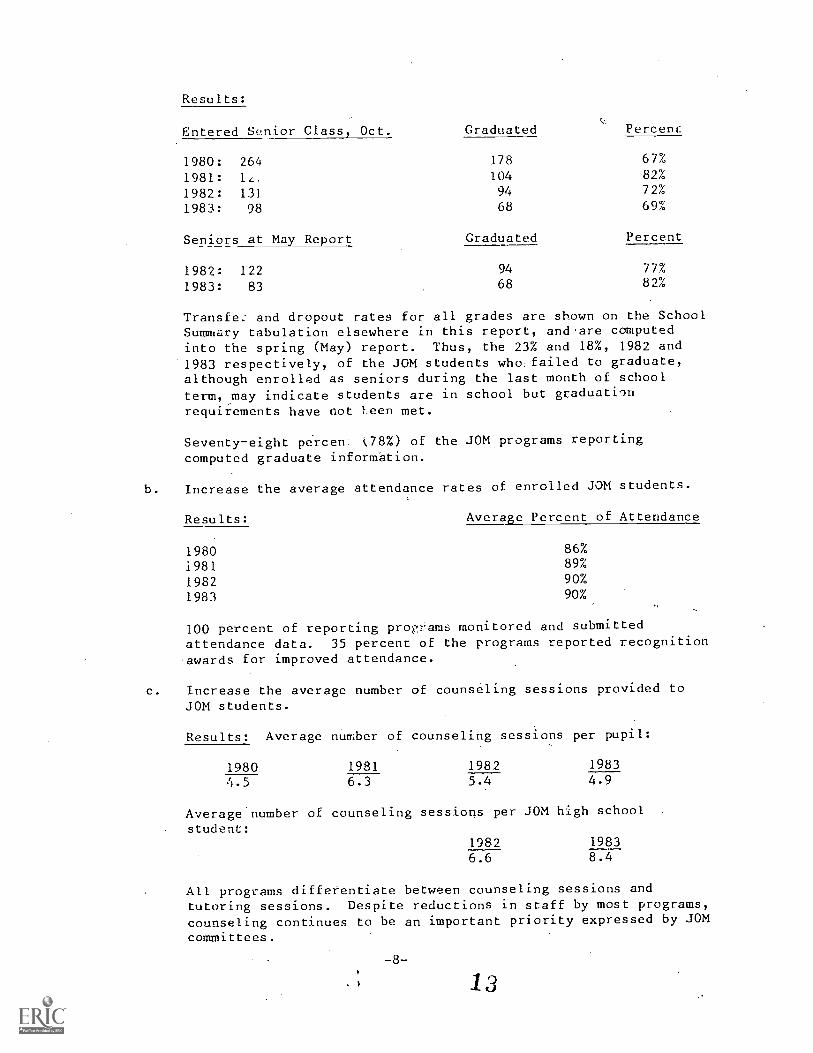
Results:
Entered Senior Class, Oct. Graduated Percent
1980: 264 178 67%
1981: l'z; 104 82%
1982: 131 94 72%
1983: 98 68 69%
Seniors at May Report Graduated Percent
1982: 122 94 77%
1983: 83 68 82%
Transfe: and dropout rates for all grades are shown on the SchoolSummary tabulation elsewhere in this report, and.are computedinto the spring (May) report. Thus, the 23% and 18%, 1982 and1983 respectively, of the JOM students who:failed to graduate,although enrolled as seniors during the last month of schoolterm, may indicate students are in school but graduation
requirements have not 1.een met.
Seventy-eight percent k78%) of the JOM programs reportingcomputed graduate information.
b. Increase the average attendance rates of enrolled JOM students.
Results: Average Percent of Attendance
1980 86%
1981 89%
1982 90%
1983 90%
100 percent of reporting pro&ams monitored and submitted
attendance data. 35 percent of the programs reported recognitionawards for improved attendance.
c. Increase the average number of counseling sessions provided toJOM students.
Results: Average number of counseling sessions per pupil:
1980 1981 1982 1983
4.5 6.3 5.4 4.9
Average number of counseling sessions per JOM high schoolstudent:
1982 1983
6.6 8.4
All programs differentiate between counseling sessions andtutoring sessions. Despite reductions in staff by most programs,counseling continues to be an important priority expressed by JOMcommittees.
-8-
13
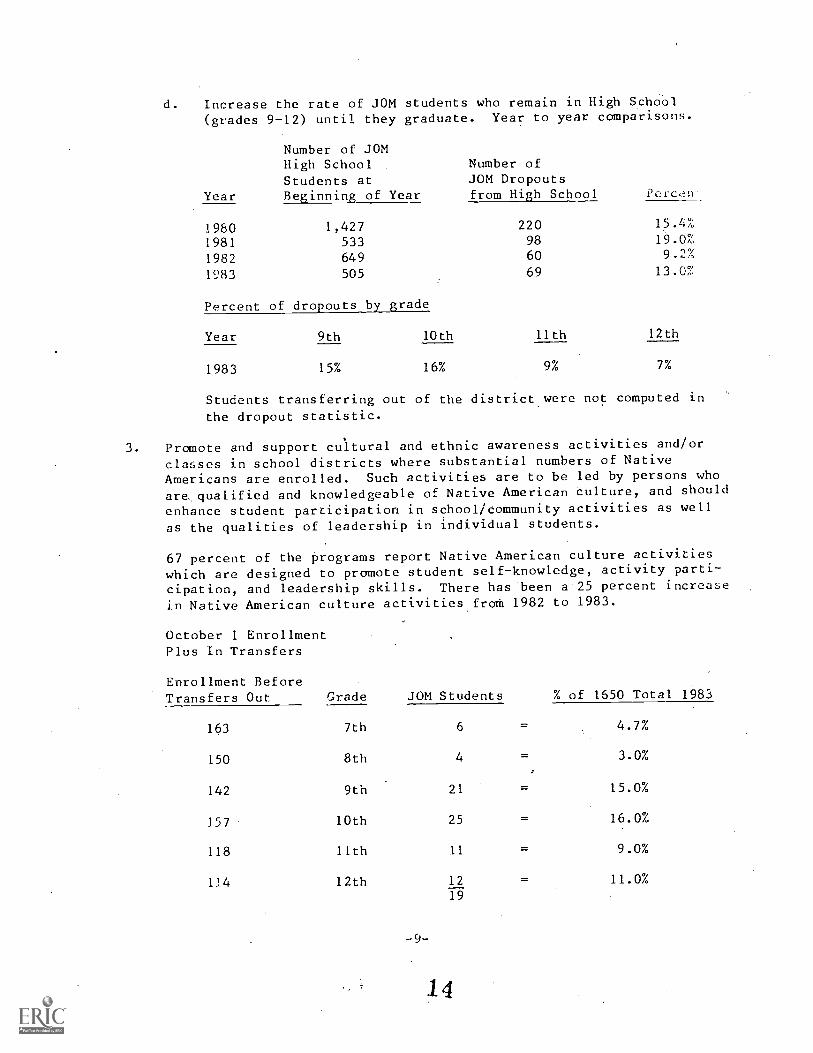
d. Increase the rate of JOM students who remain in High School(grades 9-12) until they graduate. Year to year comparisons.
Year
Number of JOMHigh SchoolStudents atBeginning of Year
Number ofJOM Dropoutsfrom High School Percn.
1980 1,427 220 15.4%: .
1981 533 98 19.0%
1982 649 60 9.2%
1983 505 69 13.W.:
Percent of dropouts by grade
Year 9th 10th 11th 12th
1983 15% 16% 9% 7%
Students transferring out of the district were not computed in
the dropout statistic.
3. Promote and support cultural and ethnic awareness activities and/or
classes in school districts where substantial numbers of Native
Americans are enrolled. Such activities are to be led by persons who
are, qualified and knowledgeable of Native American culture, and shouldenhance student participation in school/community activities as well
as the qualities of leadership in individual students.
67 percent of the programs report Native American culture activities
which are designed to promote student self-knowledge, activity parti-
cipation, and leadership skills. There has been a 25 percent increase
in Native American culture activities from 1982 to 1983.
October 1 EnrollmentPlus In Transfers
Enrollment BeforeTransfers Out Grade JOM Students % of 1650 Total 1983
163 7th 6 = 4.7%
150 8th 4 = 3.0%
142 9th 21 = 15.0%
157 10th 25 = 16.0%
118 Ilth 1.1 = 9.0%
114 12th 12 = 11.0%
19
-9-
14
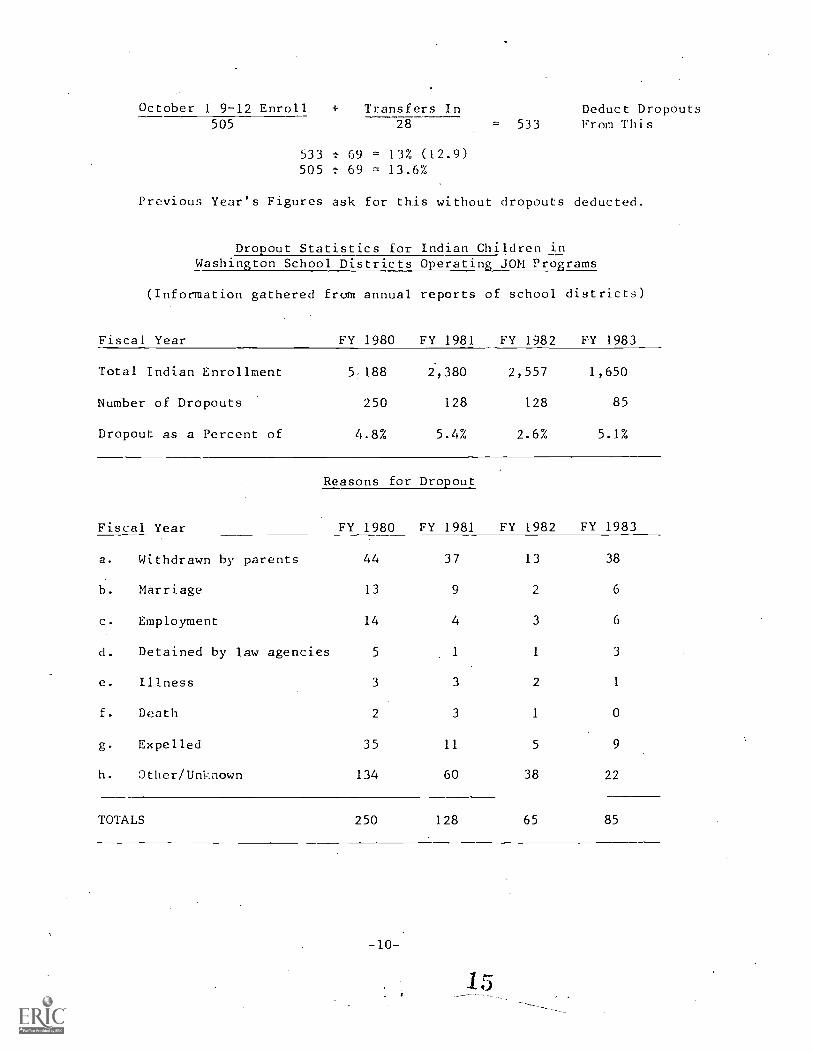
October 1 9-12 Enroll_ Transfers In Deduct Dropouts505 28 = 533 From This
533 69 = 13% (12.9)505 69 = 13.6%
Previous Year's Figures ask for this without dropouts deducted.
Dropout Statistics for Indian Children inWashington School Districts Operating JOM Programs
(Information gathered from annual reports of school districts)
Fiscal Year FY 1980 FY 1981 FY 1982 FY 1983
Total Indian Enrollment 5,188 2,380 2,557 1,650
Number of Dropouts 250 128 128 85
Dropout as a Percent of 4.8% 5.4% 2.6% 5.1%
Reasons for Dropout
Fiscal Year FY 1980 FY 1981 FY 1982 FY 1983
a. Withdrawn by parents 44 37 13 38
h. Marriage 13 9 2 ') 6
c. Employment 14 4 3 6
d. Detained by law agencies 5 1 1 3
e. Illness 3 3 2 1
f. Death 2 3 1 0
g. Expelled 35 II 5 9
h. Other/Unnown 134 60 38 22
TOTALS 250 128 65 85
FINANCIAL DATA
16
Fiscal
WASHINGTON JOHNSON-O'MALLEY CONTRACTS
Year Contract Amount Number of Students
1935 $ 24,458
1936 100,963 1,912
1937 100,963 1,765
11-38 100,000 1,987
1939 100,000 1,931
1940 90,000 1,909
1941 90,000 1,956
1942 90,000 2,072
1943 90,000 1,985
1944 90,000 1,923
1945 90,000 2,056
1946 90,000 2,116
1947 90,000 2,211
1948 90,000 2,391
1949 90,000 2,402
1950 120,700 2,589
1951 154,500 2,571
1952 154,334 2,597
1953 154,166 2,419
1954 161,166 2,544
1955 169,980 2,737
1956 174,000 2,806
1957 181,000 2,836
1958 200,400 2,924
1959 69,534 2,094
1960 48,420 1,293
1961 39,320 997
1962 42,900 1,132
1963 52,000 1,013
1964 65,000 2,334
1965 72,000 2,639
1966 81,000 2,925
1967 103,480 3,020
1968 150,025 3,763
1969 214,599 3,957-1970 560,000 4,823
1971 790,000 4,297
1972 902,000 5,273
1973 1,066,000 5,952
1974 975,000 5,732
1975 999,000 6,394
1976 1,217,840 6,598
1977 1,108,268 5,606
1978 827,505 5,179
1979 762,633 4,718
1980 564,979 4,093
1981 350,942 2,380
1982 264,335 1,821
1983 237,000 1,695
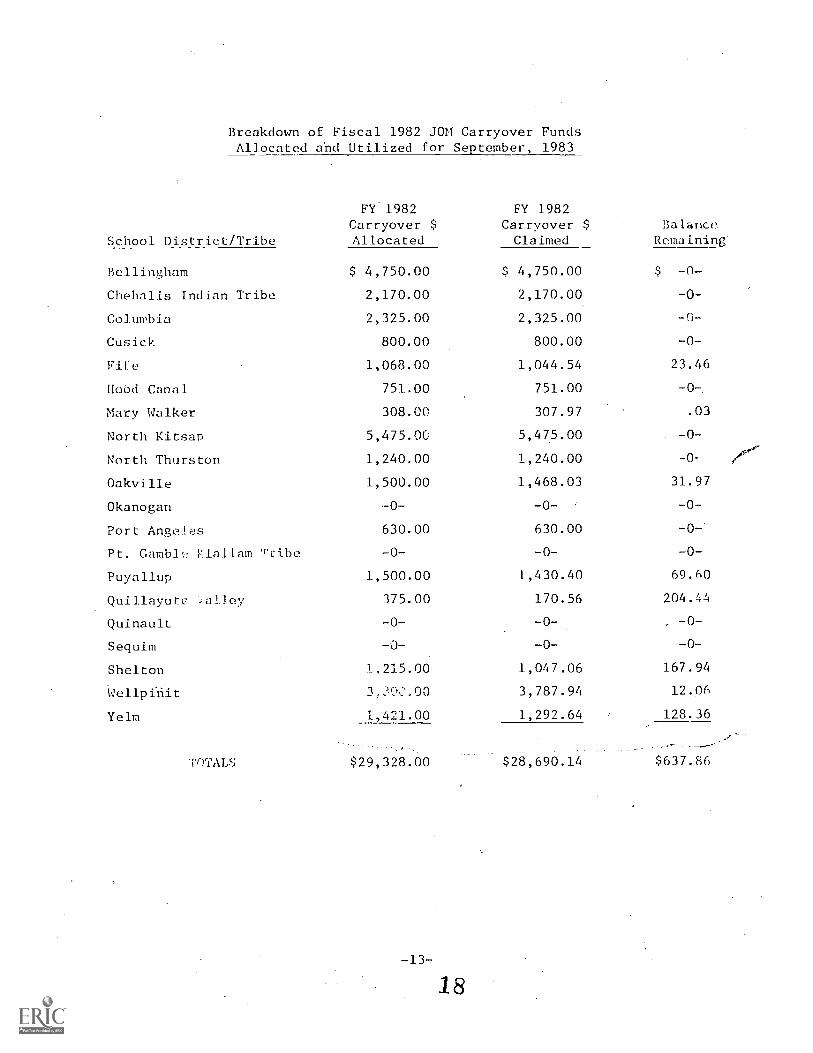
Breakdown of Fiscal 1982 JON Carryover FundsAllocated and Utilized for September, 1983
Balancer.
Remaining'School District/Tribe
FY 1982Carryover $Allocated
-FY 1982
Carryover $Claimed
Bellingham $ 4,750.00 $ 4,750.00 $ -0-
Chehalis Indian Tribe 2,170.00 2,170.00 -0-
Columbia 2,325.00 2,325.00 -0-
Cusick 800.00 800.00 -0-
Fife 1,068.00 1,044.54 23.46
Hobd Canal 751:00 751.00 -0-.
Mary Walker 308.00 307.97 .03
North Kitsan 5,475.00 5,475.00 -0-
North Thurston 1,240.00 1,240.00 -0-
Oakville 1,500.00 1,468.03 31.97
Okanogan -0- -0- ' -0-
Port Angeles 630.00 630.00 -0-'
Pt. Cambl Klallam Tribe -0- -0- -0-
Puyallup 1,500.00 1,430.40 69.60
Quillayute .alley 375.00 170.56 204.44
Quinaulc -0- -0- . -0-
Sequim -0- -0- -0-
Shelton 1,215.00 1,047.06 167.94
Wellpfriit 3,300.00 3,787.94 12.06
Yelm 1,421.00 1,292.64 128.36
TOTAL $29,328.00 $28,690.14 $637.86
-13-
18
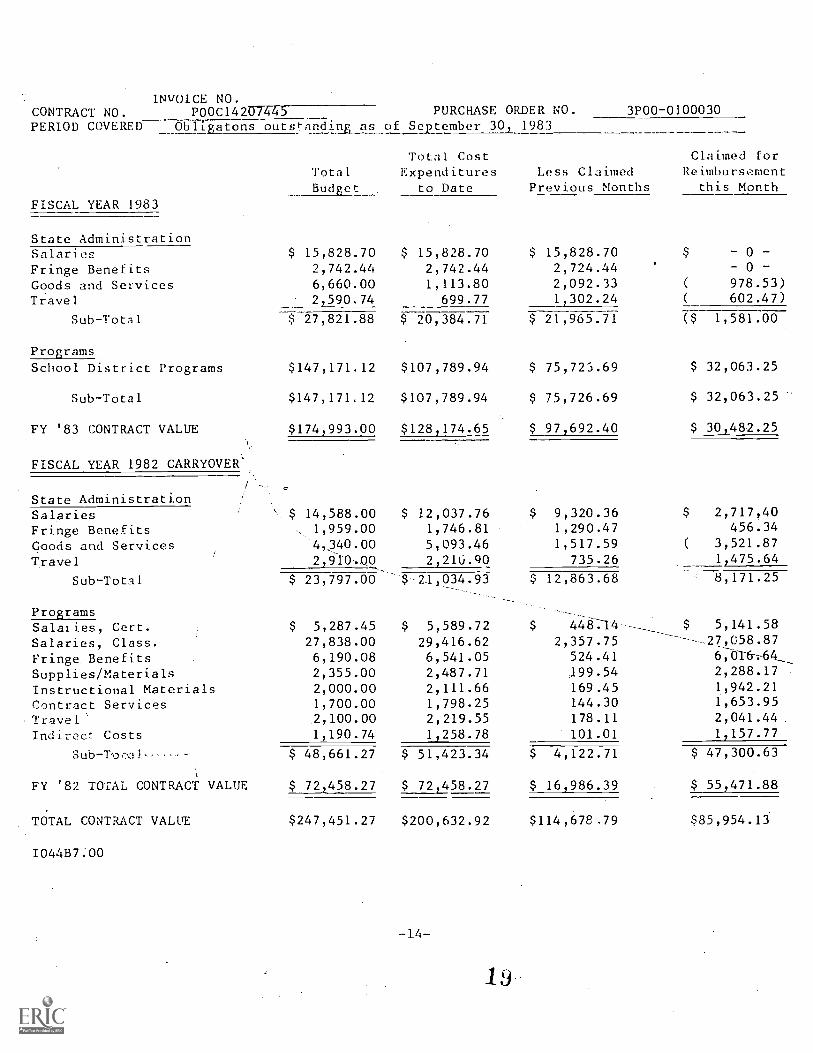
INVOICE NO.CONTRACT NO. POOC14207445 PURCHASE ORDER
of September 30,NO. 3P00-0100030
PERIOD COVERED Obligatons outst -anding as 1983
FISCAL YEAR 1983
Total CostTotal ExpendituresBudget to Date
Claimed forLess Claimed ReimbursementPrevious Months this Month
State AdministrationSalaries $ 15,828.70 $ 15,828.70 $ 15,828.70 0
Fringe Benefits 2,742.44 2,742.44 2,724.44 0
Goods and Services 6,660.00 1,113.80 2,092.33 ( 978.53)Travel 2,590.74 699.77 1,302.24 602.47)
Sub-Total $f7,821.88 $ 20,384.71 $ 21,965.71 ($ 1,581.00
ProgramsSchool District Programs $147,171.12 $107,789.94 $ 75,725.69 $ 32,063.25
Sub-Total $147,171.12 $107,789.94 $ 75,726.69 $ 32,063.25
FY '83 CONTRACT VALUE $174,993.00 $128,174.65 $ 97,692.40 $ 30,482.25
FISCAL YEAR 1982 CARRYOVER.
State AdministrationSalaries $ 14,588.00 $ 12,037.76 9,320.36 $ 2,717,40
Fringe Benefits 1,959.00 1,746.81 1,290.47 456.34
Goods and Services 4040.00 5,093.46 1,517.59 ( 3,521.87
Travel 2,910-.00 2,2111.90 735.26 1,475.64
Sub-Total $ 23,797.00 21,034.93 $ 12,863.68 8,171.25
ProgramsSalaries, Cert. $ 5,287.45 $ 5,589.72 $ 448:14 $ 5,141.58
Salaries, Class. 27,838.00 29,416.62 2,357.75 -27,058.87
Fringe. Benefits 6,190.08 6,541.05 524.41 6;016:64
Supplies/Materials 2,355.00 2,487.71 199.54 2,288.17
Instructional Materials 2,000.00 2,111.66 169.45 1,942.21
Contract Services 1,700.00 1,798.25 144.30 1,653.95
,Travel 2,100.00 2,219.55 178.11 2,041.44
Indiroct Costs 1,190.74 1,258.78 101.01 1,157.77
$ 48,661.27 $ 51,423.34 $ 4,122.71 $ 47,300.63
FY '82 TOTAL CONTRACT VALUE $ 72,458.27 $ 72 458.27 $ 16,986.39 $ 55,471.88
TOTAL CONTRACT VALUE $247,451.27 $200,632.92 $114,678.79 $85,954.13
1044B7:00
STATISTICAL DATA
20-15-
C/1
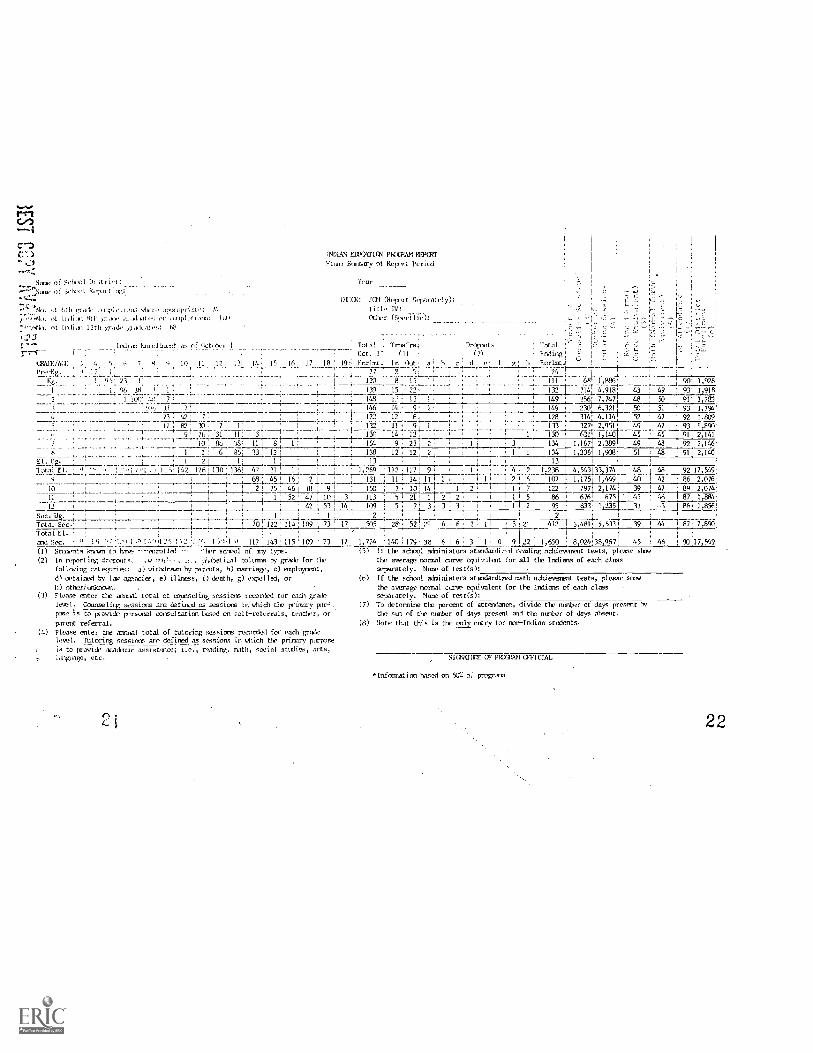
NT8AN ELLICIATICN PlifritAM RITCRT
Strmary of Rep,rt Period
Nrr., of Schuol 1)1 at 6,1: Yeart'INal.. of tkl1,1 t i
t No. 1444 1 gr. le , rIP 1 l' [ 10. ,A le, appropriate: 74....,/;.,-
*(':.:44,/ '3, I',1,/ 811, tmadc ,ma..1,,,it, or espletlott.:: 1,t/
:,":4;0. of [0.1;. 12th god.' paduates: 68 .
s---7-1-- i T
- - 1,11,a) Enrol Lax:mt as of (),/t c/1-,...-
tRAIIIIACI: 1 4 5 6 7 4 `1 10 11 12
95- 23 I./ 1.36 31 1 I : !
. , .100' :.:`, 77 .
_'.. .1041_11 7 1
, 73-1-47 7.1'-, -. .
5 ' 12 ./.. X/ ' 7 ,,,, 1 9 76: 31'
10'. fk. ` :8 I 1! 6!
1 71I,..,,,,I 01. . q,....., ..,-:::, ,t,','/ _/." 142 126_113_0i
9 L 1
10 1.- 1 -I : '
... _.,1
i
12 1'
- .---i
t
85', 33: 12] 1 1 : 138 12 . 12 2 . i ' 1 ' 1 ' 1:1/4
I: 13 ' , 13
ila:(1.:/. Jai (lipport t;//parately):Title IV: - .;./ "ti
1...L1 ?...Otta, (Speci f ic):
1:7".
1 oct. 1 '. 011 Total . Trrmfrs-__._
131 It 15 16. 17 18 I9'-' EnrImt; In :Out a ; h c
Dropo.it, Total ."(2) Irkr,
Earlmt-i:
1--1
, .
120 8 15 il , , ,. 1 III . 684 )2.1, 901 1,9281! - --/-----,: . 1394 15' 22 1 1 1-; ' 132 214,4,918/ 43 : 49 93' 1,918
; 148 , I.- / 13, I ' , : ' ___.' ' 149 256, 7,747; 48 50 911 1,783'' ___1 149 2301 6,3211 50 51 ' 931 1,7%', 146 , 14 ' 9 2 ' ' 1 ' '
7 : ; 122 1 12 6, '1 128 3141.7,114/ 5? 47 1 921 1.E091
-t ' I-,- /
H , ' , i ' II : 9 1 , ' . ' ! 1 133 127/ 2,951, 49 1 47 ' 931 1,890'1--III 3 ' ' 130 ' 14 13 r, - 1 , , I 1 1 130 I 6311 1,1401 45 1- 45 ! 91; 2,1411
t:5,51 11 1 8 ; I ; -i 15: 9 " 23i 2, 1 i ! 3 ' 134 I,167t 2,3391 49 48 I 32/ 2,146'
_I i ; , i
136! 47 ' 21', 1_1. ' ' 1,269 '112 127/ 9, I : I , 4: 2 1-..1_2_238
68' 4541 16..; 2 131 ] II ; 14,1111 1,111 21 6' 10?J.1__ 2 1 75: 46 1 18 ; 9 I . 150 7 , IlY 14 1 1 1 1 2 I 1 I 7 ! 122
' 101 3 113 / 5 21 1 1 2 " 2 , ' 1 ' 5-1- 86j_i-_----1,. /
._-_. J.___ : 42 53 1 14 1 109 ; 5 1 7/ 3. 3 , 3 / 1121 95
Sec. Ug. ' ' ' I ' , Ij 2 ' 1 I . r ; I 2
1,336! 1,908: 51 48 q 911 2,1401 1
1 1
4,54313_3,374 48 i 48 1 92117,54911,175' 1,4491 40 1 42 i 861 2,0761
7971 2,174. 39 1 47 89/ 2,0741. 676, 675 45 46 87' 1,8841
831, 1,235 33 .51 86; 1,8561/ 1/
Total. Sec.: ' '* ' _l_ 70 ; 122 ' 114 ' 109 73 1 17 505 . 28- . 52 ! 70 6 - 6 ' 2 - 1 1 5 ! 2( 417 3.481, 5,513 1 39 1 44 1 87 , 7,893
Total El.ad tee. .. " l'i a: -1.',1 s" ,t'..125 -I ', 2 ; -'r, I l'll i. 117 ' 143 ' 115 109 73 17
(1) Snrients ',own to haw 7- -onrot I al ./., 'Irr school of m-iy tyiv.(2) In ruporting dropouts, , Id rn1,,-- ..., ::: . ..1165}ti,3741 croltmos by grade for the
following .tegories: a) wit_trJrn-ai by partmts, h) marriage, c) employumnt,dl detained by la./ agenci, e) illnins, 0 death, g) e;melled, orh) otheriittecra.m. .
.
(3) ?Lease triter the annual total of comseling sessiens recorded for each gradelevel. Ccunselirg sessions are defined as sc-tssions in which tIe primary pirr'., .
pre 1 t L., pi Jri dr, Nrsonal consultation based on self-RA-Urfa:5, tractor, orparmt referral.
(4) please enter tie anrnial total of tutoring s.isions recurdol for each gradelevel. Ilitoring sessions are defined as sessions in uttich the primary purposeis to provide acacksnic assistance; i.e., rmding, math, satin] studies, arts,
- lawmge, etc.
0
1,774 '140 179' 38 6 6 3 1 . 0 9 12 1,650 8,02438,967' 45 ! 46 93 17,549'(5) If dr school administers stankiardi.- 41 reading achicvnuEnt tests, please slaw
the average neural curve equi,alent for all the Indians of each dimsseparately. Name of test(s):
(6) If the school administers stfridardimed math athieument tests, please six,'the :1,5/age normal curve equivalent for the Indiarm of each classseparately. Name of rest(s):
(7) To determine Or percent of attendance, divide the ntral,r of days preneot 1sttie son of tle ember of days present and the nuntrr of days alvent.
(41) Note that this is the only entry for con-Indian students.
51t2'7A1 CF PHOGiAl.] CF11 CIAL
*Inforinatirm hosed on 5Ct of program
22
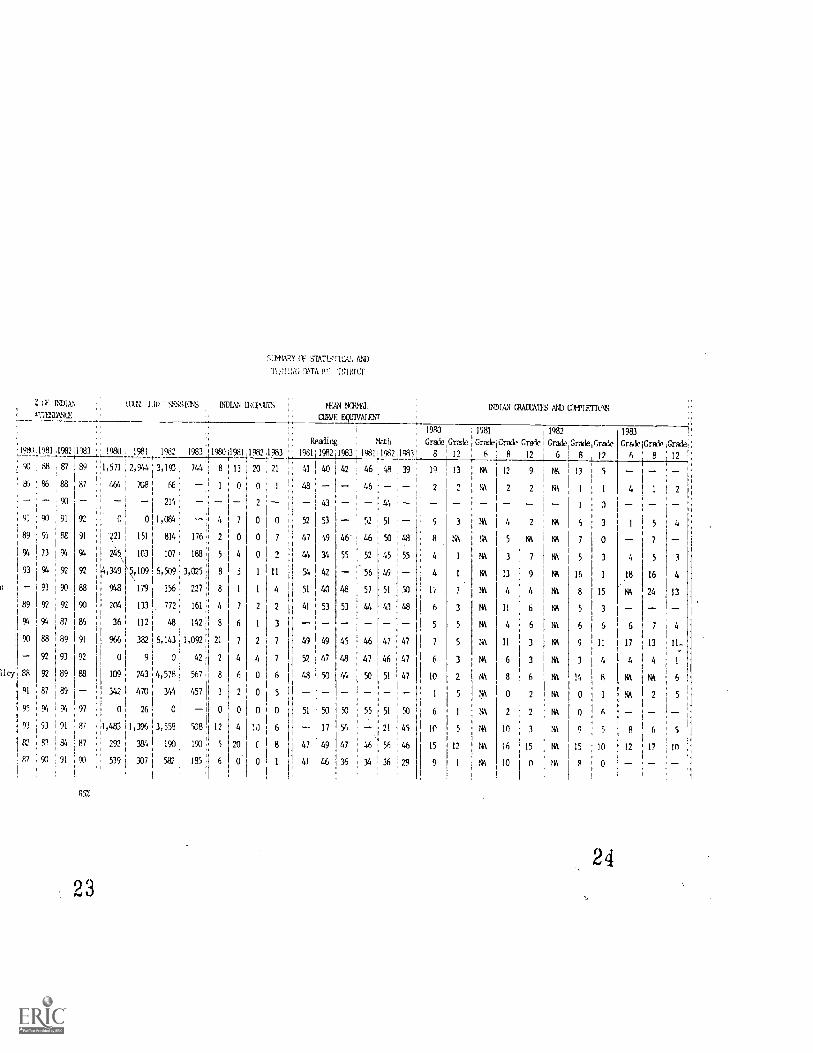
;tFt1ARY (F STATLt=nt.AL AND
12L4; (TA
2 tF NIII.AN 11.X7?-1,11' 48SSICN8 INDLAN Lln.IA.U11;
ATTaaNNtlt:tf.1AN WW1
CUINE EqIIVAIENT
INDIAN MANNIT'S AND atINET11.18
I'M() 1981119821983 1980 , 1981 1982 1983 4198011981,1982 1983
90 88 87 89 : :1,571 I 2,944 ' 3,193 744 8 13 I 20 , 21I
;
85 86 88 87 464 I 208 ; 66 I 0 ; 0 1
1,
' I, - 90 _ __ _ 214 ; _ __ _ 2
I 1
-_
II 9: , 90 91 92 . 0 01 1,084 1 4 7 0 1 0
89 91 88 91 221 151 ! 814 176 2 0 0 1 7
94 73 9-1 94 245 183 II 107 I 188 5 4 0 2
I
93 94 92 92 4,349 '9,109 6,5Cr9 3,025 8 5 1 Iiin 93 90 88 1 948 179 356 227 8 1 I 4 I
I
89 92 92 90 2041
1 133 I 772 161 4 7 2 2
9 4 5 4 87 M 36 I 1 1 2 I 4 8 142 8 6 1 31
90 88 89 91 966 tI
192 i 6,143 i 1,092 21 7 2 7
92 93 92 0 1 9 i 0 1 42 2 4 4 7
I t'ley 88 92 89 88 109 t 243 .4,578 567 8 6 0 6I i
91 87 I 89 342 I 470 , 344 457 3 2 0 5
95 94 1 94 97 0It
26I
0 II 0 0 0 01 ;
93 93 191 87 1,486 i 1,396 I 3,558 508 12 4 1J 6
g2 81 I 84 87 292 it 384 1 190 190 5 20 6 8I i
87 90 I 91 90 539 t 307 580 185 6 0 0 t 1
857
23
I 1980 1981
Math Grade Grade Gradel Crack ,Gradeilea'198i2n.81983198 I 19811198241983 8 1 2 6 ; 8 12
-1-1241 40 42 46 48 39 19 13 NA 9
48 --46.--- 2 2 146 2 2
__ 43 __ ! __ 44 _ __ _ -52 53 ' 52
I
51 9 3 I ND 4 2
47 49 46' 46 50 48 8 NA 1N 5 ND
44 34 55 52 45 55 4 I NA 3 7
54 42 56 49 4 1 NA 13 9
51 40 48 57 51I
14) li 7 ND 4 4
41 53 53 44 43 48 6 3 NA 11 I 6
- _- __ _- __ - 5 5 NA 4 6
1 49 49 45 46 47 47 7 5 NA 11 3
52 47 48 47 46 I 47 6 3 ND 6 3
I
48 50 44 50 51 t 47 10 2 NA 8 6
_ _ _ _ , t - 1 5 NI 0 2
51 50 50 55 51 : 50 6 I NA 2 2
I
17 54 - 21 1 45 10 5 NI 10 3
47 49 47 46 56 46 15 12 NA 16 15
41 46 36 36 36 29 9 1 111 10 0
1982
Grade,Grade Grade1983
GradelGra17, Grade ,6 8 12 6 ; 8 , 12 ;
NA 13 5
NI I 1 4 1 2
1 0
ND 6 3 5 4
NA 7 0 7
NI 5 3 4 5 3
ND 16 1 18 16 4
NA 8 15 NA 24 13
NA 5 3
NA 6 6 6 7
NA 9 11 17 13 11..
ND 3 4 4 4 1
ND 14 8 NA NA 6
NA 0 NA 2 5
NA 0 A
NA 9 5 A 6 5
NA 15 10 12 17 18
IN 8 0
24
SCHOOL DISTRICT PROGRAM DESCRIPTIONS
-19-
25
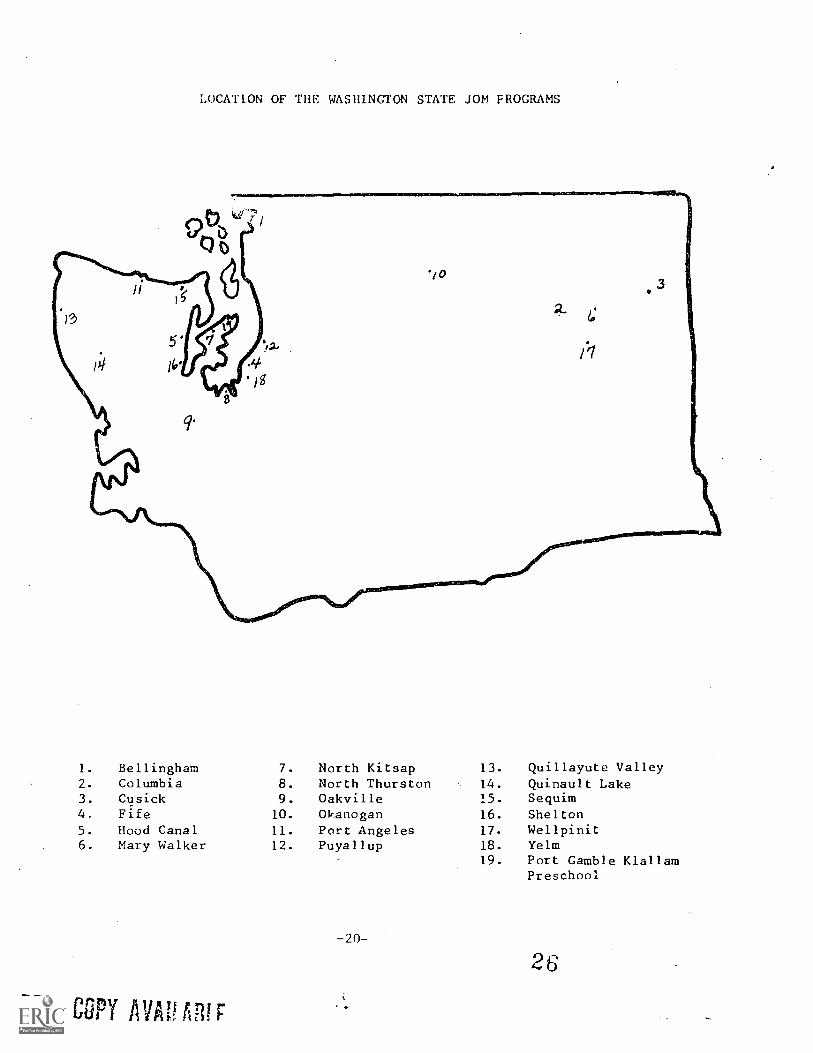
LOCATION OF THE WASHINGTON STATE JON FROGRAMS
1. Bellingham 7. North Kitsap 13. Quillayute Valley2. Columbia 8. North Thurston 14. Quinault Lake3. Cusick 9. Oakville 15. Sequim4. Fife 10. Okanogan 16. Shelton5. Hood Canal 11. Port Angeles 17. Wellpinit6. Mary Walker 12. Puyallup 18. Yelm
19. Port Gamble KlallamPreschool
-20-
BEST COPY AVAVARIF
26
PROGRAM EMPHASIS 1983
Due to changes in funding levels, most districts revised their overalleducation programs to meet the constraints of fluctuating local andnational economies. These factors had an impact on the general quality andscope of regular, special, and supplemental services to all students withinour state. The 1983 JOM programs endeavored. to maintain quality service toeligible students despite adjustments necessary for compliance with localschool district practices.
One method of achieving this was to limit and tighten objectives by whichthe more consLcint goals are to be reached. For example, programs reportedmajor academic tutoring efforts in the areas of reading, math and languagcarts, and fewer in social studies, science, and other subjects.
As staff was cut back, in many districts and programs, more parentvolunteers were enlisted to provide assistance to JOM students. Mostprograms reported that students were maintaining a steady year -to-year gainacademically. All programs attempted to acknowl-dge and reward academicachievement in various ways in order that learuing, as a value, wasreinforced.
Cultural reinforcement, traditionally a vital part of the JOM programfocus, incorporated a variety of developmental activities for meetingcultural objectives. Many programs encouraged the development ofleadership skills. By utilizing tribal and Native American communityactivities, the programs strengthened the concepts of relevancy betweenskills taught in school and-skills applied to "real life." Awareness ofcareer opportunities available on reservations, or in services to NativeAmerican people, also became a part of the cultural components of JOMprograms. Program implementation--tha critical element of every proposal- -
has increasingly become the responsibility of JOM parent committeeguidance. This is as it should be and most programs included regularly .
Scheduled opportunities to facilitate parental involvement. Although themajority of JOM programs fund supervision and administration, some programscombine these duties, and those of direct service, so that qualified staffpersons serve in both capacities--usually assisted by school officials.Many program activities focused on positive interaction between parentcommittees, staff and local educatiod agency officials in order that allparties might understand student needs and program practices. This wasaccomplished most successfully in programs in which there was a high levelof parent committee participation and a knowledgeable program director.
Early childhood education is still an area in which JOM programs have needto explore. A notable exception is the Port Gamble Klallam Preschool whichhas as its focus the readiness of Native American children for the kinder-garten experience. In operation for two years, the impact, of the programis being noted in the kindergarten and first grade prograMs at this time.
Since its inception, JOM goals have reflected a desire for qualified staffpersons whose skills and awareness of the unique needs of Native Americanstudents enable them to provide apt and sensitive service to them. A3 itis necessary to upgrade skills continually, and to avail staff of sound andinnovative educational practices, inservice and continuing education hasbeen an important component of the JOM programs. This year, there were
-21-
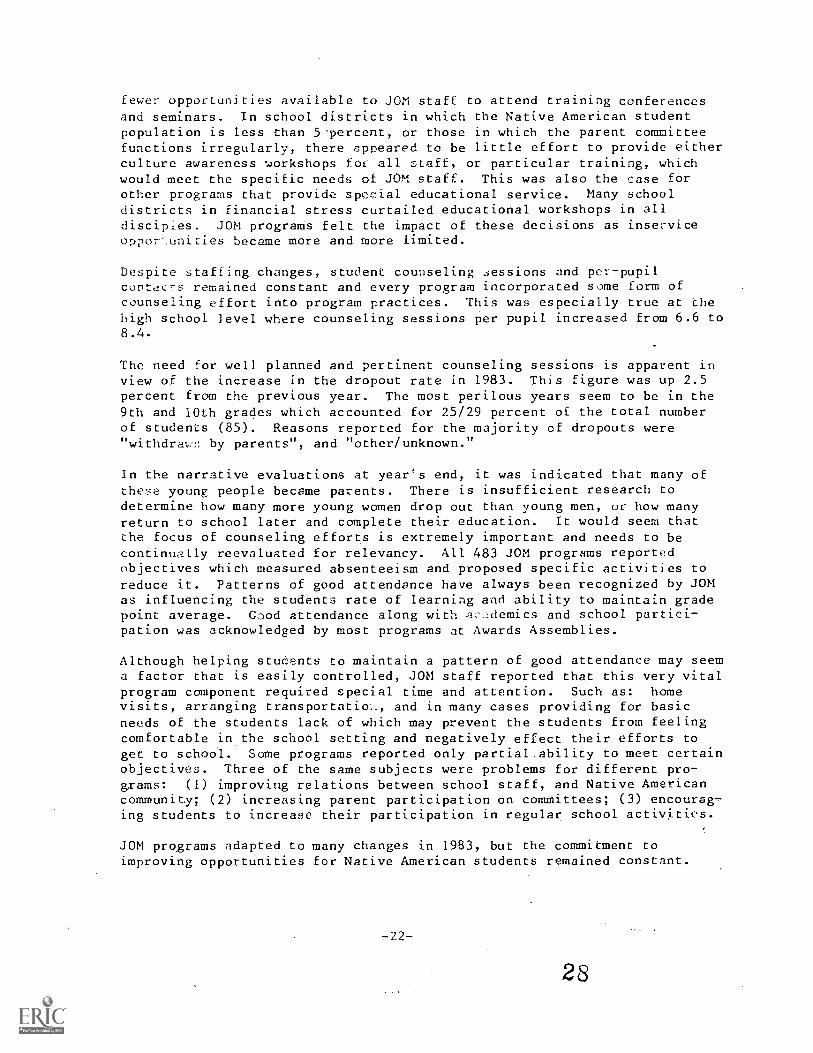
fewer opportunities available to JON staff to attend training conferencesand seminars. In school districts in which the Native American studentpopulation is less than 5-percent, or those in which the parent committeefunctions irregularly, there appeared to be little effort to provide eitherculture awareness workshops foi all staff, or particular training, whichwould meet the specific needs of JOM staff. This was also the case forother programs that provide special educational service. Many schooldistricts in financial stress curtailed educational workshops in alldiscipes. JON programs felt the impact of these decisions as inserviceoDpor*unities became more and more limited.
Despite staffing changes, student counseling .iessions and per-pupilcontacr-s remained constant and every program incorporated some form ofcounseling effort into program practices. This was especially true at thehigh school level where counseling sessions per pupil increased from 6.6 to8.4.
The need for well planned and pertinent counseling sessions is apparent inview of the increase in the dropout rate in 1983. This figure was up 2.5percent from the previous year. The most perilous years seem to be in the9th and 10th grades which accounted for 25/29 percent of the total numberof students (85). Reasons reported for the majority of dropouts were"withdrawn by parents", and "other/unknown."
In the narrative evaluations at year's end, it was indicated that many ofthese young people became parents. There is insufficient research todetermine how many more young women drop out than young men, or how manyreturn to school later and complete their education. It would seem thatthe focus of counseling efforts is extremely important and needs to becontinually reevaluated for relevancy. All 483 JOM programs reportedobjectives which measured absenteeism and proposed specific activities toreduce it. Patterns of good attendance have always been recognized by JOMas influencing the students rate of learning and ability to maintain gradepoint average. Good attendance along with a::'_:demics and school partici-pation was acknowledged by most programs at Awards Assemblies.
Although helping stu6ents to maintain a pattern of good attendance may seema factor that is easily controlled, JON staff reported that this very vitalprogram component required special time and attention. Such as: homevisits, arranging transportatim., and in many cases providing for basicneeds of the students lack of which may prevent the students from feelingcomfortable in the school setting and negatively effect their efforts togec to school. Some programs reported only partial.ability to meet certainobjectives. Three of the same subjects were problems for different pro-grams: (1) improving relations between school staff, and Native Americancommunity; (2) increasing parent participation on committees; (3) encourag-ing students to increase their participation in regular school activities.
JON programs adapted to many changes in 1983, but the commitment toimproving opportunities for Native American students remained constant.
-22--
23
INDIVIDUAL PROJECT DESCRIPTIONS
Each participating school district submitted a proposal for Johnson-O'Malley funded activities at the beginning of the program year. Th'seproposals described the specific needs, objectives and activities to beencompassed by the Johnson-O'Malley project in each school district.
In March, near the close pf the program year, each participating schooldistrict was asked to submit a joint evaluation of the project, prepared byschool personnel and Johnson-O'Nalley parent committee members. Finalreports were submitted after the programs closed in July.
The following descriptions and evaluations summarize information derivedfrom the above sources.
-23-
2.9
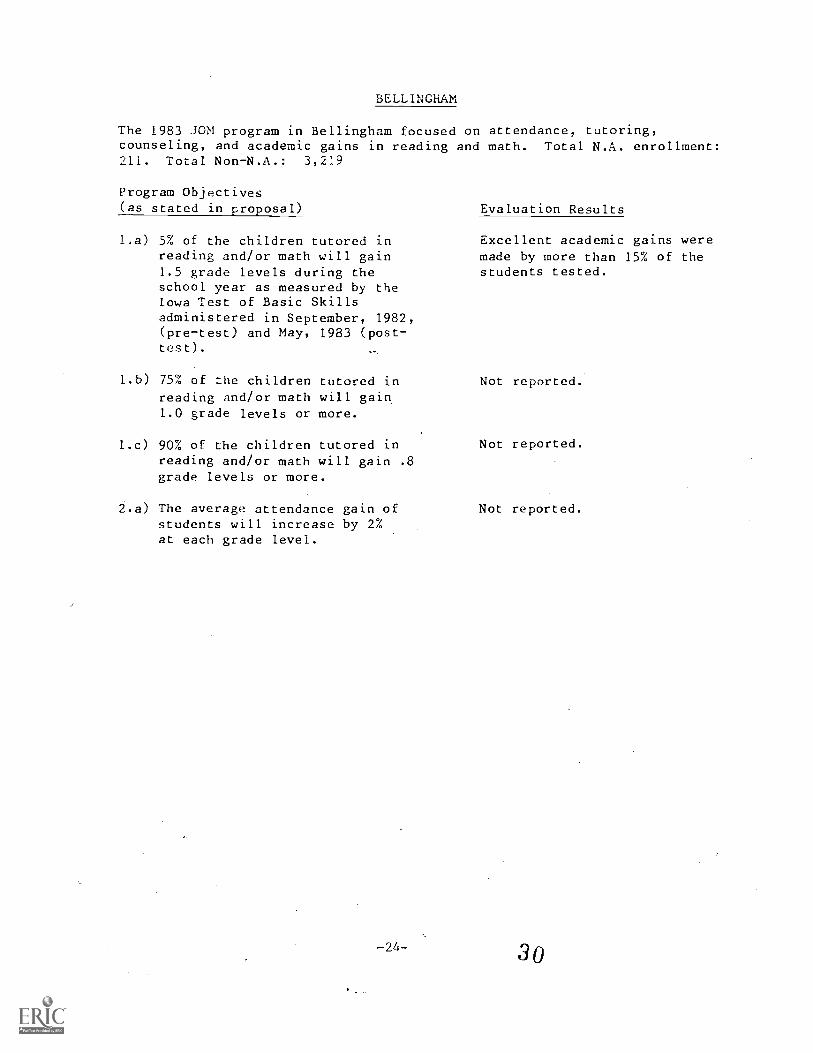
BLLINGHAM
The 1983 JON program in Bellingham focused on attendance, tutoring,counseling, and academic gains in reading and math. Total N.A. enrollment:211. Total Non-N.A.: 3,219
Program Objectives(as stated in proposal) Evaluation Results
1.a) 5% of the children tutored inreading and/or math will gain1.5 grade levels during the
Excellent academic gains weremade by more than 15% of thestudents tested.
school year as measured by theIowa Test of Basic Skillsadministered in September, 1982,(pre-test) and May, 1983 (post-test).
1.b) 75% of the children tutored inreading and/or math will gain
Not reported.
1.0 grade levels or more.
1.c) 90% of the children tutored in Not reported.
reading and/or math will gaingrade levels or more.
.8
2.a) The average attendance gain of Not reported.students will increase by 2%at each grade level.
-24- 3o
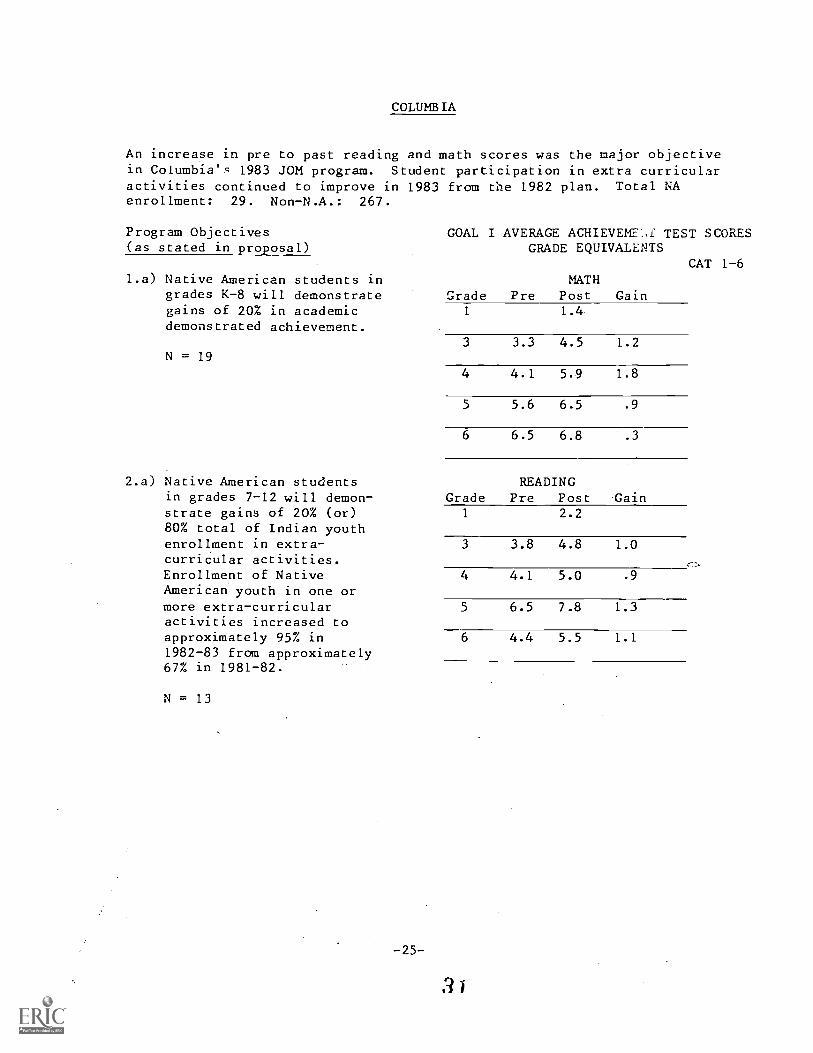
COLUMBIA
An increase in pre to past reading and math scores was the major objectivein Columbia'q 1983 JOM program. Student participation in extra curricularactivities continued to improve inenrollment: 29. Non-N.A.: 267.
Program Objectives(as stated in proposal)
1.a) Native American students ingrades K-8 will demonstrategains of 20% in academicdemonstrated achievement.
N = 19
2.a) Native American studentsin grades 7-12 will demon-strate gains of 20% (or)80% total of Indian youthenrollment in extra-curricular activities.Enrollment of NativeAmerican youth in one ormore extra-curricularactivities increased toapproximately 95% in1982-83 from approximately67% in 1981-82.
N = 13
1983 from the 1982 plan. Total NA
GOAL I AVERAGE ACHIEVEMEI,f TEST SCORESGRADE EQUIVALENTS
CAT 1-6MATH
Grade Pre Post Gain1 1.4
3 3.3 4.5 1.2
4 4.1 5.9 1.8
5 5.6 6.5 .9
6 6.5 6.8 .3
GradeREADING
Pre Post Gain
-25-
1 2.2
3 3.8 4.8 1.0
4 4.1 5.0 .9
5 6.5 7.8 1.3
6 4.4 5.5 1.1
3i
CUSICK 1983 report was not submitted in time for inclusion in this report.
-26- 32
FIFE
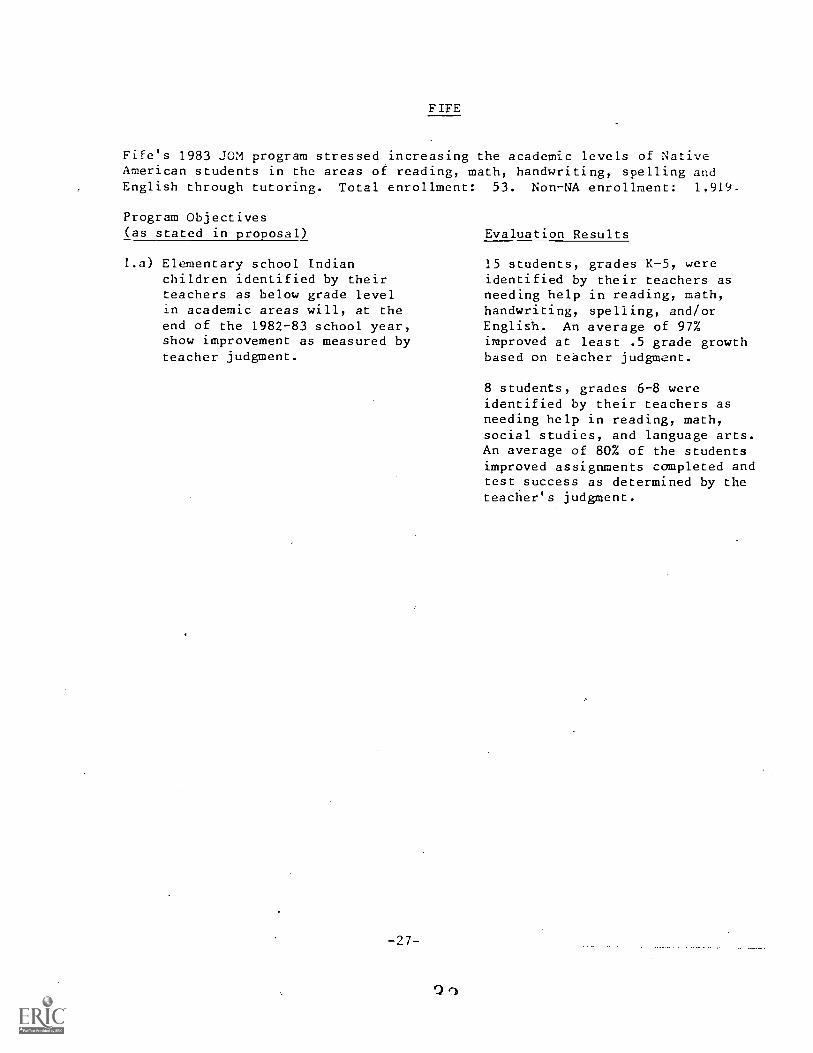
Fife's 1983 JON program stressed increasing the academic levels of NativeAmerican students in the areas of reading, math, handwriting, spelling andEnglish through tutoring. Total enrollment: 53. Non-NA enrollment: 1,919.
Program Objectives(as stated in proposal)
1.a) Elementary school Indianchildren identified by theirteachers as below grade levelin academic areas will, at theend of the 1982-83 school year,show improvement as measured byteacher judgment.
-27-
Evaluation Results
15 students, grades K-5, wereidentified by their teachers asneeding help in reading, math,handwriting, spelling, and/orEnglish. An average of 97%improved at least .5 grade growthbased on teacher judgment.
8 students, grades 6-8 wereidentified by their teachers asneeding help in reading, math,social studies, and language arts.An average of 80% of the studentsimproved assignments completed andtest success as determined by theteacher's judgment.
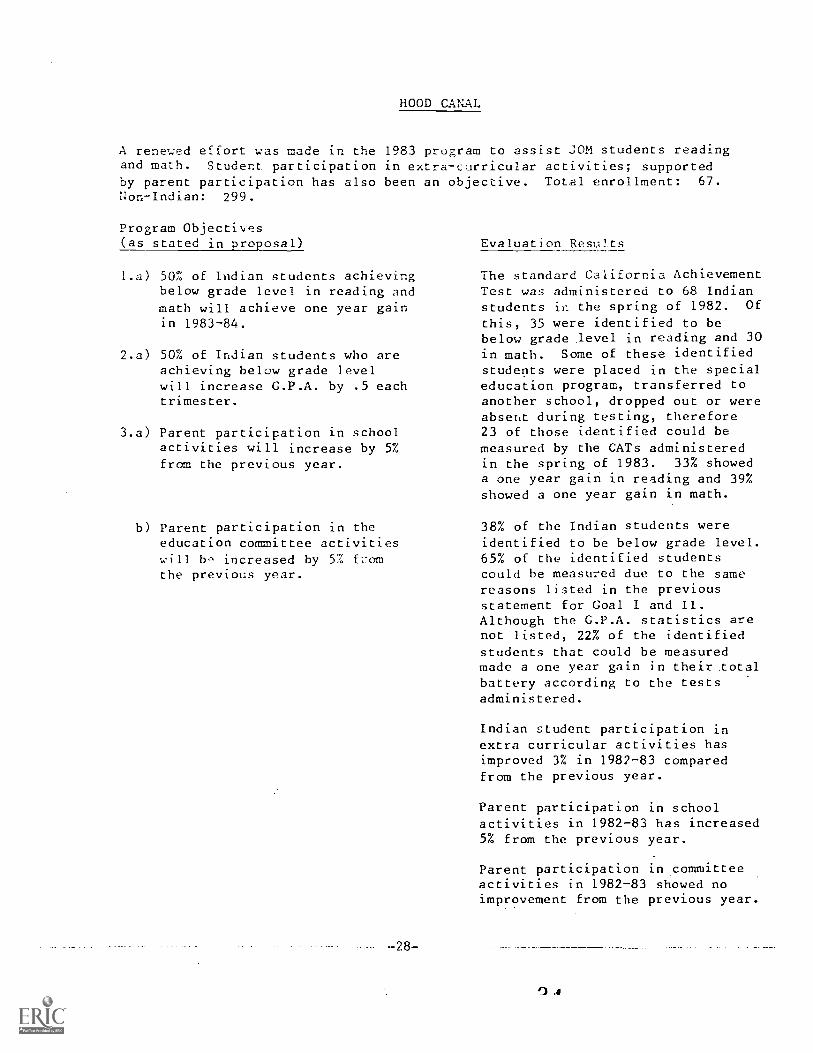
HOOD CANAL
A renewed effort was made in the 1983 program to assist JOM students readingand math. Student participation in extra-curricular activities; supportedby parent participation has also been an objective. Total enrollment: 67.
Non-Indian: 299.
Program Objectives(as stated in proposal)
1.a) 50% of ludian students achievingbelow grade level in reading andmath will achieve one year gainin 1983-84.
2.a) 50% of Indian students who areachieving below grade levelwill increase G.P.A. by .5 eachtrimester.
3.a) Parent participation in schoolactivities will increase by 5%from the previous year.
b) Parent participation in theeducation committee activitieswill increased by 5% fl:omthe previous year.
-28
Evaluation Results
The standard California AchievementTest was administered to 68 Indianstudents in the spring of 1982. Of
this, 35 were identified to bebelow grade Jevel in reading and 30in math. Some of these identifiedstudents were placed in the specialeducation program, transferred toanother school, dropped out or wereabsent during testing, therefore23 of those identified could bemeasured by the CATs administeredin the spring of 1983. 33% showeda one year gain in reading and 39%showed a one year gain in math.
38% of the Indian students wereidentified to be below grade level.65% of the identified studentscould be measured due to the samereasons listed in the previousstatement for Goal I and II.Although the G.P.A. statistics arenot listed, 22% of the identifiedstudents that could be measuredmade a one year gain in their. lotalbattery according to the testsadministered.
Indian student participation inextra curricular activities hasimproved 3% in 1982-83 comparedfrom the previous year.
Parent participation in schoolactivities in 1982-83 has increased5% from the previous year.
Parent participation in committeeactivities in 1982-83 showed noimprovement from the previous year.
0
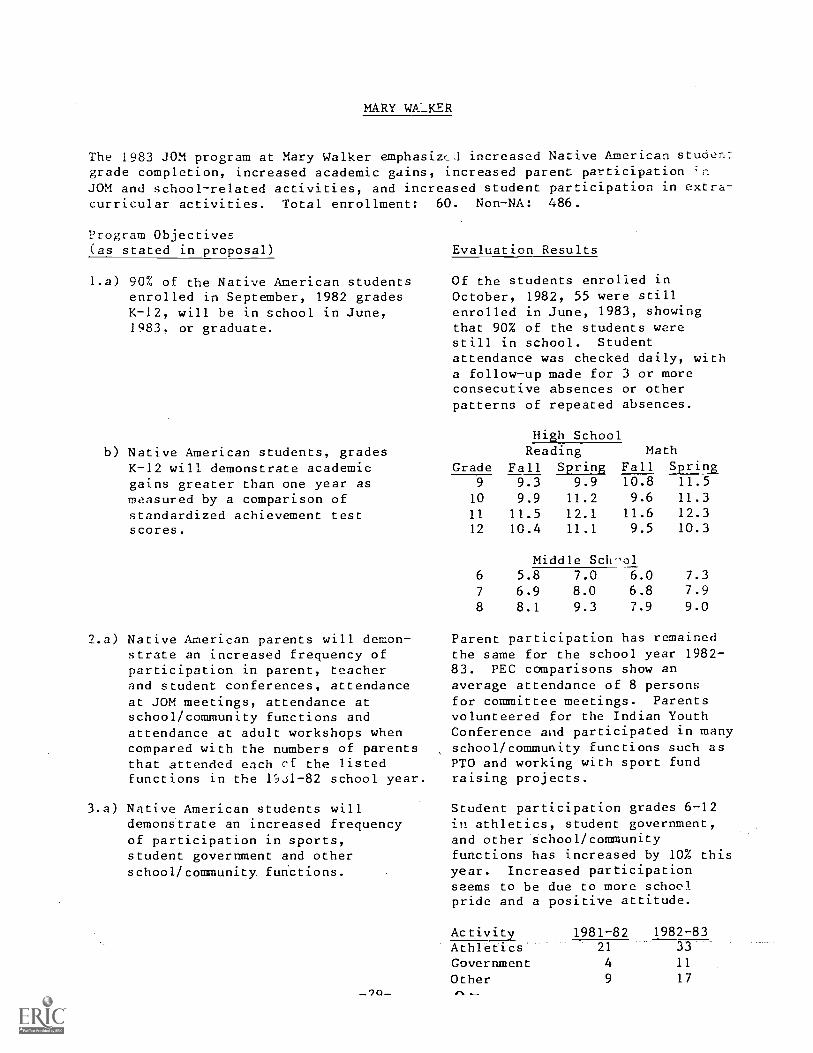
MARY WA_KER
The 1983 JOM program at Mary Walker emphasizcd increased Native American studentgrade completion, increased academic gains, increased parent participation 'nJOM and school-related activities, and increased student participation in extra-curricular activities. Total enrollment: 60. Non-NA: 486.
Program Objectives(as stated in proposal)
1.a) 90% of the Native American studentsenrolled in September, 1982 gradesK-12, will be in school in June,1983, or graduate.
b) Native American students, grades
Evaluation Results
Of the students enrolled inOctober, 1982, 55 were stillenrolled in June, 1983, showingthat 90% of the students werestill in school. Studentattendance was checked daily, witha follow-up made for 3 or moreconsecutive absences or otherpatterns of repeated absences.
High SchoolReading Math
K-12 will demonstrate academic Grade Fall S2Iing Fall Springgains greater than one year as 9 9.3 9.9 10.8 11.5
measured by a comparison of 10 9.9 11.2 9.6 11.3
standardized achievement test 11 11.5 12.1 11.6 12.3
scores. 12 10.4 11.1 9.5 10.3
Middle Sch',o16 5.8 7.0 6.0 7.3
7 6.9 8.0 6.8 7.9
8 8.1 9.3 7.9 9.0
2.a) Native American parents will demon-strate an increased frequency ofparticipation in parent, teacherand student conferences, attendanceat JOM meetings, attendance atschool/community functions andattendance at adult workshops whencompared with the numbers of parentsthat attended each rt the listedfunctions in the 13J1-82 school year.
3.a) Native American students willdemonstrate an increased frequencyof participation in sports,student government and otherschool/community fulictions.
Parent participation has remainedthe same for the school year 1982-83. PEC comparisons show anaverage attendance of 8 personsfor committee meetings. Parentsvolunteered for the Indian YouthConference and participated in manyschool/community functions such asPTO and working with sport fundraising projects.
Student participation grades 6-12in athletics, student government,and other school/communityfunctions has increased by 10% thisyear. Increased participationseems to be due to more schoolpride and a positive attitude.
Ac tivity 1981-82 1982-83Athletics 21 33---
Government 4 11
Other 9 17
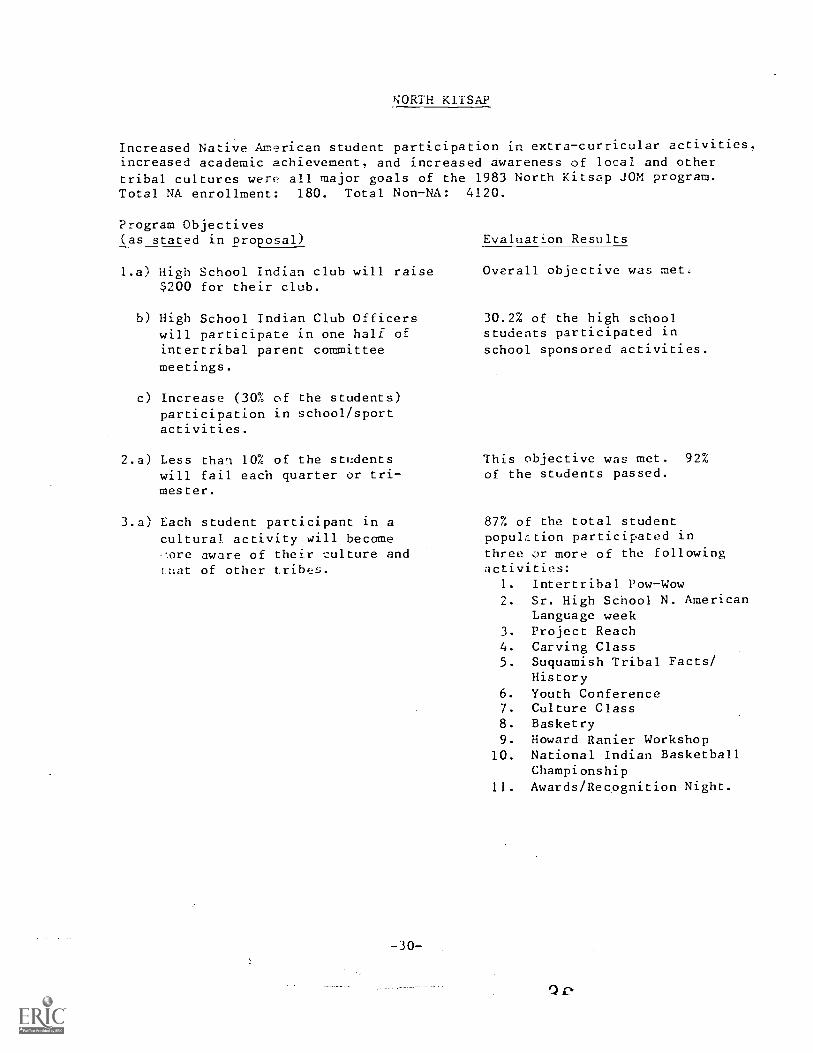
NORTH KITSAP
Increased Native American student participation in extra-curricular activities,increased academic achievement, and increased awareness of local and othertribal cultures were all major goals of the 1983 North Kitsap JOM program.Total NA enrollment: 180. Total Non-NA: 4120.
Program Objectives(as stated in proposal)
1.a) High School Indian club will raise$200 for their club.
b) High School Indian Club Officerswill participate in one half ofintertribal parent committee
meetings.
c) Increase (30% of the students)participation in school/sportactivities.
2.a) Less than 10% of the studentswill fail each quarter or tri-mester.
3.a) Each student participant in acultural activity will becameore aware of their culture andmat of other tribes.
-30-
Evaluation Results
Overall objective was met:
30.2% of the high schoolstudents participated inschool sponsored activities.
This objective was met. 92%of the students passed.
87% of the total studentpopulation participated inthree or more of the followingactivities:
1. Intertribal Pow-Wow2. Sr. High School N. American
Language week3. Project Reach4. Carving Class5. Suquamish Tribal Facts/
History6. Youth Conference7. Culture Class8. Basketry9. Howard Ranier Workshop
10. National Indian BasketballChampionship
11 Awards/Recognition Night.
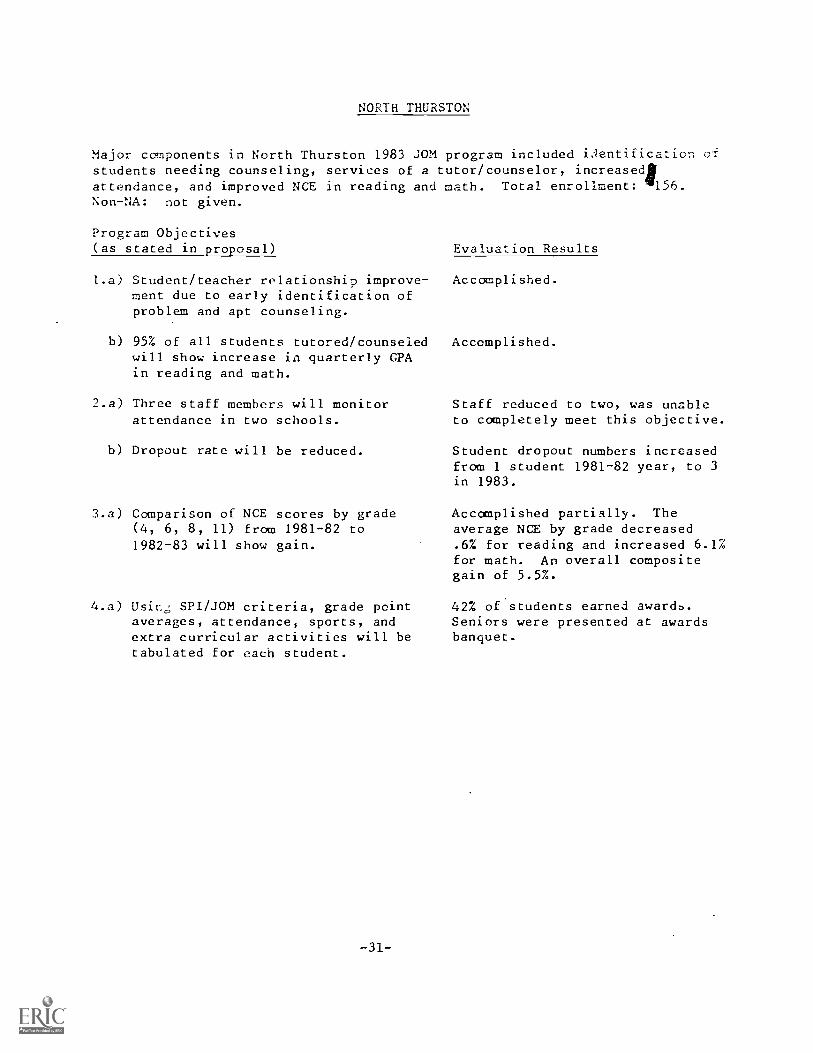
NORTH THURSTON
Major components in North Thurston 1983 JOM program included i.lentificazion o-fstudents needing counseling, services of a tutor/counselor, increasediattendance, and improved NCE in reading and math. Total enrollment: 11156.Non-NA: not given.
Program Objectives(as stated in proposal)
I.a) Student/teacher relationship improve-ment due to early identification ofproblem and apt counseling.
b) 95% of all students tutored/counseledwill show increase in quarterly GPAin reading and math.
2.a) Three staff members will monitorattendance in two schools.
b) Dropout rate will be reduced.
3.a) Comparison of NCE scores by grade(4, 6, 8, 11) from 1981-82 to1982-83 will show gain.
4.a) Usir.; SPI/JOM criteria, grade pointaverages, attendance, sports, andextra curricular activities will betabulated for each student.
-31-
Evaluation Results
Accomplished.
Accomplished.
Staff reduced to two, was unableto completely meet this objective.
Student dropout numbers increasedfrom 1 student 1981-82 year, to 3in 1983.
Accomplished partially. Theaverage NCE by grade decreased.6% for reading and increased 6.1%for math. An overall compositegain of 5.5%.
42% of students earned award,.Seniors were presented at awardsbanquet.
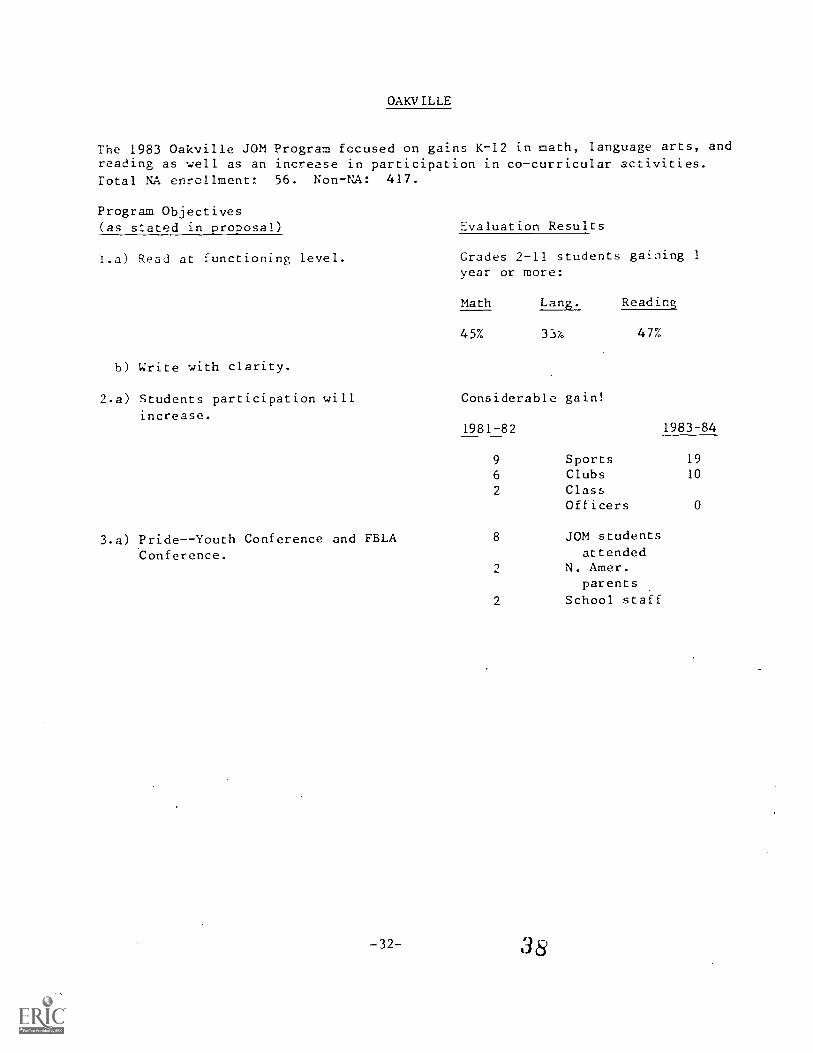
OAKV ILLE
The 1983 Oakville JOM Program focused on gains K-12 in math, language arts, andreading as well as an increase in participation in co-curricular activities.Total NA enrollment: 56. Non-NA: 417.
Program Objectives(as stated in proposal) Evaluation Results
i.a) Read at functioning level. Grades 2-11 students gaining 1year or more:
Math Lang. Reading
45% 33i; 47%
b) Write with clarity.
2.a) Students participation will Considerable gain!
increase.1981-82 1983-84
9 Sports 19
6 Clubs 10
2 ClassOfficers 0
3.a) Pride--Youth Conference and FBLA 8 JOM students
Conference. attended2 N. Amer.
parents
2 School staff
-32- 38
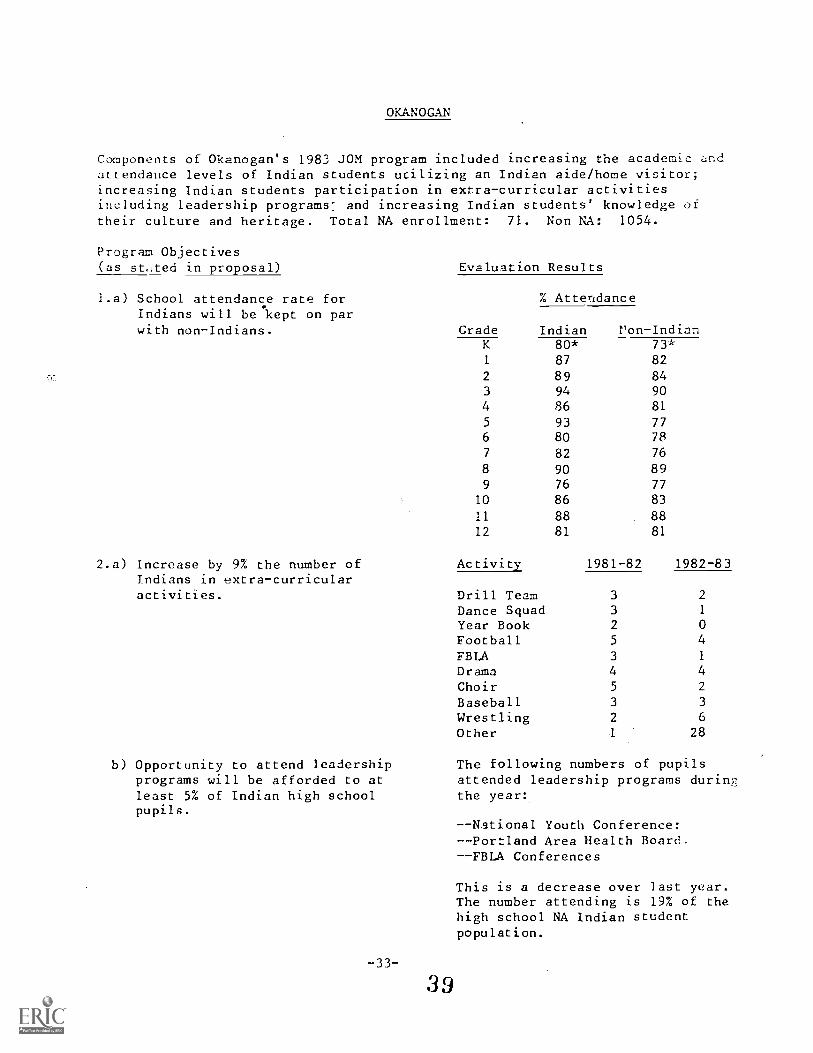
OKANOGAN
Components of Okanogan's 1983 JON program included increasing the academic andattendance levels of Indian students utilizing an Indian aide/home visitor;increasing Indian students participation in extra-curricular activitiesincluding leadership programs: and increasing Indian students' knowledge oftheir culture and heritage. Total NA enrollment: 71. Non NA: 1054.
Program Objectives(as stated in proposal) Evaluation Results
1.a) School attendance rate forIndians will be kept on parwith non-Indians. Grade Indian
% Attendance
ron-IndianK 80* 73*1 87 82
2 89 843 94 90
4 86 81
5 93 77
6 80 78
7 82 76
8 90 899 76 77
10 86 83
11 88 8812 81 81
2.a) Increase by 9% the number ofIndians in extra-curricular
Activity 1981-82 1982-83
activities. Drill Team 3 2
Dance Squad 3 1
Year Book 2 0
Football 5 4
FBLA 3 1
Drama 4 4
Choir 5 2
Baseball 3 3
Wrestling 2 6
Other 1 28
b) Opportunity to attend leadershipprograms will be afforded to atleast 5% of Indian high schoolpupils.
-33-
39
The following numbers of pupilsattended leadership programs duringthe year:
--National Youth Conference:--Portland Area Health Board.--FBLA Conferences
This is a decrease over last year.The number attending is 19% of thehigh school NA Indian studentpopulation.
OKANOGAN--Page 2
3.a) Indian pupils will demonstrategreater knowledge of theirheritage by the end of the schoolyear.
-34--
Students participated in culturalactivities during the past year.These activities included beadwork,N.W. Indian Conference, Tribal HEWmeeting, Portland Area HealthCareers.
Students were pre- and post-testedon their cultural knowledge againthis year.
-some tribal knowledge--books of tribe--cassette, video (wisdom Stories)
PORT ANGELES
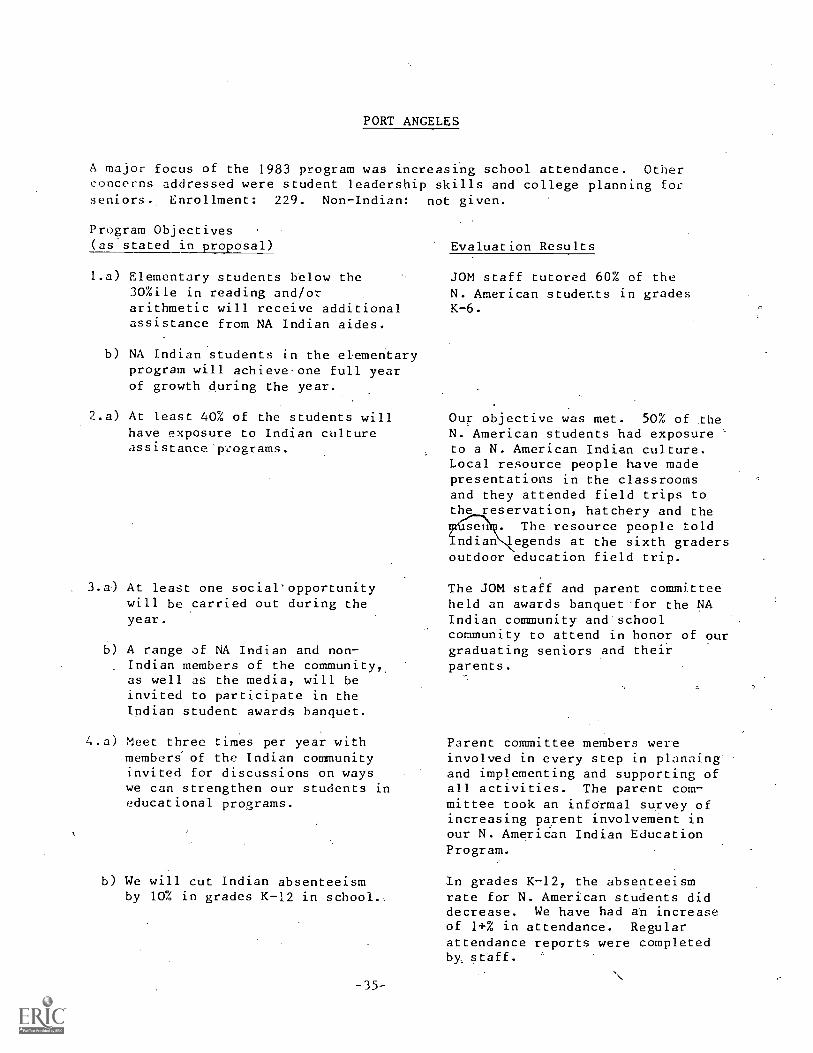
A major focus of the 1983 program was increasing school attendance. Otherconcerns addressed were student leadership skills and college planning forseniors. Enrollment: 229. Non-Indian: not given.
Program Objectives(as stated in proposal)
1.a) Elementary students below the30%ile in reading and/orarithmetic will receive additionalassistance from NA Indian aides.
b) NA Indian students in the elementaryprogram will achieve -one full yearof growth during the year.
2.a) At least 40% of the students willhave exposure to Indian cultureassistance' programs.
3.a) At least one social'opportunitywill be carried out during theyear.
b) A range of NA Indian and non-Indian members of the community,as well as the media, will beinvited to participate in theIndian student awards banquet.
4.a) Meet three times per year withmembers' of the Indian communityinvited for discussions on wayswe can strengthen our students ineducational programs.
b) We will cut Indian absenteeismby 10% in grades K -12 in school.,
-35-
Evaluation Results
JOM staff tutored 60% of theN. American students in gradesK-6.
Our objective was met. 50% of theN. American students had exposureto a N. American Indian culture.Local resource people have madepresentations in the classroomsand they attended field trips tothe reservation, hatchery and the
sen The resource people toldndian egends at the sixth graders
outdoor education field trip.
The JOM staff and parent committeeheld an awards banquet-for the NAIndian community and schoolcommunity to attend in honor of ourgraduating seniors and theirparents.
Parent committee members wereinvolved in every step in planningand implementing and supporting ofall activities. The parent com-mittee took an informal survey ofincreasing parent involvement inour N. American Indian EducationProgram.
In grades K-12, the absenteeismrate for N. American students diddecrease. We have had an increaseof 1+% in attendance. Regularattendance reports were completedby staff.
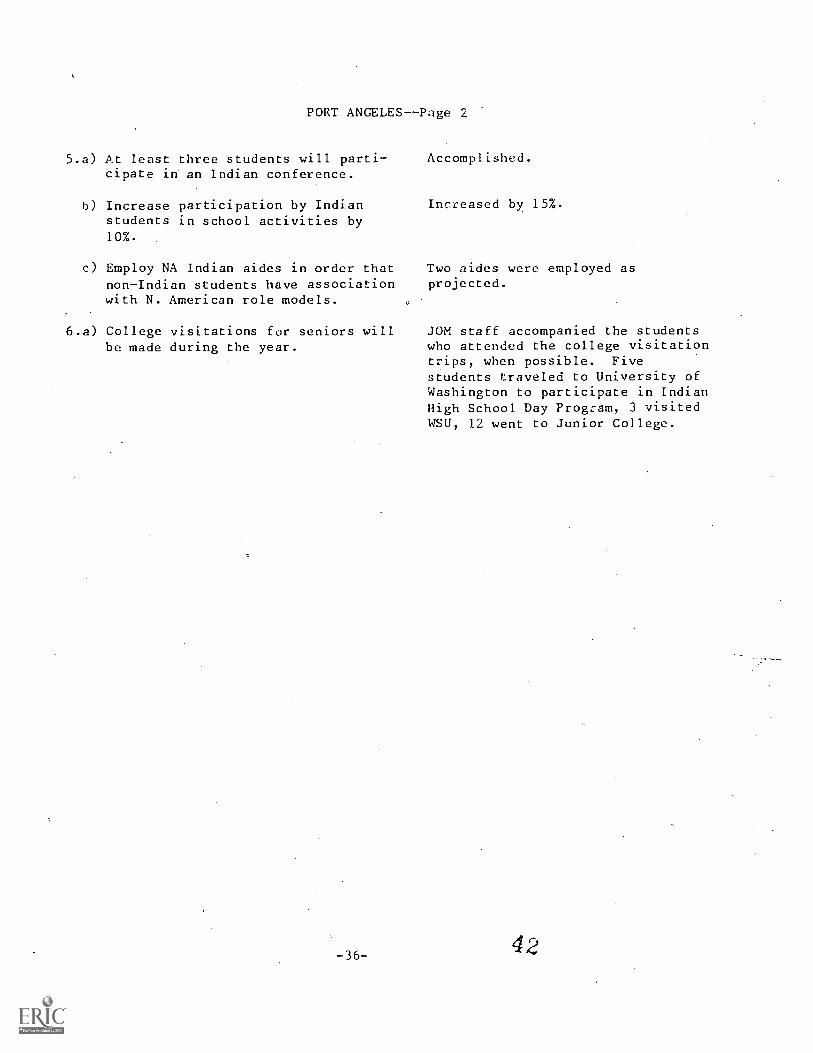
PORT ANGELES--Page 2
5.a) At least three students will parti-cipate in an Indian conference.
b) Increase participation by Indianstudents in school activities by10%.
c) Employ NA Indian aides in order thatnon-Indian students have associationwith N. American role models.
6.a) College visitations for seniors willbe made during the year.
Accomplished.
Increased by 15%.
Two aides were employed asprojected.
JOM staff accompanied the studentswho attended the college visitationtrips, when possible. Fivestudents traveled to University ofWashington to participate in IndianHigh School Day Program, 3 visitedWSU, 12 went to Junior College.
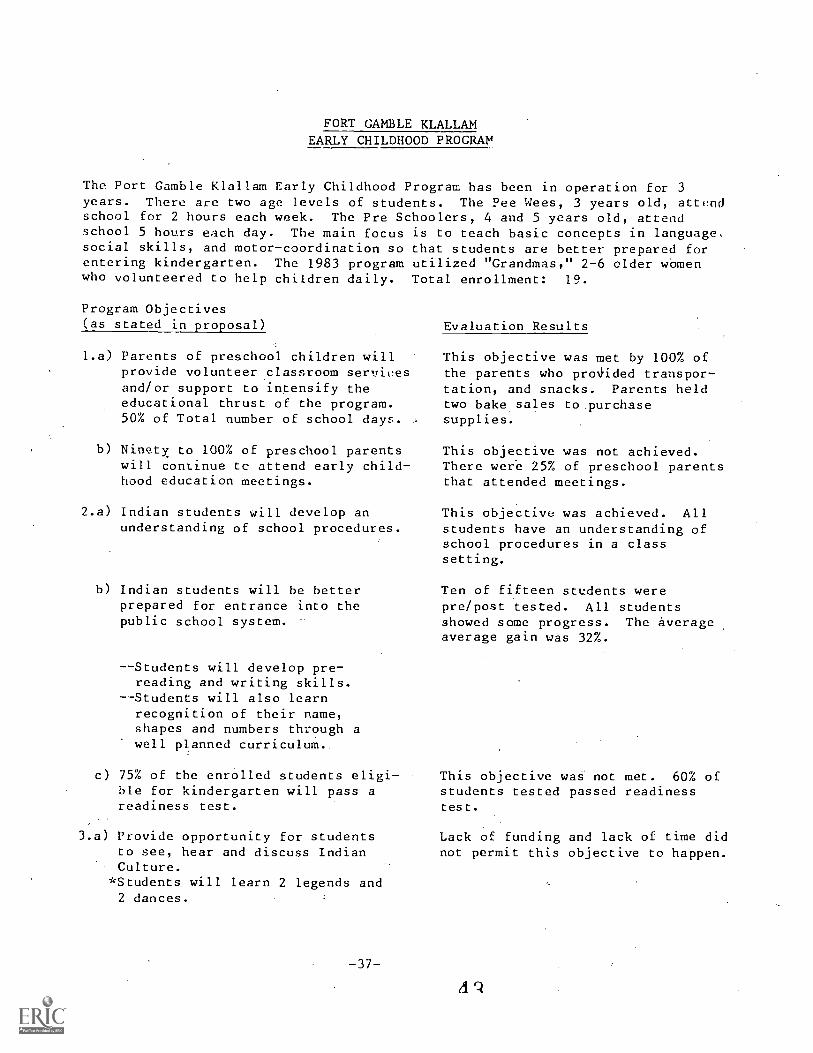
FORT GAMBLE KLALLAMEARLY CHILDHOOD PROGRAM
The Port Gamble Klallam Early Childhood Program has been in operation for 3years. There are two age levels of students. The Pee Wees, 3 years old, attendschool for 2 hours each week. The Pre Schoolers, 4 and 5 years old, attendschool 5 hours each day. The main focus is to teach basic concepts in language.social skills, and motor-coordination so that students are better prepared forentering kindergarten. The 1983 program utilized "Grandmas," 2-6 older womenwho volunteered to help children daily. Total enrollment: 19.
Program Objectives(as stated in proposal)
1.a) Parents of preschool children willprovide volunteer classroom ser,ficesand/or support to intensify theeducational thrust of the program.50% of Total number of school days.
b) Ninety to 100% of preschool parentswill continue tc attend early child-hood education meetings.
2.a) Indian students will develop anunderstanding of school procedures.
b) Indian students will be betterprepared for entrance into thepublic school system.
--Students will develop pre-reading and writing skills.
--Students will also learnrecognition of their name,shapes and numbers through awell planned curriculum-
,
c) 75% of the enrolled students eligi-ble for kindergarten will pass areadiness test.
3.a) Provide opportunity for studentsto see, hear and discuss IndianCulture.
*Students will learn 2 legends and2 dances.
-.37-
Evaluation Results
This objective was met by 100% ofthe parents who provided transpor-tation, and snacks. Parents heldtwo bake sales to purchasesupplies.
This objective was not achieved.There were 25% of preschool parentsthat attended meetings.
This objective was achieved. Allstudents have an understanding ofschool procedures in a classsetting.
Ten of fifteen students werepre/post tested. All studentsshowed some progress. The averageaverage gain was 32%.
This objective was not met. 60% ofstudents tested passed readinesstest.
Lack of funding and lack of time didnot permit this objective to happen.
Lig
b) Provide an opportunity for socialinteraction and social development.
This objective was met. Dailyactivities included fingerplays,songs, rhythm and games, and freeplay. All students performed attwo functions for parents andfriends.
PUYALLUP
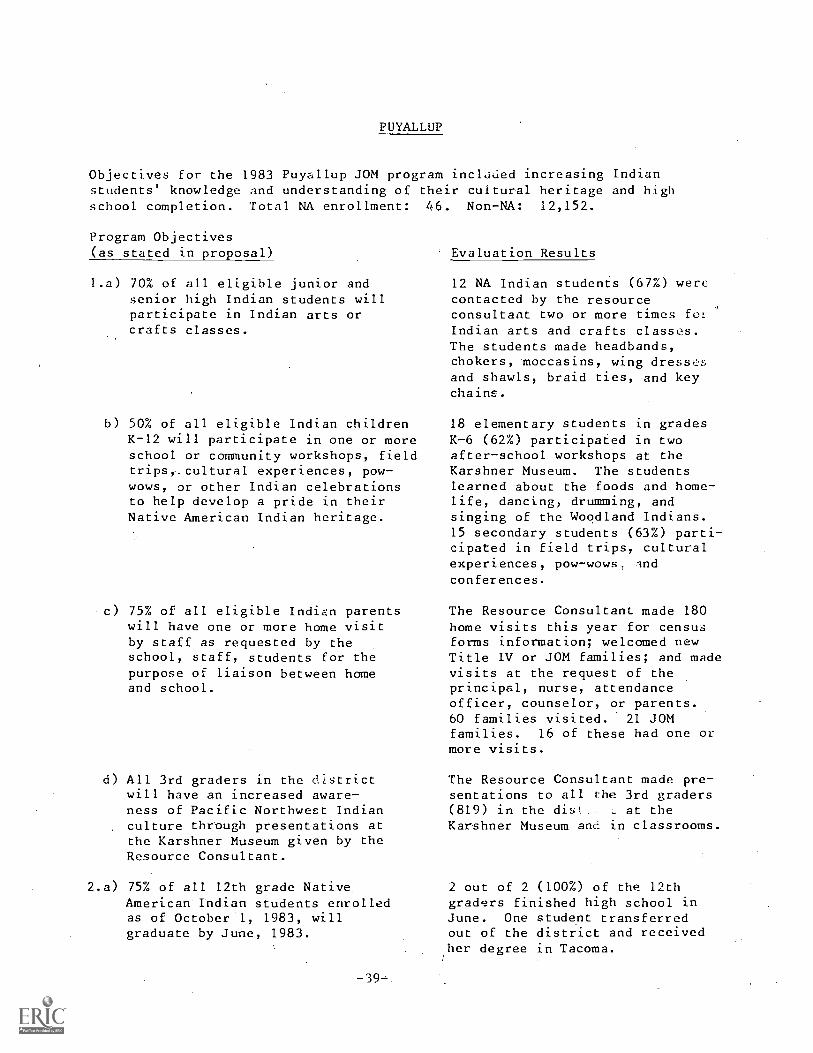
Objectives for the 1983 Puyallup JOM program inclu,ied increasing Indianstudents' knowledge and understanding of their cultural heritage and highschool completion. Total NA enrollment: 46. Non-NA: 12,152.
Program Objectives(as stated in proposal)
1.a) 70% of all eligible junior andsenior high Indian students willparticipate in Indian arts orcrafts classes.
b) 50% of all eligible Indian childrenK-12 will participate in one or moreschool or community workshops, fieldtrips,_cultural experiences, pow-wows, or other Indian celebrationsto help develop a pride in theirNative American Indian heritage.
c) 75% of all eligible Indian parentswill have one or more home visitby staff as requested by theschool, staff, students for thepurpose of liaison between homeand school.
d) All 3rd graders in the districtwill have an increased aware-ness of Pacific Northwest Indianculture through presentations atthe Karshner Museum given by theResource Consultant.
2.a) 75% of all 12th grade Native.American Indian students enrolledas of October 1, 1983, willgraduate by June, 1983.
-39--
Evaluation Results
12 NA Indian students (67%) werecontacted by the resourceconsultant two or more times fotIndian arts and crafts classes.The students made headbands,chokers, moccasins, wing dressesand shawls, braid ties, and keychains.
18 elementary students in gradesK-6 (62%) participated in twoafter-school workshops at theKarshner Museum. The studentslearned about the foods and home-life, dancing, drumming, andsinging of the Woodland Indians.15 secondary students (63%) parti-cipated in field trips, culturalexperiences, pow-wows. rind
conferences.
The Resource Consultant made 180home visits this year for censusforms information; welcomed newTitle IV or JOM families; and madevisits at the request of theprincipal, nurse, attendanceofficer, counselor, or parents.60 families visited. 21 JOMfamilies. 16 of these had one ormore visits.
The Resource Consultant made pre-sentations to all the 3rd graders(819) in the disc_.: at theKarshner Museum amc in classrooms.
2 out of 2 (100%) of the 12thgraders finished high school inJune. One student transferredout of the district and receivedher degree in Tacoma.
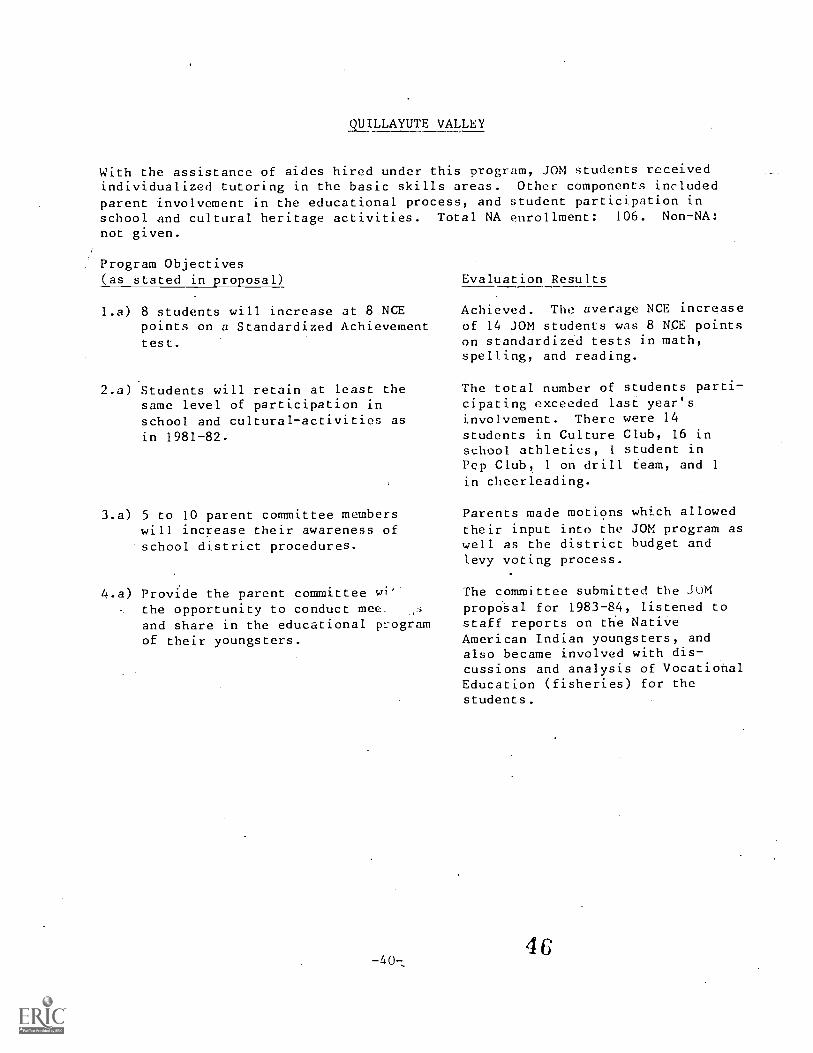
QIJILLAYUTE VALLEY
With the assistance of aides hired under this program, JOM students receivedindividualized tutoring in the basic skills areas. Other components includedparent involvement in the educational process, and student participation inschool and cultural heritage activities. Total NA enrollment: 106. Non-NA:
not given.
Program Objectives(as stated in proposal) Evaluation Results
1.a) 8 students will increase at 8 NCEpoints on a Standardized Achievementtest.
2.a) Students will retain at least thesame level of participation inschool and cultural-activities asin 1981-82.
3.a) 5 to 10 parent committee memberswill increase their awareness ofschool district procedures.
Achieved. The average NCE increaseof 14 JOM students was 8 NCE pointson standardized tests in math,spelling, and reading.
The total number of students parti-cipating exceeded last year'sinvolvement. There were 14students in Culture Club, 16 inschool athletics, i student inPep Club, 1 on drill team, and 1
in cheerleading.
Parents made motions which allowedtheir input into the JOM program aswell as the district budget andlevy voting process.
4.a) Provide the parent committee wi' The committee submitted the .10M
the opportunity to conduct mee, propOSal for 1983-84, listened to
and share in the educational pr.ogram staff reports on the Native
of their youngsters. American Indian youngsters, andalso became involved with dis-cussions and analysis of VocationalEducation (fisheries) for thestudents.
4
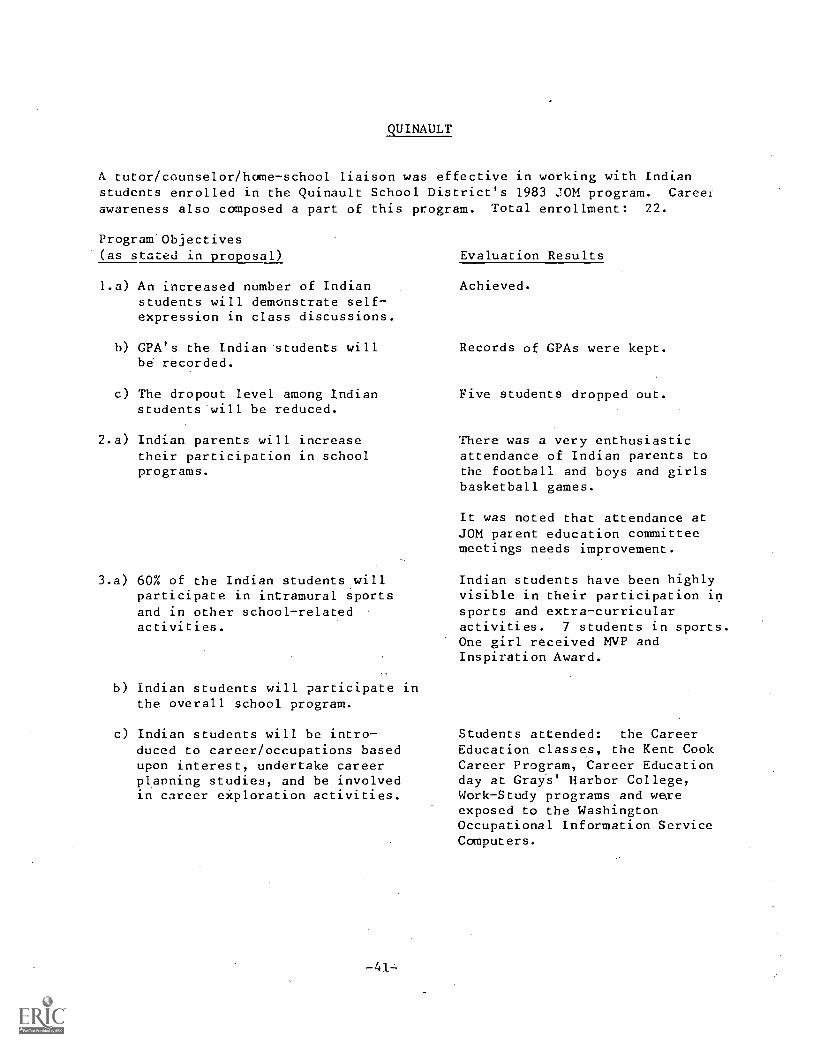
QUINAULT
A tutor/counselor/home-school liaison was effective in working with Indianstudents enrolled in the Quinault School District's 1983 JOM program. Career
awareness also composed a part of this program. Total enrollment: 22.
Program' Objectives(as stated in proposal)
1.a) An increased number of Indianstudents will demonstrate self-expression in class discussions.
h) CPA's the Indian students willbe recorded.
c) The dropout level among Indianstudents will be reduced.
2.a) Indian parents will increasetheir participation in schoolprograms.
3.a) 60% of the Indian students willparticipate in intramural sportsand in other school-relatedactivities.
b) Indian students will participate inthe overall school program.
c) Indian students will be intro-duced to career/occupations basedupon interest, undertake careerplanning studies, and be involvedin career exploration activities.
Evaluation Results
Achieved.
Records of GPAs were kept.
Five students dropped out.
There was a very enthusiasticattendance of Indian parents tothe football and boys and girlsbasketball games.
It was noted that attendance atJOM parent education committeemeetings needs improvement.
Indian students have been highlyvisible in their participation insports and extra-curricularactivities. 7 students in sports.One girl received MVP andInspiration Award.
Students attended: the CareerEducation classes, the Kent CookCareer Program, Career Educationday at Grays' Harbor College,Work-Study programs and wereexposed to the WashingtonOccupational Information ServiceComputers.
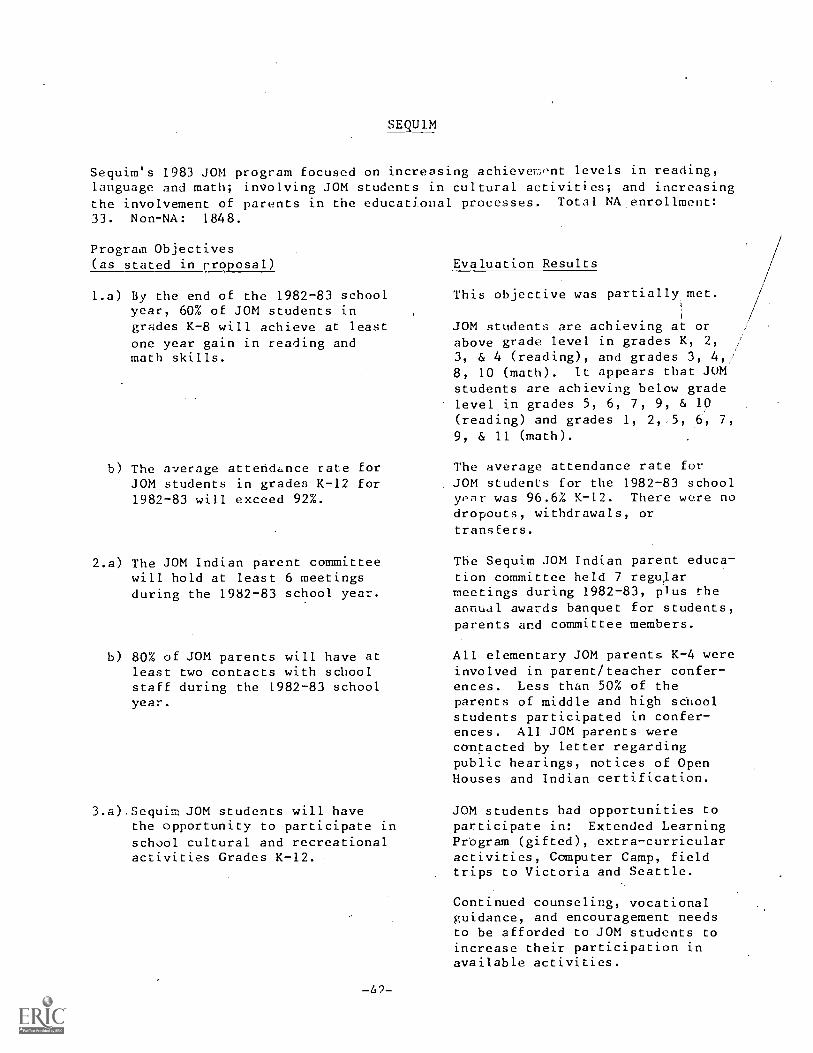
SEQU1M
Sequim's 1983 JOM program focused on increasing achievement levels in reading,language and math; involving JOM students in cultural activities; and increasingthe involvement of parent's in the educational processes. Total NA enrollment:33. Non-NA: 1848.
Program Objectives(as stated in rroposal)
1.a) By the end of the 1982-83 schoolyear, 60% of JOM students ingrades K-8 will achieve at leastone year gain in reading andmath skills.
b) The average attendance rate forJOM students in grades K-12 for1982-83 will exceed 92%.
2.a) The JOM Indian parent committeewill hold at least 6 meetingsduring the 1982-83 school year.
b) 80% of JOM parents will have atleast two contacts with schoolstaff during the 1982-83 schoolyear.
3.a) Sequim JOM students will havethe opportunity to participate inschool cultural and recreationalactivities Grades K-12.
-42-
Evaluation Results
This objective was partially met.
JOM students are achieving at orabove grade level in grades K, 2,
3, & 4 (reading), and grades 3, 4,/8, 10 (math). It appears that JUMstudents are achieving below gradelevel in grades 5, 6, 7, 9, & 10(reading) and grades 1, 2,,5, 6, 7,9, & 11 (math).
The average attendance rate forJOM students for the 1982-83 schoolyear was 96.6Z K-12. There were nodropouts, withdrawals, ortransfers.
The Sequim JOM Indian parent educa-tion committee held 7 regularmeetings during 1982-83, plus theannual awards banquet for students,parents and committee members.
All elementary JOM parents K-4 wereinvolved in parent/teacher confer-ences. Less than 50% of theparents of middle and high schoolstudents participated in confer-ences. All. JOM parents werecontacted by letter regardingpublic hearings, notices of OpenHouses and Indian certification.
JOM students had opportunities toparticipate in: Extended LearningProgram (gifted), extra-curricularactivities, Computer. Camp, fieldtrips to Victoria and Seattle.
Continued counseling, vocationalguidance, and encouragement needsto be afforded to JOM students toincrease their participation inavailable activities.
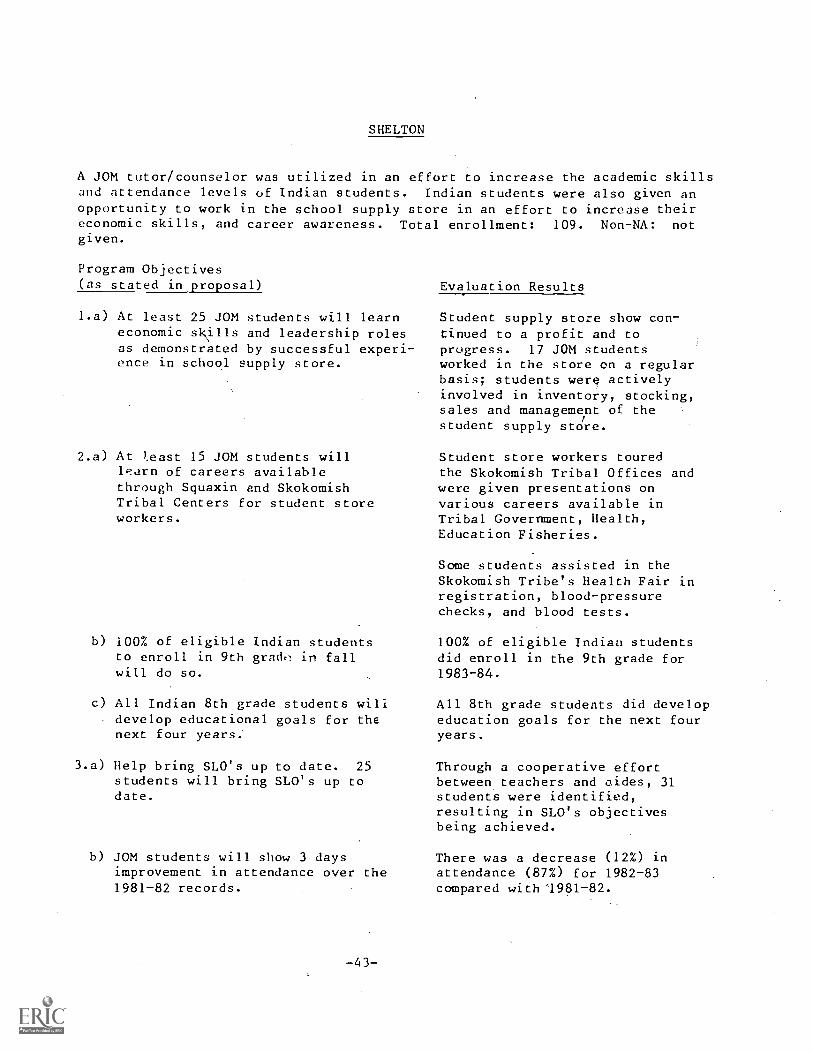
SHELTON
A JOM tutor/counselor was utilized in an effort to increase the academic skillsand attendance levels of Indian students. Indian students were also given anopportunity to work in the school supply store in an effort to increase theireconomic skills, and career awareness. Total enrollment: 109. Non-NA: notgiven.
Program Objectives(as stated in proposal)
1.a) At least 25 JOM students will learneconomic skills and leadership rolesas demonstrated by successful experi-ence in school supply store.
2.a) At ).east 15 JOM students willlearn of careers availablethrough Squaxin and SkokomishTribal Centers for student storeworkers.
b) 100% of eligible Indian studentsto enroll in 9th grade in fallwill do so.
c) All Indian 8th grade students willdevelop educational goals for thenext four years.
3.a) Help bring SLO's up to date. 25students will bring SLO's up todate.
b) JOM students will show 3 daysimprovement in attendance over the1981-82 records.
-43-
Evaluation Results
Student supply store show con-tinued to a profit and toprogress. 17 JOM studentsworked in the store on a regularbasis; students were activelyinvolved in inventory, stocking,sales and management of thestudent supply store.
Student store workers touredthe Skokomish Tribal Offices andwere given presentations onvarious careers available inTribal Government, Health,Education Fisheries.
Some students assisted in theSkokomish Tribe's Health Fair inregistration, blood-pressurechecks, and blood tests.
100% of eligible Indian studentsdid enroll in the 9th grade for1983-84.
All 8th grade students did developeducation goals for the next fouryears.
Through a cooperative effortbetween teachers and aides, 31students were identified,resulting in SLO's objectivesbeing achieved.
There was a decrease (12%) inattendance (87%) for 1982-83compared with "1981-82.
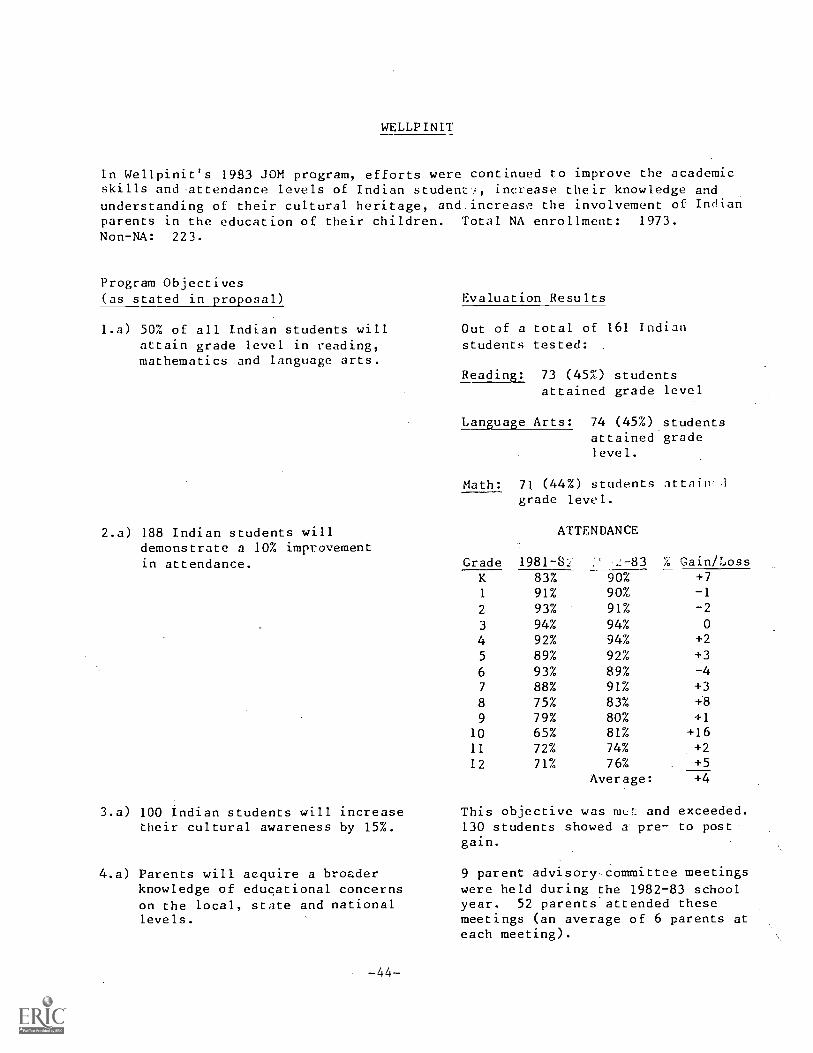
WELLPINIT
In Wellpinit's 1983 JOM program, efforts were continued to improve the academicskills and attendance levels of Indian student, increase their knowledge andunderstanding of their cultural heritage, and.increase the involvement of Indianparents in the education of their children. Total NA enrollment: 1973.
Non-NA: 223.
Program Objectives(as stated in proposal) Evaluation Results
1.a) 50% of all Indian students willattain grade level in reading,mathematics and language arts.
Out of a total of 161 Indianstudents tested:
Reading: 73 (45%) studentsattained grade level
Language Arts: 74 (45%) studentsattained gradelevel.
Math: 71 (44%) students :attain .1
grade level.
ATTENDANCE
1981-82. % Gain / Loss
2.a) 188 Indian students willdemonstrate a 10% improvementin attendance. Grade
K 83% 90% +7
1 91% 90% -1
2 93% 91% -2
3 947 94% 0
4 92% 94% +2
5 89% 92% +3
6 93% 89% -4
7 88% 91% +3
8 75% 83% +8
9 79% 80% +1
10 65% 81% +1611 72% 74% +2
12 71% 76% +5
Average: +4
3.a) 100 Indian students will increasetheir cultural awareness by 15%.
4.a) Parents will acquire a broaderknowledge of educational concernson the local, state and nationallevels.
-44-
This objective was nILL and exceeded.130 students showed a' pre- to postgain.
9 parent advisory committee meetingswere held during the 1982-83 schoolyear. 52 parents attended thesemeetings (an average of 6 parents ateach meeting).
WELLPINIT--Page 2
b) Establish better home/schoolcommunications.
Daily logs were maintained and 65home contacts were made. Dailyattendance records and studentcoracts were recorded. ",ssist.a
wa: ej-r, to parez.Ls ! .:Ip thiatutu v childIrm at home.
YELM
The 1983 JQM program in Yelm emphasized tutoring.
Program Objr:!ctives
(as stated:in proposal)
1.a) To provide individualized tutoringfor Native American students in allsubject areas.
Evaluation Results
NCE gains and results of CTBSand CAT scores were computed.Final evaluation not reportedby deadline date, however.
OTHER SPECIAL PROGRAMS FOR INDIAN STUDENTS
The main focus of this annual report is the Johnson-O'Malley Indian Educa-tion prOgram. However, less than half of the Indian students in publicschools in Washington are eligible for JOM assistance. In addition, theJOM program may not meet all the needs of those Indian students in the JOMprograms.
It is relevant, therefore, to point out that the State Superintendent admin-isters other federal and state programs which provide direct and indirectbenefits to Indian students in the public schools.
Following is a brief description of other special programs which serveIndian students.
Chapter 1 (previously Chapterj.,ESEA)
In 1981, Public Law 97-34, the Education Consolidation and Improvement Act,was passed. ESEA Title I became ECIA Chapter 1, Nationwide, over $3billion is spent each year on Chapter 1 programs. In 1982-83, WashingtonState's share was $32.7 million, which provided extra help in readinessreading, math and/or language arts to over 56,000 children.
Chapter 1 money is given to school districts only after certair require-ments have bee. met. In order to receive Chaptec 1 money, each districtmust submit an application to the state office of the Superintendent ofPublic Instruction.
Chapter 2 Federal Block -Grant
The Federal Block Grant, otherwise known as Chapter 2, is a 'sum of money
available to each local school district for supplementary activities. Thefunds from 28 federal programs were combined to create the Block Grant.The funds may be used for a wide variety of purposes with few regulationsimposed by state or federal governments. Please note that this Blockis not the same as Chapter 1 (the new name for Title I). Also, it
is not the State Block Grant.
Congress decides the total amount available to Chapter 2 nationally. Thenumber of public and private school students in Washington determines ourstare's share of that amount. Local districts decide annually now much oftheir allocation will be spent in each category. The 1982-83 allocation toWashington State was $7,348,289. Each district is eligible to apply for aspecific amount based on a distribution formula.
Title IV, Part A
Title IV of Public Law 92-318 was funded for the first time in fiscal year1974. Part A of. this Act has the same general objectives as those of theJOM Program. However, the eligibility requirements are quite different,with the result that many Indian students in urban and other non-reservation areas received assistance.
-47-
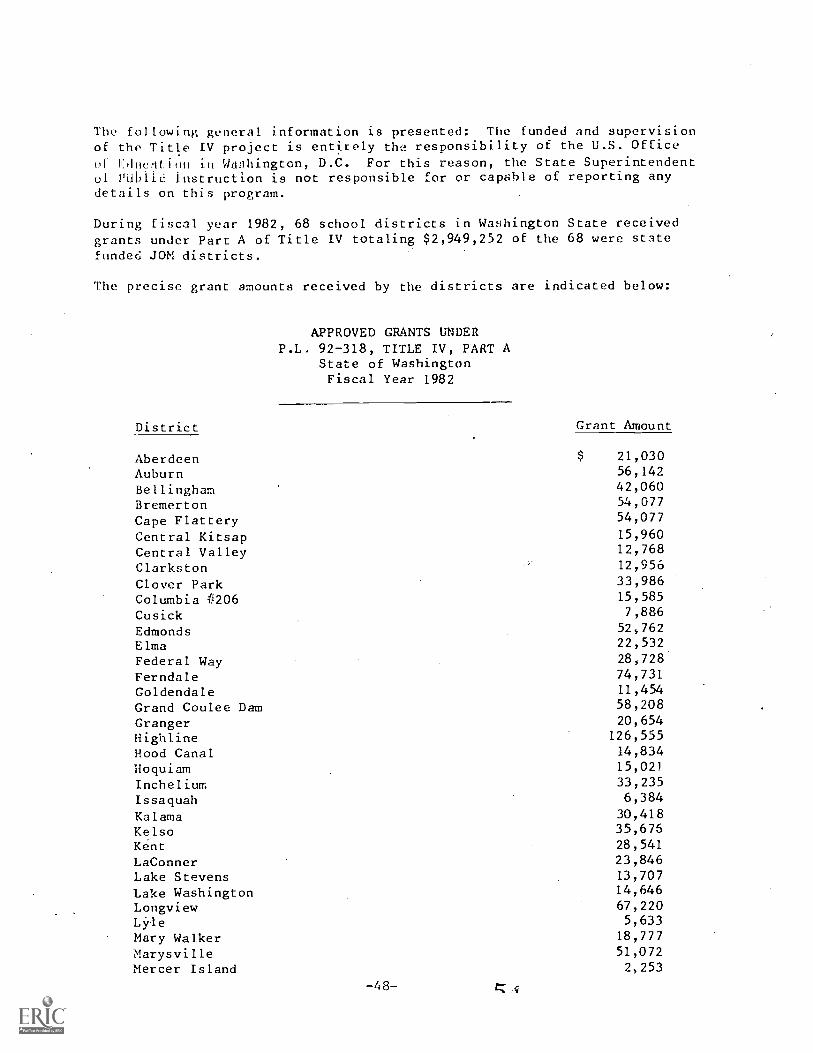
The following general information is presented: The funded and supervisionof the Title IV project is entirely the responsibility of the U.S. Officeof Education in Washington, D.C. For this reason, the State Superintendentof Public Instruction is not responsible for or capable of reporting anydetails on this program.
During fiscal year 1982, 68 school districts in Washington State receivedgrants under Part A of Title IV totaling $2,949,252 of the 68 were statefunded JOM districts.
The precise grant amounts received by the districts are indicated below:
APPROVED GRANTS UNDERP.L. 92-318, TITLE IV, PART A
State of WashingtonFiscal Year 1982
Grant AmountDistrict
Aberdeen $ 21,030
Auburn 56,142
Bellingham 42,060
Bremerton 54,077
Cape Flattery 54,077
Central Kitsap 15,960
Central Valley 12,768
Clarkston 12,956
Clover Park 33,986
Columbia #206 15,585
Cusick 7,886
Edmonds 52,762
Elma 22,532
Federal Way 28,728
Ferndale 74,731
Goldendale 11,454
Grand Coulee Dam 58,208
Granger 20,654
Highline 126,555
Hood Canal 14,834
Hoquiam 15,021
Incheliun 33,235
Issaquah 6,384
Kalama 30,418
Kelso 35,675
Kent 28,541
LaConner 23,846Lake Stevens 13,707
Lake Washington 14,646
Longview 67,220Lyle 5,633
Mary Walker 18,777
Marysville 51,072
Mercer Island 2,253
-48-
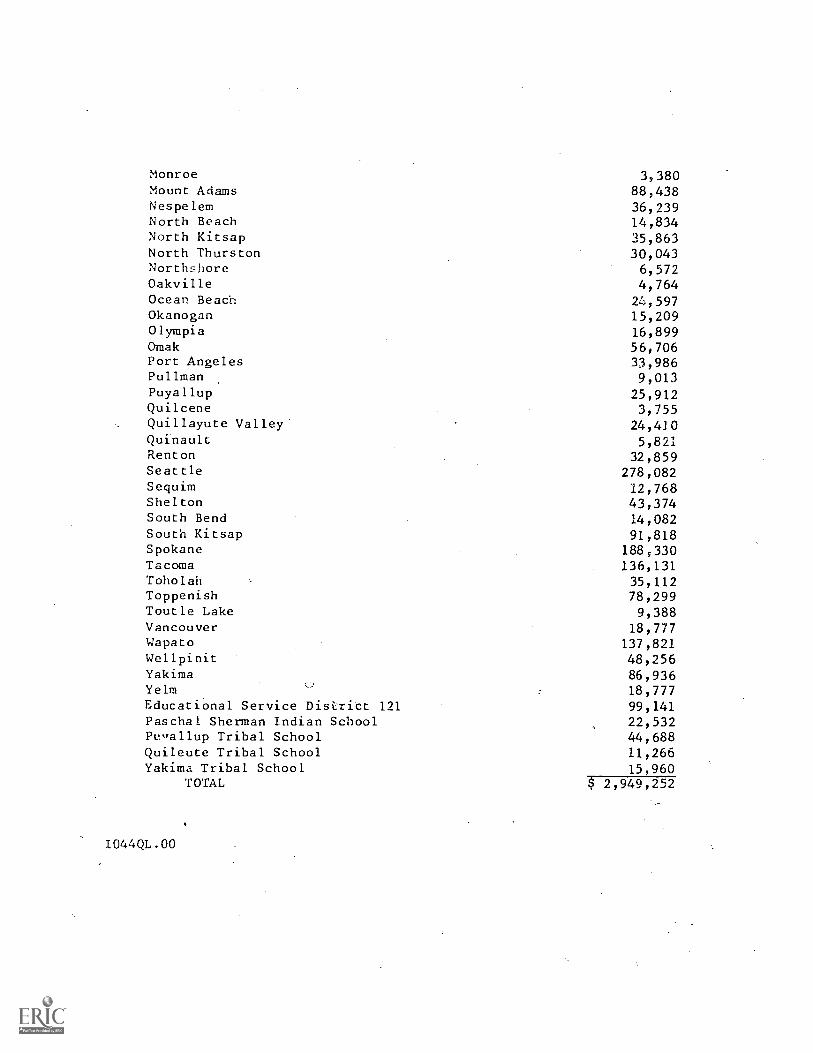
MonroeMount AdamsNespelemNorth BeachNorth KitsapNorth ThurstonNorthshoreOakvilleOcean BeachOkanoganOlympiaOmakPort AngelesPullmanPuyallupQuilceneQuillayute ValleyQuinaultRentonSeattleSequimSheltonSouth BendSouth KitsapSpokaneTacomaToholahToppenishToutle LakeVancouverWapatoWellpinitYakimaYelmEducational Service DistrictPaschal Sherman Indian SchoolPuvallup Tribal SchoolQuileute Tribal SchoolYakima Tribal School
TOTAL
121
3,38088,43836,23914,83435,86330,0436,5724,76424,59715,20916,89956,70633,9869,013
25,9123,755
24,4105,821
32,859278,08212,76843,37414,08291,818
188;330136,13135,11278,2999,38818,777
137,82148,25686,93618,77799,14122,53244,68811,26615,960
$ 2,949,252
1044QL.00
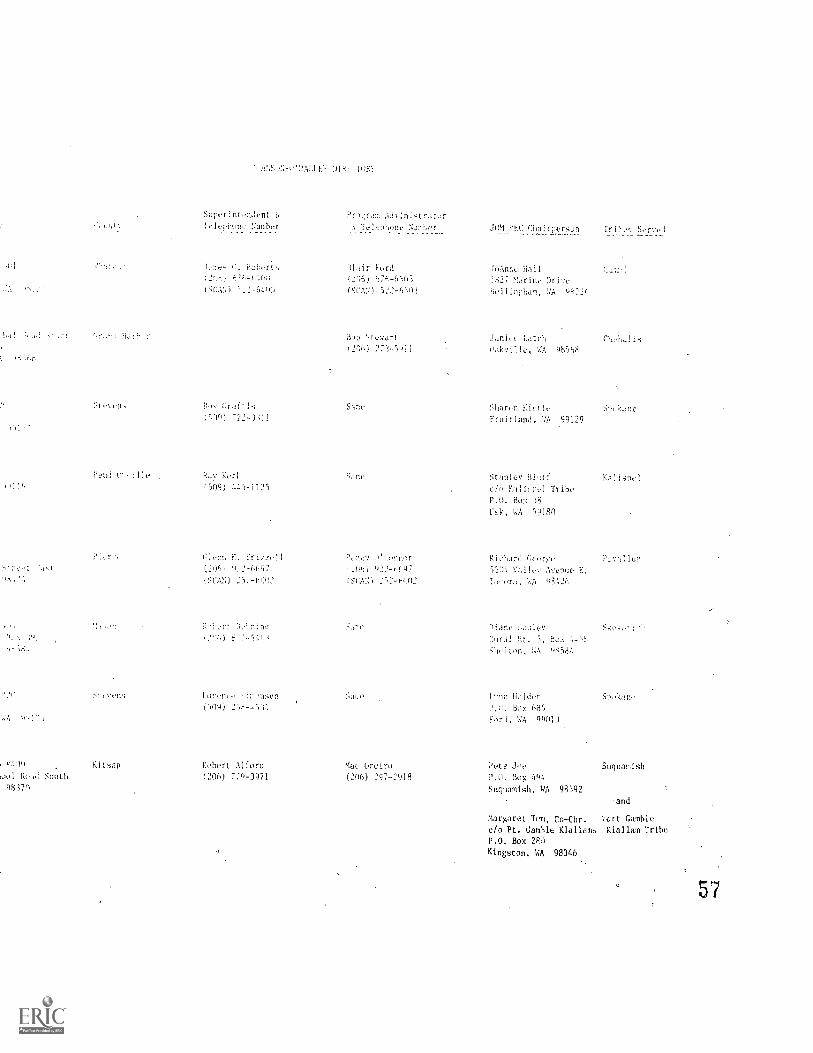
10:.2.,S.!1,-011-1:1,1.1.1:i 13118: 1(1SY
Superint,:1J,nt Pr.).,:ram
Nur,...bor Telep19'ne 1joitr JliM 1160 Cha:rpersan Tr1'..,s Served
t;1 .:-a...-.- .1,,:-.,-; 0. -, 31.1ir Furd
1206) 67,5 -P5o3
t8C3!...1 ',.2-6!..rwi (SCA:0 522-6'13"
113Aen.,
11end 0 :lle
Kitsap
le,)1 Po.ei South
9837'3
(539) 722-3tll
Ry(599) ::9-)125
01v7.r. E. Fri2zell
1206, '1..2-6697
1-;CAN) 252-6002
Pobert or
forvn,, Hf,rnen
(509) 258-5'31.
Robert Alford
(201') 779-3971
(
271-5,11
JoAnr,2 Hall
1827 :Marine Cri5'e
1.atrb
WA 9650
S17, Thorn K301 lc
Fruitland, l,11, 99129
`30r10
Pt ],,
u0,6 422,4,q7
..-v2-0;02
Mac Ormire
(206) 297-2918
Stanley 6l0(f
c/o Kali!.:pvi Tribe
B.O. Box
Csk, WA 99180
Kalknel
Eicbard Ccor:,e P:r.vniluu
5505 Valk,: Avenue E.
'Thine
12.0ral it. 5, 11e::
Hun Holder
P.,1. Box 685
ford, 'AS ogn11
Pete Joe
11,), 59r,
Suquamish, WA 98392
S:' ''eon
Suquanish
and
Margaret Tin, Co-Chr. l'Ort Gamble
c/o Pt. Ga4616 Klallomb Klallam Tribe
P.O. Box 290
Kingston, WA 98346
57
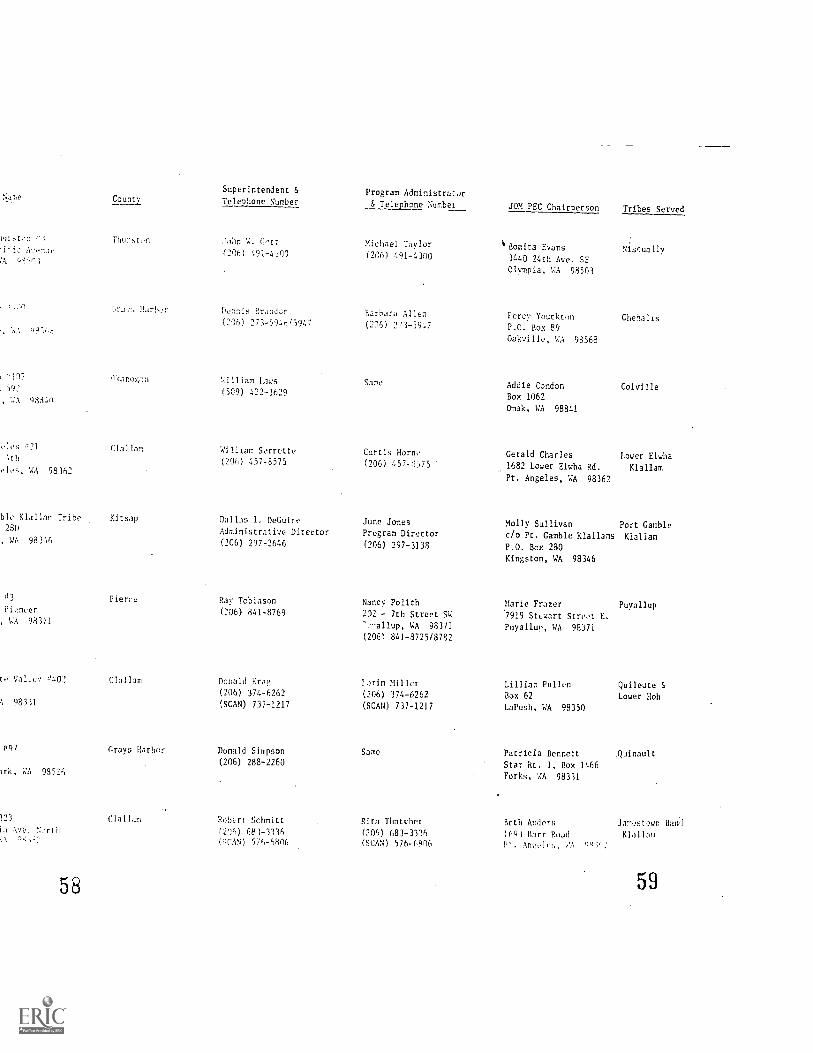
Superintendent 6 Program Administra,torSame Count.: Telephone Number & Telephone Numbet
mstonAV 71AC
(503
Thurst(.n John Cott
(.2061 491-60Michael Taylor
(266) 91-4300
JOM PEC Chairperson Tribes Served
Bonita Evans
3440 24th Ave. SE
Olympia, WA 98503
Nisqually
grass Parh:r Dennis Brandon Barbara Allen Percy Youckton Chehalis(296) 273-594615947 (206) 273-5947 P.O. Box 89
Oakville, WA 98568
,ID5 Okano4;:n William Laws Same Addie Condon Colville592 (509) 422-3629Box. 1062
988:+0Omak, WA 98841
eles Clallam Serrette Curtis Horne Gerald Charles Lower Elwha4th
eles, WA 98362(206) 457-8575 (206) 457-,Y,75 1682 Lover Elwha Rd.
Pt. Angeles, WA 98362
Klallam
hie Klallar Tribe Ctsap Dallas I. DeGuire June Jones Molly Sullivan Port Gamble230 Administrative Director Program Director c/o Pt. Gamble Klallams Kiallam, WA 98346 (206) 297-2646 (206) 297-3138 P.O. Box 280
Kingston, WA 98346
,!3 Pierce Ray Tobiason Nancy Polich Marie Frazer PuyallupPioneer (206) 841-8769 202 - 7th Street SW 7919 Stcwart Street E.
, WA 98371..allup, WA 98371 Puyallun, WA 98371
(2061 841-3725/8762
t, V1,, 4c0 1,402 Clallam Donald Kra) lorin Miller Lillian Pullen Quileute 6(206) 374-6262 (206) 374-6262 Box 62 Lower Hoh
98331 (SCAN) 737-1217 (SCAN) 737-1217 LaPush, WA 98350
1,97 Grays Harbor Donald Simpson Same Patricia Bennett .Quinault
irk, WA 9852%,
323 Clallam
(206) 288-2260
Robert: Schmitt Pita Thatcher
Star Rt. I, Box 1466
Forks, WA 98331
Beth Anders Jamestown Bandin Ave, North (206) 683-3336 (206) 683-3336 1643 Barr Road Klalla31
PTAS) 576-6806 (SCAB) 576-6806 P'. Armelc!, VA
58 59
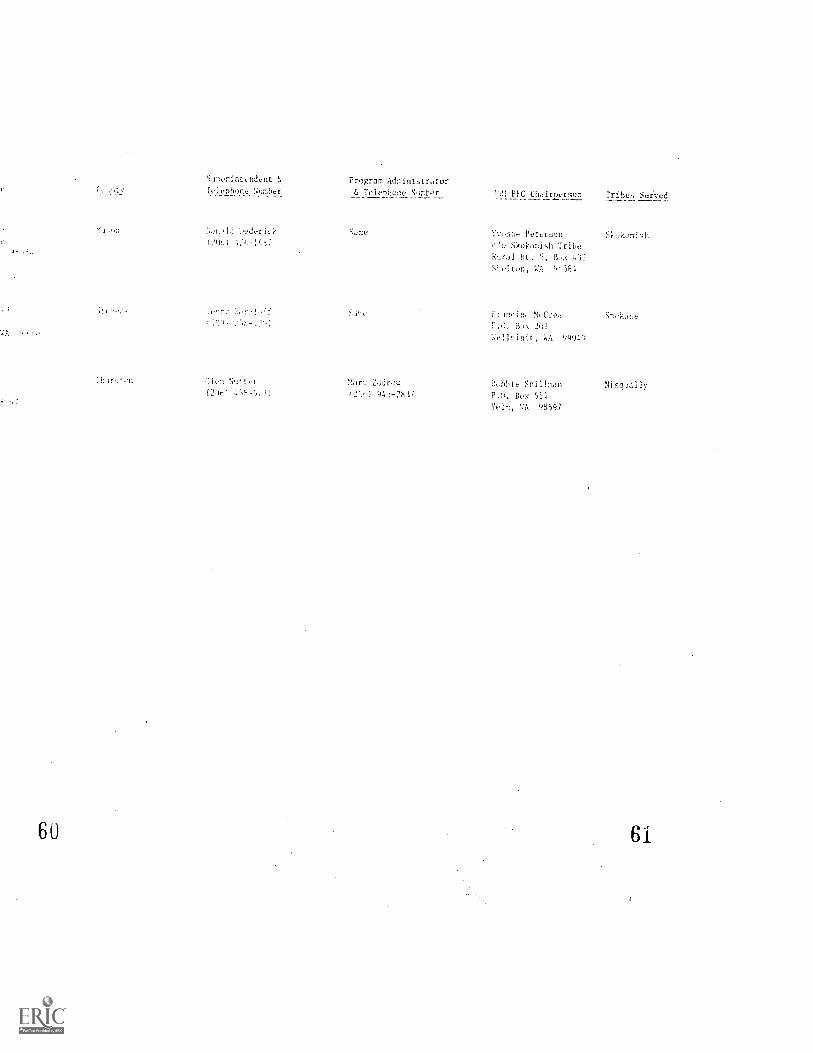
Swer'intendent Program A(inistra...or
N_U7.t;_OL !!,n ?EC Chairptson Tribes Srvd
D,;111.! :)cdt-ricR Yv,nn, Pot,rson
c./o Skokor,ish Trit,
Kr.l Rt. 5, F.x !.32
We:.1 Nottet
S5b-1, 1:,
r Ifle M,Crt,1Bo% 261
94T.C1
Sril!rian
F.,ox 554
YtH, 9S597
S.,,Romish
Rrok..ne
Nisqually
60 61

DR. FRANK B. BROUILLETSuperintendent of Public Instruction
Old Capitol Build im,;. FG-ii. 0;ympia.WA 98504
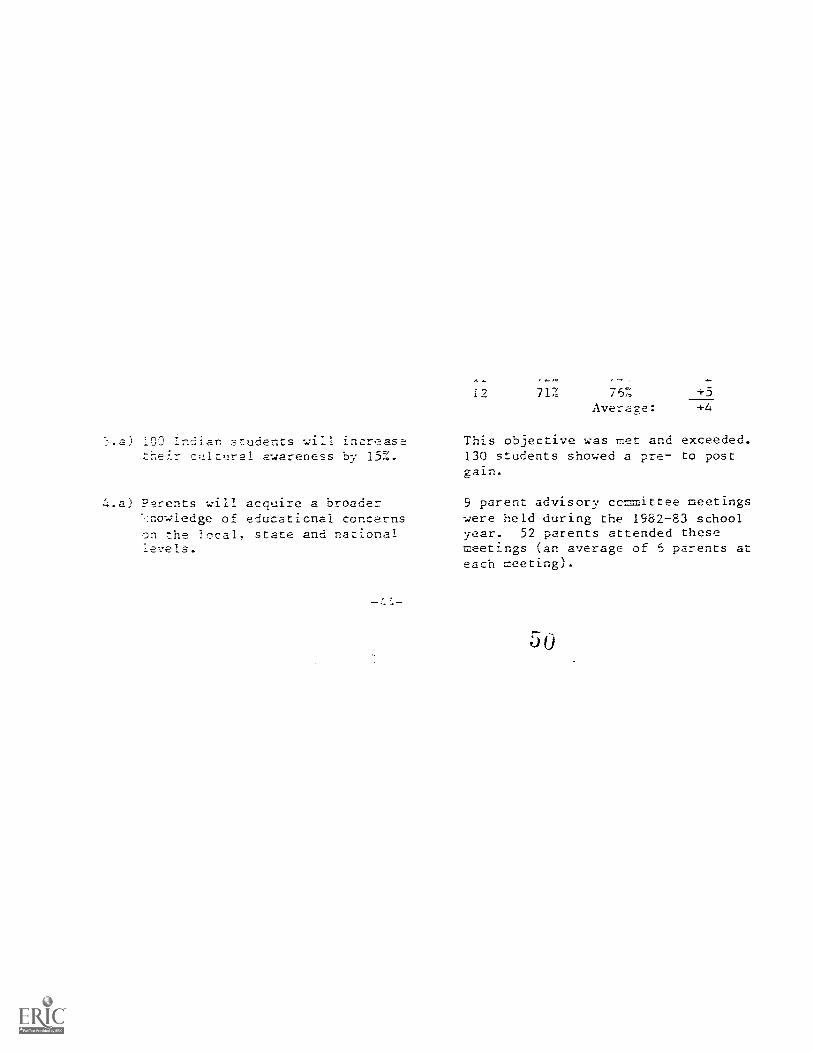
a) .inc.'ian students will increasecultural awareness by 15%.
4.a Parents will acquire a broader'-:nowledge of educational concernson the local, state and national'Levels.
i2 71% 75%Average:
+5
+4
This objective was met and exceeded.130 students showed a pre to postgain.
9 parent advisory committee meetingswere held during the 1982-83 schoolyear. 52 parents attended thesemeetings (an average of 5 parents ateach =eeting).
5U
- 5 -
52
number of public and private school students in Washington determines ourstate's share of that amount. Local districts decide annually now much oftheir allocation will be spent in each category. The 1982-83 allocation toWashington State was $7,348,289. Each district is eligible to apply for asmecific amount based on a distribution formula.
Tftle 7V, Pert A
-Nric. TV of Public Law 92-318 was funded for the first time in fiscal year1974. Part A of this Act has the same general objectives as those of tneJCS Program. However, the eligibility requirements are quite different,with the result that many Indian students in urban and other non-reservation areas received assistance.
/-7
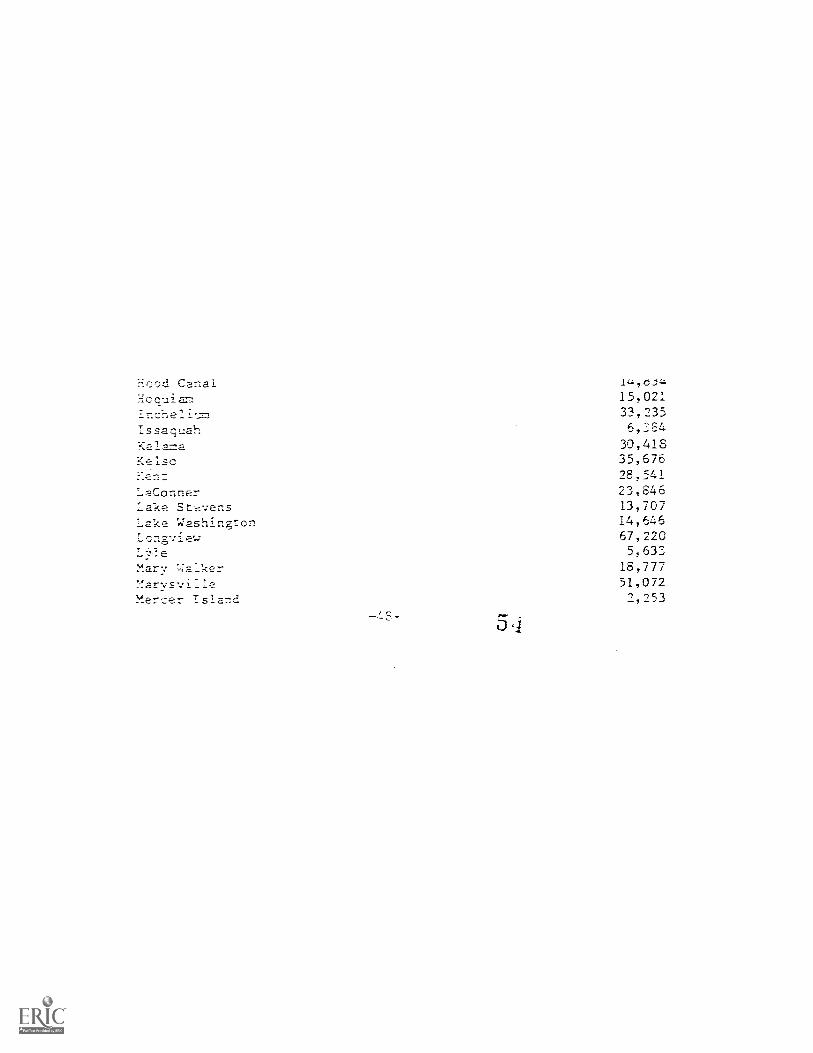
Hood Canal
:ssaquahKalamaKE-lsc
Kan:LaConnerTake Sr--.vens
Take WashinztonLon.rieLeMary Walker!-fa-rvsville
Mercer island
5,1
15,02133,2356,3E430,41835,57618,1:41
23,84613,70714,64667,2205,63318,77751,0722,253