Embed Size (px)
Citation preview
DOCUMENT. RESUME
TM 830,196
AUTHORTITLE
INSTITUTION
REPORT NO.PUB DATENOTEAVAILABLE -FRO
PUB TYPE
EDRS' PRICEDESCRIPTORS
Baird, Leonard L.An Examination of the Graduate Study Application., and.Enrollment Decisions of GRE Candidates.Educational Testing Princeton, N.J.,GrOuate Record Examinations Board, Ptinceibn,N.J.ETS-RR-82-53; GREB-RR-19-11RDec 8236p. ,
Educational Testing Service,11-.116, Princeton, NJ 08g41.Reports Reeearch/Technical
MF01/PCO2 Plus Postage.College'Applicants; *College Entrance Examinations;Dedision Making; *Enrollment; 'Evaluation Mtthods;*Followup Studies; *Grduate Study; Higher Education;Scores; StandardizedoTests; Student Attitudes
rDENTIFIERS' *Graduate Record Examinations
Publidat
ABSTRACTThis study was designed to analyze the relationship
of Graduate Record Examinatkon (GRE) scores, to applicants' choices of- institutions, their admission, and their enrollment. Appliqants frontfour f ields were followed up the ,year, after they had, taken the GRE.tests. Information was- obtained about the departments to which thetest takers applied and the depdrtments that offered. them, .
In. addition, other inforniation about the test takers' current statuswas collected. The typical resp6ndent had applied to one br two.departments, was accepted by at least one department, and said thathe or she was satisfied. with the department in which he or sht was'.-enrolled, This picture changed Slightly when applicants werel groupedby- undergraduate grades, GRE scores, sex, race, and intended fieldsof study. There:Was evidence Of self-selection by test takers toapply to more prestigious -departments, 'based on their undegraduategrades and GRE scores,%Respondents felt that 'the GRE test were fair'and that they were- not obstacles to entrance to graduate education.-(Author)
** *******Reproductions supplied by EDRS are 'the best That can be .made
from the original document*** *********************If*******
* -********* *
AN EXAMINATION OF THEGRADUATE STUDY APPLICATION
AND ENROLLMENT IjECISIONSOF GRE CANDIDATES
"PERMISSION TO REPRODUCE THISMATERIAL RAS BEEN.=ORANTED BY
TO THE EDUCATIONAL RESOURCESINFORMATION CENTER (ERIC); "
GIBE Board' ResearCh Report GREBNo. 79311RETS Research Report 82453
December 1982::
US!;OEPARTDIENT OF EDUCATIONNATIONAL INSTITUTE OF EDUCATION
i EDUOTIONAL nEsobncEs INFORMATION0:. CENTER (ERIC/
Thral document. hag .haail roprogoe'ed asrskaiged froth thg poison or organization :orithnating it.' ...
0 4iliOr changes have boon made to iniOnssa_. ',fargoduction quality.,-.________
. P010ta:Of WOW groginiona atatog in this doge-, .
,
moot do not nocOloorN ieDreSeof MC I& ME "pO,-;
_ _ _ - . _ ..dion 01-.00h0y-
This report j presents the findings of aresearch, project funded by and carriedout under the auspices of tile GraduateRecord Examinations Board.
EDUCATIONAL SERVICE, PRINCETON, NJ
GRE :EAR_ 5pORTS FOR
Altman, R. A. and-:Wallmark. 14..14. .A-Summary ofData from. the Graduate .Programs and'AdmiasionaManual. 74-1A, 1975.
1-"1
d. L. An 'Inventory`plishmenta 77-3R. 1979.
d, L.'. L. cooperative S--,,Graduates I$2.50 eachCurriatila), 70°4R,'1973'_
, .
Baird, -L. L. : The RelatioGraduate Departmerita AndRatea. 77-2aR, 1980.
acumen ea Accom
udent Survey (Theand rears and
p Betweeulty.
atings ofublicatiem
Baird. L L. and Knapp, J E. The Inventory ofDocumented Accomplishments or G :late Admiaalone : 'Reaults of. a yield :T 1' Study ,.of,Ite Reliability, 'Short-Term Correlates, andEvaluation. 78-3R, 1981.
Burns, R. L. GradUSte Admitaions and FellowshipSelection Policies and Procedures. (Part I andII).,. 69 -5R 1970. _
..
Centre.' J.' A. How Uriveraities EValuate Faculty'PerfOrMance: A -Survey of DePartmeat Heads.75-5bR; 1977." 01.50 each)
Centre, -.7. A. Women, Hen and71710R, 1974. ($3.50 pach)
Clark, M. J. The 'Assessment-Programs: A Preliminary ReporGraduate Deans. :72-7aN. 1974./
he Dop
ual y, in APh.D.on Jadgmente by
Program. Revi'kw Fracticea o:._130fVers ty Departierits. 7556.R.,1177. ($1.0inch)
Cla rk. M. J and ,Ce.ntra',,,J. ConditloInfluencing the Career Accomplishments of, Ph.Dis.:
H 76-2R, 1982. .
GENE CE,_
R. , T. andi-Willinghast -.
Criterion Problem; 1.114 Measure SucceSs in .
Gradutte Education? ., 77-4R; 1979.
ICB,i130'. J. and. Hamilton, I he' Effect of,0998tandard Undergraduate A sessment And
Re-Porting Tiectices the Gadutte SchOol.Admissions Process. -7614R. 1978
LannhelM,' G.: V. and Tarry.'4 M. ,EDitadvaptaged Students in Gr691.R. 1970.
Miller. _ and Wild.'Graduate Record ExaminationaBOard'TechniCal.Report,'1979
Powers, D E. and Swinton,,4. Self-Study of Tent Familiarit
the Analytical the708. 1982.,
Reilly, R. R.' Critical IncStudent Performance. 7405R,
Rock ndlierts, C.. -An AnaS ore ticrements'and/orRipe -ars across Abili77-9R 979. .
Rock.; D. A.in
174.
Stilts:der.Predfctor7,61nR,, 197
Schiader.'1i. B. GRE ScorAch4evement in History.'.-
Swipton, S S. and P'owetEffects of Special PrStores and Item Types
Programsduate Schools.
. . .
eatruetuude T
E
GRE Apt
dente1974.
Y_creme
y and
ing the.- GRE
fecta oferiale fortude Teat..
Graduate
time Relatedor.GRE
_x.:Groupa.
The ,Prediction Doctorate AttainmentMathemttics ,a d Chemistry.
A.. 'Adzin loos 'Tea Scarce aaCareer, Ac ievement in Psychology.
WeVorei R. and McPeek, M. 'A Study of the Conventof Three GRE Advanced Tests, 2.
Donlon, T. 17, Annotated Bibliography. of estSpeededneaa. 76-9R, 197
Flaugher, R. L. The New. DefinitionsFol-rneso In Selection: Developm
,Implications. 724R.,1974.
Fortna. R. O. :Annotated BibGraduate Record Examinations.
C. L., Summary'''the Graduate RecordA979.=I!
as Predicte Career-1bR.: 1980.
D. Er A Study of thewallop- on gm Analytical782R4 1982.
_eseath on Restruc uridgExaminationeAptitude Testi
Wild, C. L. amd Du o, R. EffectTest-Teking. Time o Test Scores byAge. And Sex. 76-6R. 1979.
Wilabn. .-M,Reatructured G-Eirst-Year Pe_78-6R. 1982.
gtoPhY9.
Frederikoen. N. and Ward. W. C. Measures fortheStudyof Creativity in SciettifloProblemBelying. '-1978.
-Hartnett, K. T.- Sex Differences iathementa of Gradu te Studenta and Faculty:
nviron77 -2bR,
Hartnett, R. T. The Information Needs ofproepective .Graduate Students. 77-8R. 1979.
IncreasedEthnic. Group.
tudy of the :Validity of 'theAptitude 'Test for',Predictingimance Graduate :Study.
igiloon. K. M. -Th GRE.Cooperative Validity Studies,project. 75-8 . 1979.
W
iltaey, R. G.A Survey.Part: I $2.00 Part 11 $1.50).
octoral Use of Foreign Languages:0-14R.: 1972. (Highlights $1.00,
R. A.; Moore, C. A.; Oltpan., P. ,K.;:Goodeneugh,-D. R.; Friedman. F.; and OwOm.'D.4.A Longitudinal Study of the Role` of Cognitive
-Style° in Academic Evolution During the CollegeYeais 76- 108.'19)7 ($5.00. - each).
An E Amin .tion of_ the Graduate Study ApplicatiOn
and En llment De Sion of GRE Candidat
G- *Board Research Report :GRES No. 79-11R
Copyright ®1982 by Educational Testing Service. All rights reserved.
An Examination of the Graduate Study Applicationand.EnrollmentDeCiaiona of GRE Candidates
Leonard L. Baird
Educational Testing Service
Abst
This study was designed to analyze the relationship GRE -sc,ireSto applicants' choices of institutions, . theiv admission, and heir' enroll7ment. Applicants from four' fields were followed Up the year after theyhad taken the GRE tests. Information was obtained about the dePartmentato which the test takers applied and. the departments that offered them',.
admission. In addition, other information about the test takers' currentstatus was cellected. The typical respondent had applied to one or two.'departments, was accepted. by at -least one depatment, and said that he .orshe was satisfied. thehe department in which he or she was enrolled.This picture changed slightly when- applicants were grouped' by under-graduite,grades, GRE scores, sex, rate,' and intended' fields of study.There was 'evidence-'of self-selection by test takers to apply to morepreetigic nip departments, based on their undergraduate grades and-GREscores.. *espondents felt that the GRE.tests were fair and that they were_not obstacles to.entrance to gradUate education.
An Examination of theand Envollment Decis
What' happens to- those who take.
many apply to graduate- school, anadmitted? How do the answers to thL,scores? How d.o they vary `by se'do candidates!. GRE scores,, play ibasic to our understanding of theprocess'. Yet, we had no solidquestions.
rd -Examinations?. Howt apply how' many are
v.:./7 by the students,
GRE-amily ineoffieT-. What role
1Q -lep? These-questions seemthe GRE tes in the2,admission
:ion to a -any of the
The purpose of the study desqrib d he a was to obthin data to answerthese questions. Althpuel other research has ,indicated that mostapplicants to, graduate school are adbitted (Baird, Hartnett, & Clark,1973; Miller, '1963; Presley, 1981) and that most -aPPlicants to graduateschool are accepted (Berelsonp, 1960; Presley, 1981;1 Sol%on, 1976),'it isimportant to obtain the, same kind of information about' GRE test takerssince they may be more able and ambitious etudents and may apply to moreselective programs. (The earlier research is reviewed in the discussion.)The basic strategy was to follow up GRE test, takers, ask,them where theyApplied, where they were admitted, and where they enrolled and to relatetheir responses to their GRE scores and, other personal characteristics.Because the pattern of influences on the admissionprocess may vary fromacademic area to academic area, the study was conducted ifi four diversefields'.
The -strategy used here obviously _could only show the overall patternentry. into gradupteedUcation; the selection process within- departments
would need to be investigated separately. However, information. about theoverall pattern of adMissions would seem essential to interpret studieswithin departments. By studying four diverse fields, differences inpatterns were 'examined. Also, by studying the admission process withinfields, we were -able to relate student characteristics to departmentalcharacteristies,, speei ically, the ratings of the "quality- of the.departments=
Sample.
The, sample was drawn from GEE Aptitude Test takers. int4nding topursue 'graduate study in the fields of psychology, English, education, andmicrobiblogy. -.:1hese .fields are taken from the 'social sciences, thehumanities, the professional fidlds, and .the biological sconces. Fairlylarge fiumbcrs of applicants in these areas take the GRE Aptitude Test, soanalyses of subgroups are possible. In addition, a considerable number of`applicants in these areas take the relevant GRE Advanced Test. The. sample
wa drawnonly from those test takers whe,.at the time they took theAp ude Test, were either undergraduate seniors or college graduates not.'already\enrolledin graduate school. This eliminated candidates who werenot involved in the college to graduateathool transition. The sampleswere draWn from successive test-administration groups from October 1979through.JUne.19.80.
The samPle wad drawn in twd ways. First we took every applicantplanning graduate study in English And microbiology who took' the test oneach date. To keep the size of the sample to manageable proportions, aone-qNrter sample, of ORE test takers planning-to study in psychology andeducation was drawn. Because the address on the test registration form isusually'a temporary college dormor apartment near campus--andbecause many students move after college, it .was necessary to determine areasonably permanent address so that a follow-up survey would reach thestudents. Therefore, 'we sent surveys to most test takers at their currentmailing address fn thespring of the academic year and asked them toprovide us with an address where they could be reached in the fall or thatwould forwardtheir mail. Applicants of subsequent administrations weresent surveys Shortly after taking the test. (The'sUrvey is reproduced inAppendix B.). In addition, the candidatep 'askedasked to indicate thenumber of departments to which they had 'applied, the _number that hhdoffered them admission, and whether one of these departments was theirfirst choice. Crverall, 13,39 test takers were sent the original address'%update just descried.. A'total Of 6,186 address update forms werereturned. In addition, appFoximately'675 surveys were returned because.the U.S.. mail coilld ndt deliver.them. Thus, the returns represent 48percent of they3rig.inaI maple that received the surveys. Although thisresponse rate was low, it may -kV better than this figure would suggest.Applicnntg who take 'the ORE are at` one of the most mobile and busy periodsof the -ir lies In addition, the addresses provided in registration maynot be as useful for follow-ups as was originally thought.
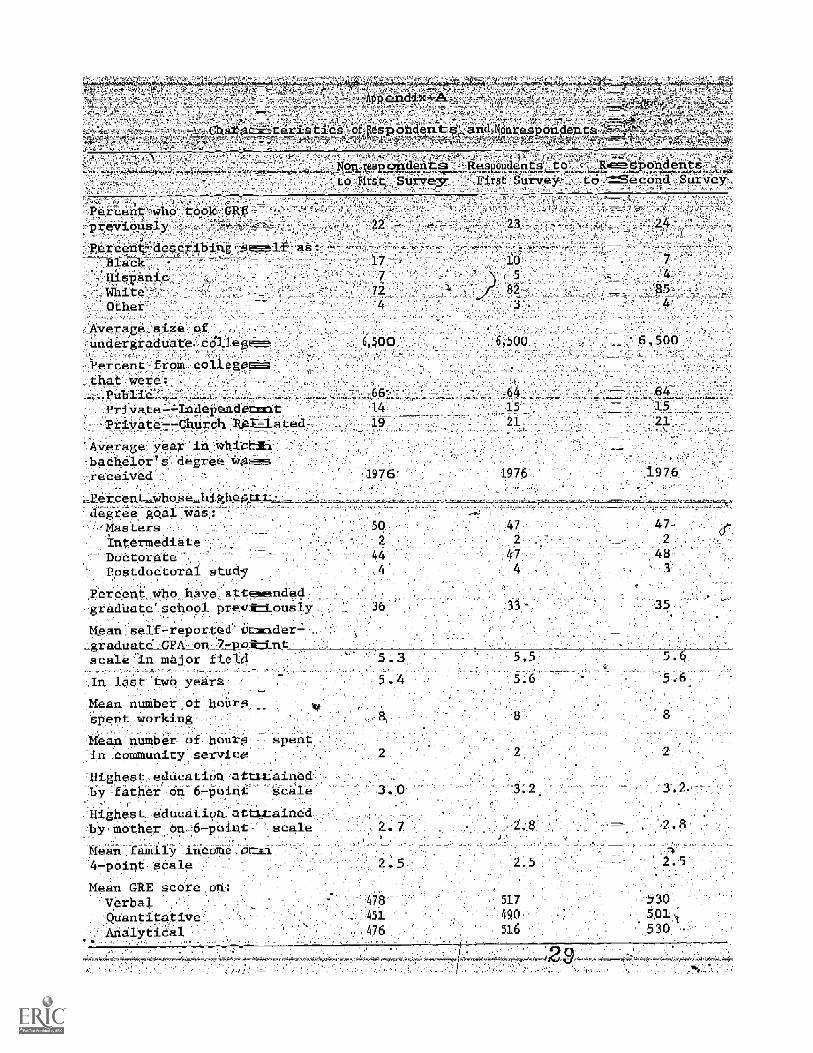
As shown in Appendi x A, when their respOnses io 'the ORE backgroundinformation questions were coMpared, there was virtually no differencebetween the respondents and nonrespondents in terms of the type of collegethey had attnded, year of receipt of the bachelor's degree, degree goals,previous graduate' school attendance, hours per week spent working forwages, hours spent in community service, and social class of theirparents. The 'respondents included a smaller proportion of Blacks
. than would have been expected (but not Hispanics). The ORE scoresof respondents were higher than those of nonrespondents, but their under-graduate grades in their majors and in the last two years of collegewere the same. There were ample numbers of respondents in every scorecategory,,- do the relationships of conclrn to the-project could beexamined. '..
. There :may be bias in the sample because those who had positiveexperiences in their graduate applicatiens would be more likely to.respond. (ilcontrary theory is that those who had negative experienceswould like t uke the aurvey to indicate their displeasure with the
-37
admission, procesi and would be more likely to respond.) In any case, the '.-
GRA scores of respondents were higher, although, as analyses to- followwill suggeSt, -it mey be that the basic picture of the admission process.provided -by the :results of the proiect would not be greatly altrd' evenif a near-perfect response were attained.
In fall 198b a follow-up questionnaire' was mailed cn21.37 to whocompleted }the address update. This procedUre'wee usedItolteep-the costsOf the project within reason: (this second-questionnaire is reprodtrce
- =
APPendixC end will be described later in this (report
Analyses of First urr{
. The analyses:reported first are. based on,responses to the first -
follow-up- (the addresi updAte form), which asked- candidates' the number ofdepartments they_had applied4to,'Ihe number ,that had-accepted them Ifany,and, if so', whether elle of tbese deParments was their first choice.
Using this information, and Applicants' responses to background=questions when they registered for the GRA and their GRE scores wewere able to determine'the extent to whiCk'APplivationadmission,apd-enrollment decisidhs are-affected by-such':Veriables-as eek, race, field;social 'Class, academic performance, and. teat ACorea.
The sample consists of 1,647 applIcants planning to pursue graduatestudy in psychology; 1,899 in English; 1;974' in educatior; and 632 inmdcrobiology. Data, were calculated for the- total groUp. and separately.formen and women;:Blacks, Hispanics, and Whites;' applicants from faMillep ofdifferent social class;-- applicants planning-to.enterdifferent fields;students with different grades; and applicants with different test scores.Thy test score categories are approximate quartiles based on GRE-nationalnorms. e.NTe sometimes vary, be6ause of missing data in thejiles; in afew :cases including GRE scores
Results
Tab.le,1 shOws the stand ng ovariables:
1 The percentage of--.each group who had 'applied anywhere, a' simple-baseline figure of the application behavior of GRE test takers
4
The percentage,who-applied to more than one department, a possiblemeasure of the extent.towhichuandidates are, ipte sted.s..mainly in onedepartMent-or are considering more
The percentage of those who 'applied who` ,were offered admission_ to-
. least one dePartment, a possible indicator of the presumed admix'bility of applicants.
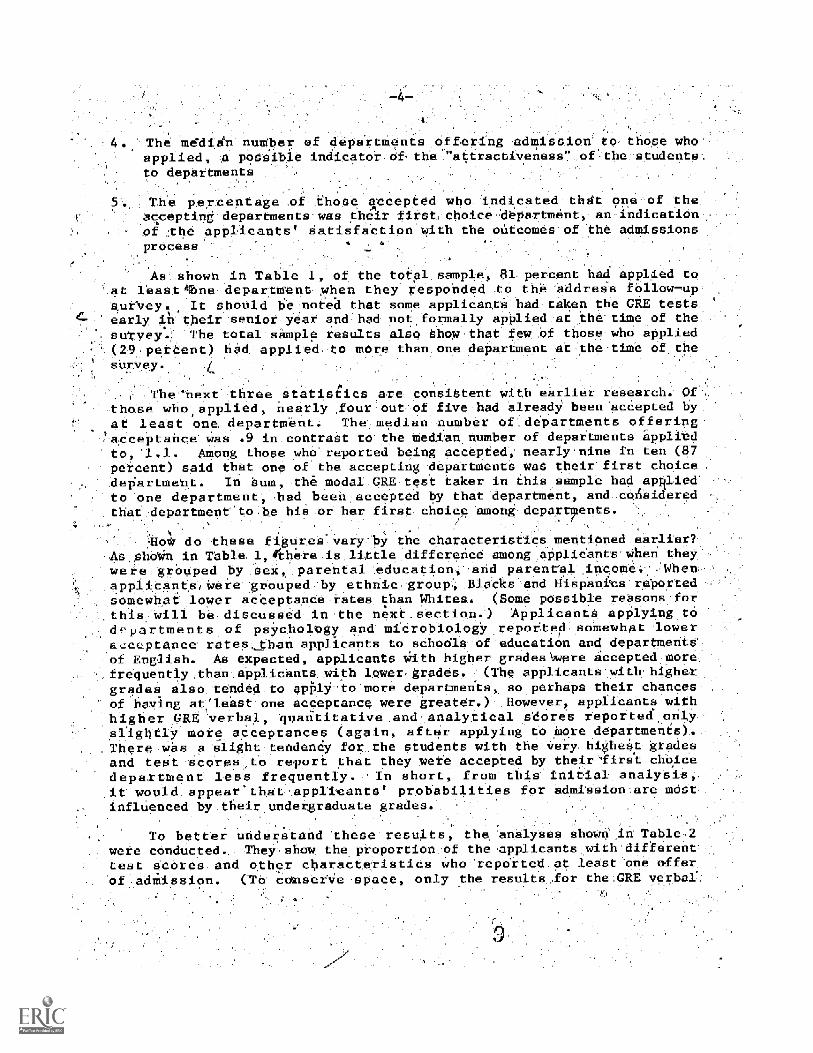
AThe median number of departments offering admission' to, those whoa possible indicator-of the "attractivenese nfthe-students%
to departments
The percentage of those accepted who indicated thdt one .0 the, A
accepting departments was their first. choice department,- an indicati on:of the applicants' satisfaction with the oiitcomds of the admiasionsprocess
As hown in Table 1, of the total sample, al percent had applied to.at least Rine departbent when they responded to the-address follow-upaufVey. It should he noted that some applicants had taken the GRE tests
''early 11.1 their.senior year and had _not formally applied at the time of thesuryeys. The total sample.results also show-that-few of those who applied(29 petcent) had applied- to more than one department at time of thesurvey.
AThe 'next three statistics are consistent with earlier research. Of
those who,applied, nearly four out of five had already been accepted byat least one department. The. median number of.departments offering
-'.acceptance was .9 in contrast to the median number of departments appliedto, '1.1. Among those who reported being accepted, nearly nine in ten (97percent) said that one of the accepting departments was their first choicedep;artment. In bum, the modal GRE test taker in this sample had appiliedto one department,,had been accepted by that department, and .consideredthat.department'to be his or her first choice among departbents.
How do these figures vary by the characteristics mentioned earlier?.As shown in Table. 1, (there is, little difference among applicants` When theywere grouped by sex, parental education, and parental income.---Whetr-applicants,i.Jere -grouped by ethnic group; Blacks and Hispanics reportedsomewhat lower acceptance-rates than Whites. (Some possible reasons-forthis will be discussed in the next section.') Applicants applying todrpartments of psychology and microbiologyreported:somewhat lowere.,;-cptance rates than applicants to schoOls of education and departmentaof English. As expected, applicants with higher .gradesWere accepted morefrequently.than applicants with lower.grades, (The applicants with highergrades also tended to apply-to more departments, so perhaps their chancesof having at:least one acceptance were greater.) However, applicants withhigher GRE verbal, quantitative and analytical adores reported onlysligbfly more acceptances (again, after applying, to bore departments).There was a Slight tendency for the students with the very, higheGt- gradesand test scores to report that they were accepted by their first choicedepartment less frequently. In short, from this initial analysis,it would appear' that -applivants' probabilities for admission-are mostinfluenced by their undergraduate grades.
To better understand these results, the analyses shoWn,in Table-2were conducted. They-show the proportion. of the-applicants with different:-test scores and other characteristics who o-reported at least one offerof admission. CTo conserve space, only the results for the GRE verbal
e.1
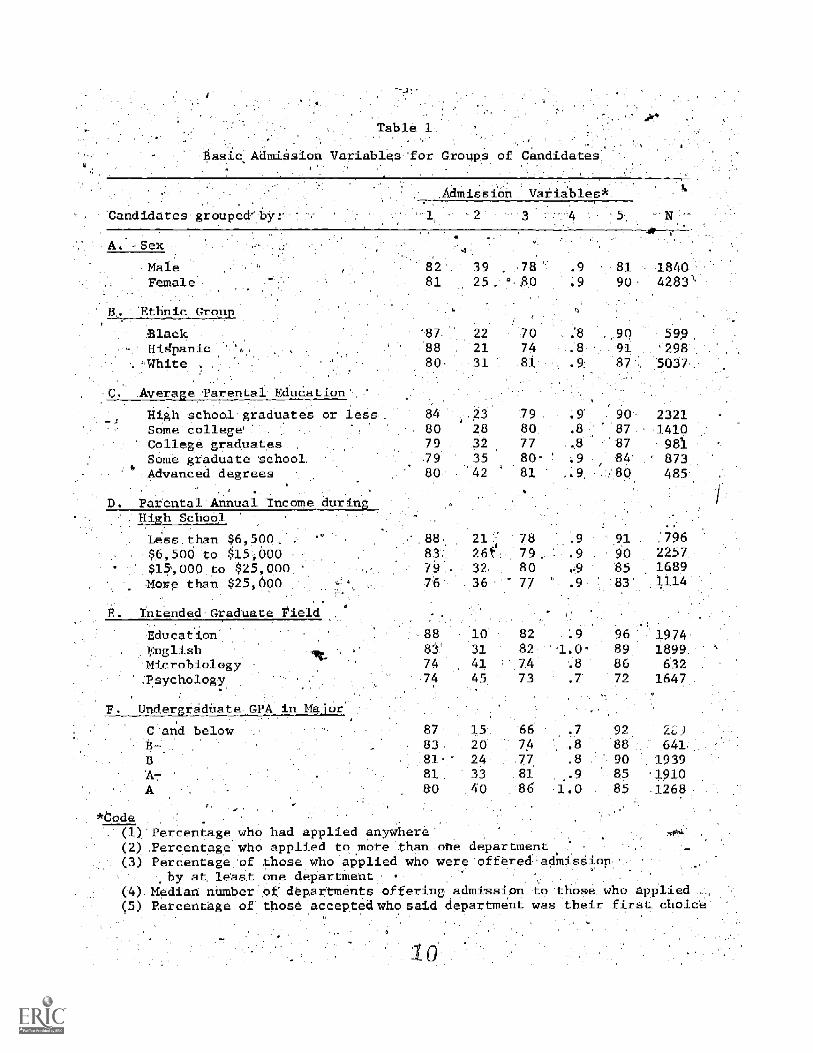
Table
Basic Admission Variables 'for Groups of Candidates.
Candidates grouped--
A. -Sex
MaleFemale
Ethnic Group
slackHiipanicWhite
Avera e Parental Education
High school graduates orSome college'College graduatesSome graduate school.Advanced degrees
Adm s ion_ _ Variables
2 4
82 39 78 .9 81 184081 25 80 .9 90 42831
-87 22 70 .90 59988 21 74, 91 '29880 31 8i. 87-.. '5037.-
less. 84 23 79 .9- 90 232180 28 80 87 141079 32 77 '87 98179 35 80' .9 84 87380 42 81 -9 .-, 80 485
. .Parental Annual Income duringigh School
Less than $6,500,$6,500 to $15,000 -$15,000 to $25,000More than $25,000
8883
76
21 "= 78 .91 796261e.-. 79, .9 90 225732. 80 85 168936 77 .9 -83' .1114
Intended Graduate Field
Education` 88 '10 82
English 83' 31 82Microbiology 74 41 , 7.4
Psychology 74 45 73
Under. adnate GPA in M
C and belowE-
A-A
87 1583 208l- 2481 338,0 .40
Percentage who had applied anywherePercentage who applied to more than one departmentPercentage of those who applied who were -offered - admission
by at. least one departmentMedian number of departments offering admission to those who appliedPercentage of those accepted who said department was their first choice
6674778186
.9 96 197489 1899.
-.8 86 632.72 1647_
9288 641.
90 193985 -1910
85 1268.9
1.0
1 0
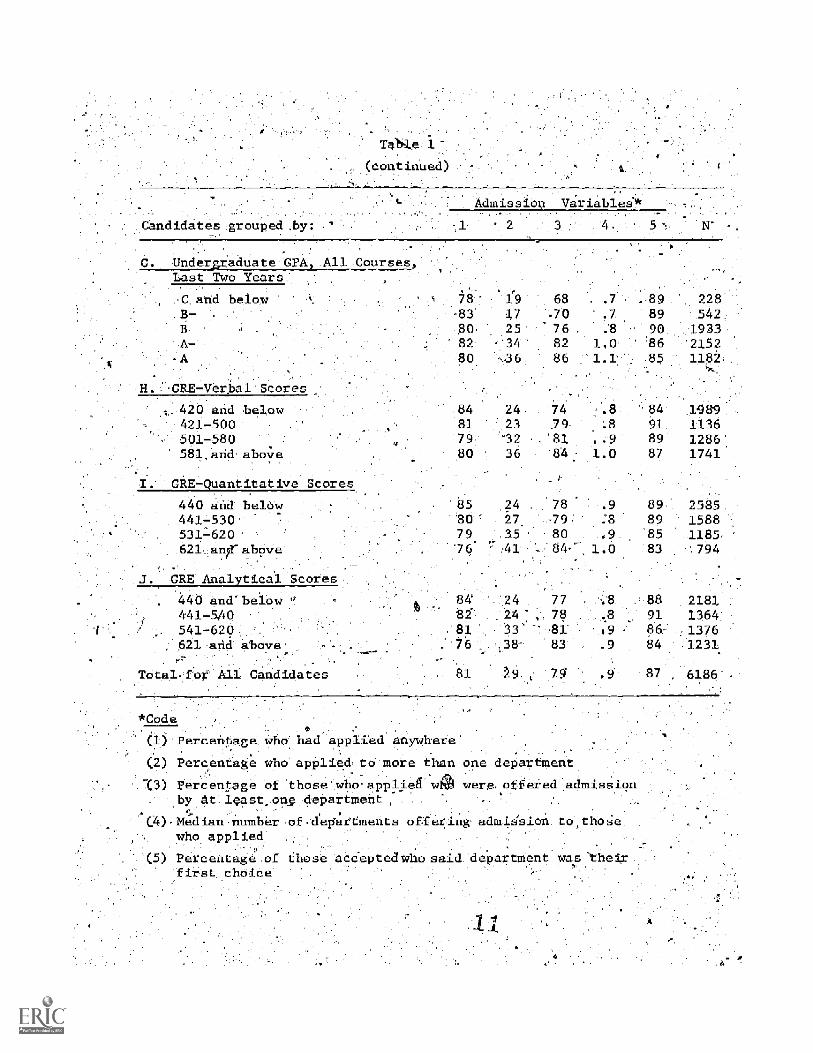
T4101.e 1
(continued)
Admission VAriables'*
didates grouped ,by: ' 3.5 4.
Und -aduAte CPA, All Courses,Last Two Years
- .
C. and below 78- 1`9 68 a89 228B- 83 17 470 .7. 89 542,-
80 25 76 90 1933A- 82 82 1.0. '86 .2152A 80 86 '1.1. 85 1182
-GRE-Verbal' Scores
84 24 74 84 196'9.420 and below421-500 81 23 79- .8 91 1136501-80 79 -32 . '81 ..9 89 1286'581, and aboVe .80 36 84 1.0 87 1741
RE -t antitative Scores
440 and below441 -530531620621an
78 89-79 :8 8980 9. 8584-- 1.0 83
25851588:1185.794
7. GRE Analytical Scores
440 and below 0441-MO541-620621 -aAd above
. 88 218191 136486- .137684 .1231
Total. for All Candidates
*Code
(1) Percentage wha had applied anywhere'
(2) Percentage who applied, to more than one department
13) Percentage of those who applie4 w ' were offered admissionby At last. one department ,
(4)-NZdian number of -departments offerwho applied
87 . 6186- .
Percentage of thosefirst choice
ng- admiis nn thoge
=
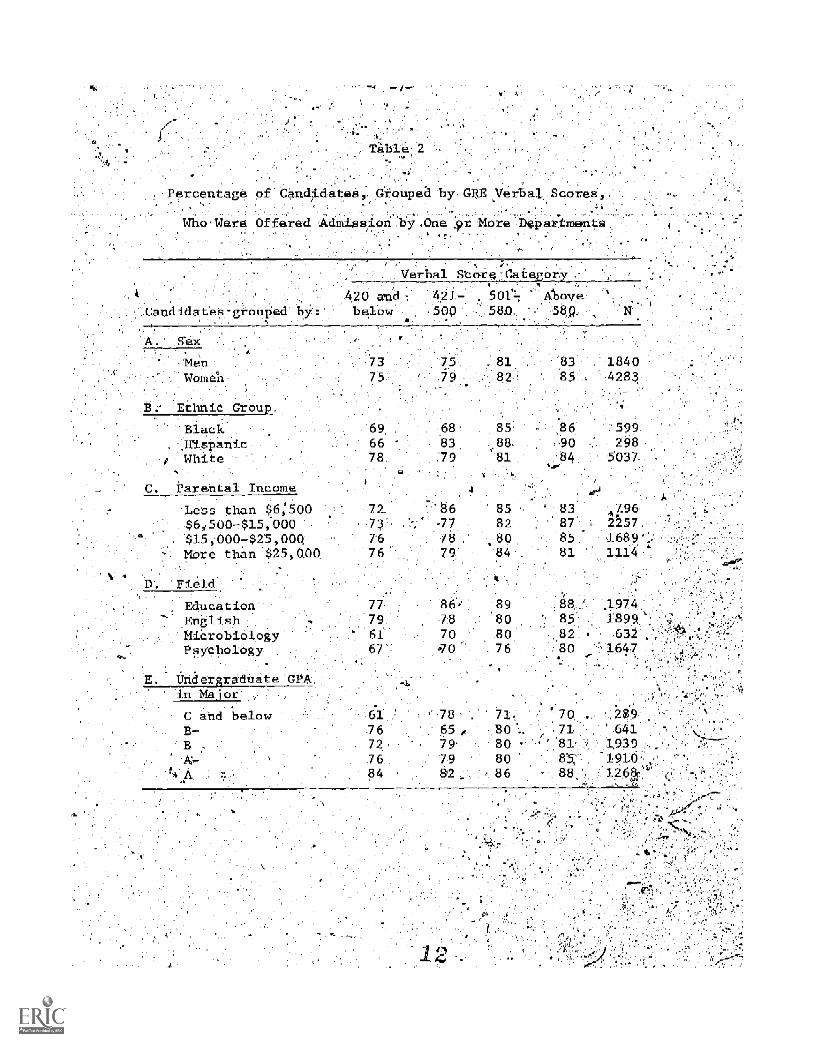
Table 2
Percentage of Candidates, Grouped by GRE Verbal Scores,.
Who.Were Offered Admlission by One .9r More Depar-trients
Candidates grouped b);:
Verbal Store-Category _:420 and - 4 21-below 500
501;580,
_Zbov.e
Sex- Men 7 . 81 -83 1840.Womeh 75-T. 79 82 -85- '4283-.-
Ethnic GrouBlack 68. 85 86 599Wispanic- 66 83 88 ,90 298White 78 :79 81 -84 5037_
C. Parental Income_
Less than $6:500 -71 86 85 -83 796A.$6,500-$15, 000 ..78 -77 82 87 2257$15,000-$25,000.. 76 78 .80 85 1689 ,-More than $25,000 76 79. 84 81 1114
FieldEducation 77 86-- 89 88_ .1974English 79 78 80 85 1899 _Microbiology 61 70 80 82. - 632Psychology 67- .70 76 8u -1647
Undergraduate GPAin Major-C and bel ©w 61 ''' 78 71 70. 8.9
B- 76 65 , 80 ... 71 641B . 72 79 80 :-. '81= 1939
76 79 80 85-: '1910'A 84 82 - 86 - 88 , 126&
score' grOups are' shown; the -results--- for ithe =quantitarive scores were__ _ _-___ ---,substantially the -same)-. :In. :most cases, the of 3.students ,
r epo rti n g
;-at
-least -6rie_offirpf adMissio n rises -ad the -test= s coke_ rises.are_also- some gronnidifferendes_-wrth =noting. -Foremid e t --eachwo we're- accepted slightly -1m-ore frequently -tt-an_men, --possibly_
because a _shoi-gn -other- artalyaii` z-Iwomen'Jiad-aoMewb-a-t-higher "grides._The reported aeceptande,:rate does not, seem to -be related to-parental- -
income, _but-__it is related to undergiaditate-_gradee andi_testIsc-ores'.--_-The
acceptance -rate- 'among:-students with -low- -test- scores_--buti high- grades.-Ls -striking In the :-two -upper -score_ categories minprity:_student-reportled_ acceptances _slightly More_freqUently_ than Whites.;-; iroWeVer;:rinthe, -foweat category=, Blacks, and-Hispanics' reported fee-i,JACCeptances--This- may "b 6-aue---_to the =facrithar students -tend to take the Glate in, the year and may----simply nit= -have-hear&-:front-_,frhe-deparbients-;_---
which_=_ they applied-..whem:they responded_to_ surge'_
The- same .variables iiere analyzed by GRE Advanced Test seoreanalyzed,quartiles.= With the exception of applicants in education, students withhighif test scores tended totapply to more_departments. Am. examination ofthe results suggests that tAe percentage reporting acceptances appears tobe more strongly. related to Advanced Test scores than to verbal and_
quantitative ability scores. It is unclear whether this is because the/Ca-Cokea areTmore-seieckVe,7:--Criaitjpry---
beeause departmenes with such-requirement-a place more weight on--11.aVancedTest scores.
- Clearly- these results "may be due to self -se ction of applicants todepartmenta, a x.ossibility that was _examined the second follow-updata were- analyzed--;-,-&
_.
Data_=
=Follow-up Analyses- -
The follow-up was _mailed to- the-reppondents in the first survey atthe address they provided earlier. -_Only the respondents to the first-survey-were sent the second. Because of-varied academic calendars, thefollow-up was mailed in dfall._ .The` second survey was returned. by 3,512former test_takers.. In addition', 625surveya were returned, becausethe U.S. mail could not deliver the-M. -.Thus, the sample represents 63
.
percent of _those who-presumably -received the second survey. As shown inAppendix A, the respondents to the second survey were very similar to therespondents to the first survey in terms-of ethnicity, type of college,years sinne obtaining the bachelor's degree_, -degree-goale, 'previousgraduate experience, undergradnate grades, 'work' and community-serviceexperiences, and parental social class. They had somewhat higher GREscores.
It is --difficul- t -to---assess the nt to--which -those- With -=hore poSi-_ _ _
.tivelexperierices--would _be--rpore respond -to the surveys:` HoweVer;this i-yete a. rye- ry strong trend tilen some of Elie results that: fellow,
particularly the extant -tro. which students :KePorted_Ahac- their :GRE -scores= nf uericeth- their 'decisions berldifferent.: =Me_ -retprn:col- chi_
point -later.
The information collected in ehe.survey -included-the. depai6ment-s thendidaVes actu- 4.3, applied to = if. any), -the (Ines at"which they were'
accepted, and : a ones in -Which hey, actually- enrolled. SiTheir:degree of
satisfaction _fe w -ob,-,tained -.On= a fivepoint;:scale.- Theywere also asks _-about-' e_ their filarye-d: in the=- choiceof ,depkrimen'ts to they applied an5L for their perception of theinfluence their: -RE_scords had on the departments' detisions. The'-,candir
ates_:who were _admitted" we re-- _asked-- 'about their _curreni-activitieSatus etc. their plans for fiirui`e-_-.:_grquate enUcation-7 an
rum about,-ther_role their GRE-jscOres:_badon-thiir
A S-eparate l_ VE- insti_ tutions --to students applied wagconstructed witha -code for the nepartments1,- prestige based, on ratings
made by Roos&-ind -Andersen (1-970)_for.each- field. In. Cape of_educa--.. -
tion, the ratings made by Gourman (1981))'' Were nee-d. The the, .
usage of Schrader (1978) -5-distinguished;---4=strong;_, 2-ade-quati-1=not- listed.
-Arta3
The analyses were designed--to obtain Some basic informationabout _what actually happens to applicants with different GEE scores and
_ different personal and academi -charecteriitics.
Results for -Admission .Variables=---
The admis on_-and enrollment variables- we Were' most interested_, re_ listed glow:The mean number of departments to:which the respondent
2. The percentage- who applied to more than one. department
The percentage of thobo_ who, applied who were offered -admission to at
least one department, a possible indicator Ile presumed admissi-.
bility of applicants
-applied -_
4.- The mean number of departMenis Offering admission to those whoapplied,- a possible indicator of the attractiveness of theapplicants to, departments
The percentage of the departments- to which the respondents appliedthat were- rated in the three_ top prestige ranking groups
14
. he---per-6entage of- trier ipartments at which-_the:applicants:were =._
--accepted- that :were --rated_ in- the, three_ top prestige ranking- groups
The percentages-who were offeted aid: by iat -least=_one deparrm-ent1,--, e_another, pass-11:11e _indicator, of the _a tt ractiveness- of the_ applicants--
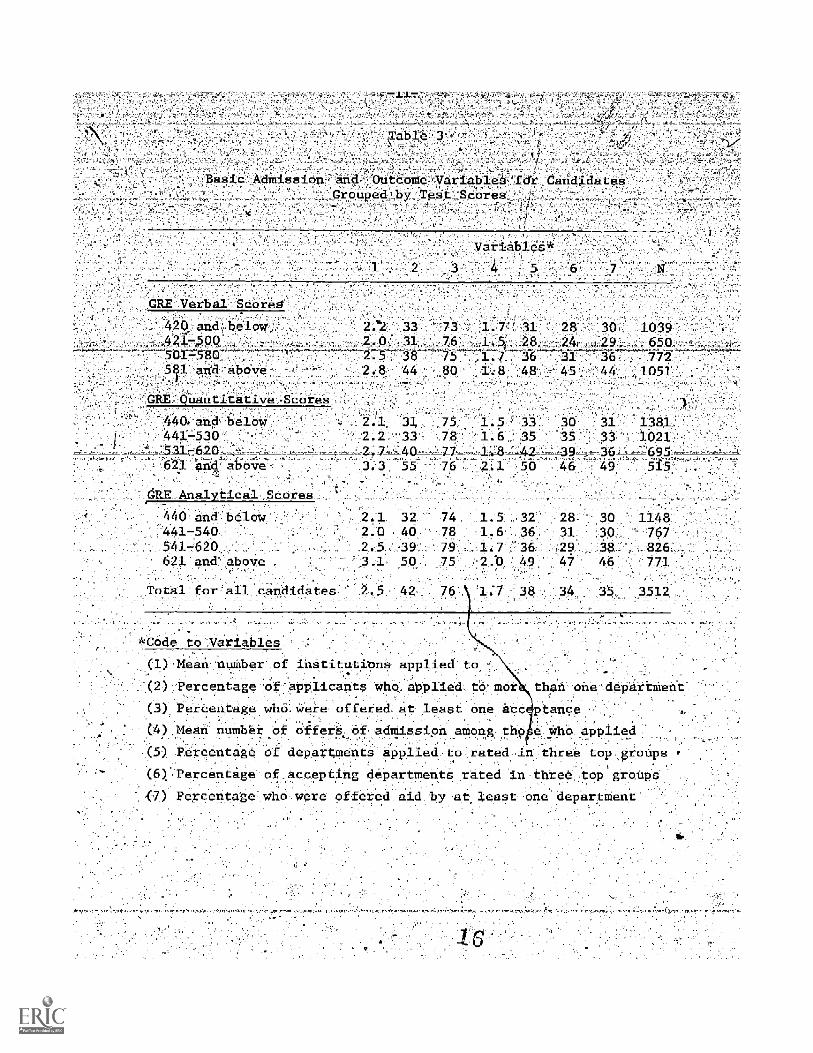
d ission Variables: 14sults. As shown at the bottomif Table-3, in column 1, _average candidate had applied__ to 2.5 depart--
,ments. -The total sampl results 'ffIso show that a- minority of those who-applied (.42 percent), had d-applied to more than one department (column "2
The next three_sts)tistizs are consistent _with the earlier results
as 'well as withearlier. researcF.: Of those _who applied,' over out
df-f-d'ur -Were accepted by _'at-- least one department. --The' mean "numher of
artme-nts:oftdring aecePtance--4.7as 1.7-(column 4) . (Again, the moda
category- was one=departnient-off--ertng acceptance)., nary; w-the percentage of 'applications end acceptances- that were from departmentsrated at 2.5 and above by Rotase--and Anderson. . (-Seventy_ 80 percent ofall departments fall below the?e ratings). Thirty-eight-Rercent. _of _the
departments to which applicants applied were rated this Expectedly,-
-a lower perceritage (34 percent) of the departments at which the respond-
ents were accepted were rated at- this level. ,
ofThe final figure-shows that about -a third of:thered some form of financial aid (column--1
applicants had been
._ -
Thus, :most applicants were offered acceptance .somewhere, but thtotal number .of offers-, like the total number of applications, -was' low,and the typical application was made to a department of moderate-prestige.,
Admi sion-Va Test §ctries. does
this picture ma by candidates' test scores? As shown in columns 1 and 2of Table 3,-.`applicafitS with bleier-merits --and,---as-'shnwn -in column-4, _tend
ad_mission-. HbweVer, as -shown in colreporting at- one offer: of admlcategories. Applicants with highersomewhat more prestigious departhaentsstudents are more often offered some f
res tend, to apply to more depart---re-ceiVe,s3olghtly:oregffetiof
the :percentagl- of- applieantson-is::Very similar acress'seope.:-
c res apply and are admitted toolumns -5 and-_6). Higher scoring -
'financial aid.
Admission Variables:. Results :nal and -Academic Chatactei
ow.does this picture va- h- applicants''personal
characteristics? As shownin columns 1."and 2 of -Table 4, males, Whites,
and applicants from higher soaioeconothic- status -homes applied to more
departthents. As shown in column 4, the mean nuniber of acceptances was
relited-to: parental social class. The prestige o the departments to.which respondents applied was Slightly related to all the variables
(column 5). AA
-The- prestige of the de-partnients- that accepted- the__applicants wasrelated to some 'of .'their personal characteristics. Concentrating on
Basic Admission and Outcome -Variables -'far CandidatesGrouped by Test Scores
420 -and below 33 73 -1 31 28 30 10394217500 _ 2.0 31 1 76 28, _ 29 _ 650_50158-0- 36 31 : 36 : 772
-abovean15 d 2.8 44 80 48 45 44 1051
atE_gvan titat iv e -Sea
440. and below 2.1 31 75 1.5 33 30 31 1381441530 2.2 33 78 1.6 35 35 33 1021
2 7 40 _ 77 _ _39 36 695.:
3.3 55 76 2.1 50 46 49 515:=5317:620
621 and above
= GRP Anal -tical-:$cores _
440 and below' _
441-540541-620,621 and above _
2.12.02.53.1
Total for all candidates 2.5
32 74 1.5 32 28- 30 114840 78 1.6 36 31 30 76739 79 1.7 36 29 38 82650 75 2.0 49 47 46 771
42- 76 1:7 38 34 35 3512
(1) Mean 'number of institutions applied to
2) Percentage of applioants Who applied. to-mar; -_ an one department
3) percentage who were-offered at least one age tAnce
(4) Mean number of offers. of -admission among thO e_ who applied
.(5) Percentage of departments applied to rated -in three top groups
(6) Percentage of _ accepting departments rated in three top groups
7) Percentage who were offered aid by --at least one department
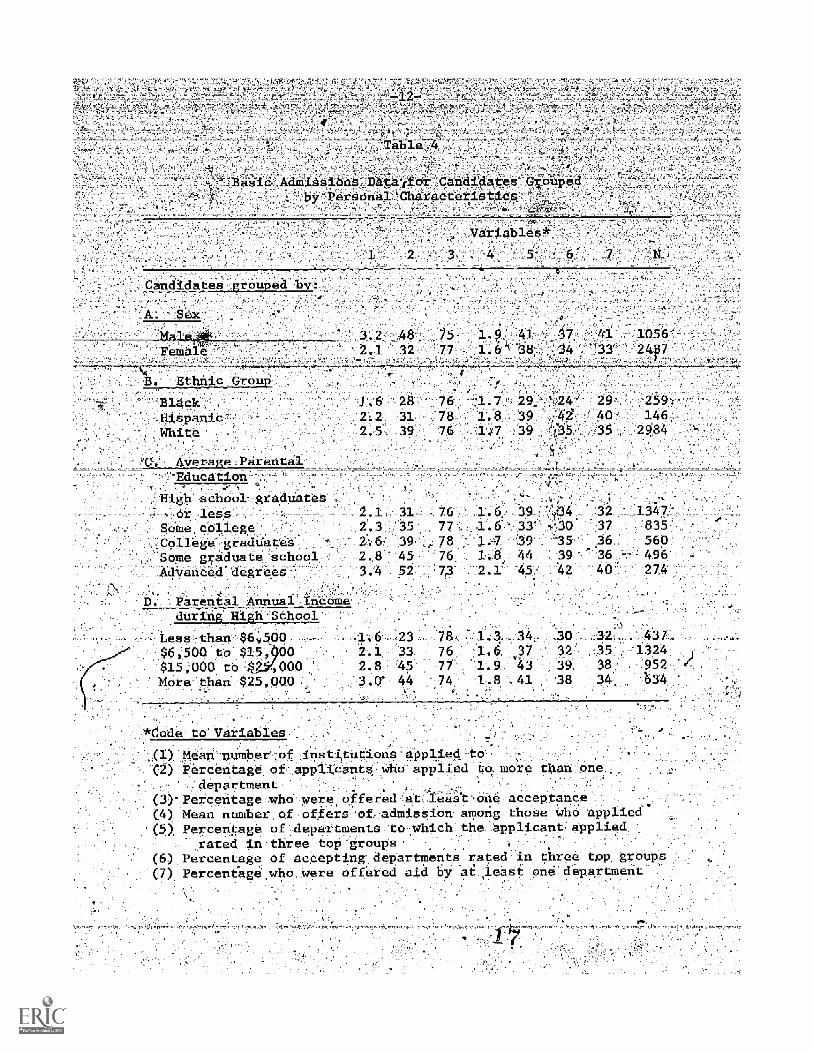
____,_Bas-id.lAdmiasiOns- Data-rfor Candidates Gion-p6d
by -Personal -Characteristics _--- _-=-..-
_
Variables*. -4
B. Ethnic GrouBleckHispanic-
1te
Average Parental-Education--
High school graduates- or less . 2.1 31 76
2.3:35 77College' graduates 2 6 39 w 78Some graduate school 2.8 45 76Advanced' degrees
Parental Annual' indome
3.2 _48 75 1.9 41 372.1 32 77 1.6-4
1.6 282.2 312.5 39
.
f76 -1.7 - 29, 24 29 259..78 1.8 39 40 14676 147 39 5 35 2984
Some college
3.4 52 = 7t3-
1.6 39- '..f34 13471.6 33' --:30 37 8351.7 39 35 36 5601.8 44 39 36 4962.1 45 42 40 274
Less than $6,500 1-.6 23 7H . 1.3 _ 34_ 30 32 _ _ 437__
$6,500 to $15,000 2.1 33 76 1.6 37 32 35 1324_$15,000 to .$2_V,000 2.8 45 77 1.9 43 39_ 38 952More than $25,000 3.4 44 74 -1.8 41 -38 34 634
(1) Mean numher ,of ,institutions applied to(2) Percentage- of applitants who applied tc more than one
department(3)' Percentage-who were oifered at least one acceptance(4) Mean umber of offers of admission among-those who applied(5) Percentagd of departments to which the _applicant applied
rated in three top groups, .
(6) Percentage of accepting departments rated in three top groups(7) Percentage.who were offered aid by at ;least one department
columns 5: ati'd 6-; It _appears that-Bla s --japp_-ii_iTio -and are accepted--b7 less__ ._ _-_._ ... ._ -- -------estitious_departments,:at_are applicanta 6f-lower'sdeial'Claaa._ Tliis_-_;__-,
may ,have -to -do--with the costs-:of--;the high-ei -ranked- institutions, -many --of.which_ are private. ; ,
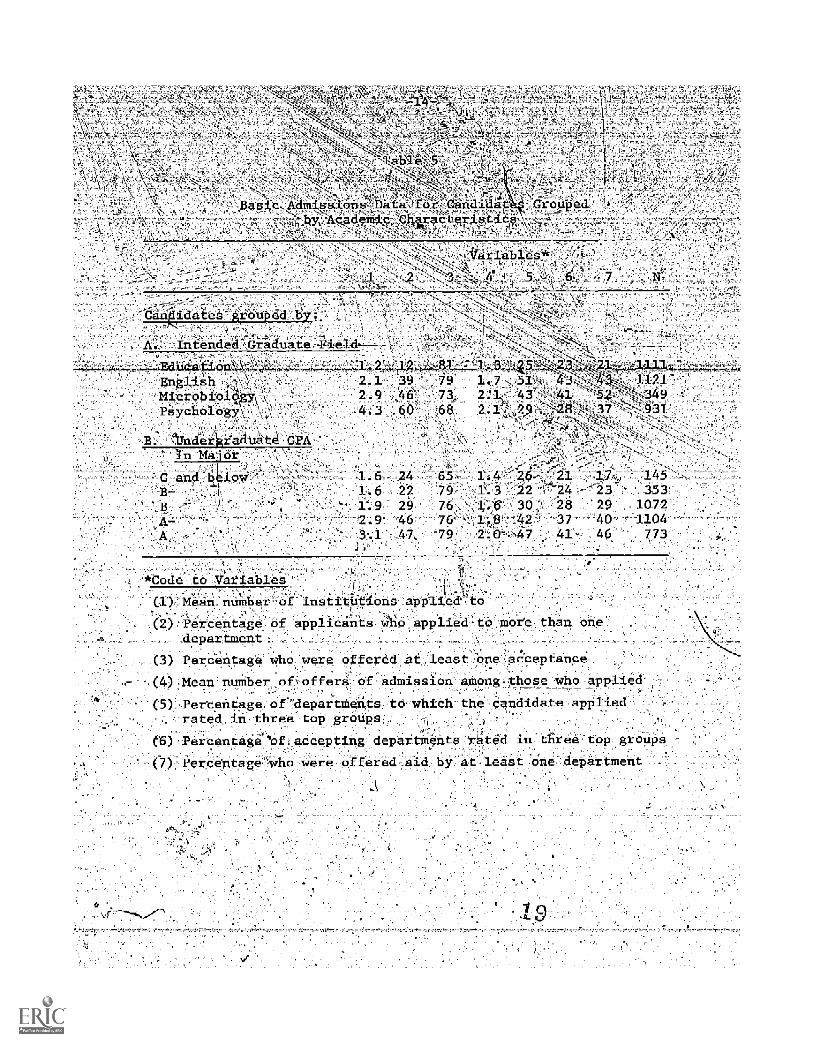
_showd in Table- _Applicants--in'EngliSh and Micropiology; applied-
to andwere_ acceptedr=by high.prestigardepartments-more-frequehtly than. applicants= in-education add psychology Finally; applicants with,better
undergraduate, grades applied to- and-were accepted by high aeatigements-morefrequently:ithan-___applicadts with: poorer trades. Inap-pear to have a stronger :relationship to the prestige of the departmentsof choice_ and accepting departments than any -other variable.
=
As shown in column -7 (Tables 4 -and 5), aid was- offered morefrequently to males`, Hispanics, microbiology students, and students with'
_
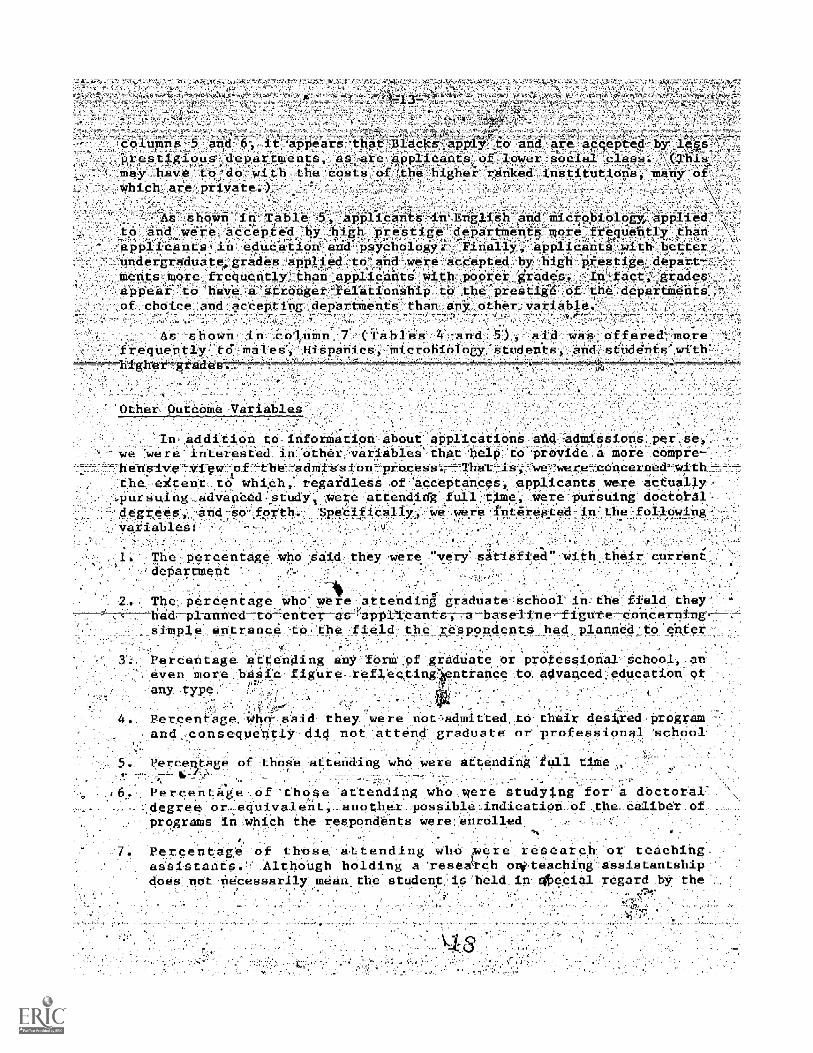
Other Outcome -Variables'
In addition to information about applications and --admissions per se,we were interested in other variables that help to provide a more compre-hensive-vi pew-of--the--admission-rocess.----That-is-,--wewere-concern ;withththe extent to which, regardless of 'acceptances, applicants were actually.-pursuing ,advanCed 'study, were attendirfg
wetime, were pursuing doctotal -
degrees; and--so forth. Specifically, we were rntropted- t-he fallowingvariables:
1. The percentage who said they were :-sredepartment =`=
satisfied- with their current
2.. The percentage who were attending graduate school in the field they'lied planned to-'enter--as-='appl-icants, a baseline-figure-concerning-_simple entrance the-field the respondents had planned___to enter
3. Percentage attending any forth of graduate or professional school, aneven more .basic figure- reflecting ntrance' to advanced education ofany- type
Percentage. who said they were nor-dmitted to their desired programand consequently -did not attend- graduate or professional school
Perce tage of those attending who were attending full time
Percentage of 'those attending who were studying for a dbctoral=degree or equivalent, another. possible-indication of. _the caliber ofprograms in which the respondents_ were enrolled
Percentage of those attending who ere research or teachingassistants. Although holding a 'research or*teaching -assistantshipdoes not decessarily mean the student, is 'held in facial regard by the
2
--dates -grouped- by
IntendecV Graduatecation
English--,
Psychology
B. =tinder faduate CPA'
old
2 .1 39 79 1.7 ,5 11212.9 ,446 73 2:1. 494.3 60 68 2. 1
In MajorG rand -hilowB-
A-
65-;---1-:-4 -----145 ,_ =_,_ _
79 1.3 22 -----23 35376 '_ °l 30 28 29 107276° 1.8 42 37 40 110479 2.0-.-47 41- 46 773
-1; 6----24 ----1.6 22
4' 1.9 292.9 463.1 47,.
*Cod -to VariablesI -
. (1) Mean. number of institutions applied' to
(2) )-Tercentage of 'aplicents who applied- tmore-than-onedepartment: _
(3) Percentage who were offered at:,least one p.ceptance
(4) Mean number of:offers of admission among. those who applied
(5) Percentage of -departments to which the candidate appliedrated in three top groups
e6) Percentage'of.accepting departments rated in three top groups
Percentage who were offered aid by 'at least one department
--department; t=of ew -the case- andi in general; y. be taken as asign _ ,_si of the department's yieWof theAatudent's merit. ,--- -_- -- '_ _,
_ initially _eicamiliTed- another.:_vafable;-_ drop iii- g,-nitt of=graduate:`chool.= :However,_=the' drepeut rate was to :low __and--so-,tililar across all
g g not'roupins that -it is- nt -lieres --_ -.,
. s.
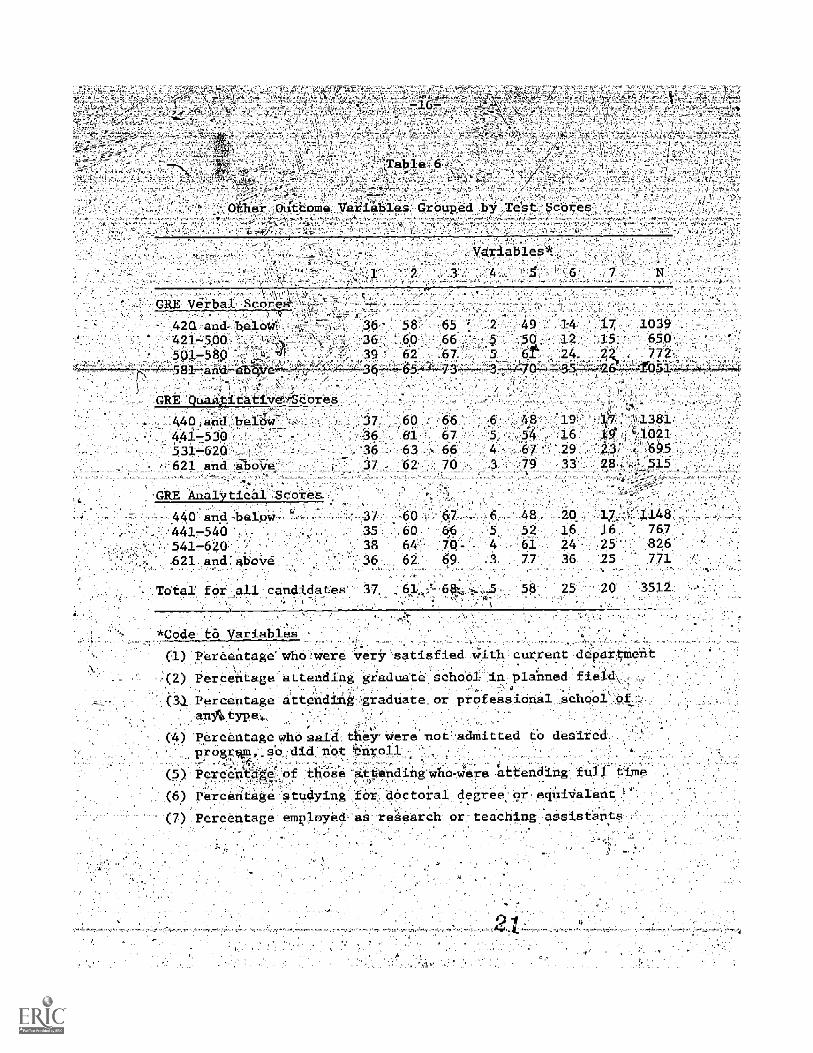
_Other Outcome Variables: _ Results%for Total Sample. --As= shown_ in__Column I- =of Table' 6,- a- littlei over- a_ third of these- attending graduateschool__were _7very,_satisfied"_-withl_their current departments.- (An--addi--__-
_ - - _ ._- __tional-41 percent_ Were 'reasonably -datisfied_;- altogether, sa= figure of 78
-__ percent being_ satisfied with-theirjdepartMents, perhaps. a remarkablemixed' .degree of _, satisfaction.- The _snext-respontLe: category was -I-have mixed_ =
feelings,.-7_)____ ,--__ --= _ , --
-On--`eithere---g-TO-Val------1--eve--11---;*-he--7--iifori-Ey-4-o---f-7----thedRe-4-&Eit-4-tikers---wei-attending :gradupte---school-_-in the fiele.they planned to enter- when -theytook !the_-GRE---(coluain- Z).7---_,Altogetheri- over _two-thirds- were studying -_ :n- -.some graduate or professionallfield (column 3)._-:Before-concluding_that a _third were refuted _admission --td advanced education; it shoUld- be noted
rthat= other- results showed that-5 eicent were still= under--. . .
graduate college and percent said 'that they had -completed. their graduate--- ----fici-ltkn.-- _=- OfilY,.2-.7_pe-reent_saicr-___they---bad=-:--entered-t-gradhatet'snhonitInt--:_dropped :_-----:
but. in.-additipn, 7 percent said they, had decided not ot- attend for...-- . .
financial reasons, . and 11 percent -said_ theyshad cifteided_ to postpan.e entry-
to -gain-dome- we rk- experience.: In -fact ;--.-ai--shownin-Colnmn -4;-:Only- one,-in twenty said they had not admitted to,adepartment of theirchoice and, condequently ; _did_ not -attend. The majority =,o ittenders werefull -time students (Column 5)4:the median student was also- -working :20, hours a :week for pay. Twenty percent : were _Working as research- ormeekteaching_assiatants (aolumn 7). -Interestingly, as shown:in_-Coliumn 6, nnly
s:s _quarter- of the respondents were studying_ for' a doctorate; the rest were-ttilying---f-or--thatrer"-s---degrees-nrcertificates.
- Thus, a hypothetical -typical"' respondent had applied to one or two.departments of moderate-Jirestige,, had, been accepted by at least one
_department, -again of Moderate -prestize, _enrolled at -a department in hisor her field,, was studying fora_ master's degree, was satisfied withthe department, and was- working about half time. The student was onlyslightly more likely to be studying :full time,than part .time.
Other Outcome. Variables: Results by Score Groups. Again, as shownin Table 6, higher --scorers -were more frequently = studying full time and _pursuing doctoral degrees-. High scorers were somewhat more frequentlyemployed as:research or teaching assistants. Mere were relatively smalland -insignitinant differences -across score categoriee:on the_ remainingvariables.
Other Outcome -Variables: Results b Personal and_ AcademicCharacteristics. Interestingly, in analyses not "shown to conserve space,satisfaction with the department appeared to be_tinrelated to any personal
. .- _ - -
Other Outcome Variables Grouped by Test Scores
GRE Verbal- Scoie'rs sr-
_ _=-_ _ Variables*1 2 3 4- 5 6 7_ N- '
_
420. and- beloWl 35421-500= ---- 365p1-58,0 39
58 6560 66
_
62 67-
--f =r25
_ GRE QuantitativeAcores37 _60 66 6440 ,and bel6w _s _
4417_530 36 1 1 67 5531-620 ;-36 63 = - 66 4-621 and abeilie' 37 62 70 3
GRE Analytical Scores440 and belpw- 37 60 --
.6
441-540 , 35 60 5_
541-620 = 38 64- 4621 and-- aboiie 36. 62 69 _3_
Total for all candidates 37.
*Code- to Variables
-49 -14.50 12 15
- 24_ 22
1039:650772
48 = 119 17 : 1,1381- 54 , 16 I9 1021
67 29 -0, 69579 33 28 . 515
48 20 17-{ 11485261 _
77
58
16 16 76724 25 -_ 82636 25 771
_
25 20 3512
_(1) Percentage who were very satisfied With current department(2) Percentage attending graduate school in planned(3.1 Percentage attending graduate or professional school of__
(4) 'Percentage who said their Were not admitted to desired- progrw.;_s'o did-not enroll
, -
(5) Percentage: of those -attending who-Were attending full time_ . ±_-- -
(6) Percentage studying for doctoral degree or equivalent :--- (7) Percentage employed as research or-teaching-assistants
"7- - - - - 2 1
.
--icharacterist as = e try -int the apg cant_ s_ planned field.--time attendance was lesa:comnion- amiing-Wpien,_minorityrgroups,-and students-f rpm lower socioeconomic -status homes Pursuit of a doctoral- degree ,-was_,
_reported -with greater, frequency-- among men_ and-respendents'Stoal -high- social_- status homes. Research- and reaching assintantahips wete more _common= _
among Whites.-
When the ,data- were- examined by-the academe charattfirlstics -of-Applicants ,---t-he results of most-interest -include the Tfollowing: _,,reports --
, of-nor,' getting into a desired program_ and-consequently-not enrolling in_---_ -graduate ' school - were more frequent l among -applicants _planning, to 'Study-, - -'. __ .psxchology--1_-artil lapplicants = with Low grades-. -'' Applicants - intending -to-.-.-
= Study :microbiology -end -psychology and applicants .Witliibetteirigrades_wete.pursuing doctoral, degrees more 'frequently than other-applicants-----1-Z,Finally-,-,- --applicarat&in_ microbiology and FinglAsh_ and applicant &-with- higher grades _
-1_7:=.--olit_-a-i-itati:;,;realearChand_l-teach-Ing-Li--asni-s-tantsh-i-pni==tnore,:ofterian'=-o-ther- _,---
applicants..,.., _ _ _
_
_ ,_: :. -,-: .- _
_ 7/ _
Views of the GPM Tists and _ the: -Ad:ass/on- Process ;. , '
In addition to determining tire ic- information about 't the-admission-s u, ..---_process,,,-it-inimportant-to-gain----Information-abeut----appliC:nets--1-==views-of-------
the admission" process, that is, what they think are the e--majer factors in --.
adtissions, how they feel _about the. oRE tests, and what influence theyfelt the tse_sts had _on their departmental choiced. Specifically`, we
.---.exantined the- folloi.Ang: -- the- percentage of respondents considering the
e
GRE Aptitude ..Test and Advanced Tests to,-bn fait (the.-options.'were "-veryfair,- .-pretty fair," 7'not _ too fair,- and **unfair !.); the percentage
= of respondents who ---a id their GRE Scores caused them._ to apply to moreselective or less seI ctive- departments, and the percentage who felt that .their GRE scores I:acts:0 influence on their choices. We also examined thepercentage -of teapondents-Whosaid that they-had-already applied-to---theirdepartments of ,choice before they_ received their GRE scores.. Finally,we also studied the percentage of respondent,s who said that variousfactors had a -great .d etral"_ of importance in the admission decisiona of the, . . _,.
departments to which they applied._ These Included =college grades, theimpression the . applicants made- during an interview,- redokmendationà fromprofessors, the results of the -GRE, and the aadiereputations of their
. .= . . =-t cem-
colleges. (Two other variables were not included because they were soseldom considered _important in admission: extracurricular activities,considered to have a great-deal of importance by_ 2 percent ni:the respond-
,ents, and being a member-of an ethnic mitiority', considered to have -a.---great ---- .:
deal of ;importance by 4 percent of the respondents--although 20 percent of. the Blacks and 14 percent of the Hispanics considered it to have a greatdeal_ of importance.)
-
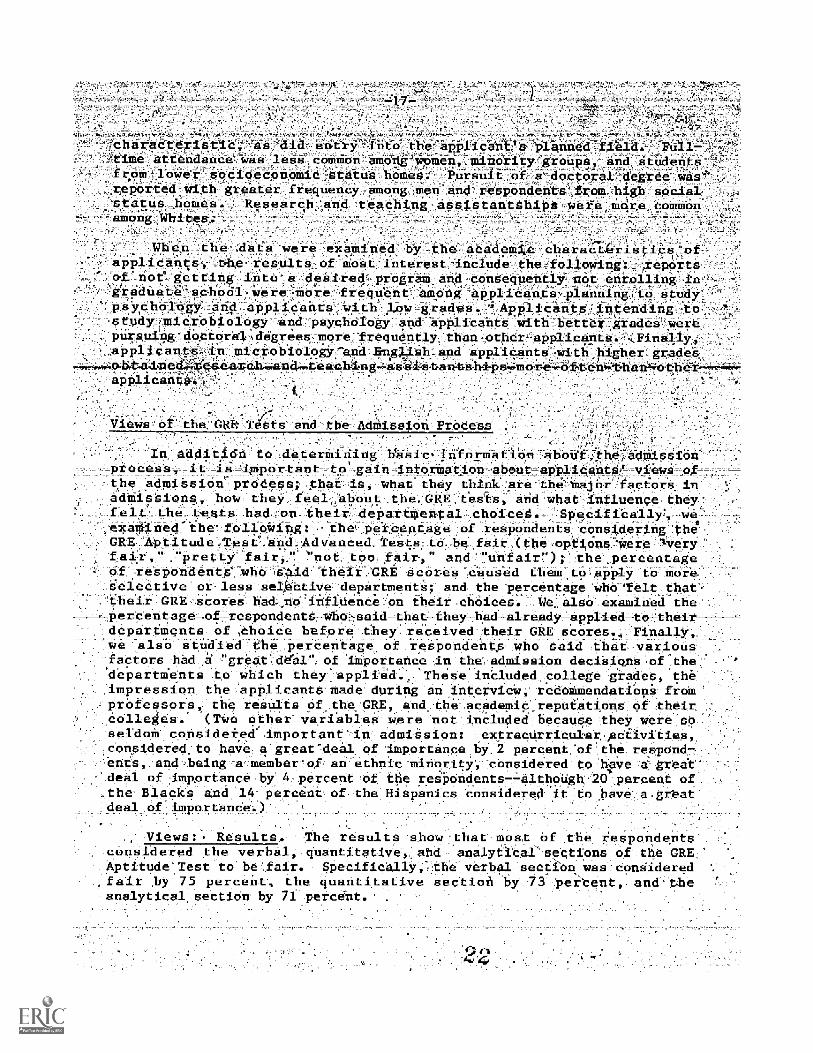
Views:' Results. The results show -rhat most of the respondentsconsidered the verbal, quantitative, and analytical sections of the GREAptitude Test to be fair. Specifically, the verbal section was consideredfair by 75 percent, the quantitative section by -73 .percent, encl.-theanalytical section by 71 percent.
This= picture varied _somewha with respondents'--test scoresith_higher_ scoring respondentebeing-_-ifiore 'favorable. -poWever,_ the _majority'
every 'is,core.: group, :including the loWeat,-C -d tonsiderehe'lptitude`iTeeifair. Applicants with 'higher grades were more favorable.- Applicants--in- fields ,related_ito_the.stest aiore:;fav_orable.-7=forelEample._-_,_ _ _ _._applicants -in English Were more= fel:Toy-able about _ the- verbal seCtiare, than-appli-cents in Other Minority, students were much:less -favo,rable=toward the test'Ithan Whites. Although-the. majority of hose who_hadtaken the GRE Advanced-Tests considered the tests fair (62 ercdnt), theercentage was noticeably_lower than those-for :the GRE itude Teat.
Overall,Overall, only 3 percent--of the applicants said- that th it GRE- scores_led them to choose_more selective departments and only_ - percent thattheir GRE scores ;led them to choose less delective departments. Fifty=sixpercent = saidi that their,-GRE _-scores .:had -net_ choice -_ =ofofdepartments, and another 34 -pertent said that'they° had"already_ applied todepartments before they received_their,:GRE scores,- so their scores,- too;did-_not influence..their, choices. " This picture varied rittle by testscores- and personal characteristics. The only_ exception was that16percent of the psychology applicants felt that their GRE 'scores had ledthem to apply to less selective departments. .-
-On the- importance of varioue factors in admission to the departmentsto which they applied, undergraduate -grades were clearly the strongest
`factor in the view of the respondents (60 percent thought,
they had a .greatdeal of importance), followed by recommendationa from profesSors (42pe.rc.ent). The next three factors were considered to be of roughly thesame importance: GRE sc-o s(26 percent); impressions made in interviews(21 percent), -and.. the ,aca ic reputation of -the applicant's college°0.7percent)`.. Again, these ews varied little by GRE scores or personalcharacteristics. The bnly exceptions. _ were that applicants with highergrades placed more importance on grades, and applicants with highertest scores' and those with higher grades placed more importance onrecommendations.
Discussion
The hypothetical "typical- GRE applicant in this sample had appliedto two or three departments usually of moderate prestige, fe'Ceivedof
_ acceptance= at at least one ..of these departments, and was etuding--ik.n.-his_-or her field the next academic year after taking the GR.E-. The respondentWas usuallystudying for a master's degree. Most respondents thought thatthe 'ORE tests were 'generally fair and very: few -thought that they wereclearly unfair. In :addition; the great majority-of-respondents did-notthink- that their` cRg scores had affected their choice_ of 'departments.They felt that GRE results were less .important than Undergraduate gradesand.,recommendations from professors -in the admission deciaions made by thedepartments to -which -they applied.,
-Thi general -pic6ure,-varies tomeigh-at . for- respondent-6 ,grou--ped="b1GRE_ _ _scores and personal cheraeteris but generaki-it -: _remarkably__
similar. across °groups:' =_,The most-,Important result of-_this' project_ mey'i,be_that ithere was some, evidenceforraelk-selecXiOn;mong. test taker- choosing--departments to 'Which -to apply:_ Hotbever; :most' this self-rselection:__teemed; to be :related -Primaidpy Xti-,iiiideriteduar-T6-`g rad6a'aiid:----leeeriderilyi-GRE t ear_ scores There is' at least- one good reason for this. sizablepropor Lion of the respondents applied _ to _depaitments before _receivingtheir- GRE -scores-. In addfiion, most =respond-eats _probably -rfound-rhat theirGRE scores were -fairly -consistent- with- their=undergraduate- grades. _-
Most respondents did not report that their _GU -scores- played a verygreat -role- in their educational decisions and did not believe=they werevery important the_-decisions that were made'_-abont them. That Is, -_-
aefoss_ score- categories, - respondents were:effered admissioni to ,at least-one =depitrrineirth-at--;1at-they'-'-wotild--13-e-'able'''to---ge-tte7-giadu-afe-----achoo-I---witapproximately _the; same_ frequency._ And, in fact ,_ reiporidents in each-score--category reported that they were attending- graduate or professional sdhooli'
approximately, the same _frequency .-= The- percentage t-.7hci:said they, werenot admitted te-Xhe department of their. choiee-and,--:-Corisequently , did not-enroll was very small -in- every score group. The percentage who reported--very_ small -in scorethat their GRE scores had .led them to apply to _less- selective departments_was-tv-ery-- the_7-maj-erity--saitt-thatthei-r=_GREstores-fhadthadtnet-t-t-tinfluence on _their choice of departments. One of the striking findingswas that theae.percentages varied little by scorecategory. Respondentsviewed_undergraduate grades as the-mosr-iMportant-factor-in-admissionsfollowed -by _recommendations from professors.- GRE scores were viewed ascOnSiderably7lesS:important.- The views Of-the importance of GRE scores.were very mush the same across score categories.
_ell_ together, these data suggest that most applicants _to greduate_school in this sample -did not see GRE scores as the_ prixile- influence ontheirffedncational--eutzemes. In theirHvieW; -thei-r-ownundergreduate-gradesand the recommendations of -their professors were the major influences.
GRE, scores were related to a' number of variables in the applicationadmission-enrollment process. Higher scoring respondents tended to applyto More departments and to more prestigious departments than lower scoringrespondents. They also were accepted by more departments and by moreprestigious' departments. They were offered aid and assistantships moreof ten. They extended full' time more frequently and were more frequently_in docteral programs. Interestingly, they reported-no greater or lesssatisfaction with :their dipartMent6. Expect6dly, they tended .to think the,GRE tests were fairer than did lower -scoring respondents. Of course, allthese results are complicated by the overlap- with undergraduate grades.High .scorers also tended to: receive higher grades. inowever, the resultsby both grades and test adores generally suggested an additive effect.
The chief reservation about these results is the degree to which therespondents were representetive of the entire sample. It Is probable thatapplicants who were not_ accepted to graduate school were less likely to
_
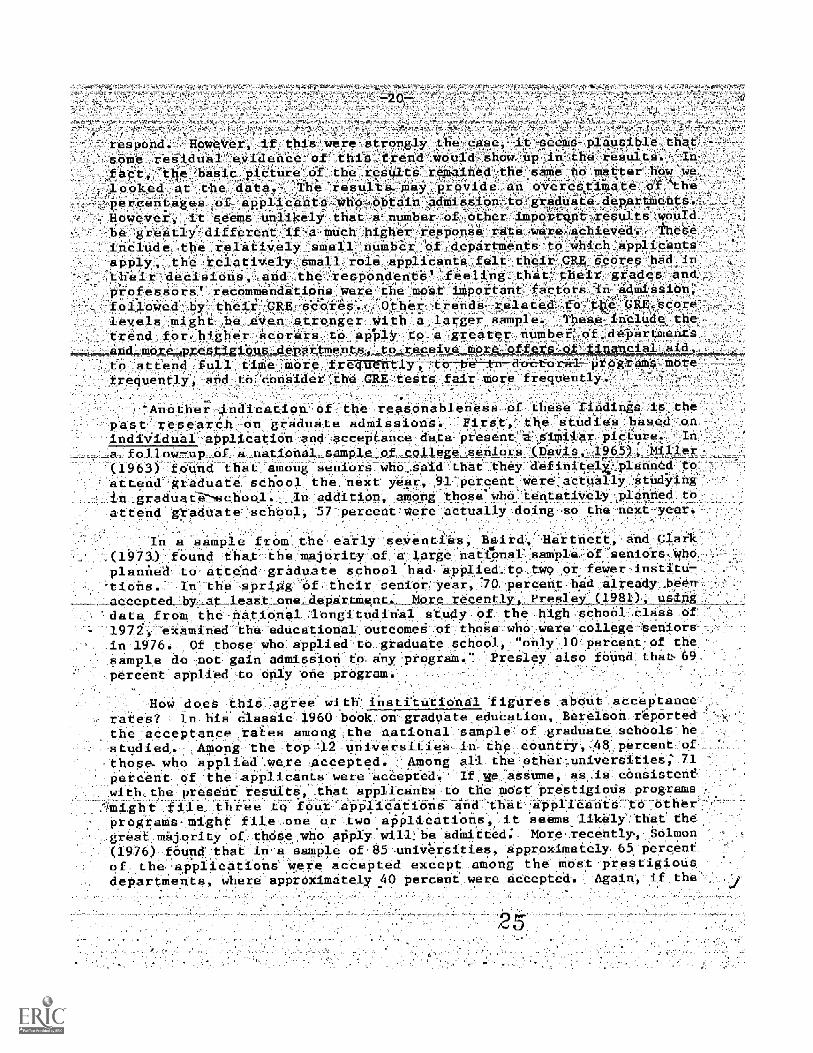
respond. However, if- this were-Strongly- the -case, it--seims- plausible that, _ _ _ _ ,
some residual -evidence- of this__ trend _woUld:Show.rup in the -results,: Infact :--the- basic. picture _ of the-results-:_repained-_ the semi no matter -how we =
--;_-_.looked at time data. The results--iay -provide in evereetimite of.the:_.---,:-pereifitages-of--applicafits_:who-Obtain---adsassion.-to:graduate depdartments
However it seems unlikely_ that -a- number of other -import_Rnt-resultewould ---
be greatly different if-n-much higher response _rate were achieved -Theseinclude the relatively -small number 'of departments-to which:applicantsapply, the- relatively,small role applicants felt their ,GRE scores hid intheir _decisions, and the respondents' feeling_ thet their =grades -and
professors' recommendations were -the most important factors in;adrnission,'followed, by their GRE seoren. _ Other _trends- related--eo:tke GRE score =
levels might be even __stronger with -a larger sample.- These' inelndei the.-=_ trend for- higher- scorers to ap-ply te_ a greater numbers of departmentsand.L.fnore4testigihnsdepittni_ents,toLreseive-more of fjnflcial aid,to attend full time more-IMA-Ve-trtlyrto---trei-ndoeteral---pre-grams---_morefrequently, and to consider the GRE tests-fair-more frequently.=,-
-Another _..inditation of the reasonableness- of these findis -is thepast research on graduate admissions.. First, the studies based onindividual application and acceptance data present pieture. In
a follow-_up, of- a national sample of_college seniors (Davis,1965), Iff.11er
(1963) found t hi t among seniar- wha,.said- that -they definitt--.plannedito.attend graduate school the next- year, 91- percent were=..attually studyingn _graduat-e7---school. In addition, among those'who tentatively _planned to
attend graduate school, 57 percent Were actually doing so the next year.
In a sample from the early seventies, Baird, Hartnett, and Clark,(1971) found that the majority of a. large nateenal sample of seniors. whoplanned to attend graduate school had applied. to two or fewer institu- _
In'the spring of their -senior year, 70 percent had already been =
2 _a c_cep ed_by at_le a sto ne department. More recently, Presley (1981); usingdata from the national longitudinal study of the high school class of=1972=,--ekamined the-educational outcomes of those. were college- seniors
in 1976. Of those who applied to graduate school, "only 10'percent of thesample do not gain admission' to any program. Presley also found that- 69
percent applied to only -one program. .
---
How does this agree with institutional figures about acceptancerates? In his classic 1960 book_ ow graduate education, Berelson reportedthe acceptance rates among the national sample of graduate schools hestudied. Among the top 112 universities- in the country, 48 percent. of- those. who applied=.were accepted. Among all the ether:universities; 71percent of the applicants were aceepted, =If we 'aasume, as is consistentwith the present results, that applicants to the most prestigious _programs'-,might file three to four applications and that applicants to .otherprograms- might file one or two applications , it seems likely that the
great majority of these who apply will be admitted ; More recently, Solmon
(1976) found` that in a sample of 85 -univrsities, approximately 65 percentof the applications were accepted except among the most prestigiousdepartments, where approximately 40 percent were accepted. Again,- lithe
_ _ _
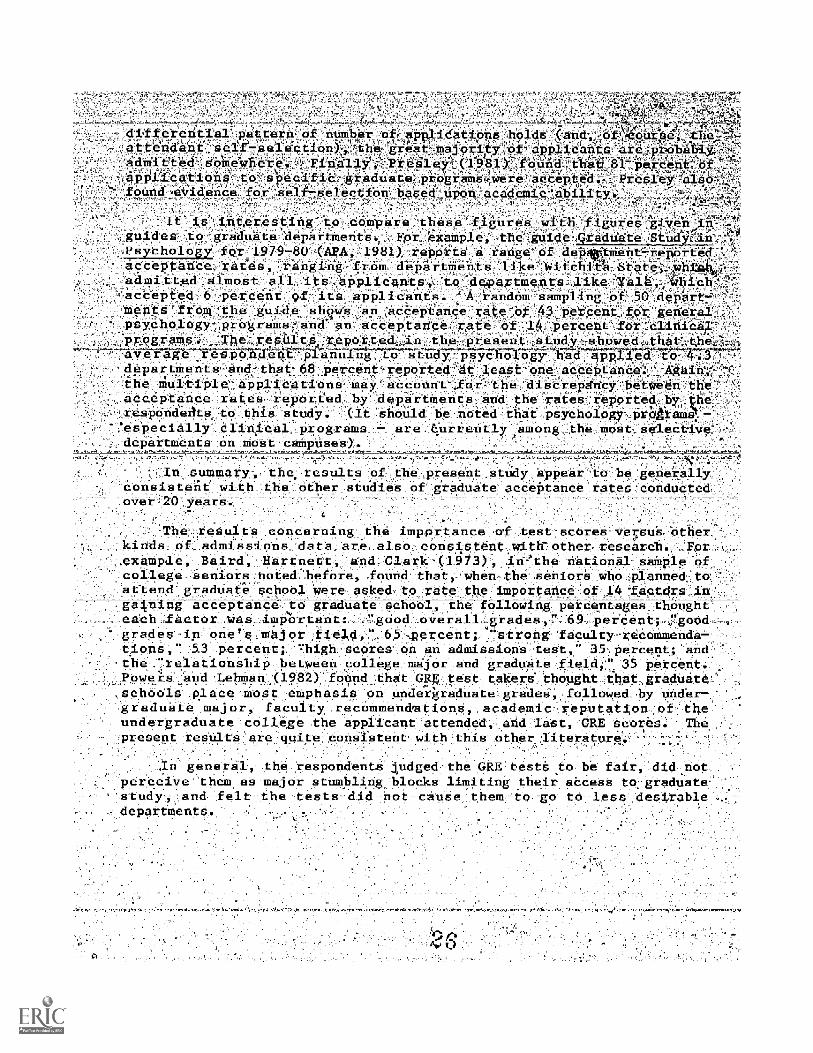
differentiat:pattern-2of--_ntatber---of ap- tons holds- (and,-- icourse_ _
- attendant: self7selection)----the great-majority-ofT-appliCants _ire =p bahadmitted somewhere: -1-ddfid--'than ant' dapplications- to specific :.graduate-- prOgrams --=were accepted = alsoound-/evidence for self7selectton baSed!_uponiacadeitc"ability
_ -
It ts interesting- to compare these -figures_ with figures-:giguides- to graduate leper cents For- example; the guide- Gt-Sduerte Study'in'Psychology- fori-1979--;80,-(APA, 1981) reports- a range- of dep*.tment-,repOrted-:
_
-acceptance, rates ran-ging-if ram departments- likeadmit ted-_almost all its-applicants-, :to departments: like -Yale,-_:-Whe
-_ accepted- 6 percent its applicants. A. random-sampling Of' 50_ depsirt-__:
Meets fro% the :guide saws an 'acceptance :rate of 43' percent_ for iener:psychology -- programs,. -and' -an- acceptance rate
_programs,. iThe:.resulti -reported in the present study shoWed=-that,
departments-and-that 68,percentreported -At least'-oneacceptance.the multiple_ applicatiOne may account--for = the discrepdbcy between -the`ide.eptance rates reported by -departments: and the rates= roported byl he _
res-po-uderits__ to this study. (It should be noted that psycholOgy- pr /,ram":especially _programs__-_ are Currently _.among_the_post_ selective_ -__:
_ departments on most campuses). _ _
In summary, the results of the present study appear to be generallyconsistent with the other studies of graduate acceptance rates conductedover 20 years.
- The results concerning the importance of test scores- versus. etherkinds of admissions, data are also consistent with- other- research. For ._
nxample, Baird, Hartnett, and_ Clark (1973) , in-2-the national sample ofcollege seniors noted before, found that, when the seniors who plannedattend graduate school were asked to rate the importance of 14 -factdrs ingalning acceptance to graduate school, the following percentages_ thoughteach factor .was_ impiortant: "good _overall .grades, 7- 69- percent; -:goodgrades in one's major field, 65 ---_percent; "strong faculty recommenda-tions," 53 percent; ':high scores on an admissions test," 35.percent; andthe "relationship between college major and graduate field,,7 35 percent.Powers and Lehman (1982) .found that GRE test takers thought that graduate. schools place most emphasis on undergraduate grades, followed by under-graduate major, faculty recommendstions, academic reputation of theundergraduate college the applicant attended, and last, GRE scores. Thepresent results are quite consistent with this other literature.
In general, the respondents judged the GRE tests to be fair, did notperceive them as major stumbling blocks limiting their access to graduatestudy, and felt the tests- did not cause them to go to- less desirabledepartments.
Rifeleficed7f,
--AseoC-i-ation;-_-;- Graduate Study An7- Ps --chology..-,-:__- r,---7Arier,icartS-Psyc-ho1egical, Association- --- 1981- --=
L.-1,1.--,-_-Bartnett,_ R. r!port on-_the. jlans'and i-; Char a c teriettag----6-T college seniors.Educational Testing -Se-rvite, -7=-- _
Be-relson, B. __Graduate -education in the united'-States-_---TNew!Yorkt:'_,McGrawHill, 1960. -
_Davis,- 3. A. Great aspirations. Chicago; Aldine,_ 1965.-_
Geurman,_3.--1 The GoUrman report: rating of graduate and professionali-iprogams -in 'American and international universities. Los Angeles:"Nationar*Edifeat-tonal-tStandarrdenol-980
- _
Miller, N. --`06e = year after commencement ChIcago t,rTNORC-UniVersity of-7Chico Press, 1963.
Powers,- D. F. & Lehman -GRE .candidatest, bons of the im ortance_
of admission factors. GRE Board Report No. 81-2 1982.-
Presley, J. B. Selection and stratification in graduate education.Unpublished doctoral dissertation, Stanford University, 1981: 0
. c
Roose, K. -D., & Andersen, C. fv. A ratin- of raduate ro
Washington, D,C.: epican Council on gducation, 1970.
Schrader, -W. Admissions test scores as -redictors of career achIevementin sychology. _E Board Research Report _ 76-1R, 19-78.
Solman, L. C. ale -aild-femal raduate-studen -T tion.
opportunity. New York Praeger, 1976.

_
_
_
_
_
_
_
__
_
_
_
_
_
--,-,-._=%-..,-,-,--s-,--,----x.- ..?,..,,....ft- _-,--..,----_, --;-,.--", -,:-. ..-,-.,.-- _.,_ _ _ .=-_-= --------
--- teriatic-S---Of Respondents and Nonredpondenta,:--------- - _ _
-,,- , ,__. -%,_--_ _ - _ -_- _. _ - _ , - ,_ -_, _-_--_
= -i Non IspicindentEt -r Resp_ondents- to --= _---Rspondents z--- -
---- -- = -- - -- t a_ Firs_t-- Survey- -----Firs Survey _ to e-cond_-_Survey_--_-
who took Gltf-previously s-- 22--
_
-Percent describing lf as17_-
_
23 r- 24
___ _ _
=
Hispanic , - 7
= Whiten 72
4_ Other _
5 s _ -4
82 _ _4
Average size ofundergraduate- calep--_-
Percent from coll_egethat were:
Private --IndepeudeurntPrivateChurch R.eated-
Average year in whicbachelor's degree wareceived
_Percent_ whose_highestrt_- _degree goal i.ias- :-= --- - _if:
-MastersIntermediateDottorate :
Postdoctoral study
Percent who have attemendedgraduate' school prevAlously
Mean self-reported bmmadet-.:_graduate_GPA- on 7-no1=Lntscale in -major field
- _
In last two years
Mean number- of hoursSpent working - ,
6,500 6,500 6,500
1976' 1976
-,
-. 50 47 47-
2 2 = -_ 2
44 4-7 484 4 - 3
36-- 33 _35
1976-
- - -
5 . 3 5.5 5.6
5 . 4 5.6 5.6
-
Mean _number of hours spentin :community service 2 2 2
_Highest education ettiltainedby -father on ---6-point scale 3.0 3.2. 3.2.
Highest: edUcation, attttainedby mother on 6-point scale 2.7 2.8 2.8
Mean family income _omm4-point scale 2.5 2.5 2.5
Mean GRE score on:Verbal 478 517 530
antitattve 451 490 501kAnalytical 476 516 530

-_
-
- -- --__
_ ,-Appendiit
ddl=ess Update Survey- _ -- _=
----,
. = -
-INCETO_ - -
A: - A-609-911-9000 =
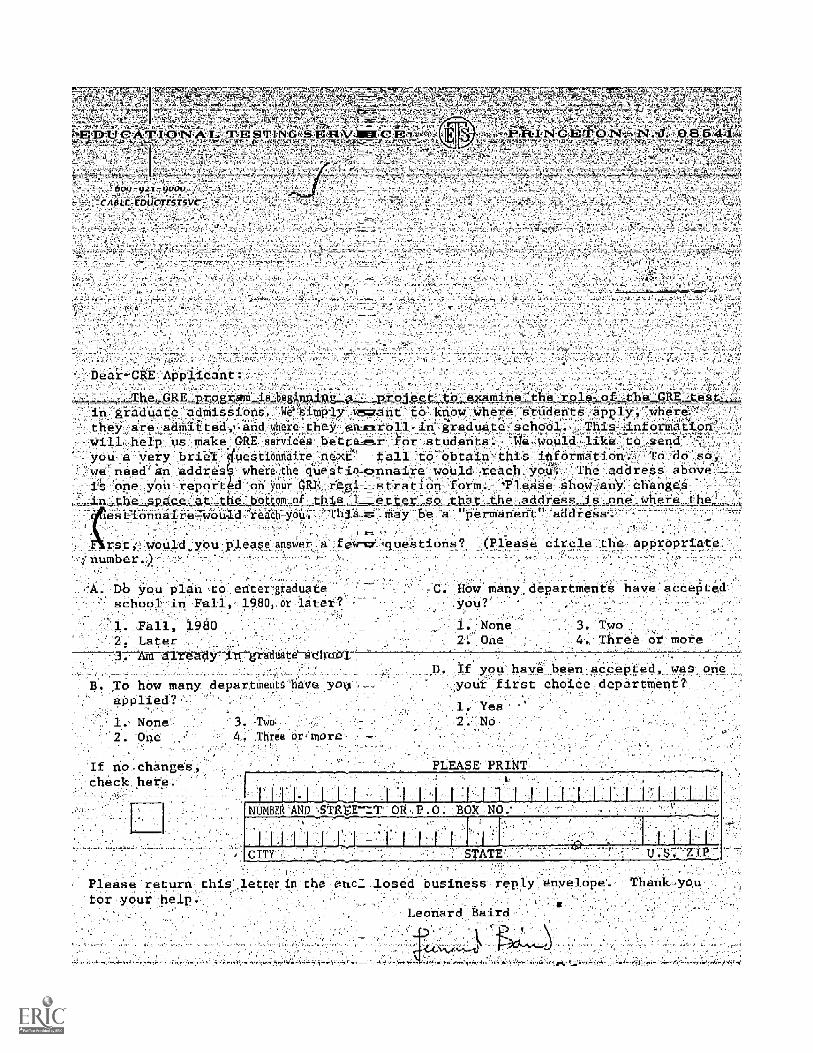
Dear-GRE Applicant:
=
=
-L_The-g.rogrATLAs,b_ggiTtaktg..p_: a a *n es: 1 - of==the-rGRE..,Xest=----in graduate admissions, We simply 1,.ant to know where students apply', where .
they are admitted,-and where they ereckroll- in graduate school , This informationwill help us make, GRE services bette-,-_r -for students. We would -like to send-
_
you a very brief uestionnaire next -fall to obtain-this 1/formation. - To do so,we need an addres where the questio-nnaire would reach yoil. The address above---=is one you report d on your GRE regi -7is era t ion form.- -PleaSe show-any changes
;_-___in__the space_a_t I e bottem..of this,I--etter"so _that_theaddress___is on where_ the- :4
es'elOrmaire:Twould-reach-you." This_.= -may be a "permanent" address.
rsti- would_you please answer:a fellriuquestions? (Please circle-the appropriatenumber.
'
_ you plan to enter graduate -C; Now many department§ have accepted-- -school in Fall-, 1980, or later? "yen?
1. Fall, 1980 1. None 3. Two-- 2. Later _ 2. One _ 4. Three or more--.3. Am Already in graduate-school-
!v, ' D. If you have been accepted, was oneB. To how many departments have you ___, your first choice dePartment?
applied? '- . 1. Yes_ 1. None' -3.161 2. No
2. One - 4. Three or more
If no-changes,check here-,
PLEASE PRINT
IIJI-IBER AND TR
CITY
ET OR P.O. BOX NO
STATE-[
ZIP
Please return this letter in the enc:_losed business reply envelope. Thank-youfor your help.
Leonard Baird
;71
. =
Appendlic C-,_ -
__
_,..
See,on-cf --Follow_up-s Survey__-----
I -
-
_
=
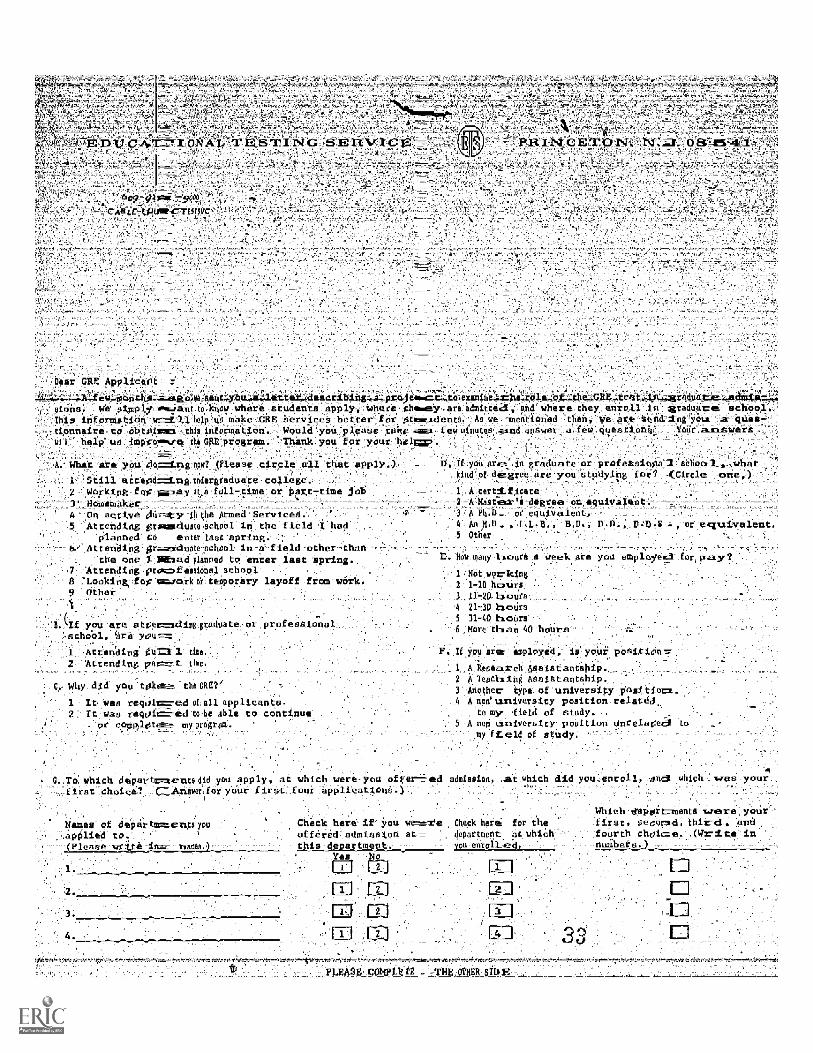
Dear GRE
ew=,atarithargo,-ve_sentl---y-au;_awletter..describing_..a.;pro raw-sions. We simply .!ant to know where students apply, whereThis infonnotion r 11 help W. make ORE Services better for otidents. As we mentioned then, we are stnct-l_ ng you ques-
--, -tionnaire- to obtaierem this information Would you please take Few ni6utes .and answer -a few questionin Your aria-SWAroof i help us ionpf-ow-re the GRE program. Thank you for your he11.
homey-are admitted, and where they -enroll in sgraduaMe school
A. What are you doffing now? (Please circle all that apply.)- I- Still atteridrig undergraduate college.
D. If you area in graduate or profeasinpaa school., whatkind of d&gree are you studyipg for7 {Circle` one,)
2 Working fay I ay at a full -time or part -time job 1 A cerMficate_ 2 A Meat is or. equivalent:-
4 on solve 1h the Armed Services.5 Attending gr:----doote.achool in the field I had
planned co enter last `spring. r--
Attending-,greduate school in a field other-thanthe .nne,liad planned to enter last spring.
7 Attending pro=ifessional schoolg -Lookink.foc at temporary layoff from work.
Other_
you are atgeuling graduate or professional-school, bre you----=
-Attending ul tire.2 Attending Fast ti-e.
C. Why did you tralt the GRE
1 It was reqvieci of, all applicants2 It was recp..aieri to be able to continue
or complet my prograz.
4 3 A Ph.D_ or equivalent,4 An Le- , D.O., 1:1;5 ,
5 Other_
E. How many our a week are you employe.d for, pze3r7
ciofvalent.
1 Not woking2 1-10 hours3 .II-2a hours4 21730 hours5 31-40 1-sours6 More than 40 hours
F. if you _employed, 15 your position.-
G. To which cleparto=rents did you apply, at which were you offirst choice? =Answer -for your first four applications.
Names of departer=ento youapplied. to.Pl000!- write 1r Traces.}
I A Reseerch Assistantahip.2 A Teaching Assistantship.3 Anothec 'type. of university position,4 A non' university position rale
to my field of study. .
5 A non ,=diversit position unrelh ea tomy fLeld of study.
er -red adoission, at which did you enroll
Check here If youof f ered.:admissionthis-de artment.-
Yes No-C_:1IFII
Check here for thedepartment at whichou enrolL-ed.
1
a
which _ was your
Which rrepaimments were yourfirst, second, third, andfourth chmi=e. .(11=ite in
- - -
0 PLEASE- COTITLErE -THE OTHER SIDE
ifprak."
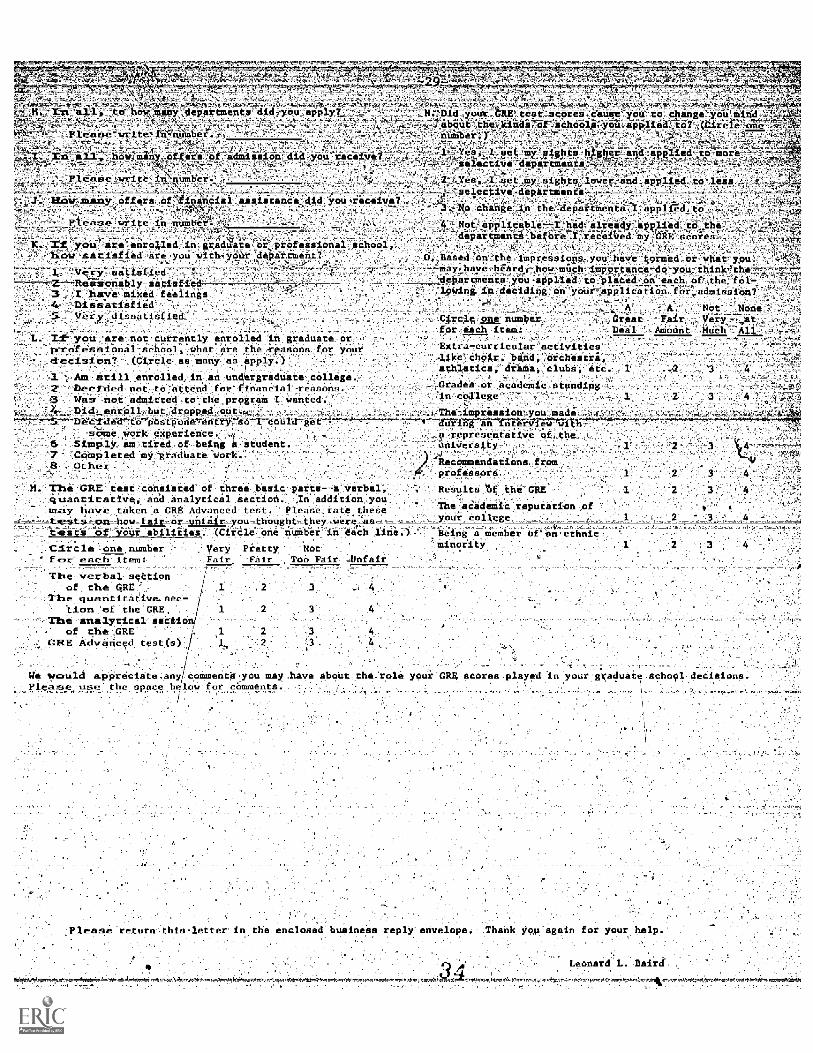
lepartmentsdidzyouapply? _-- H Did your-: RE---test_smares- Cause- you- to change: yonain_7-1-7:about --thefkinda-TIMflachoereyair_
Please-write.--I___---_
-72Please_writen numer.' -- -- -,---- - -- ----,--5-- ----;-71.::7,-- -:."=-. ="-__
HAW many offers of finadcial ili,Skie tanee: did you =receive
pleape- yrite'lanuambee'i ."-,' -_ : - _.-_- -_ -_-"-- --
T- . If you _areenroj,led-in graddate orprofesaional achools-_= how -Sil_ cisfied are you with-your deparrnent?
_ , -_ -__. ,------,----;,-,------ A------
and_-applied-Lta-more-2-__selective departments
L.:set- SY_ sights-Lowee-and_ applied -to' leis
3.No change 1n the departmenta-I app_ ed_ to= -4 --ROL applicable--r had already- applied to- the
7deprtmenrn _before I" received my GREr ---O. BaSed on the impressions you have _f9rme4_or-vahat you
itsp-oreence-do=you::departments yeti-applied to plaCed-ou each of- the fol-_=2- Reir-aonahly satisfied - _ -,-- -
. - lowing_ in deciding on_your-application foradmission? --__ --_, --.,-_,_ -- 3 I /lave mixed feelings - ' --- ,4- -Dissatisfied- _ - A Not- -None7-=__'-
-7- 5 Very dissatisfied ,--_ --%- : , _,=-__ -:. _-__ . : -Circle one- namber___ , - = Creat-_-- -Fair ;Very_-.---at ,. --._,. for, each ire= = - Deal Ailment Huth -All ---4;_ _
you are not -currently enrolled in graduete. or -
professional-school, what are the -reasons for your7_ decision? (Circle as =any as apply.)_
A.m Still enrolled in an und'ergraduate college.2 Decided not-to attend for-financial reasons.
Was not admitted to- the program I wanted.Did enrell but dropped_ mit_P-
-acme-s-Erme work experience.6 Simply am tired of being a student.7 Con-pleted my -graduate work.8- - Ocher
- _
Extra-curricular activities- _ -like their. band, orchestra, ,
athletics, drama, clubs, etc.- 11 --2 -3-7__
Grades or academic _standing =-,_
_in college _ l 2 3 4 -------,:, Thelimpression'_youMade_ -- "1-- ---_ - -_----,---------_,,,,_-_,_-.:-IN
:---0'da-ing'an-fnrer.,---_-__t- -- -=_-- = -, , - _ --
-* representative of the _
university --- 2 _- 3_
-Recommendations from,professore 1 2-- 3 4
N. The CRE test consisted of three basic partsa verbal, ; Results Ilf the GRE 2 3 44quantirative, and analytical section. In addition you :emay have taken a CRE Advanced test. Please rate these Theacademic rputation of '_,,
= oti-how fair_or_unfiir_you-thought-they, wereas- - your c°1-1-48e 1 -2 7 --..---3 --- 4- : ------;_
- rests of_your abilities- (Circle- one number in each line.) Being a member of' an ethnicCircle =one number - _ Very Pretty minority
- febr each Item: Fair Fair Toe Fair --Unfair=
The: verbal- section __ _.
'of the GRE -.- .2 , 3 - 4The quantitative- aec-
tion ref ' the GRE 1 2 3 4' The analytical seCtio
of rhaDRE- 1 2 4GRE Advanced test(s) ! 1, 2. 3
. ,. .. .
- _-
1
1 2 3 4
We mmuld appreciateany commente you mayPlcane use the space b Tow for co=ents.
have about the-role your GRE scores:played:1n your graduate School decisions. --
-Please return this -letter- in the enclosed business reply' envelope.,
Thank you
Leonard L. Baird
gain for your help.'
Comparison:of--A Bayesian "anda-Least
-
ampba11,___ -J._ yoFs-Apsocia,tEndents,ataPredominently-White:--and11-__
_1975.-
Campbell, .1. T and Donlon T. -1;33_7:Relationship of_3 the -Figure 'Location= Test to Choice of Graduate .
-1980._ _ -
R;; Mahoney, H H,_ -"Casserly.- P. The_ Development and Pilot _
Testing of _Criterion Rating Sties. 73-1P,_ . =1976 _
_
=-7.-MePeeki --;Almarc
_:----Faaa101.11.t7`:nt:Pbtairiing.Add1tional-54'ascorealon.7"-----VJ= = -rhe-----GREJAdvanced=3Pa cholowy --Teat -`_" 74_ _ _ 7-
--1976. "T
_ _Pike, Gneaerng-iSt'-rateglei of -3GR-7-_-Aptitude--_Eaaminees Classified by ithnie Grano_
nd -Se-a k; 7510P =1980 . -3--= -
=
S.;_ Thayer, D.; 'andr-Yatea,-A. -_ A-_ Factor 3Analytio -Invistigation= of Seven- ;1-
3 _ Experimental-analytical-;-Item-Types;::::=7771P,---1 .
Ca'rlSen-a, A.--8.;--Evinsi-F.R.;-and±inykendall, N. M.The-: 'Feasibility of Common Criterion -Validity-Studirs' of the GRE. -_ 71-1P, 1974.
centre. _3 . _A, Graduate -Degree Aspirations ofEthnic Student Groups Among GRE =Test-Takers.
-_ 77-7p, 1980. _ _ --
_Donlon:, T. F.. n- Eirplorarory, Study of the Implies-tionr-Of----Tese-EpA-edaddeas7-76-9Pr1980.
.-zBunion, V. F.; Reilly._ R.__R.;--_ and-AicKee,-- J. D.
Development of & Test -of Global vs. Articulated_ IThinkingt The Figure Location, Test._ 74-9P, _
'1978. _
Eaternadht, G. -Alternate Methods of Equating _GRE-Advaaced Teats. ; 6972P, 1974.
__--- - -Ecbternacht. -°G. - Comparison -of 'Various Item
--- Option-Weighting Schemes/6r Note on the. Variancesof Empirically Derived .Option -Scoring ,Weights.71-17P, 1975.
-Echternacht, G. A- Quick Method for DeterminingTest Elan. 70-8P, 1974.
; Evans, P. R. -The GRE-QCoaching/Instruction Study.,_71-5aP. 1977.
=
Fredericksen, N. and Ward. W. C. Development of 'Measures for the- Study of! Creativity. 72-2P.
_
. -Kin8dtea, N. And Dorant, N. Effect of theTPositiOn
of an Item Within -a Test on Item Responding ,Behavior:- An Analysis Based on-Item Response .Theory. 79-12bp, 1982. '`-
, - 4 --
Kingston, _N--11.__ and Dorans N. J., The Feasibility : -
of Using Item ReSponse Theory an .a PsychometricModel for the- GRE'A-ritude Test. 79-12P,1982. 3
3 _
Powers .-7D. E.; Swinton, -S.- S.; and _Carlson,- A.- B.-- -=- A Factor Analytic Study-of- the GRE Aptitude 1-_ Test.: 7511P,-1977.' _ _
Reilly, H. R. and Jackson', R. Effects of Empirical- -- Option Weighting on Reliability and Validity of _
3- the GRE. 71-9P, 1974. _-
Reilly, R. R. Factors in Graduate _Student Perforam_. ---,
ance.:_ 71-2P, 1974. __ _,_
_ _
"6-1113. A;--- if-- Theittffialrifon or-P741,11-41-7(Moderators and-Their Effect an the Prediction of.Doctorate_Attainment. 69-6hP,-1975.- _--- -- ---
Measurement with Aptit de-Ten Data and EnimatedLevine.. M..V._ and. Apprapriataneen-
parameters. 75-3y, I so.
Rock, D., A. The ''Test Chooser": A DifferentApproach to a- Prediction Weighting Scheme.70-2P, 1974.
Rock, D., Werts. C., and Grandy, J. Constructva_lid_ity of che_-_,GREPopulations=-an Empirical Confirmatory Study.78-1P, 1982.
Sharon, A. T. Test of.Anglish as, -a ForeignLanguage as: a Moderator 9f Graduate Record_Exaia.nations Scores in the Prediction of ForeignStudents Grades in Graduate School. 70-19,1974.
&tricker, L. -J. A New -Index of DifferentialSubgroup .Performance:. 'Application to the GREAptitude Test.' -78-7P, 1981.
Swinton, S. S. and-Powers D. EActorAiiAlytic'Study of the Restructured GRE Aptitude Teat.776P, - "--
Ward, W. C. A Comparison of Free-Response andMultiple-Choice Forma of Verbal Aptitude Tests.
1982.
Ward, -W. C.; Prederiksen. N.; and darisano. S. B.Construct Validity of Free-Response and Machine-Scorahle Versions of a;-Test of ScientificThinking. 74-8P, .1978.-
-
Ward, W. C/ andand-tFrederiksen. N. Study of thePredictive Validity of -the Tests of ScientificThinking. 74-6P.- 1977.
CO
!,
Cr)