Embed Size (px)
Citation preview
DOCUMENT RESUME
ED 055 038 24 SP 005 272AUTHOR Murray, C. Kenneth; Fitzgerald, RussellTITLE The Effect of 17-.1.deo Taped Modeling Procedures on the
Verbal Behaviors of Student Teachers. FinalReport.
INSTITUTION Concord Coll., Athens, W. Va.; west Virginia Univ.,Morgantown.
SPONS AGENCY Office of Education (DHEW), Washington, D.C. Bureauof Research.
BUREAU NO BR-0-C-051PUD DATE Jul 71GRANT OEG-3-70-0044(509)NOTE 83p.
EDRS PRICEDESCRIPTORS
IDENTIFIERS
MF-$0.65 HC-$3.29Classroom Observation Techniques; *PreserviceEducation; *Student Teaching; *Teacher Behavior;*Teacher Education; *Verbal CommunicationFlanders System of Interaction Analysis
ABSTRACTThis investigation was designed to determine the
effects of a perceptual modeling concept on the verbal behaviors ofstudent teachers in their student teaching experience. The majorobjectives were 1) to determine the effects on verbal behavior of avideotape versus a verbal presentation of an interaction analysissystem, and 2) to identify those behaviors most affected by aperceptual modeling concept of a modified Flanders InteractionAnalysis System. The 52 subjects included 14 social studies majors,14 language arts majors, 14 science majors, and 10 math majors, andthey were randomly assigned to experimental and control groups. Thesubjects were observed in school situations by three observers usinga modified Flanders instrument. The interaction analysis raw datawere recorded on IBM cards and mean percent scores and ratios for-ach group were obtained through a special computer program. Amultiple t test program was used to compare the selected verbP'variables of the groups. The findings indicated that studentwho received a perceptual modeling concept presentation ofinteraction analysis during their Preservioe training .showed
significantly different verbal behavior in their classroomassignments as meaFured by a modified Flanders System of InteractionAnalysis than those who did not. [Related to ED 048 110.] (MEM)
0.

'"', .
Final Report
Project No. 03051Grant or Contract No. 0EG-3-70-0044 (509)
The Effect of Video Taped Modeling Procedureson the Verbal Behaviors of Student
Teachers
C. Kenneth MUrray
West Virginia University
Morgantown, West-Virginia
.1107Y 1971
U.S. DEPARTMENT OF HEALTH,EDUCATION & WELFAREOFFICE OF EDUCATION
THIS DOCUMENT HAS BEEN REPRO-DUCED EXACTLY AS RECEIVED FROMTHE PERSON OR ORGANIZATION ORIG-INATING IT, POINTS OF VIEW OR OPIN-IONS STATED 00 NOT NECESSARILY
REPRESENT OFFICIAL OFFICE OF EDU-CATION POSITION OR POLICY.
Russell Fitzgerald
Concord College
Athens, West Virginia
The research reported herein was performed pursv.ant tc a grantwith the Office of Education, U.S. Department of Healqh, Education, and
Welfare. Contractors undertaking such projcts under uovernment sponsor-ship are encouraged to express freely their,rofessional judgments in the
conduct of the project. Points of.view or 4pinions stated do not, therefore,necessarily represent official Office of EdUcation position or policy.
----------
DEPARTMENT.OEHEALTH, EDUCATf014',',.AND :WELFARE_ .
.
office of EducationBureau of Researph
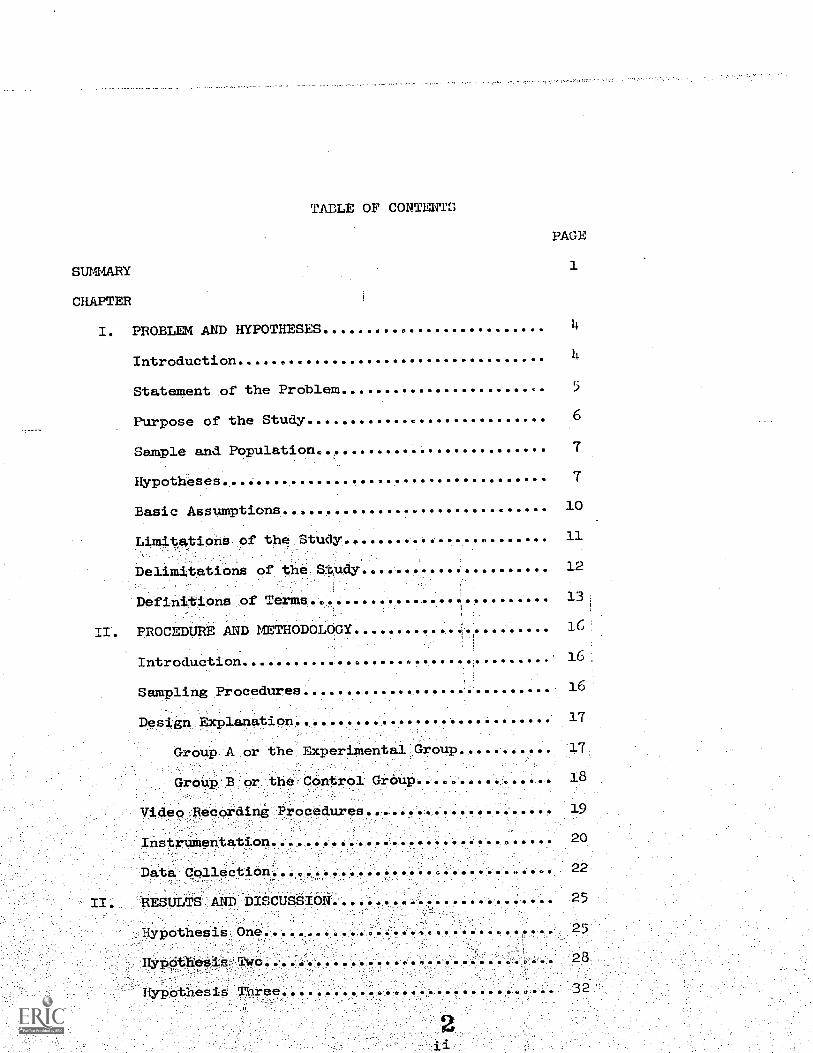
TABLE OF-CONTENTS
PAGE
SUMMARY 1
CHAPTER
I. PROBLEM AND HYPOTHESES
Introduction 4
Statement of the Problem 5
Purpose of the Study 6
Sample and Population.... 7
Hypothises, 7
Basic Assumptions 10
Limits,tiona-of the Stu4Y 11.:7- .
- . .
Delimlations of the;Z.:041.14Y 12
DefinitiOns.,:of Terms, 13:1
II. PROCEDURE AND METHODOLOGY 16
Introduction 16!
Sampling Procedures.. 16 :
... . ... ... ..... 17.
Group,A. or:the,
...,::-GrOUp.:..B.:..or..theCOntrOi-Group.-0.--.-...........-..,18
-:.... .
19
.-... - ,..- . :
... .. . .,
Data CollactiOn. ... .:. ,; '. . . . . 22
20
II. RESULTS AND DISCUSSION.......................... 25
Hypothesis One.........00.0040.01.00 PO ..... 25
Hyppthesie-Two.. ............ 28
Hypothesi 32
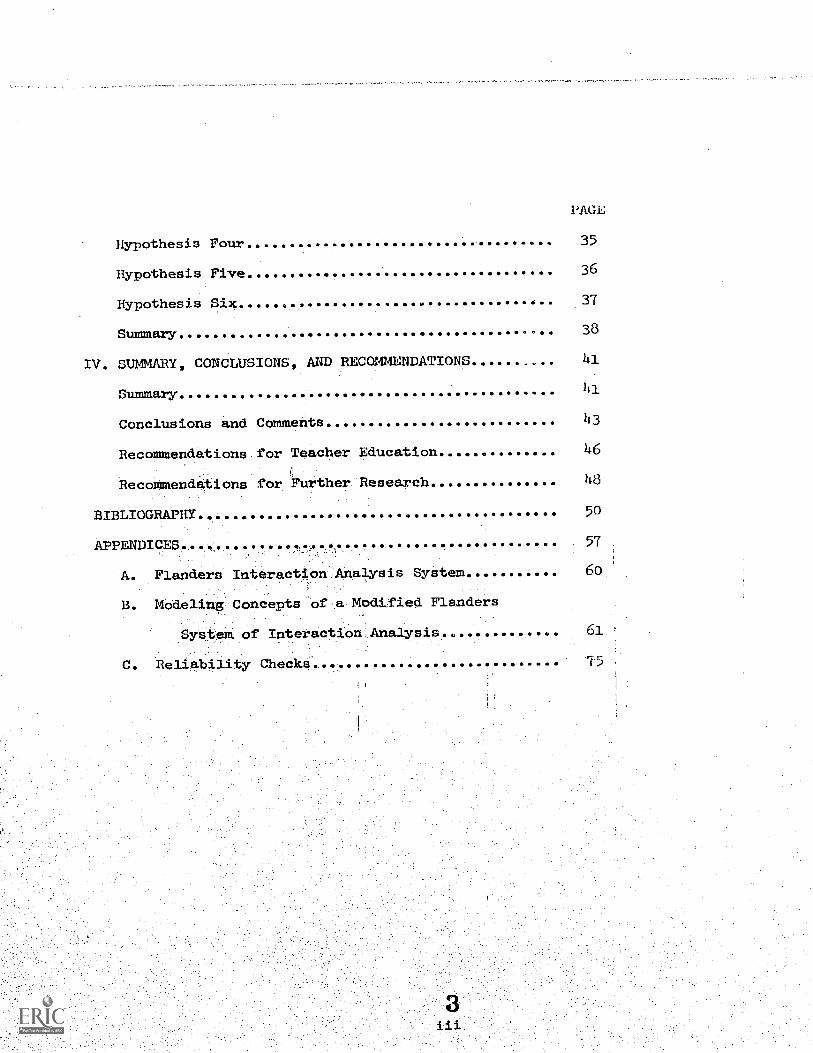
Hypothesis Four
Hypothesis Five
Hypothesis Six
Summary
PAGE
35
36
37
38
IV. SUMNARY, CONCLUSIONS AND RECOMMENDATIONS 41
Summary 41
Conclusions and Comments 43
Recommendations for Teacher Education 46
RecoMmendations for Further. Research 48
BIBLIOGRAPHY 50
APPENDICES,....
57
A. Flanders Interact.l'onAnalysis System 6o
B. Modelimig:ConcePts:ofa Modified Flanders
SysteM of InteractiCmAnalysib 61
C. Reliability Checka 75

Table
1. t
2. t,
3. t
4. t
5. t
6. t
7. t
8. t
9. t
10.
11.
12.
13.
14. -t
15.
TABLES
Test Contrasting the Verbal Behavior of StudentTeachers on Category #5
Test Contrasting the Vebal Behaviar of StudentTeachers on Category #6
Test Contrasting the Verbal Behavior of StudentTeachers on Category #7
Page
26
26
27
Test Contrasting the Verbal Behavior of StudentTeachers on Extended Direct Teacher Talk 28
Test Contrasting the Verbal Behavior of StudentTeachers on Category #4 29
Test Contrasting the Verbal Behavior of StudentTeachere on Category #3 30
Test Contrasting the Verbal Behavior of StudentTeachera on Category:.#2 30
Test Contrasting the:Verbal Behavior of StudentTeachera on CategOry#1'
Test Contrasting the Verbal Behavior of.StudentTeaChereLOn :Extended IndireCt Teacher Talk
t Test Contrapting the Verbal Behavior of!Student,
..
Teacherp On CategOry'19' 0000000
t Test Contrasting the Verbal Behavior of'ptudentTeaCher*:On oo o ..... .... 34
.,
,,
31
32
t Test Contraatairlg th-e Ttero,Ptndent Teacher C.roupsHonf-Extended Studevit Talk in-Their Classiooth
t Test Contrastaag th,e Verbal Behavior of StudentTeachers on the S/11 Ratio.................. . . .. . ...
Test Contrasting the Verbal Behavior of StudentTeachers 4:= the I/D Ratio.......... .. ......... .. ...
t Test Contrasting the Verbal 'Behavior of StudentTeacherST on tie!) Revised Ifid
314
35
3G
37
Figure
ILLUSTRATIONS
Page
1. A Diagram of the Classroom and Taping Situation 21
2. Design Model 24
3. Matrix for Experimental Group 39
4. Matrix for Control Group 40
5. Categories for Interaction Analysis to be used inthis Study 6o
6. Reliability Check #1 76
7. Reliability Check #2 77
8. Reliability Check #3... 78

SUMMARY
This investigation was designed to determine the effects of a per-
ceptual modeling concept, presented during the pre-service experience,
on the verbal behaviors of student teachers in their student teaching
experience. Within this framework the major purposes of the study were:
(1) To determine the effects of a video tape modeling concept
versus a verbal only presentation of an interaction analysis
system on the verbal behaviors of student teachers.
(2) To identify those categories or behaviors which were most
affected by a perceptual modeling concept of a modified
Flanders Interaction Analysis System.
The fifty-two subjects who comprised the,sample for this study were
drawn randomly from a larger population of One hundred sixty-five stu-
in 2ducation 120 4a. general methods cOurse immediately preceding
the student teaching experience at West Virginia University,Hthe second
sethester of the 1969-70 sehoo1,year, The sample consisted of fOurteen
social studies majors, fourteen language arts majors, fourteen science'1
majors and ten.methmajors.. .
The fifty!-twO preserVice teachers were randomly assigned to
either theexperiMent44,:--groUp or the controlgroup. ,The experimental
group receiVedinstru0-494..741-irqugh perceptUal modeling of the ten
categories of a modified Flanders Interaction Analysis System pre-
sented via'VideotaPeanddiSCUSsion. The Control gkoup received in-
struCtlbn through discusSion and other*verbal Means only concerning:

the concepts of the modified Flanders Interaction Analysis System.
During the student teaching experience, the subjects were ob-
served in their assigned individual school situations by three trained
and reliable observers utilizing a modified Flanders instrument for
measuring their classroom verbal behavior. Verbal behavior was re-
corded in each of five observations of fifteen minutes each for each
of the fifty-two subjects. Observations were scheduled at the beginning,
the middle, and toward the end of the student teaching experience. Dur-
ing the observation period which spanned the student teaching experi-.
ence, three renability checks were conducted for the observers (re:
appendix F). Before the observation period, the observers had partici-
pated in a training session, ctonsisting of approximately twelve hours
of interaction analysis instruction.
Upon completion of the data gathering, the interaction analysis
raw data for each subject was preserved on IBM cards. From these, ap-
propriate mean percent scores and ratios for each group were arrived at
by means of a specially prepared computer program using the West Vir-
ginia University 360/70 computer. A matrix printout supplied other
data for the two groups. All data needed for, comparing the teacher
behavior hypotheses were thus derived. A multiple t test program was
used to compare the selected verbal variables of the two groups .
the findings*of the studyigave evidence to indicate
_
teachers who received 6-perceptual modeling Concept
16reeentatiOn OfA.nteraCtion:.analYsis during:their pre service training
did show significantly different verbal behavior in their classroom
assignments as Measured iv% a.modified Flanders System of Interaction
Analysis wl.tp a slight modification. These student teachers in their
classrooms (I) used more acceptance of student feelings, (2) used more
praise, (3) used more acceptance and clarification of student ideas,
(4) used less lecture, (5) spent less time in direction giving, (6) spent
less time in criticizing students, (7) stimulated more student talk,
(8) used less extended direct talk, (9) used more indirect talk, and
(10) used more extended indirect talk.
CHAPTER I
PROBLEM AND HYPOTHESES
Introdvetion
With the availability of video equipment in most colleges, another
dimension in teacher education has been added. Techniques such as video
taped feedback, micro-teaching, interaction analysis and simulation have
been explored for incorporation into the teacher education program util-
izing the medium of video.
Interaction analysis has been proved a valuable teacher education
instrument in the pre-service program, Furst (81);,Hough and Ober (84),
and Zahn (91); also, it has provided teacher educators with an objective
instrument for assessing,teae,her behavior, Furst (81), Flanders (13),
Lohman, Ober, and Houghj22).:
The modeling concept has 'been expJored and developed recently for
use in pre-service teacher education by Orme (85), and Young (90).
These studieb revealed that student teachers viewing a perceptual
model tended to incorporate more of the modeled teaching behaviors into
their teaching than those who were trained by a symbolic model. Fur-
ther, a coMbination of the.two methods was even more effective than
one alane, Orme (88)-, Ye4nk -(90.
Allen et al. (78) studi,e4 the effects of both positive and nega-
tive models oa teacher behavior. The use of the positive model during
training proved to be more effective, as the teachers here attempted
to incorporate more of the modeled behavior into their later lessons.
In all, three major theories concerning learning through imita-
tion and observation have emerged. Bandura (8) presents a complete
summary of these theoretical viewpoints. However, a brief review will
suffice at this point.
Miiler and Dollard (27) set forth the instrumental conditioning
theory. One learns a specific behavior by observing a model's re-
sponses to various stimuli either because the model is reinforced,
which vicariously reinforces the observer, or the observer is directly
reinforced as he watches the model's responses.
Mower (30) in his sensory feedback theory, theorizes that the
learner or observer assigns a positive value to a model's behavior as
a result of the:rewards administered to the model. The ohgerver can
then havethepositive experience by reproducing the model's behavior.
More racevay, Bandura (44) has daveloped the stimulus contiguity
and mediationaltheory whiehSete fOrth the,iidea that the iearner forms
sensory images as he observes a model. These sensory images become
structured, and through contiguity perception respOnses are strength-
ened. BanduraalP pPatulatea that*the learner acquires verbal repre-i
sentations of the model's behavior-,:which ara associated with the per-
ceptual images, suggesting that if the observer
behavior he will acquire it more readily.
Statement of.thePróblem
verbalizes the model's
Both modeling and interaction analysis are revealed as important
te-finiques in the shaping of teacher behavior, (15, 18, 30 36, 39, 70),
however, due the lack of studies exploring this areas more research
should be undertaken concerning the effects of modeling on the behavior
of pre-service teachers. Further, because most modeling research to date
has primarily involved young children as subjects, added research in
modeling usirigadult teachertrainees as subjects should be considered.
While the experiMental literature suggests that both Modeling and inter-
action analysis can effectively change teacher behavior, (15, 18, 30,
36, 39, 79) little is known about the relative effectiveness on teacher
behavior of the two combined processes, such as providing modeling
through an interaction analysis framework.
This study is intended to determine the effects of a modeling con-
cept of a. modified Flanders Interaction Analysis System on the verbal
behaviors of secondary student teachers.
The use of a video-tape modeling presentation of an interaction
analysis system should xmke each modeled teaching behavior more precise
this presentation1 should make the behavior
easily Perceived by student teachers and
and specific. As a result,
more conspicuous and more
help them incorporate such behavior into their own teaching.
Purpose of the Study
This research project intended to determine the effects of a
,
perceptual modelingconcept, presented during the pre-service experience
m the verbal behaViOrs,pf-Student teachers in'their student .teaching
experience. Within this study's framework the following purposes are
appropriate:
1. To determine the effects of a perceptual modeling
concept of a modified Flanders Interaction Analysis
System on the verbal behaviors of secondary student
teachers.
2. To identify those categories or behaviors which
are most affected by a perceputml moclobling concept
of the modified Flanders Interaction A alysis System.
Saulple and Population
The subjects for this study consisted of two samples of twenty-
six students each, randomly selected from Education 120, second
semester; 1969-70, West Virginia University. The parent population
consisted of one hundred sixty-five student teacher trainees. All
stUdents in Education 120 are Secondary Educ#tion trainees and have
comp/eted allrequired work except for EdUcation 120 and the.student
teaching experience. Education 120 is a pre-service course taken
immediately before the student
Aypotheses
The problem of this research study is stated in the null hypotheses
teaching experience.
observed verbal teaching be-
haVion of-stUdent teacherS 'during the student teaching exPeience in
1. A perceputal modeling concept presentation of a modified
Flanders Interaction Analysis System during the pre-service
experience.
2. A verbal only or symbolic modeling concept presentation of
a modified Flanders Interaction Analysis System the
pre-service experience.
The specific null hypotheses are:
hl There will be no difference between the percentages of fitrect teac:1-
er talk of student teachers trained through a perceptual Incraz,ling
concept in a modified Flanders System of Interaction AnaLyEis and
the direct teacher talk of student teachers trained through_ 1., sym-
bolic modeling only concept in a modified Flanders System..
hla There will be no difference between the two groups of
student teachers in lecturing.
hlb There will be no difference between the two groups of
student teachers in giving directions.
Hlc There willAre,nddifference between the -big() groups Of
:..atudent::teachersAn.givingnegative Criticisms, repri-
112
and corrective feedback.
hld There will be,no difference betWeen the two groups of student
-;teaChert-
in the extendedness of direct teacher talk.
There will be no difference between the Percentages of indirect
teacher talk of student teachers trained through a Pe eeptual
modeling concept in a modified Flanders Syitem of Interaction
Analysis and the indirect teacher talk of student teachers trained

through a symbolic modeling concept in a modified Flander-, System.
H2a There will be no
student teachers
H2b, There will be no
student.teacherS
H2c There will be no
.student teachers
112d There will be no
student teachers
H2e There will be no
difference between the two groups of
in asking questions,
difference between the two groups of
in accepting and clarifying student ideas.
difference between the two groups of
in'giving praise and encouragement.
difference between the two groups of
in the acceptance of student feelings.
difference between the two groups of student
teachers in the extendedness of indirect teacher talk.
H3 There will be no difference in the percentages of student talk in
classes taught by zitudent teachers who have been trained through a
perceptual modeling concept in a modified Flanders System of Inter-
action Analyis and the student talk in classes taught by student
teachers trained through a symbolic modeling concept ini a modified
Flanders System.r;
1[3a There Will'be no differendeHin the ',emitted student talk in
the ClasSes thUghtby:the twogrouPpi of student teachers.
1131) There will be,.no:d100i.erithe-elicited student talk in
resnonse tO narroW,HteaCher queStions or requeSts in the
claises taught by the two groups of student teachers.
H3c There will be no difference in the length
of student talk in the classes taught by the two group
of specific episodes
. .
student-teachers.-
of

Hh There will be fio differences between the S/T ratio of student
teachers trained through the perceptual modeling concept in a
modified Flanders SYstem of Interaction Analysis and the S/T ratio
of student teachers:trained through the symbolic modeling concept
in a modified FlanderSSYStcm.
H5 There Will be no difference between the I/D ratio of student
teachers trained through a perceptual modeling concept in a
modified Flanders System of Interaction Analysis and the I/D
ratio of st-dent teachers not so trained.
116 There will be no difference between the revised I/D ratio of
student teacherS tr4ined through a perceptual modeling concept in
a modified FlandersSyttem of Interaction Analysis and the revised
I I) retie of student teachers not so trained.
Basic AssmaL111
The present study is based' on the following assumptions:1
1. A modeling concept technique can be effectively used during
the pre-service experience for the pu:rpose of shaping
stUdent teaching verbal behavior.
A modeling technique can be used effectively during the pre-
service experience for the purpose of teaching interaction
analysis in a more perceptive manner.
Flanders Interaction Analysis System is a reliable means for
assessing the verbal behavior of the teacher in the classroom
situation.
4. The verbal c!..lassroom behavior of the student teacher vhile in
the classroom situation is an adequate sample of hio toLai
teaching behavior.
5. A modeling presentation of a modified Flanders Interaction
Analysis System during the pre-service experience can be used
effectively for the purpose of transferring theory to practice
through micro-simulation.
Limitations of the-Ztud
The term limitationS-Im this research was defined as those
variables.which cannotbe adequately controlled within the study
design, andCannot besatiafactorily accounted for in the analysis
and interpretation of the,,data;
1. EffOts ofthe:-O4iiegal7supervisor's influence on the, -
teacherVerbal behavior.-student
2. Effects of the cqoperating or critic teacher's influence
SrS rbal behavior.
3. Effects of the existing differences such as sex, socio-i.
economic, and cultural background, etc., in pupils comprising
the various public school classes assigned to the teacher-
trainees during their student teachirg experience.
4. Effects of the type of activity being conducted at the time
of".14,i0 observat.on collection.
. Disposition of the_clsas at the time of the observation.
Delimitations of the StmAL
For the purposes-of the present study, the term delimitation may
be defined,as a description of the limits or boundaries set, beyond
which the study is not intended to investigate.
This study, primarily due to its exploratory nature, is designed
to investigate or uncover, not to examine in depth. The following
factors are set forth as delimitations of this study:
1. Fifty-two of the tOtal population of one hundred sixty-five
secondary pre-service teachers at West Virginia University
were selected to participate in this study.
2. The study design allowed for five observations of the
actual student teaching situations of the fifty teacher
trainees. Add#tooal observations may have made a
difference in the results.
3. No preference was given to sex or age in the selection
f sUbjectS. The .use ,:of an all male .!or all female
selection might have altered the resIllts.
4. The study utilized a modified Flanders Interaction Analysis
System which is designed to ,measure the verbal behavior
dimension of the classroom teaching-learning situation only.
. The subjects participating in the study represented a
cross section of four Subject matter areas. The limiting
of selectiOn to one sub'jeot area Might have brought about
results.
12
7

Definition of Terms
Direct teacher talk - Teacher verbal behavior which theoretically
restricts student freedom of response and shifts the focus of verbal
behavior to the teacher.
Extended talk - Continuous talk by one person which lasts more
than three seconds and receives more than one tally in the Flanders'
System.
Flanders System of Interaction Analysis - A formal system designed
to categorize the teacher talk and.student talk which occurs in a
classroom. (For a definition of each category in this system,
see Appendix A, page 60).
Flexibility - A measure of teacher ability to control verbal be-
havior in order to use a variety of matrix cells each representing
a different categorical sequence expressed as a direct relationship of
the number of occupied cells in a given matrix, i.e., the greater the
number of occupied cells, the greater the teacIher flexibility.
I/Mratio - A mathematical comparison of t.he teacher's indirect
verbal talk to his direct verbal talk calculated by dividing the total
amount of direct teacher talk. Thus, the totals in columns 1, 2, 3,
and 4 are divided by the totals in columns 1, 2, 3, and 4, plus 5, 6,
and 7.
Indirect teacher talk - Teacher verbal behavior -which theoretically
promotes student freedom of response and shifts the focus of verbal
behavior to the student.
Instrumental conditionim - Response modification or change in-.
volving the active participation of the subject. Reward, or reinforce-
ment, is an integral part as in need satisfaction and relief from
tension. There is a feedback from the rewarding stimulus which fol-
lows the response the subject is learning.
Mediatin5 response - Responses of attentiveness to certain cues
or stimuli which result in better learning from problem to problem, or
which result in the formation of learning sets.
Modeling - Imitation learning through the utilization of live
or simulated performances.
ModelinFs. concept - A video-taped teaching episode emphasizing a
specific teaching behavior or skill,
Observation learning - Learning through imitation or the viewing
of a MOdel'S actiOn.
Simulation .A typeof role playing episode in which the members
recreate hypothetic4l claSSTOOm situations'or teacher7pupil behaviors., . .
PerCePt'ual'Model (SeeperCeptual modeling concept)
Perceptual modeling epjasset. - In teacher education this term
refers to a video-taped teaching episode or segment in which a specific
A mathematical comparison of the positive
affective teacher talk to the negative affective talk.

Sensory feedback - A sensing-and-correcting process in which the
results of a partirmlar behavior or action provide feedback via the
senses, which serve to modify further like behavior of the individual.
Stimulus contiguity - Various stimuli present at the time of a
given response, which on their recurrence tend to evoke that same
response.
SIT ratio - A mathematical comparison of the students' talk to
the teacher's talk calculated by dividing the total amount of student
talk by the total amount of teacher talk.
Symbolic model - A written description of the specific teaching_
behavior to be acquired by the teacher. It includes a rationale for
using the behavior.
Verbal behavior - Teacher talk and student talk which is audible
and discernible and occurs under classroom conditions.
CHAPTER II
PROCEDURES AND METHODOLOGY
Introduction
This chapter presents the techniques used in the investigation of
the two questions basic to the study: (1) What effect does a perceptual
modeling concept presentatiw of a modified Flanders Interaction Analy-
sis System have on the verbal teaching behavior of secondary student
teachers? (2) What categories or behaviors of the Flanders System are
most affected by a perceptual modeling concept of Flanders Interaction
Analysis System?
Sampling.Procedures
Fifty-two subjects, both male And female!were selecte(ifrom the
total population,of one hundred sixty-five Secondary teacher trainees
who were enr011ed in Education;120 during the second semester of the
196970 college year. EduCation 120 is a general methods pre-service
:coure takencby stUdents_immediately preceding the student teaching
program:at MestVirginia UniverSity'.
The subjeCts Were selected by using the table of random numbers.
The selection-prOcedabeganby the listingin alphabetical order all
te4Cher-trainees according to. their'content area specialization.. .
cont'ent areas vere social-studies science; language arts, and math.
Each student was giVen a'nutber.. Afier.,beginning with an arbitrary
The
finger point, the first student selected was placed in treatment group
one and the second was placed in treatment group.two, and so on, until
the sampling was completed for the content area. This procedure was
followed for each of the other content areas until the total sampling
was completed. Only eleven math teacher-trainees were available;
therefore, ten of the total math teacher-trainee population were se-
lected for this study. In the other content areas, fourteen social
studies majors were randomly chosen from a total of twenty; fourteen
language arts majors were'chosen from a population of twenty-three;
and fourteen.spience majort were selected from a total of seventeen.
Each of the treatment groups except math, which had ten subjects,
contained fourteen subjects each for a total of fifty-two subjects.
All subjects had completed, all of the prerequisite courSes prior
to student teaching. Since the subjects werp: sampled from all Education
120 classes, special instructions were given to the class instructors
concerning their students in experimental and. control groups.
Design Explanation
Group A Or the Experimental Group:- This group receiyed instruction
through the modeling of the tend..litpgpripp 0 a modified Flanders Inter.,
action Analysis System .presented via video tape
a four-hour Instructional:block
adequate as Young (90) and Lange, (86)
the specific modeled behaviOr was
and diScussion durinc
f Education 120. This time period uns
found that a brier exposure t
mobteffective'for learning ilCOmplex
verbal teaching behavior. During this instruction, which was
17
done by
the researcher, the students were first introducted to a modified
Flanders System of Interaction Analysis by discussion and handout
sheets showing the various categories. (re: appendix A). The
students were then shown the procedure of recording classroom be-
havior utilizing the recording sheet. The matrix was then discussed.
Next, a video tape modeling concept of a modified Flanders
System of Interaction Analysis was presented to the students. After
each modeled category had been viewed, the students discussed the
observed behavior. Live modeling of the categories the students
followed the video-tape presentation. The instruction ended with a
general discussion of the modified System and a summary.
Group B or the Control Group - This group received instruction
through discussion and other verbal means only concerning the concepts
of a modified Flanders Intemaction Analysis System during a four-hour
instructional block of Education 120. (re: appendix A)
Instruction for the, eXperiMental group was done by the principal
researcher. Instruction for the control groigip was done by a teacher1
of many years experience who was enrolled in the doctoral program
full time as a'gradUateasSiStant and instructor in the Education 120
program.
The instruction was divided into two parts. First, the students
atypiCal'elassrooM lesson.
They then:yrOCeededtb analyze the lessonAising',the conceptS cOntained
inHthe modified FlandersSysteM Without reference to a specific system.
In the second part, they were given a sheet which asked them to
list those characteristics present in a healthy classroom atmosphere.
Upon completion they then discussed those characteristics.
Video Recording Procedures
A video taped presentation of a modified Flanders Interaction
Analysis System was prepared prior to the experiment. The tape was
divided into three parts: (1) A brief taped introduction to the cate-
gory; (2) A brief taped introduction to the modeling of the category
behavior; and (3) A brief taped series (usually 3) of simulations dem-
onstrating the behavior of each category.
The introduction to each of the ten categories was presented by
Dr. Kenneth Murray and the introduction to the simulations was pre-
sented by the researcher. Instructors for each of the category simu-
'lotions consisted of doctoral students working in the Education 120
program who were familiar with Flanders' System; the students in the
simulations were played by preirious teacher-trainees who haa finished
Education 120 and who were also familiar withilelanders' System.
A paper entitled."Modeling Concepts)of Flanders System of Inter-
Action Analysis! .(ret .appendix 15) Vas prepared by the researcher and
served as a script and guide for the video-taped presentation. The
paper consists of clas room situations illustrating each of Flanders'
The situations are representative simulations often categories.
secondary classnoom situations in the content areas of math, science,
social studies, and language arts.
In its finel form then, the video tape represented taped teaching
episodes or simulations emphasizing specific teaching behaviors or
categories representative of the Flanders Interaction Analysis System.
Preceding each category or behavior was an introduction to the category
and an introduction to the simulation.
The equipment used included one Sony video recorder, one accompany-
ing camera, one tape one microphone and a video monitor. The class
room and taping situation is illustrated in figure 1, page 21.
Instrumentation
,A modified Flanders System of Interaction AnalYsis waxi the principml
instrument used to collect the data regarding the verbal t,:haviors of
the student teachers in their, respective school situatiohsi,, which were
the dependent variables.1
The Flanders System of Interaction Anal3fris is concerhed with
1
verbal behavior only and proyides a reliabl
used to quantify objectivelyverbal behaVitii.
instrument which can be
in a classro4m situation.
This technique for measuring classroom interaction was first
developed as a research tool and the Flanders System is one of the
mmre widely used and known. A complete description of the Flanders
System of Interaction Analysis with the slight modificatjon used in
this study appears in appendix A.
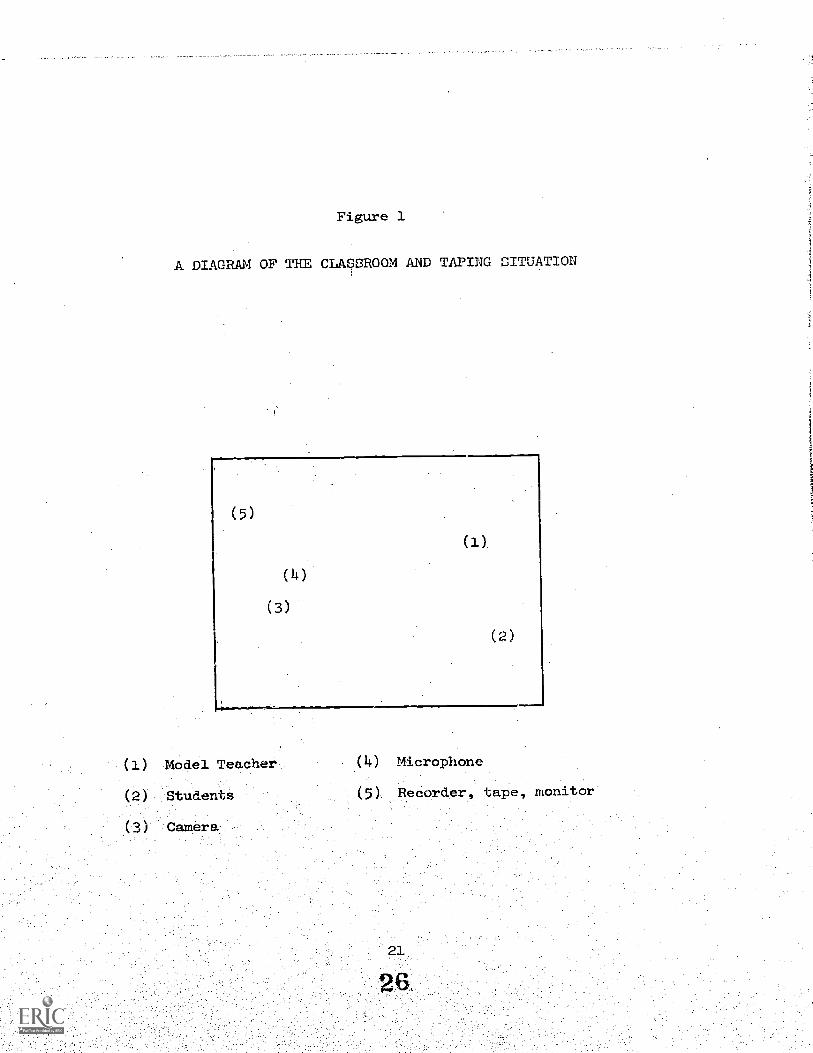
Figure 1
A DIAGRAM OF THE CLASSROOM AND TAPING SITUATION
(5)
(1)
(2)
(1) Model Teacher (4) Microphone
(2) Students (5) Recorder, tape, monitor
Data Collection
During the student teaching experience, the subjects were ob-
served in their respective school situations by three trained, reliable
observers utilizing a modified Flamders instrument for measuring class-
room verbal interaction. The three observem, all doctoral
candidates at West Virginia UniverBity, participated in /a training
program consisting-of twelve hours prior to acutal observation. During
the observation period, the observers underwent three reliability
checks (re: appendix C).
Verbal behavior was-reeorded,in'each.o.f-fivesobservtations'of'fifteen
minutes- each fora.each.ao.e..the subjects.of this study, To in--
sure aa.epresantiaWieQsampIingtof.teacher behaviori:the.observations.
were conduotedJatJthe/beglaming4.in,the middle,andJtowardJthe:end'of
the student,teachingexperiencett.Also,,classroom lessenswere:observed:
for eachiindividualsat.,variousAimes .such as$at:the:begimning.of.the.
lesson, during.the:middles,or.toward,the.latter.part,of.the.lesson..
The interaetion.analysis:datapfor.each.subject.and group were.then
recorded.on.a:reeordingisheet.byithe.observers...The.raw,interaction.
analysis:-dataz,werezthen,arrangedJand.punched.on.IBM
data after.being,preserved.on.,IBMscards,were.then.fed.into,an IBM
360-70.computer4..A.speeialeomputer:program:TrocessedAherawp .
interaption.analysia,data and appropriate ratios and means were computed
The,interaption analysis data:describing the dependent Variables
being measured in -this stuativ- were 'properly and 'orderly arrangec, ,and
punched , in 'IBM 'cards -for *final 'treatment ; These 'data 'cards -were -then
treat ed -by -an IEM -360./70 'computer 'with ,a spe c ial computer program de-,
signed for -computing *a 't -test program -for -the 'two groops on
ea=h of the ftependent "var:tables ,beiniz 'considered 'im this study Fin-
al-2y, a 'computer 'program -was devised to produce .a -cumulative -matrix for
each, of the groups (re: figures 3 and 4, pages 39 and Ho).
Oh
Group A
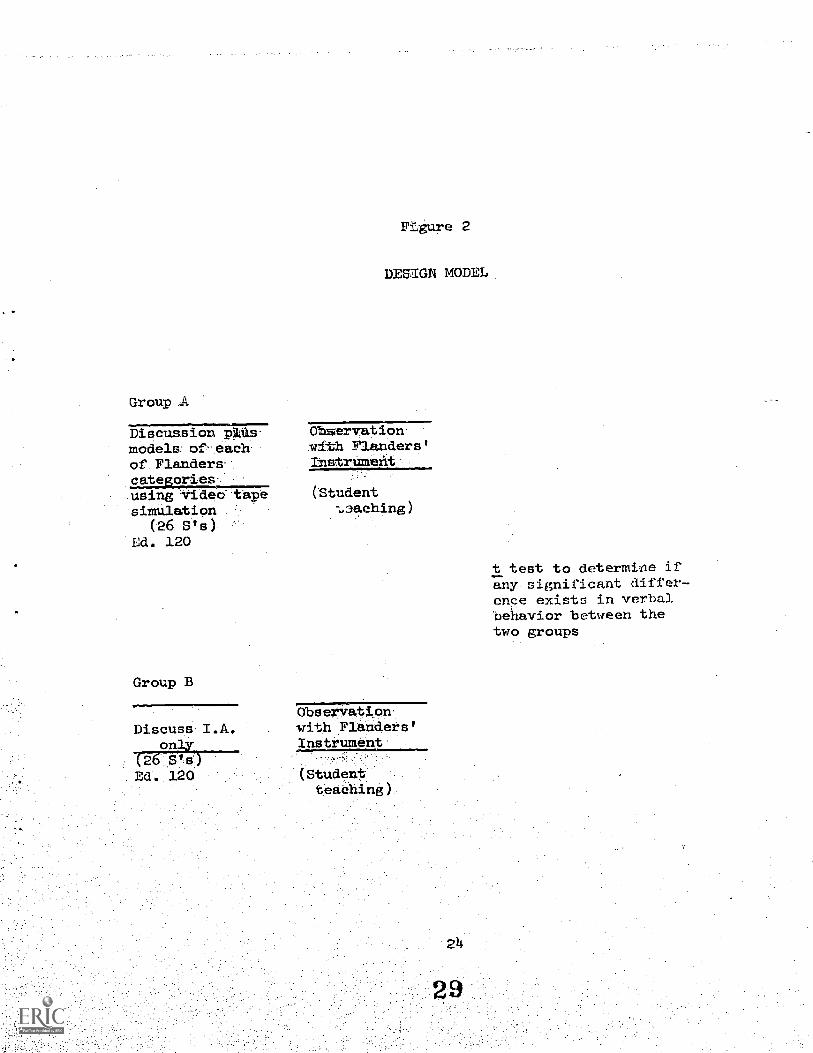
FLgure 2
DEnGN MODEL
Discussion p4As. Observationmodels of-each.- with Flanders'of FlanderS- InstrUmerit.categories.uding'Vided'tape (ftudent
simulation -L.laching)
(26 S's)Ed. 120
Group B
DiscussI.A.only
(2,S'4)- EcL 12Q
Observation.with Flanders'Instrument
(Studentteaching)
t test to determine ifany significant differ-ence exists in verbalbehavior between thetwo groups
:CHAPTER_III
RESULTS AND DISCUSSION
The purpos-s ci this chapter is to present the findings of this
study. The dEcts_mincerning the dependent variables is analyzed and
interpreted, amtt1e results of the tests of the hypotheses are pre-
sented. Each brstmtraesis is summarized and the data for the hypothesis
testing are presemz d with references to appropriate tables and fig-
ures. This infm=mtion is then used to determine if the null hypothe-
ses stated in Chapter I can or cannot be rejected.
Hypothesis One
Hypothesis ome states that there will be no difference between
the percentagen of direct teacher talk of stinient tenchfsrs trained
through a percept-..-al modeling concept in a modified Flanders System
of Interaction Analysis and the direct teacher talk of-student teachers
trained through a symbolic modeling only coneept in a modified-Flanders
System: Direct -,eacher talk is represented bY Flanders' categories
5, lecturing; 6- giving directions; and 7, criticizing or justifying
authority.
and le.
Data_predented in Tablel'show the'results of the statistical
treatment comparing the experimental group and the control group on
hypothe-As la, which states thatthere will be no difference .hetween
the two groups of-student teaChers'in lecturing, category 5.
This area is set forth in sub-hypothege la, lb, lc, ld,
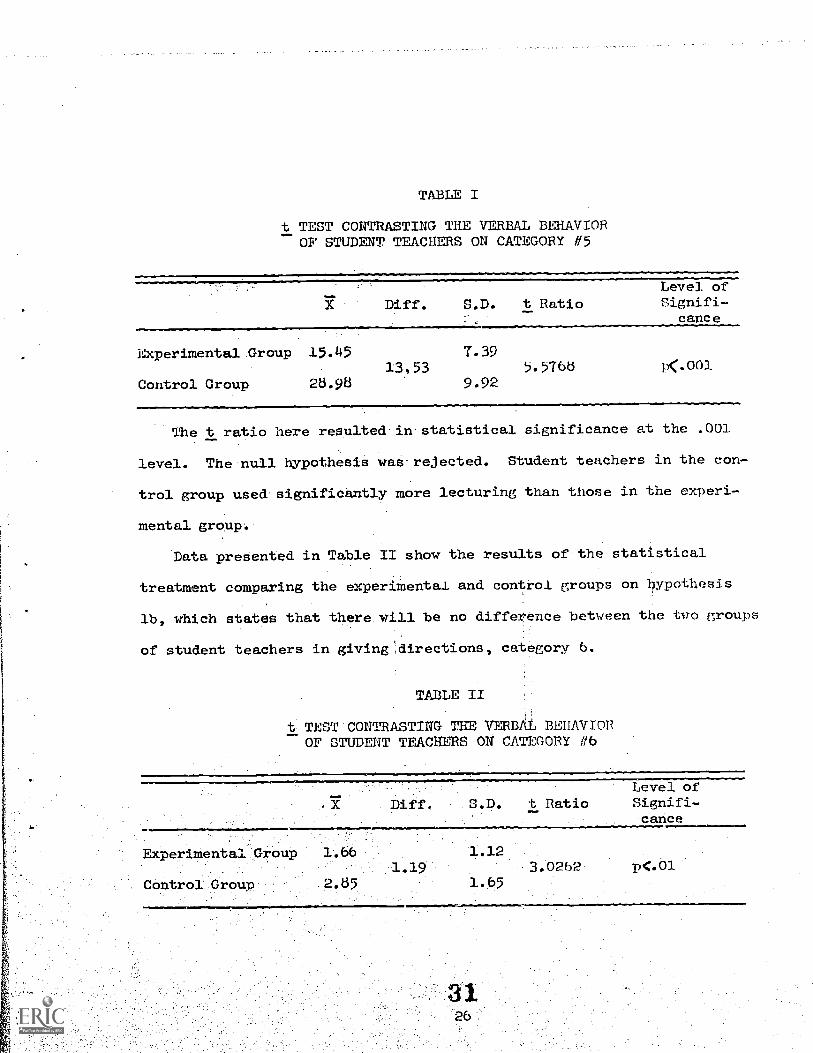
TABLE I
t TEST CONTRASTING THE VERBAL BEHAVIOROF STUDENT TEACHERS ON CATEGORY /15
Diff. S.D. t RatioLevel ofSignifi-
cance
Experimental .Group 15.45
Control Group 28.9813 53
7.395.5766
9.92K. 001
The t ratio here resulted in.statistical significance at the .001
level. The null hypothesis was-rejected. Student teachers in the con-
trol group used significantly more lecturing than those in the experi-
mental group.
Data presented in Table II show the results of the statistical
treatment comparing the experimental and control groups on hypothesis
lb, which states that there will be no difference between the two groups
of student teachers in givinedirections, category 6.
TABLE II
t. TEST CONTRASTING THE VERBAL BEHAVIOROF STUDENT TEACHERS ON CATEGORY #6
t Ratio
ExperiMental:Grolip:
Control. Group:
1.123.0262.
Level ofSignifi-cance
p(.01
The level of significance reached here was .01. The null hy-
pothesis was rejected. Student teachers in the control group exhibited
significantly more direction givi1 ng behavior than those in the experi-
mental group.
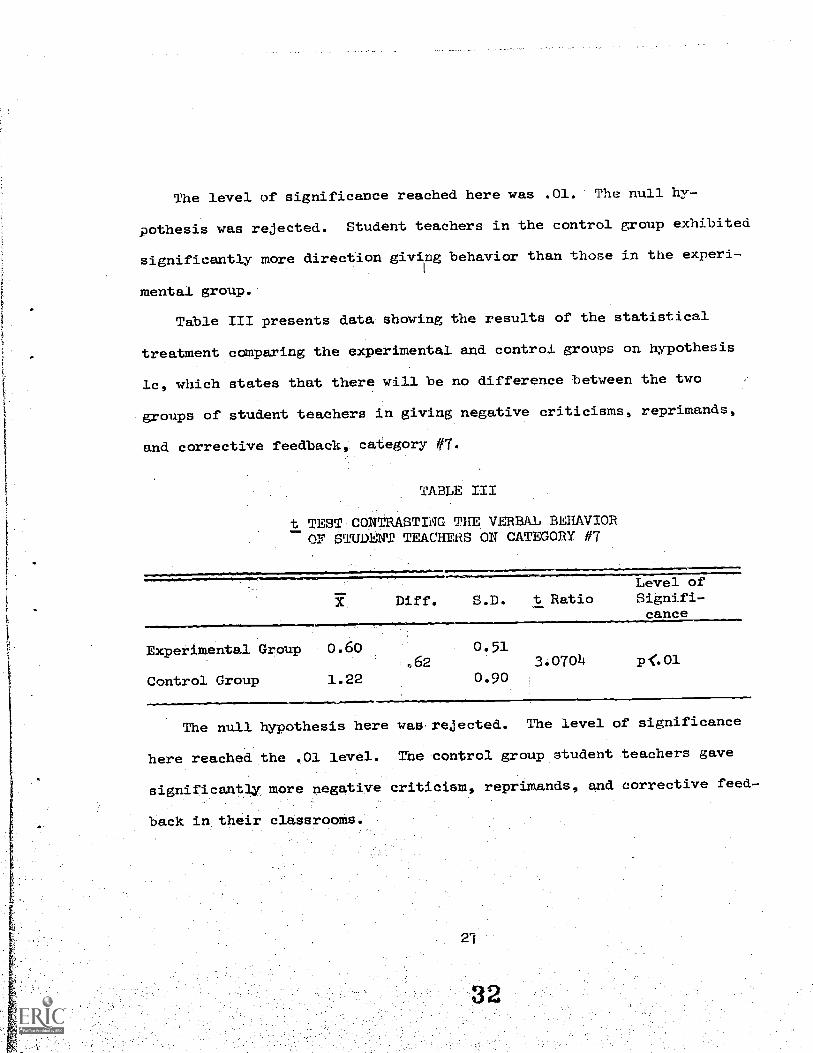
Table III presents data showing the results of the statistical
treatment comparing the experimental and control groups on hypothesis
lc, which states that there will be no difference between the two
groups of student teachers in giving negative criticisms, reprimands,
and corrective feedback, category #7.
TABLE III
t TEST.CONTRASTING THE VERBAL BEHAVIORor STUMM TEACHERS ON CATEGORY #7
Diff. S.D. t RatioLevel ofSignifi-cance
Experimental Group 0.6062
Control Group 1.22
0.513.0704
0.90PC01
The null hypothesis here was,rejected. The level of significance
here reached the ,01 level. The .control group student teachers gave
significant1y more negative criticism., reprimands, and corrective feed-
back in their classrooms.
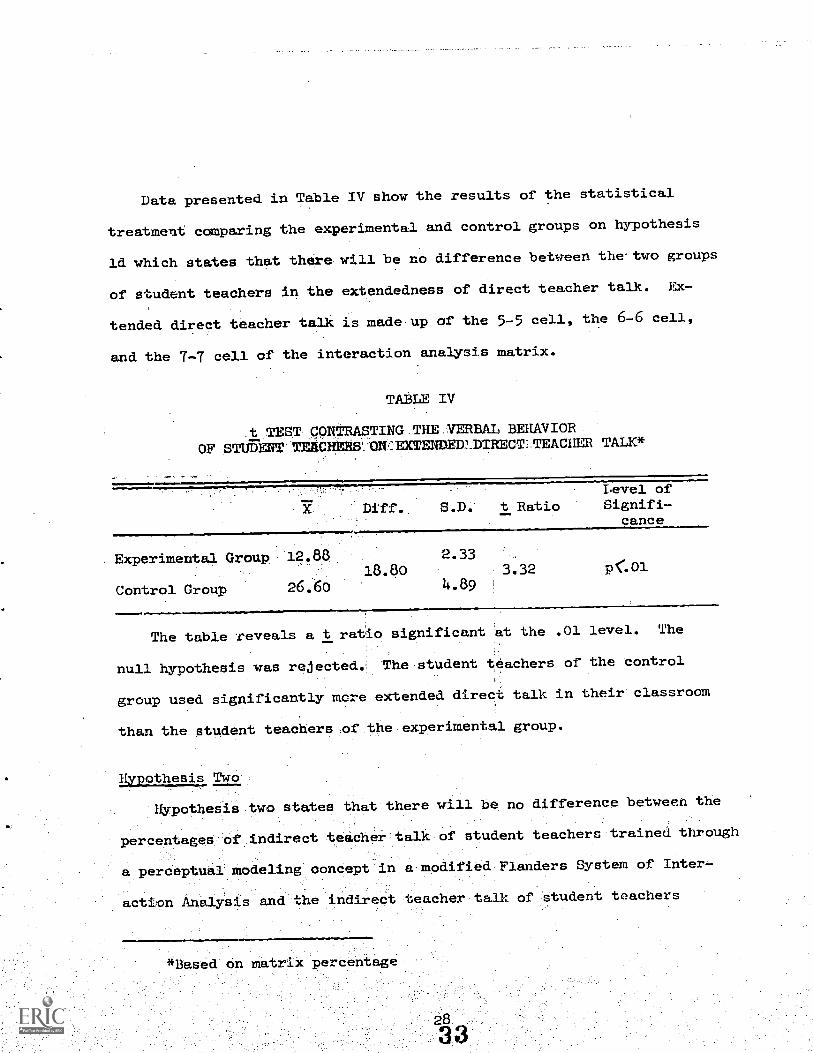
Data presented in Table IV show the results of the statistical
treatment comparing the experimental and control groups on hypothesis
ld which states that there will be no difference between the.two groups
of student teachers in the extendedness of direct teacher talk. Ex-
tended direct teacher talk is made up of the 5-5 cell, the 6-6 cell,
and the 7-7 cell of the interaction analysis matrix.
TABLE IV
.t TEST CONTRApTING.THE.XERBAL BEHAVIOR
OF STGFENT!TE4CRERSY0V m N .11)TREMTEAGHER TALK*
Level of
Diff. S.D. t Ratio Signifi-cance
. Experimental Group 12.88
Control Group 26.6018.80
2.333.32
4.89p<.01
The table reveals a t ratio significant at the .01 level. The
null hypothesis was rejected. The student teachers of the control
groUp used significantly more extended direct talk in their classroom
than the student teachers of the-experimental group.
Hypothesis Two
:Hypothesis-two states that-there will be mxdifference between the
Percentagea 'Of indirect teacher:talk of student teachers trained through
a pereeptUal-modeling ooncept in a.modified1Flanders System of Inter
action Analysis and the indirect teaoher talk of student teachers
loBased on matriXPerdentage
trained through a-symbolic modeling concept in a modified Flanders
System. Indirect teacher talk is represented by Flanders' categories
1, accepting student feelings; 2, praising or encouraging students;
3, accepting or using student ideas; and 4, asking questions. This
area is set forth in sub-hypotheses 2a, 2b, 2c, 2d, and 2e.
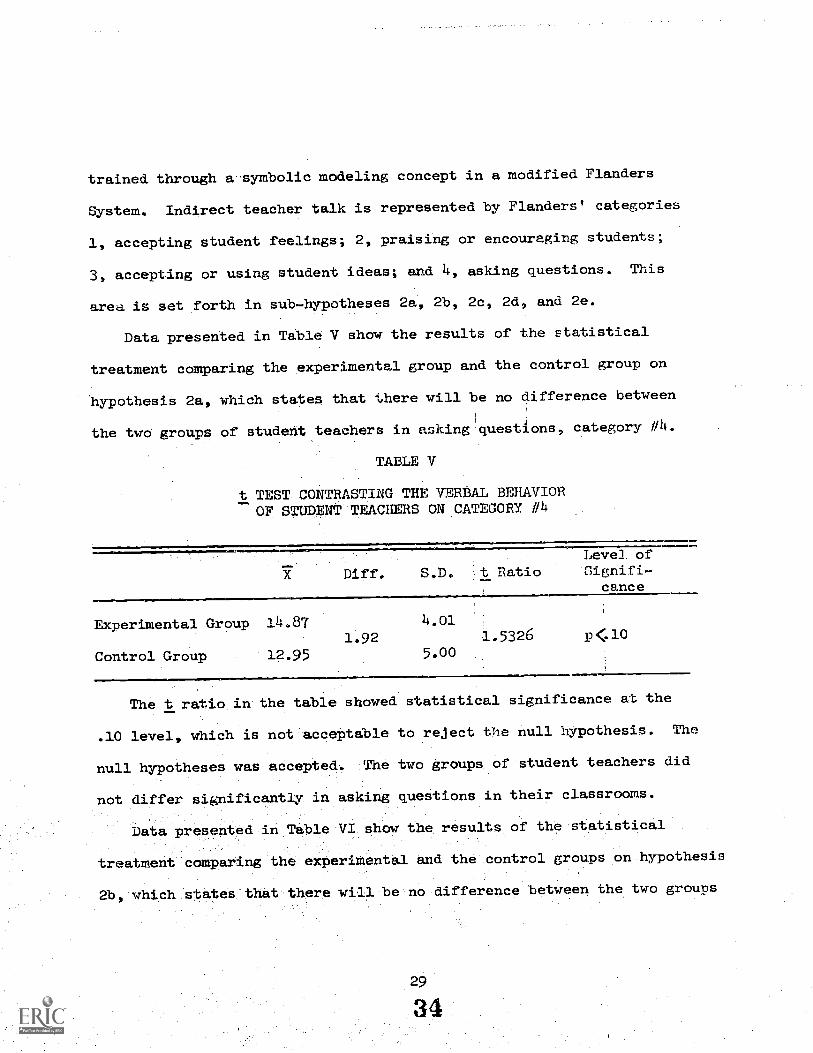
Data presented in Table V show the results of the statistical
treatment comparing the experimental group and the control group on
hypothesis 2a, which states that there will be no difference between
the two groups of student teachers in asking questions, category #4.
TABLE V
t TEST CONTRASTING THE VERBAL BEHAVIOROF STUDENTITEACHERS ON CATEGORY #4
Diff. S.D. t RatioLevel ofSignifi-
cance
Experimental Group 14.87
Control Group 12.951.92
14.01
5.001.5326 p.10
The t ratio in the table showed statistical significance at the
.10 level, which is not acceptable to reject the null hypothesis. The
null hypotheses was accepted. The two groups of student teachers did
not differ significantly in asking questions in their classrooms.
Data presented in Table VI show the results of the statistical
treatment comparing the experimental and the control groups on hypothesis
2b, which states that there will be no difference between the two groups

of student teachers in accepting and cla_:.fying student ideas, category 3.
TABLE VI
t TEST CONTRASTING THE VERBAL BEHAVIOROF STUDENT TEACHERS ON CATEGORY #3
Level of
Diff. S.D. t Ratio Signifi-cance
Experimental Group 15.37
Control Graup 10.055.32
5.80
3.813.9092 p<.001
The null hypothesis here was rejected. The level of significance
indicated by the t value reached .001. The experimental group student
teachers accepted and used significantly more student ideas in their
classrooms than the student teachers of the control group.
Table VII presents data showing the results of the statistical
treatment comparing the experimental and control groups on hypothesis
2c, which states that there will be no difference between the two groups
of student teachers i IgiVing praise and encOuragementv category #2.
TABLE VII.
t TEST CONTRASTING THE VERBAL BEHAVIOR
OF STUDENT TEAC4g-As ON CATEGORY ff2
Level of
Diff. S.D. t Ratio Signifi-cance
Experimental GrouP
Control Group
2.60
1.181.42
0,96
1.163.8178 p<.001
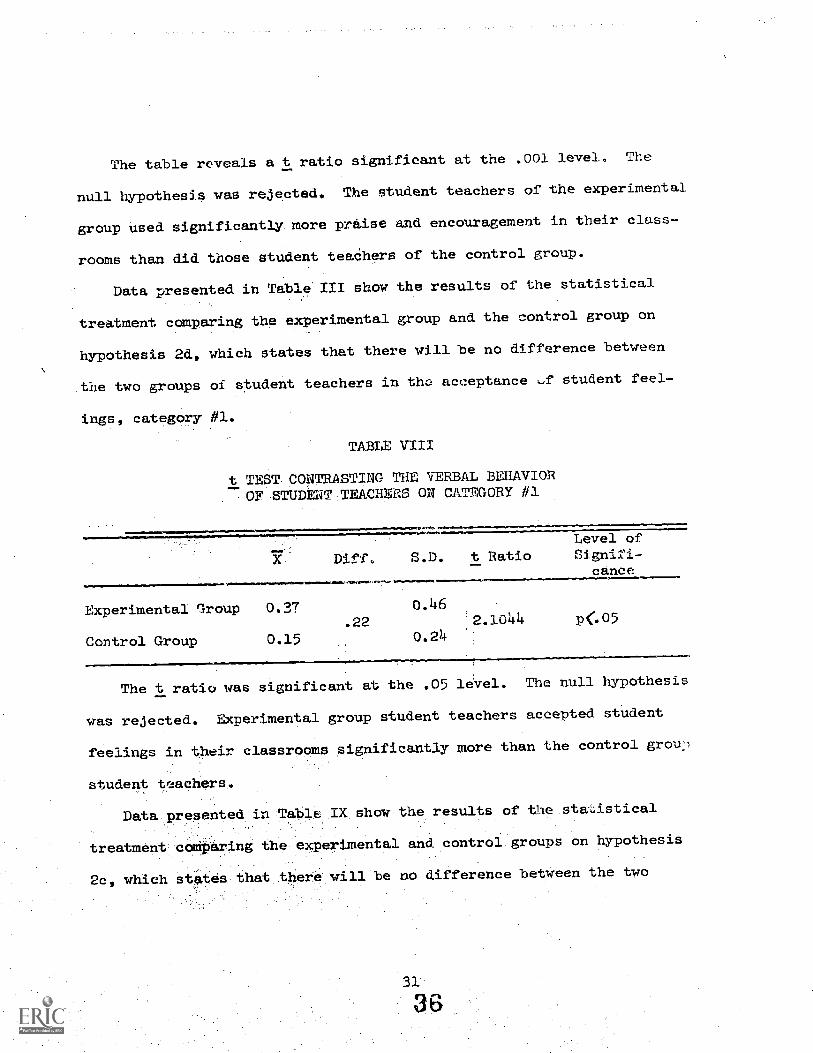
The table reveals a t ratio significant at the .001 level. The
null hypothesjs was rejected. The student teachers of the experimental
group used significantly more praise and encouragement in their class-
rooms than did those student teaChers of the control group.
Data presented in Table III show the results of the statistical
treatment comparing the experimental group and the control group on
hypothesis 2d, which states that there will be no difference between
the two groups of student teachers in the acceptance f student feel-
ings, category #1.
TABLE VIII
t TEST CONTRASTING THE VERBAL BEHAVIOR
.
,OF.STUDENTTEACHERS ON CATEGORY #1
Level of
Diff% S.D. t Ratio Signifi-cance
Experimental Group 0.37
Control Group 0.15
0.146
.22 2.1044 1). 05
0.24
The t ratio was significant at the .05 level. The null hypothesis
was rejected. Experimental group student teachers accepted student
feelings in their classrooms significantly more than the control grou2
student teachers.
Data presented in Table IX show the results of the staAstical
treatment comiparing the-experimental and control groups on hypothesis
2c, which states that there will be no difference between the two
31
36
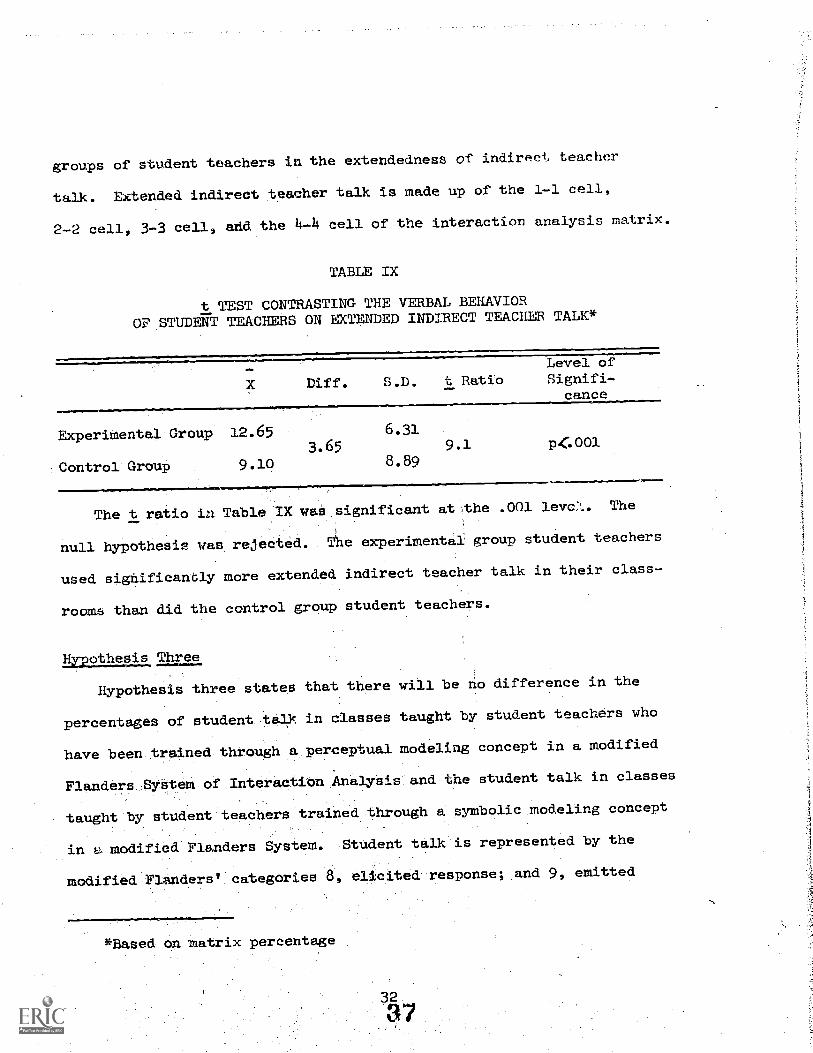
groups of student teachers in the extendedness of indirect teacher
talk. Extended indirect teacher talk is made up of the 1-1 cell,
2-2 cell, 3-3 cell, add the 4-4 cell of the interaction analysis matrix.
TABLE IX
t TEST CONTRASTING THE VERBAL BEHAVIOR
OF STUDENT TEACHERS ON EXTENDED INDIRECT TEACHER TALK*
Level of
Diff. S.D. t Ratio Signifi-cance
ExperiMental Group 12.65
:Control Group 9.103.65
6.319.1
8.89
The t ratio in Table IX vaS significant atithe .001 levc%. The
null hypothesis was rejected. The experimental group student teachers
used significantly more extended indirect teacher talk in their class-
rooms than did the control group student teachers.
EULD',t112.,S_Ls Three
Hypothesis three states that there will be no difference in the
percentages of student talk in classes taught by student teachers who
have been trained through a perceptual modeling concept in a modified
Flanders System of Interaction Analysis and the student talk in classes
taught by student teachers trained through a symbolic modeling concept
in e, modified Flanders System. Student talk is represented by the
modified Flanders categories 8, elicited response; and 9, emitted
*Based on matrix percentage
response. This area is set forth in sub-hypotheses 3a, 3b, and 3c.
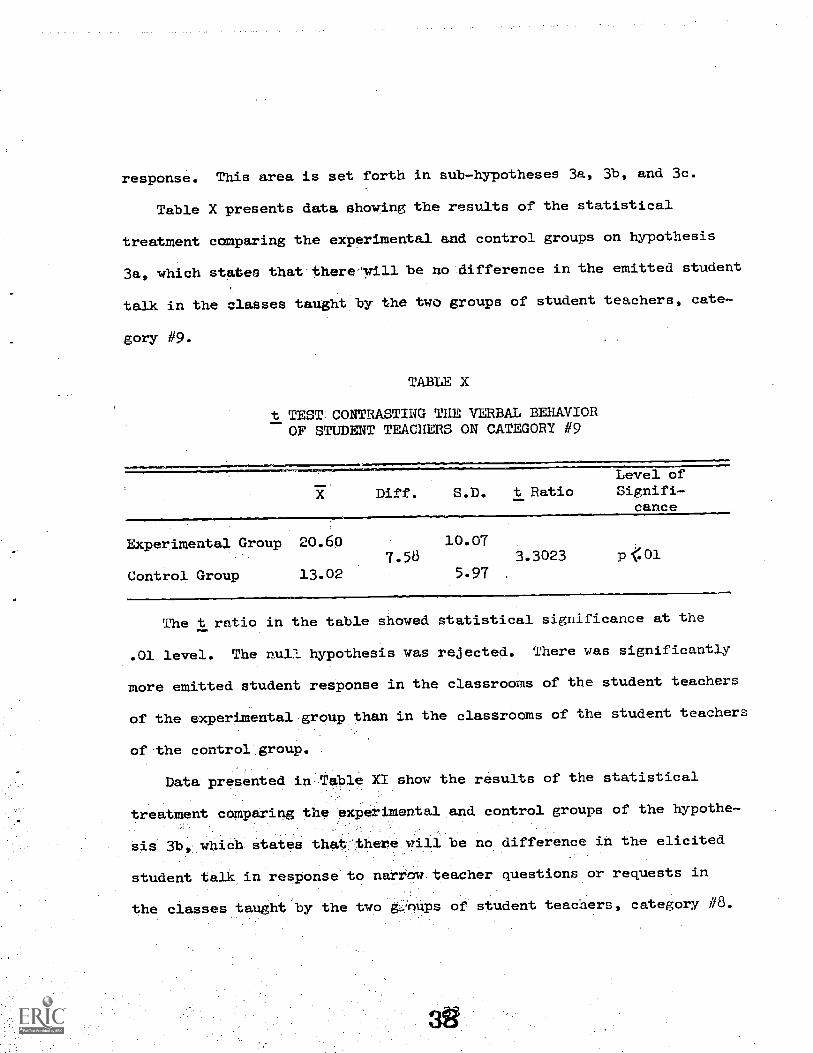
Table X presents data showing the results of the statistical
treatment comparing the experimental and control groups on hypothesis
3a, which staten that there'-will be no difference in the emitted student
talk in the classes taught by the two groups of student teachers, cate-
gorY #9.
TABLE X
t TESTCONTRASTING THE VERBAL BEHAVIOROF STUDENT TEACHERS ON CATEGORY #9
Level of
3E Diff. S.D. t Ratio Signifi-cance
Experimental Group 20.60
Control Group 13.02
10.077.58 3.3023 p.01
5.97
The t ratio in the table showed statistical significance at the
.01 level. The null hypothesis was rejected. There was significantly
more emitted student response in the classrooms of the student teachers
of the experimental group than in the classrooms of the student teachers
of the control group.
Data presented in Table XI show the results of the statistical
treatment comparing the experimental and control groups of the hypothe-
sis 3h, which states that there will be no difference in the elicited
student talk in response to narrow teacher questions or requests in
the classes taught by the two gz.'nups of student teachers, category #8.

TABLE XI
t TEST CONTRASTING THE VERBAL BEHAVIOR OFSTUDENT TEACHERS ON CATEGORY #8
+0.1=100Level of
Diff. S.D. t Ratio Signifi-cance
Experimental Group 16.00
Control Group.95
15.05
6.820.4795
7.47
N. S.
The t ratio in'the table was pot significant. The null hypothesis
wa% accepted. The experimental and control group student teachers' stu-
dents did not differsignificantly in elicited responses'in the classroom.
Data presented in Table XII show the results of the statistical
treatment comparing the experimental groups on hypothesis 3c, which
staGes that there will be no difference in the length of specific epi-
sodes of student talk in the Classes taught by the experimental and con-
trol groups of student teachers. Specific episodes of student talk is
comprisedof the 8-8 and 9-9 cells of the interaction analysis matrix.
TABLE XII
t IDESTIJONTRASTING THE TWO STUDENT TEACHERGROUPS ON EXTENDED STUDENT.TALK IN THEIR CLASSROOMS*
Level of
Diff, S.D. t Ratio Signifi-cance
B2tpeimental Group 11.0
Vpnttpl Group3.0
9.385.7
5.00
pC.001
The t ratio in the table showed statistical significance at the
.001 level. The null hypothesis was rejected. In the experimental
student teacher classrooms, there was significantly more episodes of
student talk than in the control student teacher classrooms.
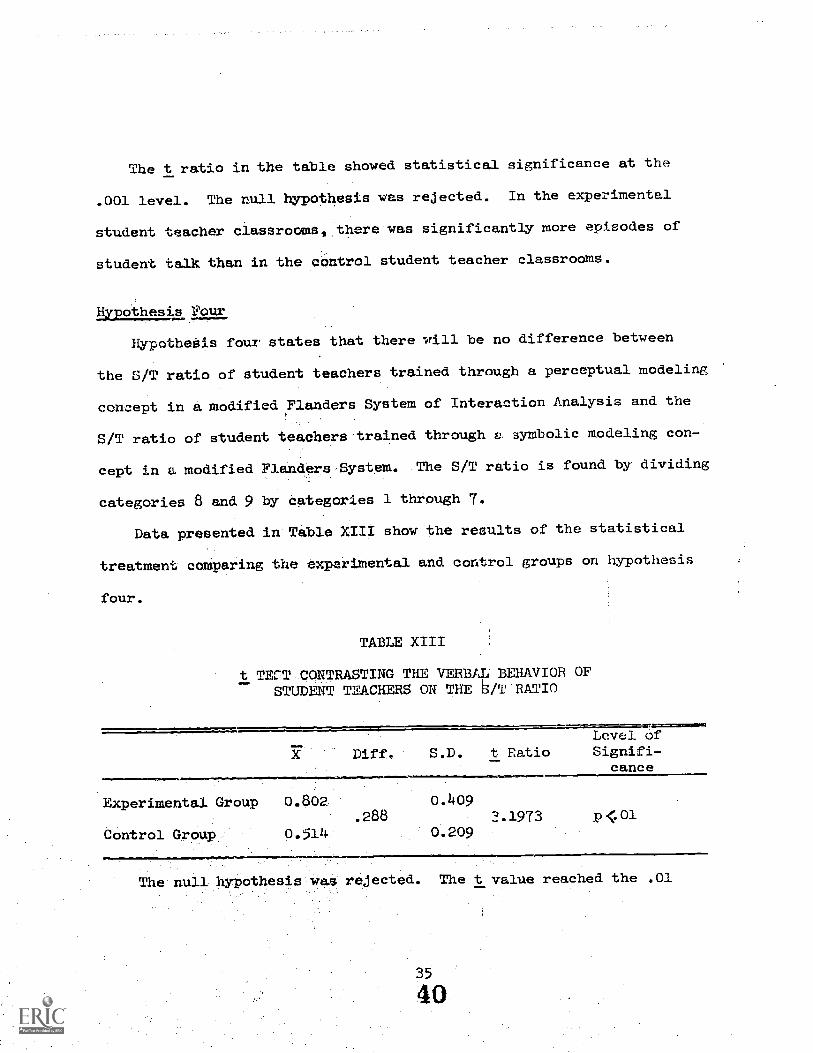
Hypothesis Pour
Hypothesis four states that there will be no difference between
the S/T ratio of student teachers trained through a perceptual modeling
concept in a modified Flanders System of Interaction Analysis and the
S/T ratio of student teachers trained through e symbolic modeling con-
cept in a modified Flanders System. The S/T ratio is found by dividing
categories 8 and 9 by categories 1 through 7.
Data presented in Table XIII show the results of the statistical
treatment comparing the experimental and control groups on hypothesis
four.
TABLE XIII
t TECT CONTRASTING THE VERBAL' BEHAVIOR OF
STUDENT TEACHERS ON THE h/T RATIO
Experimental Group 0.802.
Control Group.:. 0 . 514
Diff. S.D. t RatioLevel ofSignifi-
cance
.2880.409
0.2093.1973 p 01
The null hYpothesisWa* rejected. The t value reached the .01

level of significance. The S/T ratio wss significantly greater in the
classrooms of the student teachers of the experimental group than in
the classrooms of the student teachers of the control group.
Hypothesis Five
Hypothesis five states that there will be no difference between
the I/D ratio of student teachers trained through a perceptual modeling
concept in a modified Flanders System of Interaction Analysis and the
I/D ratio of student teachers trained through a symbolic modeling con-
cept. The I/D ratio is found by dividing categories 1, 2, 3 and 4 by
categories 5, 6 and 7.
Data presented in Table XIV show the results of the statistical
treatment comparing the experimental and control groups on hypothesis
five.
TABLE XIV
t TEST CONTRASTING THE VERBAL .BEHAVIOR OFSTUDENTASACHERO ON THE I/D RATIO
Diff, SD. t Ratio
Experimental Group 2.270
Control Group 0.8511.419
1.3025.1616
v.520
ArapawimmollaLevel ofSignifi-
cance
The t rEitiO in the table_reached statistical significance at the
.001 level. The null hypothesis was rejected. The I/D ratio of the
experimentalgroup student teachers Was significantly higher than the
36
41
I/D ratio of the control group student teachers.
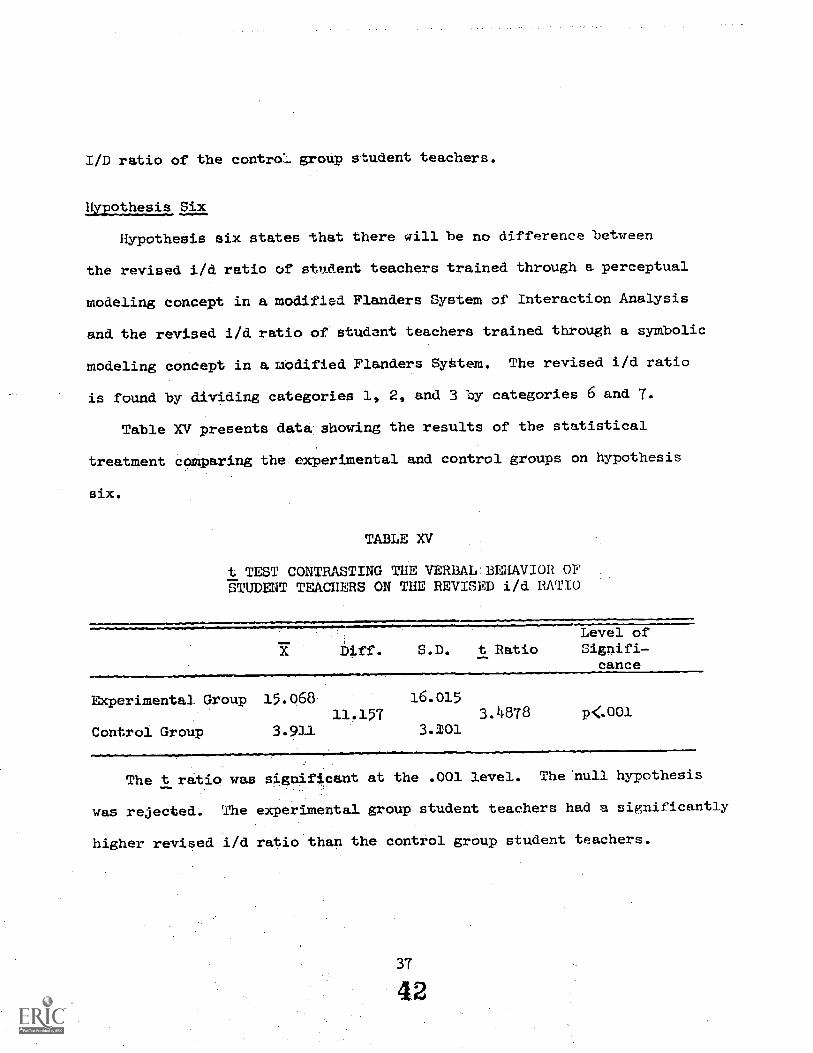
Hypothesis Six
Hypothesis six states that there will be no difference between
the revised i/d ratio of stndent teachers trained through a perceptual
modeling concept in a modified Flanders System of Interaction Analysis
and the revised i/d ratio of student teachers trained through a symbolic
modeling concept in a modified Flanders Syatem. The revised i/d ratio
is found by dividing categories 1, 2, and 3 by categories 6 and 7.
Table XV presents data showing the results of the statistical
treatment comparing the experimental and control groups on hypothesis
six.
TABLE XV
t TEST CONTRASTING THE VERBAL BEHAVIOR OFSTUDENT TEACHERS ON THE REVISED i/d RATIO
Level ofDiff. S.D. t Ratio Signifi-
cance
Experimental Group 15.06811.157
Control Group 3.911
16.0153.4878
3.101p<.001
The t ratio was significant at the .001 level. The null hypothesis
was rejected. The experimental group student teachers had a significantly
higher revised i/d ratio than the control group student teachers.
37
42
Summary
There were fifteen student teacher behavioral variables examined.
Of these, all reached significance at the .05 level except two. Of
these two, one reached significance at the .10 level. 0oeven of the
variables reached the .001 level of significance. Five variables
reached the .01 level of significance and one reached significance at
the .05 level.
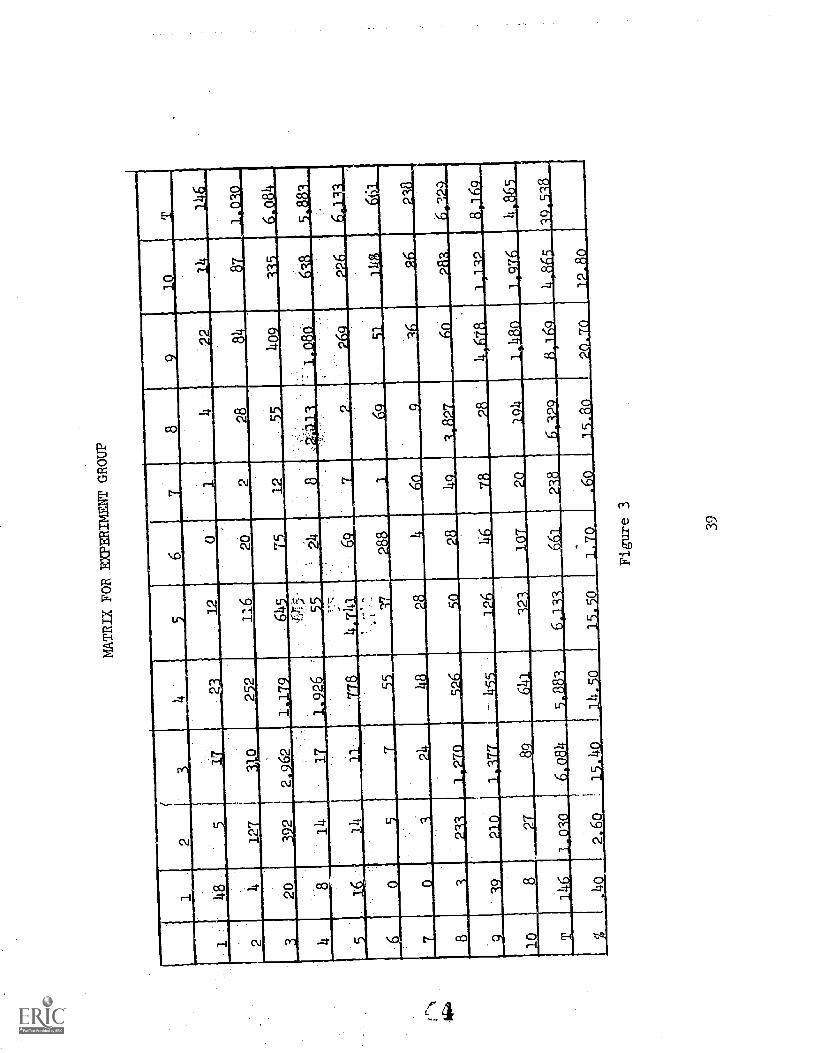
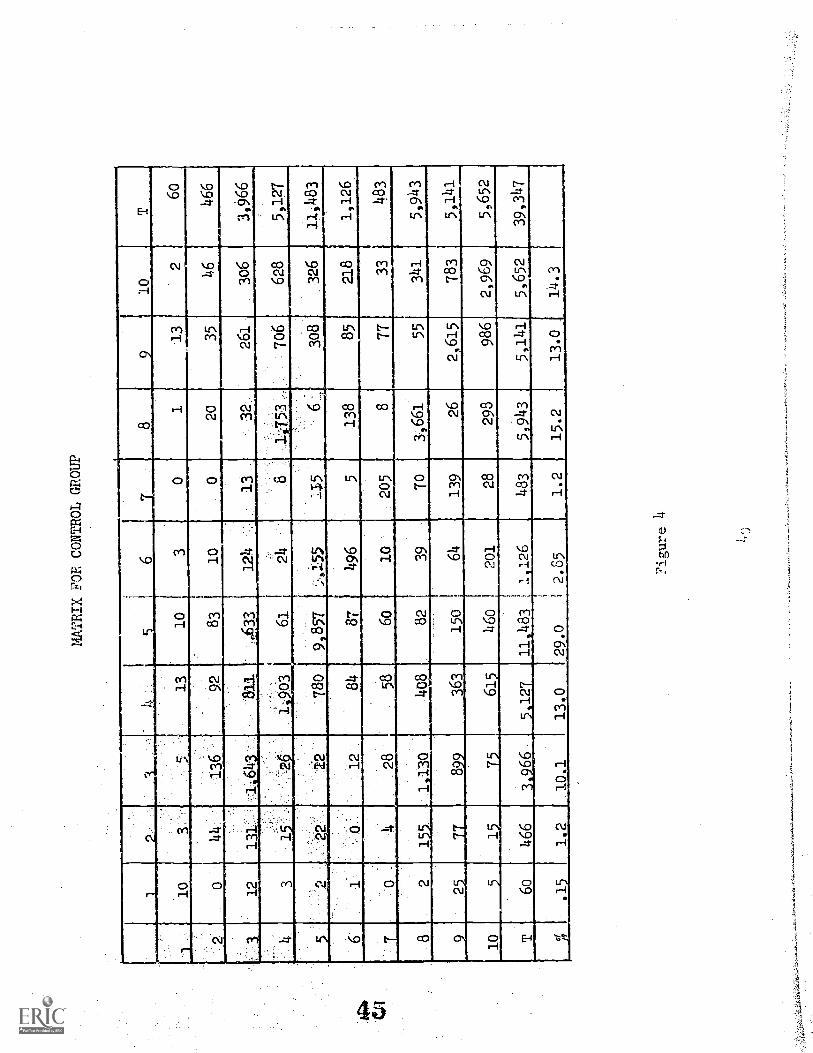
The matrices for the experimental and control groups are shown
in figures 3 and 4, pages 39 and 40.
38
4 3
,W6
MATRIX FOR EXPERIMENTGROUP
39
MATRIX FOR CONTROL GROUP
_....1
0
8
113
lo
..
10
3.',
-... 5
l'
13
10
32
60
-. 2
0
.,
_
:
.
136
92
83
10
020
35
46
466
12.
13i':.,-
1.5.,,,1,643
..:27
--1111
1-903
433 61
124 24
32
1'7.53
..,
261
.: 706
306
628
3 966
5 127
11111
3
L.:12
780
9 857
1:;',6155
368
,326
4,483
6
III
1.-.
12
84
87
496
5138
85
218
1 126
04
..28
58
60
lo '
20
877
33
483
82
11 130
408
82
39
70
3,661
55
341
5,943
77
899
363
150
64
139
26
2,615
783
5 141
lo
1615
460
201
28
298
986
2,969
5 652
6o
466
396 6
10.1
12
13.0
11 483
29.0
1 126
2.85
483
5 943
5,141
5,652
39,347
..1
1.2
1.2
15.2
13.0
14.3
Figure 4
CHAPTER IV
SUMMARY, CONCLUSIONS, AND RECOMMDIDATIONS
Summary
This investigation was designed to determine the effects of a per-
ceptual modeling concept presented during the pre-service experience,
on the verbal behaviors of student teachers in their student teaching
experience. Within the framework the major purposes of the study were:
(1) To determine the effects of a video tape modeling concept
versus a verbal only presentation of an interaction analysis
system on the verbal behaviors of student teachers.
(2) To identify those ca*Igories or behaviors which were most
affected by a perceptual modeling concept of a modified
Flanders Interaction Analysis Syem.
The fifty-two subjects whp comprised the sample for this Study were
drawn randomly from a larger population of one hundred sixty-five stu-
dents in Education 120, a general methods cOurse immediately preceding
the student teaching experience at West Virginia University, the second
semester of the 1969-70 school year. The saFple consisted of fourteen
social studies majors, fourteen language arts majors, fourteen science
majors, and ten math majors.
The fifty-two pre-service teachers were randomly assigned to
either the experimental group or the control group. The experimental
group received instruction through perceptual modeling of the ten
46
categories of a modified Flanders Interaction Analysis System pre-
sented via video tape and discussion. The control group received in-
struction through discussion and other verbal means only concerning
the concepts of the modified Flanders Interaction Analysis System.
During the student te:!ehing experience, the subjects were c,b-
served in their assigned individual school situations by three trained
and reliable observers utilizing a modified Flanders instrument for
measuring their classroom verbal behavior. Verbal behavior was re-
corded in each of five observations of fifteen minutes each for each
of the fifty-two subjects. Observations were scheduled at the beginning,
the middle of, and toward the end of the student teaching experience.
During the observation period, which spanned the student teaching ex-
perience, three reliability checks were conducted for the observers
(re: appendix 0). Before the observation period, the observers had
participated in a training session, consisting of approximately twelve
hours of interaction analysis instruction.
Upon completion of the data gathering, the interaction analysis
raw data for each subject was preserved on 1.114 data cards. From these
appropriate mean percent scores and ratios for each group were arrived
at by means of a specially prepared computer program using the West
Virginia University 360/70 computer. A matrix printout supplied other
data for the two groups. All data needed for comparing the teacher
behavior hypotheses were thus derived. A multiple t test program was
used to compare the selected verbal behavior variables of the two groups.
42
4 7
Conclusions and Commints
1. As demonstrated in this study, there is evidence to support
the alasmy_aaLa_glag.12.22rief exposure to a model demonstrating a
s ecific set of behaviors (in this case Flanders' cate orie ) was
sufficient to brin about behavioral chan e in student teachers.
Each video tape episode lasted approximately three minutes. This
supported the theory of Bandura (6) and the research of Young (90),
that imitation can occur through video taped modeling techniques.
2. Student teachers who received a perceptual modeling concept
resentation of interaction ana sis durin
show slonificantl
z-e-service training did
different verbal behavior in their classrooms than
did those student teacheraatIMalkzedasymbolic modelino concul
presentation of interaction analysis.
Video taped modeling technigu.n, as used in this study, structured
through the categories of a system of interaction analysis were suc-
cessful in modifying student teacher behavior in the experimental group.
The i_deo tape modeling in this study'served as the technique and
the medium while a modified Flanders System of Interaction Analysis
provided the content and the structure.
The student teachers of the experimental group differed significantly
from the control group student teachers as follows:
1. The experimental student teachers used more acceptance of
student feelings.
4 8
2. The experimental student teachers used more praise and
encouragement of student action and behavior.
3. The experimental student teachers used more acceptance and
clarification of student ideas.
4. The experimental student teachers used less lecture.
5. The experimental student teachers spent less time in giving
directions.
6. The experimentatlatUdent teachers spent less time in
criticizing student behavior or actions and in giving corrective feed-
back.
7. The experimental student teachers stimulated more student
initiated talk.
8. The experimental student teachers used less extended
direct teacher talk.
414.
49
9. The experimental student teachers used more indirect
teacher talk.
10. The experimental student teachers used more extended
indirect teacher talk.
AS set forth in Chapter IV, all the null hypotheses except tuo
were rejected. The data analyzed in this stuy showed that student
teachers who participated in the modeling concept presentation of
interaction anal is aid show significantly different behavior patterns
on thirteen of the variables tested. The difference ranged from the
.05 level for one variable to the .001 level for six varUlbles. Two
of fifteen variables tested were rejected as not significant. There
was not significant difference between the two groups concerning asking
questions. However, since there was a signiflcant difference between
the two groups in favor of the experimental student teachers on
emitt;ed student responoe; this would tend to indicate that the ex-
perI-ental student teachers allowed greater s:-.u.dent freedom to expand
on the questions, inject their own ideas and generally discuss more.
This may also indicate that experimental student teachers asked more
divergent qurtstiona, since the group did not dfer on elicited student
talk.
3. ademaisy.2.Ltlieuseofterecorder to present modelins sequences of definite behaviors is an
effective instx ntional technique and an effective meat3 of Lransmittinr,
115

behavior.
The video tapes, once prepared, seemed to enhance the instructional
process by providing visual images and cues relevant to each modeleu be-
havior. This is supported by the research of Bandura (6) and by Allen (78).
: In this study the perceptual modeling technique elicited more be-
havioral change than the symbolic modeling technique.
4. As demonstrated by this study, the student teachers which
received a Esgpling concept preseEtaion of interaction anal sis in-
corporated more of the indirect behaviors, whereas the control group
seemed to Incorporate more of the direct behaviors.
This finding substantiated that of Lange (86) who recently found
that reeiling teachers were influenced by a video tape demonstrati
indirect teacher behavior over a similar video tape model demonstrating
direct teacher behavior.
Recommendations for Teacher Education
The results of this study provide support for the following
recommendations:
1. Modeling tapes should be developed in which specific teacher
behaviors are presented with relevant cues for the teacher
trainee.
2. A tape bank and laboratory sixuld be developed in which the
teacher trainee at any time would be able to secure for
viewing video tapes deoonstrating episodes of specific

teacher behavior.
3. Specific teacher behaviors or structure f,r modeling tapes
should be provided by a system of interaction -1lysis.
This would insure that the teacher trainee is observing a
specific behavio:.7 which he can identify through an organized
system. A study of an interaction analysis system should
precede the video tape modeling. :.This would provide the
teacher trainee with a system for both understanding and
evaluating the modeling.,
4, Modeling tapes demonstrating specific behaviors should be
short. Three minutes of tape modeling a specific behavior
seems to be enough for desired effects.
5. Since it is not always easy for the student teacher to
divide the connection between the theory of teaching and
the practice in the classroom, the methods courses and
other pre-service cavses should utilize video tape pro-
cedures to illustrate fc l. the'student teacher those abstract
verbal descriptions.
6. Video tape equipment ehould be utilized in the teacher
education program instead of the common sound film P.luip-
ment, especially where limited funds mean only certain
audio-visual aids can be secured. Though sound films of
teaching situations have been good aids in demonstrating
teacher behavior sequences, they are expensive and have
47
limited flexibility. A complete video tape outfit
with camera gives more flexibility than Lhe sound
film since tapes can be revised; local classroom situa-
tions reproduced; student simulations taped; and video
tapes can be stored the same as film for future use.
Recommendations so.T.LIE-111.921 Research
In view of the findings of the present study, the following
recaumendations are set forth for further study and investigation.
1. The present study may be replicated using similar as
well as different types of subjects. The basic purpose
and design df the study should be retained.
2. The present study needs to be replicated with in-service
teachers serving as subjects to ascertain if this is an
effective means ior shaping in-service teacher behavior.
3. This study took into account fifteen dependent variables.
Other verbal behavioral variables may be compared in a
study utilizing the present design.
4. A research design should investiglIte,tlie duration and
amount of behavioral cnange in student teachers who have
received video tape modeling concepts of specific behaviors.
5. This research study used as subjects student teachers
from the four content areas of social studies, sclence,
langua±7,c arts, and math. The study needs to be replicated
48

using sulsjects from one content area.
6. A research design needs to explore the effects of
authoritative versus democratic models on student
teachers.
7. A research design needs to explore why the experimental
student teachers who received a perceptual modeling of
interaction analysis incomorated more of the indirect
rather than the direct modeled behaviors.

BIBLIOGRAPHY
A. BOOKS
1. Amidon, E.J. and N. A. Flanders. "Interaction Analysis
as a feedback System" In E, J. Amidon and J. B. Hough
(Eds.), Interaction-Analysis: 21222Ly Research and Aalk-
cation. Reading, Mass.: Addison-WesleY, 1967, 121-140.
2. Amidon, E.J.,dand M. Giammatteo. "The Verbal Behavior of
Superior Elementary Teachers." In E. J. Amidon and J. B.
Hough (Eds.), teaction Theory, Research and
App1ication.1 Reading, Mass.: Addison-Wesley, 1967,
3. Amidon, E. J., and J. B. Hough (Edr.) Interaction ApEilzaia:
Theory, Research and Application. Reading, Mass.: Addison-
Wesley, 17717--*
4. Amidon, E. J. and E. Hunter. Imaoyila Teaching: The Analysis
of Clrssroom Verbal Interaction. New York: Holt, Rinehart
and L.nston, Mr"
5. Amidon, E, J. and E. Hunter. "Verbal Interaction in the Classroom:
The Verbal Interaction'Category Sysbem." In E. J. Amidon
and J. B. Hough (Eds.), Interaction Analysis: Theory, Research
and Axmals:tion. Reading, Mass.: Addison-Wesley, 1967, TE17---"577.
6. Bandura, A. "Social Learning Through Imitation." Nebraska
Symposium on Motivation: 1962. Marshall R. Jones, editor.
Lincoln: Univeraity-of Nebraska Press, 1962, 211-69.
7. Bandura, A. "The Role of Modeling Processes in PersonalityDevelopment." In W. W. Hartup arid N. L. Smothergill (Eds.),
The young Child. National Association for the Education of
Young'Chi1ae7,71967, 42-58.
8. Bandura, A. "Vicarious Processes: A Case of No-Trial Learning."
Advaaces in Experimental Social Psychology. Volume 2. New
York: AcadeMic Press, 196371:55.
9. Bandura, A., and R. H. Walters. Social LsamiLla and Versonalit:f
Development. New York:. Holt, Rinehart and Winston, 1963.
5 0
10. Chittenden, G. E. "An Experimental Study in Measuring andModifying Assertive Behavior in Young Children." Mono-
LE.24p., of the Society for Research in Child Development.
WaShington, D.D:t" Natisbnal Research Council:71-9142, 7.
11. Cogan, M. "Theory und Design of a Study of Teacher-Pupil
Interaction." In E. J. Amidon and J. B. Hough (Eds.),
Interaction Ana sis: Theory, Research and Application,
Mdes":-: Add1 sOn4,01aey, 1967, 0.13T7---
12. Combs, A. W. The Professional Education of Teachers: A Pet-
smusa yiew of.geadher.Education. Boston: Allyn and
Bacon, 1,9 g-57
13. Flanders, N. A. ''Interaction Models of Critical Teaching
Behaviors." In E., J. Amidon and J. B. Dough (Eds.),
Interaction Analysis': Theory, Research z:366374.
1 . Flanders,. N. A. Itipeqction Analysis in the laassroom: A
Manual7
for Obserr aollege of Education,ir§-07
15. Flanders, N. A. "Some Relationships Among Teacher Influence,
Pupil Attitudes,'and Achievement." In E. J. Amidon andJ. B. Hough (Eds,) Interaction AREI/E1E: Theory, Research
20,4Plication, Maas,: Addison.Wemley, 1967, 2i7=212.
16. Flanders, N. A. "Teacher Behavior and In-Service Programs."In E. J Amidon and,J. B. Hbugh (Eds.), Interaction Analysis:
Theo , Research and Application, Mass.: Addison-Wesley,
19 7, 252-255.
17. Flanders, N. A. 'The Problems of Observer Training and Relia-In E. J. Amidon and J. B. Hough (Eds.), Interaction
A1Iiq *-sory_, Research and Applicatfon. Roading, Mass.:
13on4/011-e77167;'
18. Hough, J. B. "An Observation System for the Analysis of Classroom
InstrUction." In E. J. Amidon and J. B. Hough (Lis.),
Interaqtl.on ARE...421v Theory , Research and laulication,
mans. *Ai8012-4e14eY, 1967, 77--3147-
19. Hough, J., and E. Amtdpn, "Behavioral Change in Student Teachers."
In E. J.:Amidon ind J. :B.Hc, Eds.), Interaction AILalysia:
_The ,, Research and Application, Maes.: Addison-Wesley,
51
56

20. Kirk, J. "Elementary School Student Teachers and TnteractionAnalys." In E. J. Amidon and J. B. Hough (Eds.),Interactior Analysis: Theory, Research and Application.Reading, Mas.: Addison-Wesley, 1967, 299-306.
21. Kwint, L. .Cogeny of Motility of the Face." Child ay21227ment, 5, .-12.
22. Lohman, E. E., R. Ouer and J. B. Hough. "A Study of the Effectof Pre-Service Train-ng in Interaction Analysis on theVerbal Behavior of Stud,i'm Teachers." In E. J. Amidon andJ. B. Hough (Eds.), Interaction P.lalysis: Theory, Researchand Application. Reading, Mass.: Addison-Wesley, yg-6777---
747-359.
23. McAulay, J. D. "How Mach Influence has a Co-op Teacher?"In E. Wandt (Eds.), A Cross ion-S.ect of. Educational. Research.
New York: David Mckay,-57965, 2d"3-207.
214. McDougall, W. An Introduction. Are focial Lu.21.10]__ London:
Methven, 1908.
25. Medley, D. M. and H. E. Mitzel. "Measuring Classroom Behaviorby Systematic Obbervation. an N. Gage (ed.), Handbook ofResearch on Telaslam. Chicago: Rand McNally, 1574:3777-328.
26. Meux, M., and B. O. Smith. "Logical Dimensions of TeachingBehavior," In B. j. Biddle and W. J. Ellena (Eds.), Con--Lemma Research on Teacher Effectiveness. New York:
Holt, Rinehart and Winston, 1g4-7-129.
27. Miller, N., and J. Dollard. Social Learnin and Imitation. New
Haven: Yale Unilersity Press, 19 1.
28. Morgan, C. L. Habit and Instinct. London: Arnold, 1896.
29. Moskowitz, G. "The Attitudes and Teaching Patterns of CooperatingTeachers and Student Teachers Trained in Interaction Analysis."In E. J. Amidon and J. B. Hough (Eds.), Interaction Analysis:
Theory, Research and Application. Reading, Mass.: Addison-Wesley, 1967, 271-282.
30. Mower, O. Learninfory.and the Symbolic Processes. New York:
John Wiley and Sons, 19W:
52
57
31. Pankratz, R. "Verbal Interaction Patterns in the Classrooms ofSelected Physics Teachers." In E. J. Amidon and J. B. Hough(Eds.), Interaction Analysis: Theor , Research and Application,Massachusetts: Addison-Wesley, 1967, 169-209.
32. Reichard, Gladys A. "Social Life." In F. Boas (Ed.), GeneralAnthrolpology, Boston: Heath, 1938, 409-486.
33. Schramm4 W., J. Lyle and E. Be. Parker. Television in the Livesof our Children. Stanford: Stanford University Press, 1717
34. Shirley, M. M. The First Two Years. Intellectual Development.
Volume 2. Minneapolis, University of Minnesota Press.
35. Slavson, S. R. Child Psychotherapy. New York: ColumbiaUniversity Press, 1952.
36. Stolurow, L. "Model the Master Teacher or Master the TeachingModel." Chapter in Learning and the Educational Process,Chicago: Rand-McNally, 1965.
37. Storlie, T. R. "Applications of Interaction Analysis to the In-Service Training of Teachers." In E. J. Amidon and J. B.Hough (Eds.), Interaction Analysis: Theory, Research and
ARELUIALls, Mass.: Addison-Wesley, 19 7, 262-270.
38. Tarde, G. The Laws of Imitation. New York: Holt, 1903.
39. Withall, J. "The Development of a Technique for the Measurementof Social-Emotional Climate in Classrooms." In E. J. Amidon
and J. B. Hough (Eds.)i Interaction Analysis: Theor , Research
and Application, Mass.: AddisonWesley, 1967, 47-64.
B. JOURNALS. ANDITERIODICALS
40. Amidon, E. J., and A. Simon. "Teacher-Pupilview 21:plucational. Research, 1965, (35),
41. Anderson, H. H. "Domination add Integrationof Young Children in an Mcperimental PlayPsycholo.gy Monograph, 1937, 19, 341-408.
42. Anderson, H. H. "The Measurement of Domination and of SociallyIntegrative Behavior in Teacherst Contacts with Children."Child Development, 1939, (10), 73-89.
Interaction." Re--130-139.
in the Social BehaviorSituation." Genetic
43. Bales, R. B. "A Set of Categories for the Analysis of SmallGroup Irtteraction." American Sociological Review, 1950,
(15), 257-263.
44. Bandura, A. "Influences of Models' Reinforcement Contingencieson the Acquisition of Imitative Responses." Journal of
Personality. and Social Psychology, 1965, Volume 1, 589-95.
45. Bandura, A., J. E. Grusec and F. L. Manlove. "Vicarious Extinction
of Avoidance Behavior." Journal of Personality and SocialPsychology, 1967, (5), 16-23.
46. Bandura, A. And A. Huston. "Identification as a Process of
Incidental Learning." Journal of Abnormal and Social Psychology,
1961, (63), 311-318.
47. Bandura, A., and W. Mischel. "Modification of Self-Imposed Delay
of Reward Through Mcposure to Live and Symbolic Models."Journal of Personality and Social Psychology, 1965, Z, 698-705.
48. Bandura, A., et%al. "Imitatiorrof Filmr:Mediated Aggressive Models."
Journal,,ofAbntirMalt:,aild Socia1lPsychblog1961, (63), 575-582.
49. Bandura, A.,,et al. .Transmission of Aggression Through Imitation
of Aggressive MOdals," Journal of Abnormal and Social Psycholoja,
1961,. 575582
50. Berry, C. S. "The Imitative Tendency of White Rats." :Journal of
Comparative NeUrology, 16, 333-361.
51. Binder, A., D. McConnell and N. Sojoholm. "Verbal Conditioning
as a Function of Experimenter Characteristics." Journal ofAbnormal and Social Psychology, 1957, (55), 315-321.
52. Brode, E. L. "The Supervisor as a Model in Teacher Classroom
Behavior." Reprint, from The High School eFournal, 1967, 1.
53. Burleigh, J. C. and H. W. Peterson. "Videotapes in Teacher
Education." The Elementaa School Journal, (68), 35-38.
54, Flanders, N. A. "Personal-Social Anxiety as a Factor in Experi-
mental Learning Situations." Journal of Educational Research,
45, 100-110, 1951.
55. Hayes.;,,K. J. and Catherine Hayes. "Imitation in a Home-Raised
Chimpanzee." Journal of Comparative Physiological Psychology,
1952, 45, 450.--4W;---

56. Jack, Lois M. "An Experimental Study nt Adolescent Behavior inPre-School Children." University of Iowa Studies in ChildWelfare, 1934, 9, 3-65.
57. Kellogg, W. N. and L. A. Kellogg. The Ape and The Child: A Studyof Environmental Influence Upon Early Behavior. New York:McGraw-Hill, 1933.
58. Kinnamon, A. J. "Mental Life of Two Macacus Rhesus Monkeys inCaptivity." American Journal of Psychology, 13, 98-148, 173-218.
59. Krumboltz, J. D., B. B. Varenhorst and C. E. Thoresen.Factors in the Effectiveness of Models in Counseling.of Counseling Psxchology, 1967, (14), 412-418.
60. Levy, D. M. "TrendS in Therapy: III Release Therapy."Journal of OrthopsYchiatry, 1939, 9, 713-737.,4
"Non-Vocal" Journal
American
61. Lewin, K., R. Lippitt and R. K. White. "Patterns of AggressiveBehavior in Experimentally Created 'Social Climates'."Journal of Social Eaciy_29i1.0z, 1939, (10), 271-299.
62. McBrearty, J. F., A. R. Marston and F. H. Kanfer. "Conditioninga verbel Operant in a Group Setting: Direct vs. VicariousReinforcement." American Ely_si2212.EaL, 1961, 16, 425 (Abstract
63. Mussen, P. H. and L. Distler. "Masculinity, Identificaiion andFather-Son Relationships." Journal of Abnormal and a9s.1.1
L10.22aPse, 1959, (59), 350..356.
64. Ober, R. L., S. Wook and A. Roberts. "AHStudy in the Developmentof a Reciprocal Category System for Assessing Teacher-StudentClassroom Verbal Interaction." American Educational ResearchAssociation PaperAbstracts, 196E7,-58=59.
65, Price, R. D. "The Influence of Supervising Teachez's." Journal ofTeacher Education, 1961, (12), 471-475.
66. Twelker, P. A. "Classroom Simulation and Teacher Preparation."School Review, Volume 75 Humiper Summer 1968 197-204.
67. Valentine, C. W. "The Psychology of Imitation with Special Refer-ence to Early Childhood." British Journal of EmpLakaeL, 21,
105-132.
68. Walters,. E. L. Thomas And C. W. Acker. "Enhancement ofPunitiVe:Behavior bY Audio-Visual Displays." SCience, 1962,(136);'18728.73

69. Warden, C. J. and T. A. Jackson. "Imitative Behavior in the
Rhesus Monkey." Journal of Genetic Psychology, 46, 103-125.
70. Withall, J. "The Development of a Technique for the Measurement
of Social-Emotional Climate in the Classrooms." Journal of
Experimental Education, 1949, (17), 347-361.
71. Yerkes, R. M. "Suggestibility in Chimpanzee." Journal of
Social Psycholosy, 5, 271-282.
C. GOVERNMENT PUBLICATIONS
72. Amidon, E. J., et al. "A Fresh Look at Supervision." Research
in Education. ERIC ED 011 878, United States Department ofHealth, Education and Welfare, 1967.
73. Baird, J. H., et al. Micro-teachinK at prigham Young University.ERIC ED 011 260, United States Department of Health, Education
and Welfare, 1967.
74. Carleton College. Carleton College Use of 'rideo Tapes in Training
Secondary School Teachers. ERIC ED 0l11L, AssociatedCollege of the MidVest Pilot Project. United States Depart-
ment of Health, Education and Welfare, 1966.
75. Flanders, N. A. Teacher Influence, Pupil Attitudes, arid Achieve-
ment. United States Department of He41th, Educatf;randWeUare, Office of Education. Cooperat:ve Research Monograph
No. 12, 1965.
76. Hough, J. B. and R. Ober, The Effect of T _ning in Interaction
Analysis on the Verbal Teaching. Behavi( of Pre-ServiceTeachers.--ERIC ED 011 252, United Ste- 2s Department of Health,
Education and Welfare, 1966.
77. Taba, H., et al. Thinking in Elementary ,,chool Children. United
States Department of Health, Education, and Welfare, Office (If
Education. Cooperative Research Project No. 1574. San Fran-
cisco; San Francisco State College, 1964.
. UNPUBLISHED PAPERS AND DISSERTATIONS
78, Allen, D., Et al. "A Comparison of Different Modeling Proceduresin the Acquisition of a Teaching Paper presented atthe meeting of the American Educational Research Association,
Chicago, Illinois, 1967.
79. Carline, J. L., "An Investigation of the Relationships BetweenVarious Verbal Strategies of Teaching Behavior and Achieve-
ment of Elementary School Childre." Unpublished DoctoralDissertation, Syracuse University, Syracuse, 1969.
80. Flanders, N. A. "Teacher Influences, Pupil Attitudes, andAchievement. Ann Arbor: The University of Michigan, 1962.
(Mimeographed)
81. Furst, Norma. "The,Effects of Training in Interaction Analysison the Behavior of Student Teachers in Secondary Schools."Paper read at the annual meeting of the American EducationalRasearch Association, Chicago, Illinois, 1965.
82. Furst, Norma and E. Amidon. "Teacher-Pupil Interaction Patternsin the Elementary School " Paper read at Schoolmen's Week,University of Pennsylvania, October, 1962.
83. Manny, R. "Phenotypic and Genotypic Change in the Verbal Behavior
of Student Teachers - Theory and Implications." Paper read
at the annual meeting of the American Educational ResearchAssociation, New York February, 1967.
84. Hough, J. B., and R. Ober. "The Effects of Training in Inter-action Analysis on the Verbal Behavior of Pre-Service Teachers."Paper read at the annual meeting of the American EducationalResearch Association, Chicago, Illinois, 1966.
85. Kirk, J. "Effects of Learning the Minnesota System of Interaction
Analysis by Student Teachers of InterMediate Grades." Un-
published doctoral dissertation Temple University, Philadelphia,
1963.
86. Lange, D. N. "The Effect of Video Taped Modeling Techniques in
Eliciting Imitative Responses in a Group of Student Teachers
Using Flanders Interaction Analysis as a Criterion." Un-
published doctoral dissertation, University of New Mexico,
Albuquerque, 1968.
87. McDonald', F. J., D. W. Allen and E. Seidman. "Televised Models
for teacher Training." Stanford University School of
Educa:Oion no date. (Mimeographed),
88. Orme, E. "The Effects of Modeling and Feedback Variables on the
Acquisition of a Complex Teaching Strategy." Unpublisheddoctoral dissertation, Stanford University, Stanford, 1966.
89. Voth, John A. "Effect of Video Tape Recording Feedback onTeaching Behavior of Student Teachers." Study conducted at
the University of Missouri, Winter, 1962. (Reprint from
author in abstract)
90. Young, D. "The Effectiveness of SelfInstruction in Teacher
Education Using Modeling." Paper presented at the meetinn;
of the American Educational Research Association, Chicagc,
Illinois, 1968.
91. Zahn, R. "The Use of Interaction Analysis in Supervising Student
Teachers." Unpublished doctoral dissertation, Temple University,
Philadelphia, 1965.
D. OTHER
92. Hosford, P. "Video Tape Useful in Classroom." The Teacher News.
Albuquerque, 1968,
APPENDIX A
Flanders Interaction Analysis System
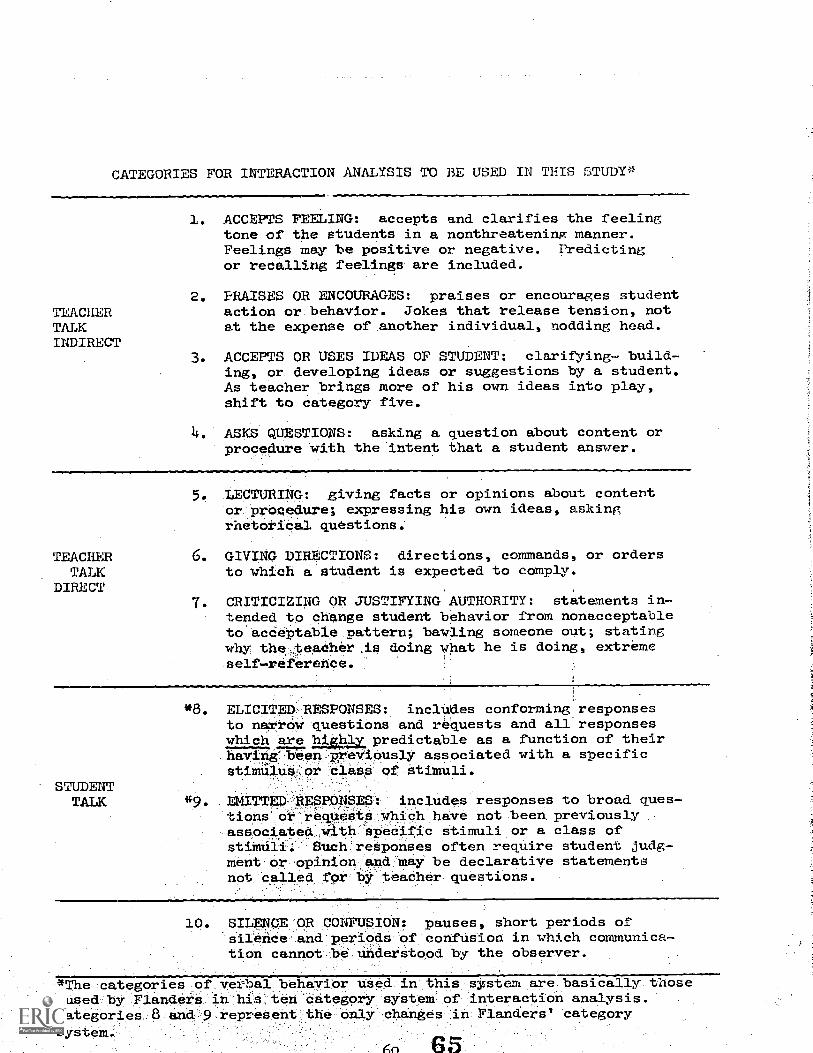
CATEGORIES FOR INTERACTION ANALYSIS TO BE USED IN THIS STUDY*
I. ACCEPTS FEELING: accepts and clarifies the feelingtone of the students in a nonthreatening manner.Feelings may be positive or negative. Predictingor recalling feelings are included.
2. PRAISES OR ENCOURAGES: praises or encourages studentTEACHER action or behavior. Jokes that release tension, notTALK at the expense of another individual, nodding head.INDIRECT
3. ACCEPTS OR USES IDEAS OF STUDENT: clarifying- build-ing, or developing ideas or suggestions by a student.As teacher brings more of his own ideas into play,shift to category five.
4. ASKS QUESTIONS: asking a question about content orprocedure'with the 'intent that a student answer.
5. LECTURING: giving facts or opinions about contentor procedure; expressing his own ideas, askingrhetorical questions.
TEACHER 6. GIVING DIRECTIONS: directions, commands, or ordersTALK to which a'student is expected to comply.
DIRECT7. CRITICIZING OR JUSTIFYING AUTHORITY: statements in-
tended to change student behavior from nonacceptableto aceeptablel6attern; bawling someone out; statingwhy the:,teaeher,is doing what he is doing, extremeself-referetee.
. ELICITED RESPONSES: includes conforming responsesto narrOw questions and requests and all'responseswhich are plaaLpredictable as a function of theirhavinelreen previously associated with a specificstimilus or class of stimuli.
STUDENTTALK . EMITTED RESPONSES: includes responses to broad ques-
tions or requests which have not been previouslyassociated With specific stimuli or a class ofstimuli: Such responses often require student judg-ment or opinion and may be declarative statementsnot called for by teacher questions.
10. SILENCE OR CONFUSION: pauses, short periods ofsilence and periods of confusion in which communica-tion cannot t)e, understood by the observer.
*The categories of verbal behavior used in this system are basically thoseused by Flanders in his ten category system of interaction analysis.Categories 8 and 9 represent the only changes in Flanders' categorysystem.,
4n 65
APPENDIX B
Modeling Concepts of a Modified
Flanders System of Interaction Analysis
MODELING CONCEPTS OF A MODIFIED
FLANDERS.SYSTEM OF INTERACTION ANALYSIS
by Russell Fitzgerald

TAPING PROCEDURE
1. Camera on.Introduction of the category, Dr. Murray.
2. Camera off.Switch to introduction of the modeling concept.
Camera on.Introduction of the modeling concept of the category.
4 Camera off.Arrange scene setting for modeling concept.
5. Camera on.Film the modeling concept via video tape recorder.
6. Camera off.Arrange scene setting for next modeling concept.
7. Camera on.Fim the modeling concept.
NOTE: Follow stepA 1, a., 3, .1.L 5, 6, and 7 until all ten Flanders
categorieaare video tgped.

CATEGORY I (Accepts Feeling)
Situation A: This is an eleventh grade geometry class. A student (boy)
is very disturbed by an extremely difficult (or so he feels)
problem which he is working at his seat. Then he ex-
presses himself.
Sttident: "I like geometry, but I have to spend so much time on it.
I wish I could catch on to it as easy as I do American
History."
Teacher: "Sometimes we have to spend much time on some subject and
relatively little time on others. You probably have certain
subjects you find rather easy."
Pituation B: A senior sociblogy class is in session. The chairman of
I
a group for the iSrpose of:discUbsing the value system of
Americans is diSturbed.
Student: ."t can't seem to think today."
"Of coUrse,You ca4't. After losing a close game like that
one last night, Ild-be uneasTtOo."
Teacher:
Situation C:
Teacher:
Sophomore world'histOry class is in session in this eX-
01ple., It is_a very warm day and_theteaCher begins this
:Ftwl
"I know all of us are very Warm and you may find it hard
-tO-thirdt. I would like to be outside today, also."
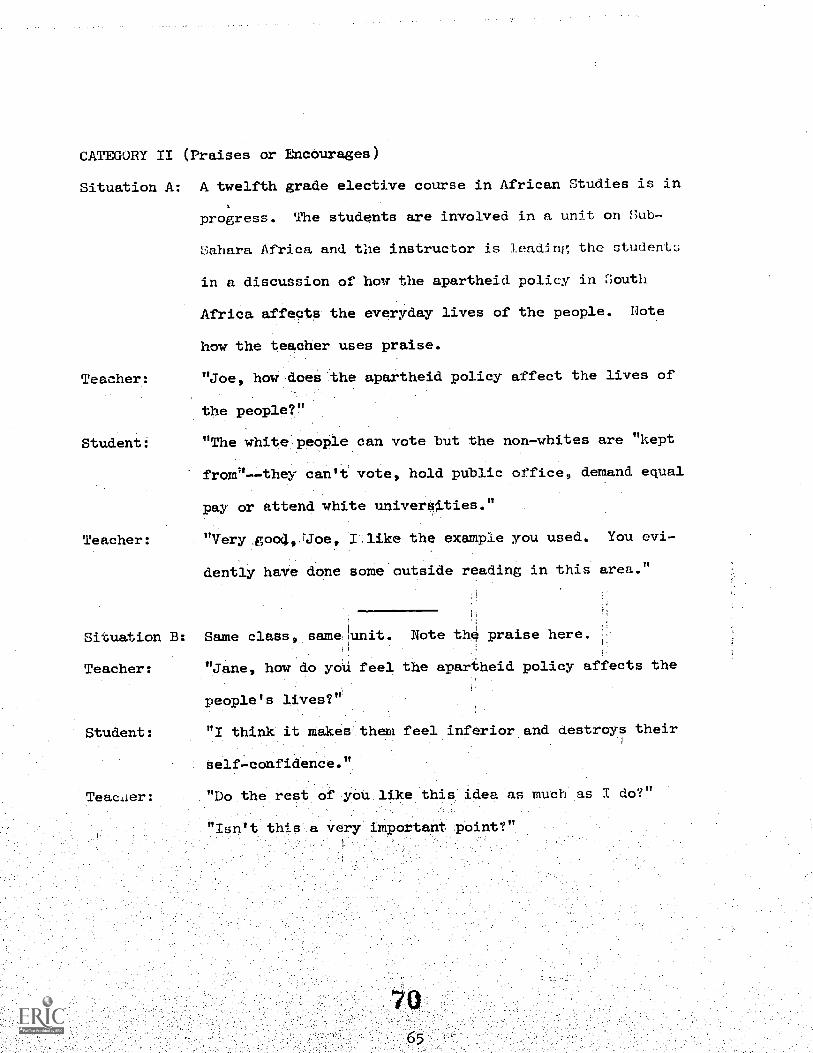
CATEGORY II (Praises or Encourages)
Situation A: A twelfth grade elective course in African Studies is in
progress. The students are involved in a unit on sub-
Teacher:
Student:
Teacher:
Sahara Africa and the instructor is leading the students
in a discussion of how the apartheid policy in Mputh
Africa affects the everyday lives of the people. Note
how the teacher uses praise.
"Joe, haw does the apartheid policy affect the lives of
the people?"
"The white people can vote but the non-whites are "kept
from"--they can't vote, hold public office, demand equal
pay or attend white universIties."
"Very gooa,jJoe, I.like the example you used. You evi-
dently have done some outside reading in this area."
Situation B: Same class, same lunit. Note the praise here.
Teacher:
Student:
Teac.Lier:
"Jane, how do you feel the apartheid policy affects the
people's lives?"
"I think it makes them feel inferior and destroys their
self-confidence."
"Do the rest of you like this idea as much as I do?"

(Category II - Cont'd)
Situation C: Same class, same unit. Here the teacher encourages.
Teacher: "Bill, you've had your hand up a lot. How do you think
the apartheid policy affects the lives of the South
Africans?"
Student: "Well, economically, all the money ends up in one group
of people's hands and ---
Teacher: "Go on.... n
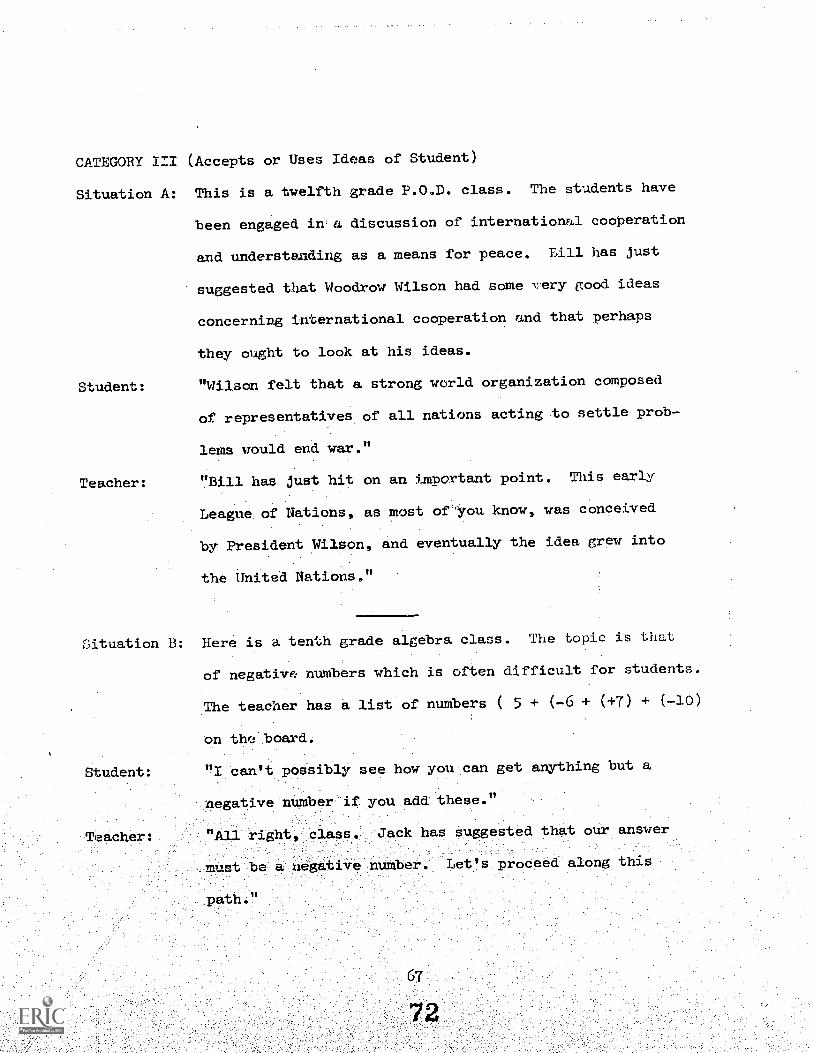
CATEGORY III (Accepts or Uses Ideas of Student)
Situation A: This is a twelfth grade P.O.D. class. The students have
been engaged in a discussion of international cooperation
and understanding as a means for peace. Lill has just
suggested that Woodrow Wilson had some 1;ery good ideas
concerning international cooperation and that perhaps
they ought to look at his ideas.
Student: "Wilson felt that a strong world organization composed
of representatives of all nations acting to settle prob-
lems would end war."
Teacher: "Bill has just hit on an important point. This early
League of Nations, as most of 'you know, was conceived
by President Wilson, and eventually the idea grew into
the United Nations."
Situation 13: Here is a tenth grade algebra class. The topic is that
of negative numbers which is often difficult for students.
The teacher has a list of numbers ( 5 (-6 (+7) 4- (-10)
on the board.
Student: "I can t possibly see how you can get anything but a
negative number if you add these."
Zackhas suggested that our answer
.must be a negative number. Let's proceed along this
path.'

CATEGORY IV (Asks Questions)
Situation A: A tenth grade world history class is engaged in a unit
on Greek civilization. The teacher is questioning the
two main city-states of Sparta and Athens.
Teachr: "From a political standpoint, how would you compare
Sparta and Athens? Ru
Student: "Sparta vas an oligarchy and Athens was a democracy."
Situation B: An eleventh grade American history class is discussing the
invasion of Britain by Hitler in World War II. The teacher
speaks:
Teacher: "Class, why do you think Hitler did not invade Britain by
sea immediately after the conquest of France?" Jim--"
Student: "Well, I think he!thoughtthe Luftwaffe could handle the
but they di4n't."
Situation C: A tenth grade English class hasljust finishe0 a unit on
Shakespeare. The students are ieady to go on to a unit,
The teacher decides to give thera a choice as to which they
want to do next fran'the next four units, and opens the
class in this way:
"What topic would you like to start on next, class?"
(Silence)"Judy."
Teacher:
Teacher:
Student: "I think Medieval Literatur^ would be interesting."
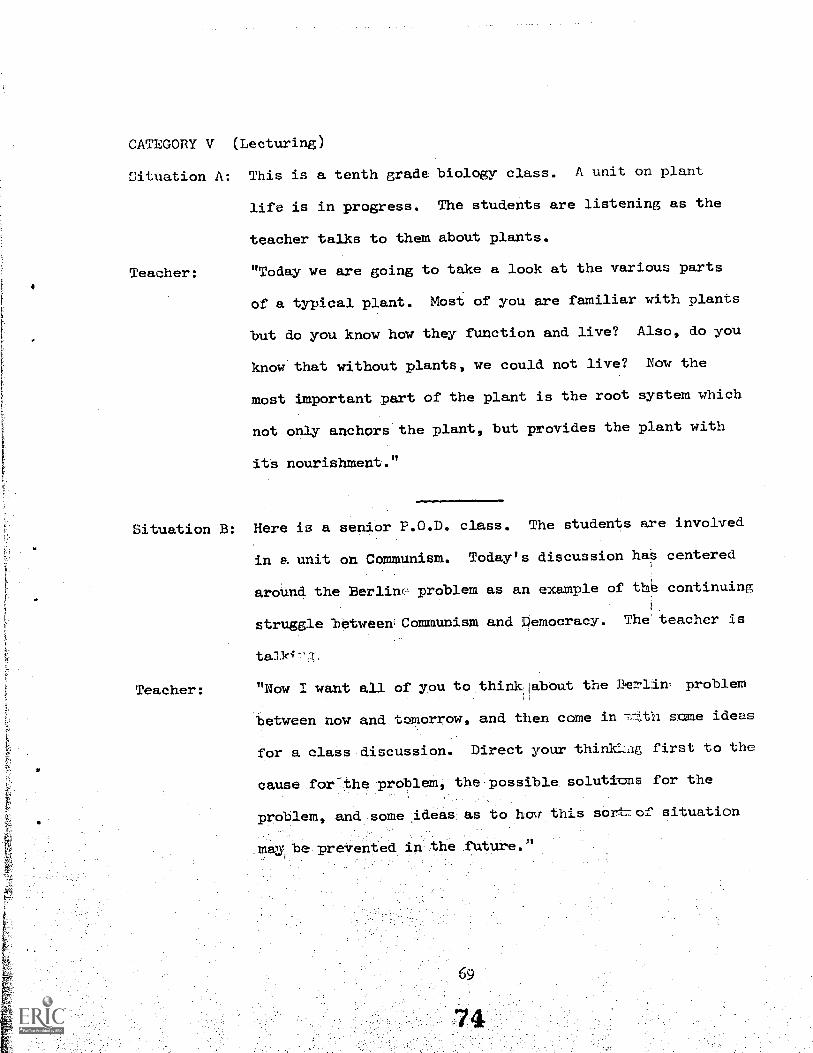
CATEGORY V (Lecturing)
Situation A: This is a tenth grade biology class. A unit on plant
life is in progress. The students are listening as the
teacher talks to them about plants.
"Today we are going to take a look at the various parts
of a typical plant. Most of you are familiar with plants
but do you know how they function and live? Also, do you
know that without plants, we could not live? Row the
most important part of the plant is the root system which
not only anchors the plant, but provides the plant with
its nourishment."
Teacher:
Situation B: Here is a senior P.O.D. class. The students are involved
in a unit on Communism. Today's discussion has centered
aroUnd the Berlim, problem as an example of the continuing
struggle "between; Communism and Democracy. The teacher is
talk;-1,
Teacher: "Now I want all of you to thinklabout the Bez-lin problem
between now and tomorrow, and then come in 77j.th same ideas
for a class discussion. Direct your thinkLlg first to the
cause for7the problem, the possible solutions for the
,problem and some ideas as to ho'.r this sorttof situation
Mag be preVented ln the luture."
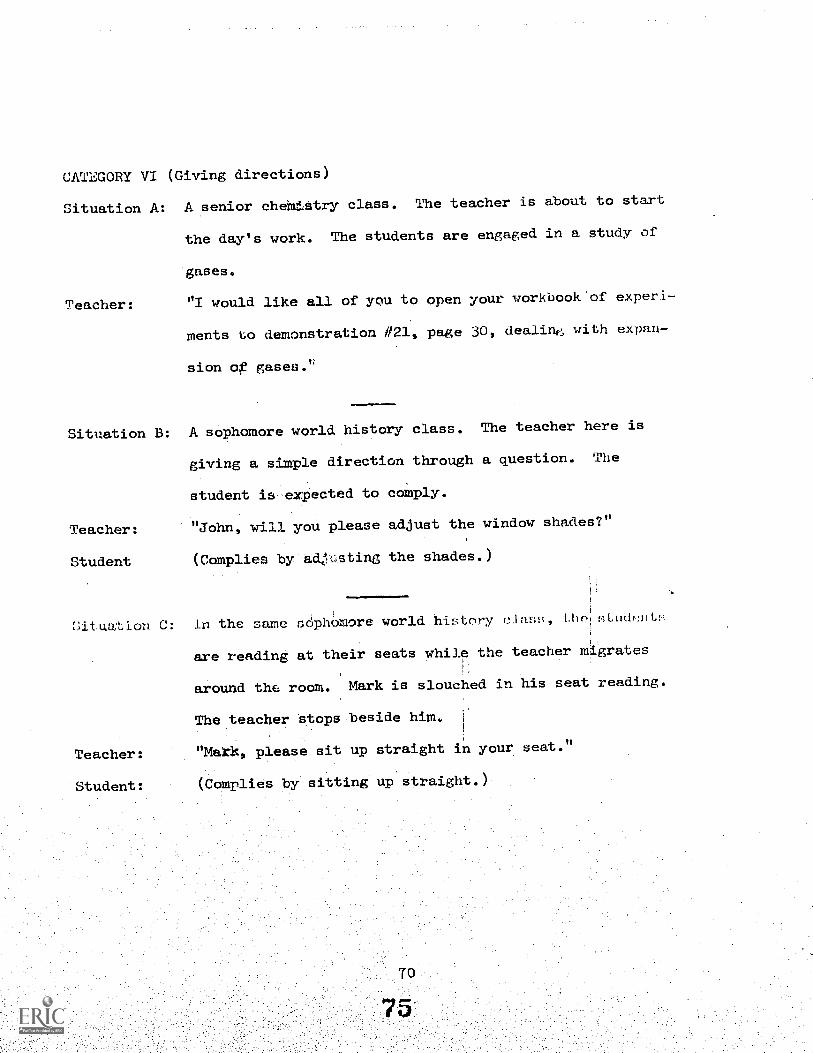
CATEGORY VI (Giving directions)
Situation A: A senior chebdstry class. The teacher is about to start
the day's work. The students are engaged in a study of
gases.
Teacher: "I would like all of you to open your workbook.of experi-
ments to demonstration 1/21, page 30, dealing; with expan-
sion of gases.h
Situation B: A sophomore world history class. The teacher here is
giving a simple direction through a question. The
student is expected to comply.
Teacher: "John, will you please adjust the window shades?"
Student (Complies by adj:sting the shades.)
[.;ituation C: In the same sdphC)more world history QA;u1!;, 1.11(,!fiLudfnitA;
are reading at their seats while the teacher migrates
around the room. Mark is slouched in his seat reading.
The teacher stops beside him.
Teacher: "Mark, please sit up straight in your seat."
Student: (Complies by sitting up straight.)
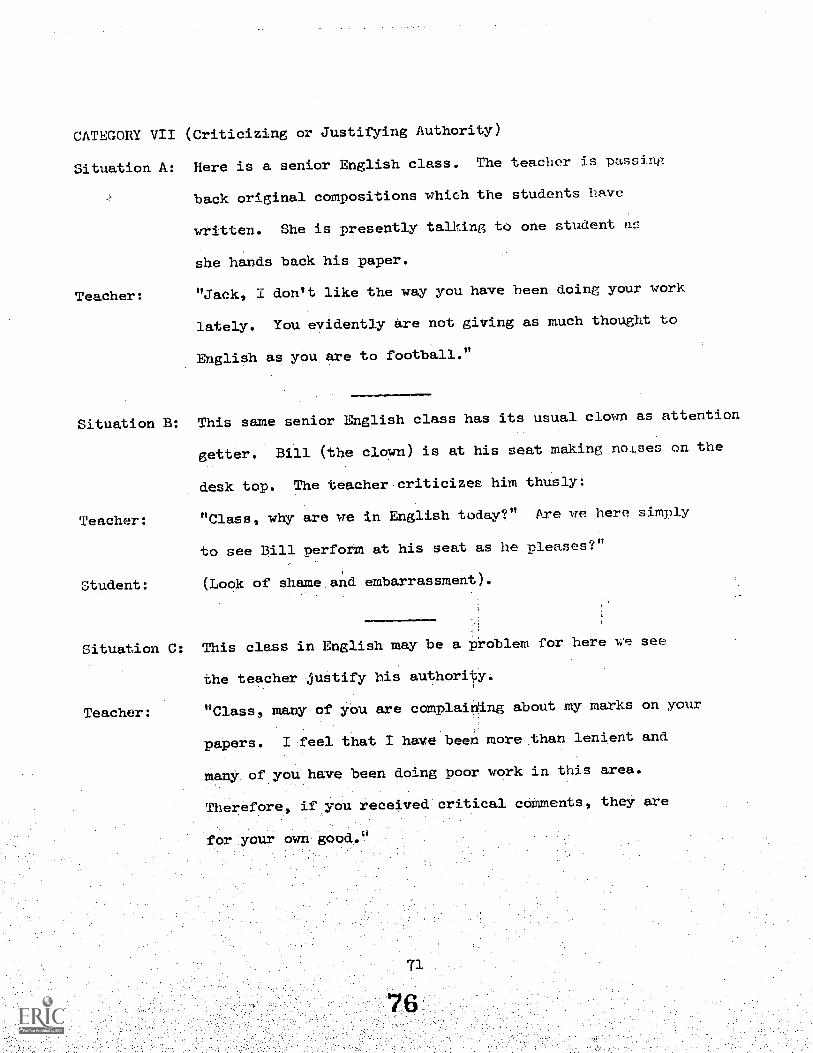
CATEGORY VII (Criticizing or Justifying Authority)
Situation A: Here is a senior English class. The teacher is passing
back original compositions which the students have
written. She is presently talking to one student as
she hands back his paper.
Teacher: "Jack, I don't like the way you have been doing your work
lately. You evidently are not giving as much thought to
English as you are to football."
Situation B: This same senior English class has its usual clown as attention
getter. Bill (the clown) is at his seat making noises on the
desk top. The teacher criticizes him thusly:
Teacher: "Class, why are we in English today?" Are we here simply
to see Bill perform at his seat as he pleases?"
Student: (Look of shame.and embarrassment).
Situation C: This class in English may be a problem for here ue see
zhe teacher justify his authority.
Teacher: "Class, many of you are complaining about my marks on your
papers. I feel that I have been more than lenient and
many of you have been doing poor work in this area.
Therefore, if you received critical comments, they are
own good.°
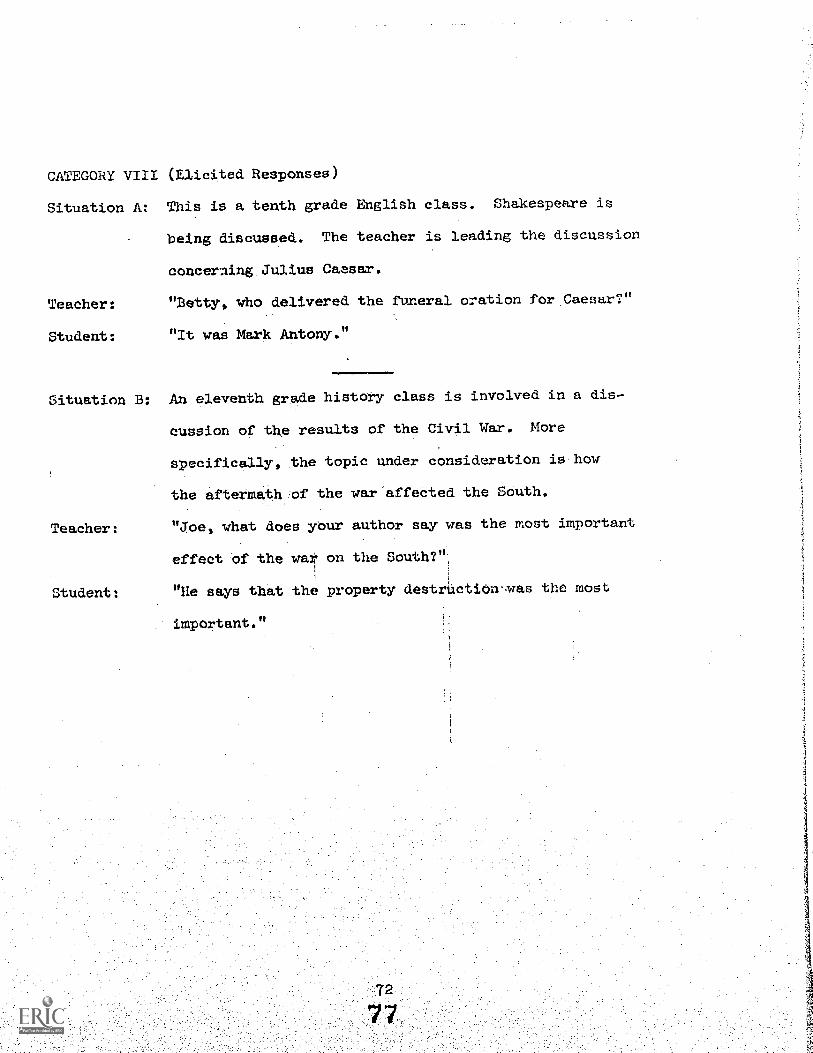
CATEGORY VIII (Elicited Responses)
Situation A: This is a tenth grade English class. Shakespeare is
being discussed. The teacher is leading the discussion
concerning Julius Caesar.
Teacher: "Betty, who delivered the fUneral oration for Caesar?"
Student: "It was Mark AntonY."
Situation B: An eleventh grade history class is involved in a dis-
cussion of the results of the Civil War. More
specifically the topic under consideration is how
the aftermath of the war affected the South.
Teacher: "Joe, what does your author say was the most important
effect of the war on the South?"
Student: "He says that the property destruction.was the most
important."
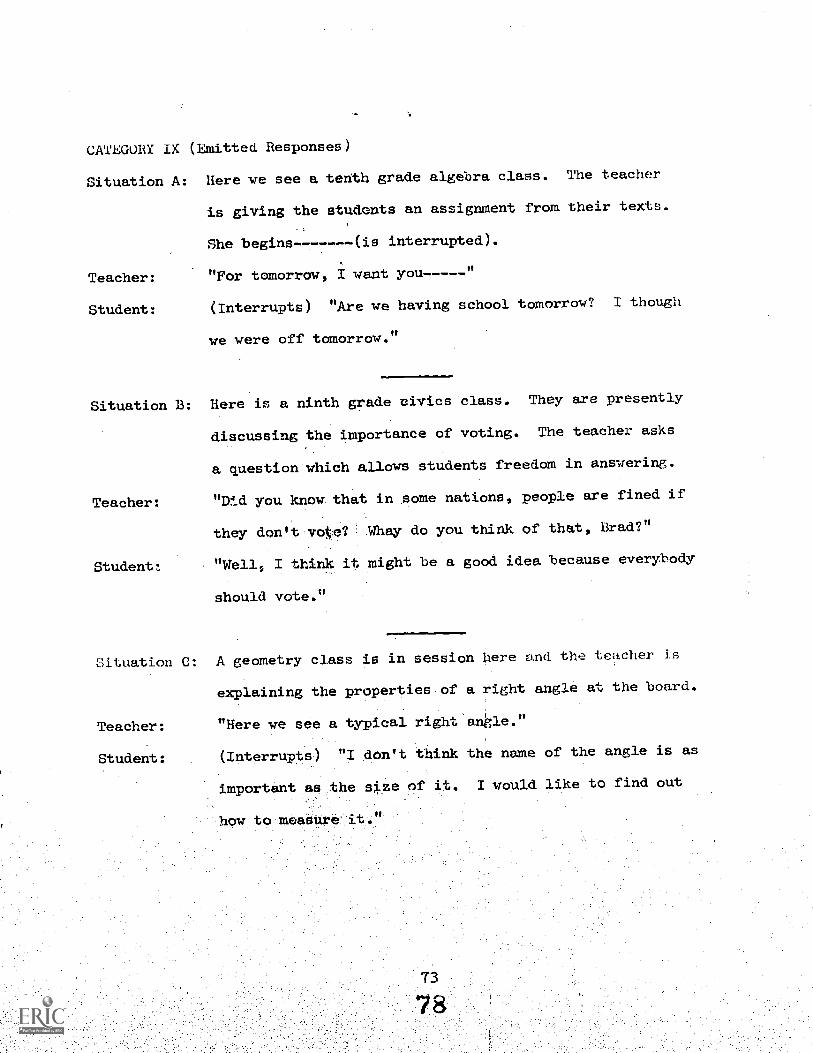
CATEGORY IX (Emitted Responses)
Situation A: Here we see a tenth grade algebra class. The teacher
is giving the students an assignment from their texts.
She begins (is interrupted).
Teacher: "For tomorrow, I want you
Student: (Interrupts) "Are we having school tomorrow? I though
we were off tomorrow."
Situation B: Here is a ninth grade civics class. They are presently
discussing the importance of voting. The teacher asks
a question which allows students freedom in answering.
Teacher: "Did you know that in some nations, people are fined if
they don't vote? Whay do you think of that, Brad?"
Student: "Wells I think it might be a good idea because everybody
should vote."
Situation C: A geometry class is in session here and the teacher is
Teacher:
Student:
explaining the properties of a right angle at the board.
"Here we see a typical right ankle."
(Interrupts) "I don't think the name of the angle is as
important as the size of it. I would like to find out
how to measure'it."
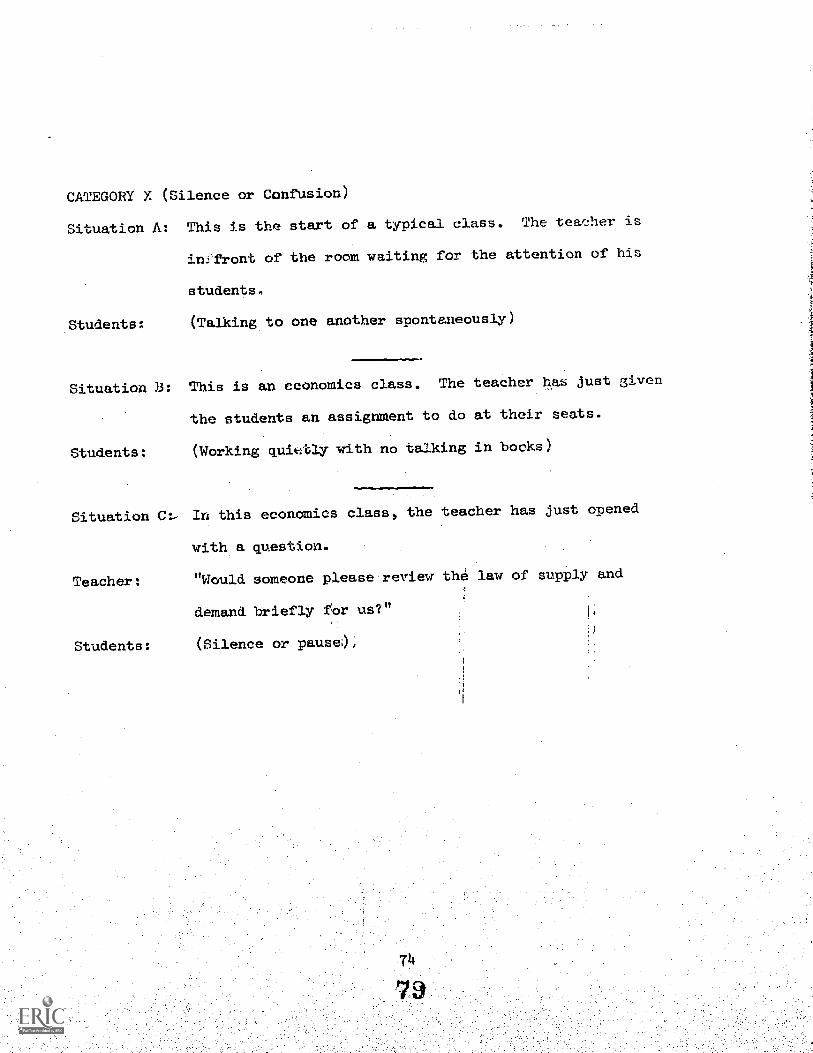
CATEGORY X (Silence or Confusion)
Situation A: This is the start of a typical class. The tear.ther is
in;front of the room waiting for the attention of his
students.
Students: (Talking to one another spontaneously)
Situation 33: This is an economics class. The teacher has just given
the students an assignment to do at their seats.
Students: (Working quit-;tly with no talking in books)
Situation In this economics class, the teacher has just opened
with a question.
Teacher: "Would someone please review the law of supply and
demand briefly eor us?"
Students: (Silence or pause);
!.Rp1labi1ity Checks
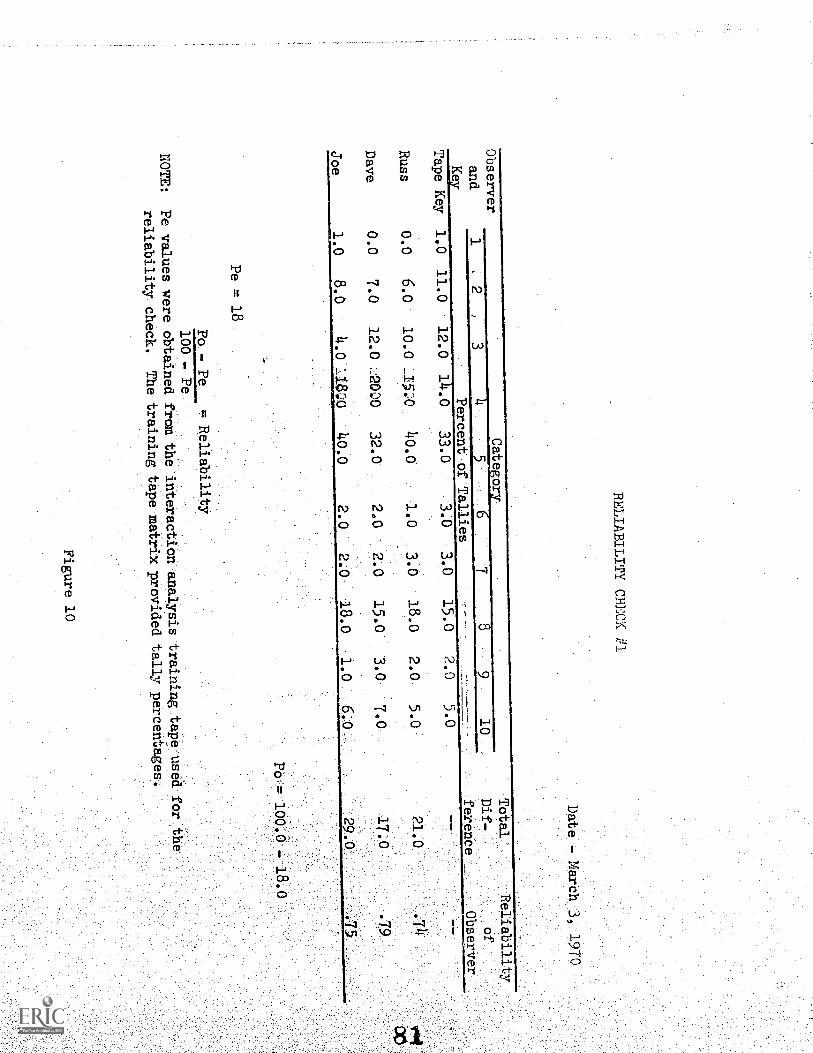
RELIABILITY CHECK #1
Date -larCh 3
Observer
and
Key
Tape Key
Russ
Dave
Joe
5
Percent of Tallies
Total
Reliability
Dif-
of
ference
Observer
1.0
11.0
12.0
14.0
33.0
3.0
3.0
15.0
0.0
6.0
10.0 _15.0
40.0
1.0
3.0
18.0
0.0
7.0
12.0
20'.)0
32.0
2.0
2.0
15.0
1.0
8.0
4.0
LIZ
:040.0
2.0
2.0.
18.0-
.
Pe = 18
Po - Pe
100 , Pe
= Reliability
2.0
5.0
2.0
5.0
3.0
7.0
140
64:
= 1009
ROTE:
Pe values were obtained fromthe interaction analysis training tapeused for the
reliability, check.
The training tape matrix providedtally percentages.
Figure 10

RELIABILITY CHECK #2
Observer
and
Key
Tape Key
Russ
Dave
Joe
12
34
0.0
4.0
3.0
5.0
,
0.0
4.o
4 o
4.o
0.0
2.0
5.0
7.0
0.0
2.0
3.0
8.0
Pe = 16
Category
56
78
910
Percent of Tallies
20.0
29.0
4.0
3.0
11.0
21.0
24.o
26.0
3.0
4.o-_
10.0
21.0
18.0
29.0
2.0
6.0
10.0
21.0
25.0
26.0
2.0
3.0
10.0
21.0
Po - Pe
= Reliability
100 - Pe
Total
Dif-
ference
--
Reliability
-of
Observer
NOTE:
Pe values were obtained from the interaction analysis
training tape used for the
reliability check.
The training tape matrix provided tally percentages.
Figure 11

RELIABILITY CHECK #3
Observer
and
Ke
34
Category
56
..
78
91
2Percent of Tallies
Tape Key
0.0
2.0
17,f,'2M
110
0,p
1.0
23.0
0.0
Russ
0.0
2.0
16.0
2.0
29.0
0.0
1.0
25.0
0.0
Dave
0.0
2.0
15.0
24.0
34.6
0 0
0.0
25.0
070
joe
0.0
2.
19.0
18.0
33.0
0.0
1.0
25.0
0.0
Pe = 20
Po - Pe
= Reliability
100 - Pe
10
2.0
2.0
2.0
NOTE:
Pe values were obtained fromthe interaction analysis training tapeused for the
reliability check.
The training tape matrix provided tallypercentages.
Figure 12