Embed Size (px)
Citation preview
1
Does Economic Growth Improve Child Health? Understanding Discordant Trends in Malnutrition Indicators during the Economic Growth in Ghana
Jemima A. Frimpong Health Care Systems Department The Wharton School University of Pennsylvania 3641 Locust Walk, Rm G7 Philadelphia, PA 19104 Tel: 215-417-8230 E-mail: [email protected] Roland Pongou Department of Economics Population Studies and Training Center Brown University Robinson Hall 64 Waterman Street Providence, RI 02912 Tel: 402-863-6186 E-mail: [email protected]
2
Does Economic Growth Improve Child Health? Understanding Discordant Trends in Malnutrition Indicators during the Economic Growth in Ghana
Abstract
Policymakers have long argued that economic growth in developing countries will positively impact child health. We examine child nutrition in Ghana during the economic growth of the 1980s and 1990s. Data show that stunting declined from 30% in 1988 to 21% in 1998, but sharply increased to 27% in 2003. Wasting followed an entire opposite path, while underweight progressively fell from 30% to 24% during this period. These different responses to growth reflect differences in the underlying factors generating these outcomes. Improvement in underweight was consistent with the positive household effects of macroeconomic growth, but increase in stunting after 1998 responded to the decline in health care utilization following the reform of the health care system. The fraction of children presenting any the three forms of malnutrition remained stable at around 40% during the period of growth, indicating that macro-level economic growth does not necessary translate into better child health.
3
Introduction Following the severe economic reversals experienced by many African countries in the 1980s
and 1990s (Easterly and Levine, 1997), a major public policy goal has been to promote growth
with the intent of restoring macroeconomic stability and improving social and individual well-
being. At the country level, higher income has been found to be associated with better child
health by most measures (Haddad et al., 2003; Behrman and Rosenzweig, 2004; Smith and
Haddad, 2002; Prichett and Summers, 1996), leading to the conclusion that economic growth
will improve health status (Smith and Haddad, 2002; Prichett and Summers, 1996). However, the
mechanism linking macro level economic improvement to child health has not been fully
explored, especially at the household level. Researchers have emphasized the role of increases in
household income and investment in public infrastructure (Smith and Haddad, 2002), but several
other socioeconomic and demographic effects of growth that may positively or negatively affect
health have received little attention. In this paper, we study the determinants of child nutritional
status in Ghana during a period of economic growth. Using the three classical measures of
malnutrition (stunting, wasting and underweight), we also examine the extent to which trends in
these outcomes were driven by changes over time in the distributions of their determinants,
affected by growth.
There are several reasons for focusing on child nutrition as an indicator of health. Maternal and
childhood undernutrition is currently the single leading cause of the global burden of disease
(Lopez et al., 2006; Ezzati et al., 2002). Childhood malnutrition also has been identified as the
underlying factor in more than 50% of deaths of children under 5 years of age in developing
countries (Black et al 2003), and still constitutes a major public health crisis in these settings (de
4
Onis et al., 2000; de Onis et al., 2004). At the national and sub-national levels, higher child
mortality rates have been found to be associated with low weight-for-age (Pelletier and
Frongillo, 2003). The consequences of malnutrition span beyond compromise in physical health,
and have been found to be associated with instability in mental health, internalization of
behavioral problems, delays in primary school enrollments, and lower educational attainment
(Glewwe and Jacoby, 1993; Weinreb et al., 2002; Chang et al., 2002). The commitment of the
international community to reducing childhood malnutrition and mortality has been recently
renewed through the Millennium Development Goals, but achieving this goal requires further
studies on how nutritional status responds to changing economic contexts, which has been the
case in many developing countries experiencing high burden of malnutrition.
In developing countries, studies on the impact of macro level economic changes on child health
have mainly focused on the effects of economic downturns (see Paxson and Schady, 2005 on
Peru; Hill et al., 1993 on sub-Sahara Africa; Pongou et al., 2006 on Cameroon). Little attention
has been paid to the health effects of economic recovery or upturns, especially using household
level data. Haddad et al. (2003) separately analyzed household and country level data, and others
have used only country level data (Smith and Haddad, 2002, Pritchett and Summers, 1996), but
none have tracked changes in child health during a period of sustained growth in any of the
countries included in their analysis. Edmonds (2004) uses multiple household surveys conducted
during the economic growth of the 1990s in Vietnam, and finds that improvement in household
income during this period positively impacted child linear growth. Despite the importance of this
study to our work, it should be noted that it did not examine the role of other effects of growth,
such as child and household demographics. Also, comparable studies are scanty in Africa. This
5
gap in the literature could be understood in the context of paucity of household level data during
the period of growth that characterized many countries after independence. Most data have been
collected only in the late 1970s and 1980s when most economies were experiencing severe
declines. After a profound economic crisis, Ghana experienced a sustained increase in per capita
GDP after 1983 (see Figure 1), setting it apart from the experience of many countries in the
region. In this study, we use the Ghana Demographic and Health Surveys (DHS) collected in this
country in the year 1988, 1993, 1998 and 2003 to examine the determinants of child nutrition (as
measured by stunting, wasting and underweight), and the extent to which changes over time in
the distributions of these factors impacted these outcomes.
Data show that the prevalence of stunting declined from 30% in 1988 to 21% in 1998, but
sharply increased to 27% in 2003. Wasting followed an opposite path, increasing from 8% in
1988 to 13% in 1998, and then declining to 10% in 2003. Underweight progressively declined
from 30% to 24% during this period. These different responses to growth reflect differences in
the underlying factors generating these outcomes as evidenced by our sub-region fixed-effects
estimates. Factors such as child gender, male household headship, and age of household head
significantly impact stunting, while their effects on both wasting and underweight are not
significant. Birth order, maternal age at childbirth, marital status, and mother’s height are
common factors to both stunting and underweight. Finally, preceding birth interval, prolonged
breastfeeding, birth size, mother’s weight, household economic status, and health care utilization
are correlated with the three outcomes, although with differing magnitude. While trends in
stunting and underweight are consistent with the positive effects of economic growth on
household socioeconomic conditions and other demographic factors such as birth interval, birth
6
order and maternal age at childbirth, increase in stunting after 1998 is associated with prolonged
breastfeeding and decline in health care utilization following the reform of the health care
system. Our study illustrates that macro-level economic growth that may lead to improvement in
household economics may not necessary translate into better child health.
Background on the determinants of childhood malnutrition
Determinants of child health and nutrition have been a subject of considerable scholarship. The
analytical framework proposed by Mosley and Chen (1984) hypothesizes that these determinants
occur at multiple levels, ranging from individual to community characteristics, as also confirmed
by a number of empirical studies (Behrman, 1988; Behrman and Wolfe, 1984, 1987; Thomas and
Strauss, 1992; Lavy et al., 1996; Lee et al., 1997; Pongou et al., 2006; Choudhury and Bhuiya,
1993). In what follows, we assess the potential role of child, parental and household
characteristics in determining child nutritional status in a context of economic growth.
Child Characteristics
Many child factors resulting from parental choice or not have significant effects on health.
Studies have shown that biological factors such as gender and age are associated with nutritional
status (Haddad et al., 2003; Pongou et al., 2006). It is generally argued that girls have a stronger
immunity system in early ages, resulting in relatively better health status as compared to boys.
However, Mozumder et al. (2000) found that being a female child is associated with
malnutrition, motivating further research on the relationship between gender and health. In
developing countries, the role of child age in determining nutritional status is also well
documented (Pongou et al., 2006). As children age, demand for quality supplementation and
7
contact with the external environment increases; generally resulting in lower nutritional status in
older children. In many studies however, the effect of age remains significant even after
controlling for household and environmental factors, suggesting that some biological
unobservable might work against children’s health as they grow older.
Birth weight is another determinant of nutritional status in developing countries (Madzingira,
1995; Ukwuani and Suchindran, 2003; Maleta et al., 2003). Low birth weight children have low
health endowment, making them more vulnerable to infectious diseases and malnutrition in the
short and the long run. Similar to birth weight, birth spacing, which is related to parental choice,
might influence nutritional status. Shorter birth spacing results in many younger children in the
household, which might decrease the quantity and quality of parental investment per child. This
might therefore result in lower health and nutritional status, as demonstrated in some studies
(Mozumder et al., 2000; Thuida et al., 2005). Nutritional status might also be related to birth
order. The cost of child rearing implies that as the number of children increases, fewer resources
are left to be invested in higher rank children (Birdsall, 1991), implying a negative relationship
between birth order and child nutritional status as found in the Philippines (Horton, 1986, 1988).
Another potential determinant of nutritional status mainly documented in the medical literature
is duration of breastfeeding. However, the results for its effects are mixed. Breastfeeding after
12 months has been linked to improved survival rates and anthropometric status in many settings
(Onyango et al., 1999; Molbak et al., 1997; Molbak et al., 1994). Alvarado et al. (2005) found
that breastfeeding mitigates the effects of poor social conditions on growth for children who have
breastfed for longer than 6 months after birth. However, longer periods of breastfeeding have

8
also been found to be related to higher mortality and substandard anthropometric (Martin, 2001;
Villalpando, 2000; Caulfield et al., 1996). Ukwuani and Suchindran (2003) reported that shorter
periods of breastfeeding increased wasting, while prolonged breastfeeding increased stunting.
Along the same line, improper weaning was found to be a significant risk factor for malnutrition
for children less than five years of age (Kumar et al., 2006).
Maternal Characteristics
Associations between maternal characteristics such as education, marital status, employment
status, weight and height, and parity on one hand and childhood malnutrition on the other hand
are documented in several studies (Behrman, 1988; Behrman and Wolfe, 1984, 1987; Thomas
and Strauss, 1992; Madise et al., 1999; Lavy et al., 1996). Higher levels of maternal education
are associated with better knowledge of nutritious foods and proper nutrition. Education is also
associated with positive utilization of health care services, and better hygiene practices.
Consequently, education is expected to have positive impact on child nutrition, as demonstrated
in several studies (Appoh and Krekling, 2005; Ruel et al., 1992; Glewwe, 1999; Thomas, 1994).
While maternal education has been consistently found to have positive impact on child health, a
study conducted in Nigeria was unable to find any positive effect of mothers who earn cash from
their work on childhood malnutrition (Ukwuani and Suchindran, 2003). Other maternal
demographic factors such as age and marital status have been found to be significantly associated
with severe malnutrition in children (Islam et al., 1994; Delpeuch et al., 2000). Older mothers
have richer experience of childcare, and children born to married mothers benefit from care from
both parents, which may improve their nutritional health. Consistent with this theory, mother’s
9
age at birth has been found to be associated with malnutrition in studies conducted in Brazil and
Ghana (Lima et al., 1990; Rikimaru et al., 1998). Also, children born to married mothers were
found to fare better than their counterparts born to unmarried mothers in Cameroon (Pongou et
al., 2006).
Household Characteristics
Household characteristics ranging from household size (Pleto et al., 1991; Horton, 1988),
number of children under 5 years of age, economic status, and utilization of health care (Thomas
and Strauss, 1992; Lavy et al., 1996; Pongou et al., 2006) has been identified as predictors of
childhood malnutrition. However, the effect of household size might not be obvious. Pleto et al.
(1991) found that Mexican children from larger households tended to be shorter and consumed
food of poorer quality. However, in a context where presence of adults in the same household is
likely to increase total income and other inputs to child health, a larger number of adults would
result in better health status.
Gender of household head may also be an important factor in childhood malnutrition. Female
headship has been found to be associated with better child nutrition in many studies (Kennedy
and Peters, 1992; Staten et al., 1998; Johnson and Rogers, 1993). Female headship is generally
associated with increased power over household resources, and higher investment in child health.
However, female headship may also be associated with higher poverty, especially in the context
of developing countries such as in Nigeria (Mberu, 2006), implying lower investment in child
health. Assessing the impact of the gender of head of household is of particular interest
especially in a context of economic upturns, which might imply higher participation of females
10
in productive activities, as in the case of Ghana (Derose, 2006), as well as changes in household
structure.
Hypothetical mechanism linking economic growth and child health
Growth can affect child health either positively or negatively through the factors reviewed above
in several ways. Economic growth is generally associated with increase in education and
participation in the labor force, implying less unemployment and less poverty at the household
and community levels. Economic growth also implies increased investments in public
infrastructure (water, sanitation, electricity etc.) and the health care sector, resulting in healthier
environments and increased access to health care services. As previously argued, these factors
positively affect child health and nutrition, implying that nutritional status is expected to improve
because of economic upturns.
A positive economic shock that increases job opportunities would also raise the value of time
and consequently increase its cost (Becker, 1981; Becker and Lewis, 1973), a situation that
might have a mixed effect on child heath by affecting women reproductive role. Increase in the
cost of time might cause women to desire fewer children, as they are forced by time constraints
to make a trade off between employment outside the home and childcare. Mothers’ participation
in the labor force is therefore likely to be associated with larger birth spacing, which could result
in improvements in child quality. Also, as birth interval increases, we expect fewer children
under five in the household, which has the potential to reduce competition for resources,
resulting in lower malnutrition. However, the absence of mothers in the home could also have an
effect on breastfeeding duration. Women who work for cash outside the home are more likely to
11
shorten breastfeeding duration, which can negatively affect child nutritional status. While
breastfeeding duration would be shorter for children born to these mothers, we expect that
economic gains from employment will make it possible for these children to have access to more
nutritious foods.
As educational and employment opportunities increase for women during economic growth, their
health status also is expected to improve. Positive changes in health status would be a result of
increased access to health care and intake of more nutritious foods. This would result in larger
weight and better intrauterine growth, implying improvement in birth weight, which is known to
positively impact child physiological growth. In addition, entry of younger men and women into
the labor force as a consequence of growth might also impact union formation and household
structures (household size, gender and age of head). To the extent that these factors promote or
conflict with child well-being as demonstrated in the previous section, health will be affected.
Considering the potential effects of the economic growth during the period 1988–2003 on factors
that may influence child malnutrition in Ghana allows us to assess whether improvements in the
economy at the macro level had any impact at the household level. It is however important to
note that growth is endogenous to productivity and productivity might be endogenous to child
health. In fact, good initial child health will free mothers and will allow them to invest more in
productive activities. It is therefore important to understand the origins and consequences of
growth in Ghana, to completely rule out the possibility of reverse causality in this context.
Sources and Consequences of Economic Growth in Ghana
12
Ghana experienced increase in GDP per capita in the early 1960s, but plunged into a severe
economic reversal in the 1970s and the early 1980s (Figure 1). This crisis was driven by policies
and changes in government regimes (Danquah, 2006). In 1982-1983, the country witnessed its
worst drought in 50 years, which caused bush fires and crops destruction, resulting in weak
levels of consumption and minimum wages and social services (USAID, 1992). The economy
stabilized in 1984 and has maintained growth with little variance over recent years (Figure 1).
Studies examining the sources of economic growth in Ghana report that improvements in
macroeconomic policy and reforms played a significant role (Christiaensen et al., 2003; Aryeetey
and Fosu, 2002). Total factor productivity (TFP), an aspect of total output that is unrelated to
inputs or productivity, has been identified as the most important factor in explaining economic
growth in Ghana (McKay and Aryeetey, 2004). This factor has been linked to the positive effects
of political regimes, liberal administrations and economic liberalization (Aryeetey and Fosu,
2003; McKay and Aryeetey, 2004; Danquah, 2006). In recent years, Ghana took advantage of
the Heavily Indebted Poor Country (HIPC) initiative and reached its decision point in 2002.
Macroeconomic reforms underlying growth in Ghana had positive impact on the industrial and
agricultural sector. Between 1988 and 1991, the contribution of industry to GDP doubled and
represented nearly 16% (World Bank, 1992). Inflation dropped from 122% before reform to
about 10% in 1992 (Figure 2). The agricultural sector, the largest segment of the economy,
which makes up 60% of total employment and half of total GDP, also has been identified as the
major contributor of the recent economic growth (Food Security Assessment, 2005).
Government policies such as the Cocoa and Pests Control Program, Agricultural Rehabilitation
13
Project, Presidential Special Initiatives and Vaccination of Livestock programs have significantly
aided the agricultural and livestock sectors. Also, the effects of higher producer prices, access to
credit and other favorable incentives to these sectors have had an impact on efficiencies in
production of output (African Economic Outlook, 2005-2006). However, growth has not been
consistent across sectors, with sectors such as manufacturing, mining, quarry and services not
faring so well (O’Connell and Ndulu, 2000; Aryeetey and Fosu, 2002; Teal, 1995).
The improvements in the macroeconomy allowed the government to implement its reform
agenda for the Ghana Poverty Reduction Strategy (GPRS). GPRS emphasized wealth creation,
improved governance and reductions in income inequalities (World Bank, 2004). Benefits from
the growth have not been uniform across households. Farmers (mainly export) in Ghana have
experienced the largest drop in poverty with a significant reduction in income poverty for “food
farmers”. Coulombe and McKay (2003) in their analysis found that the reduction in poverty
among food crop farmers was mainly due to incentives to the group. Nationally, reductions in
poverty among those who worked in industrial and service sectors (public service,
communication, manufacturing, commerce and trading) were not significant and did not play a
major role in overall poverty reduction (McKay and Aryeetey, 2004).
As previously argued, these macro level economic transformations had an impact at the micro
level (household consumptions) and at the community level (health care sector, public
infrastructure, access to water and sanitation). There is also some indication that individuals who
come from poor or underprivileged backgrounds have at times gained disproportionately from
rural infrastructure development. Examples of such gains include access to better quality water
14
that positively influences health, and benefits from electricity and production activities. These
improvements in household and community economic and environmental conditions are
expected to have positively affected child health. However, there is no evidence in the literature
to support this hypothesis. We use household level data from Demographic and Health Surveys
to study the determinants of child nutritional status during the period of economic growth in
Ghana and to examine how change in the distributions of these determinants affected child
outcomes.
Methods
Data
Demographic and Health Surveys (DHS) were conducted in Ghana in 1988, 1993, 1998 and
2003. Designed to be representative at the national, urban-rural and regional levels, each survey
used a two-stage probabilistic sample technique to select clusters at the first level and households
at the second level. In each household, information was collected on household socio-economic
characteristics. The survey also included a questionnaire administered to women aged 15 to 49
years old, comprising a birth history, information on individual characteristics and health
behaviors, and details on their children.
For children alive at survey (those aged 2-35 months in 1988, 0-35 months in 1993, 0-59 months
in 1998, and 0-59 months in 2003), weight and height were measured and used to calculate
anthropometric indicators: height-for-age (HAZ), weight-for-age (WAZ) and weight-for-height
(WHZ) z scores using the United States National Center for Health Statistics/World Health

15
Organization (NCHS/WHO) international reference. For comparability across years, we restrict
our study to children aged 2-35 months at each survey.
Variables
Malnutrition is measured using anthropometric indicators. Stunting is defined as height-for-age
(HAZ) 2 standard deviations (SDs) below the median of the NCHS/WHO international
reference. Underweight and wasting are similarly defined, using weight-for-age (WAZ) and
weight-for-height (WHZ) z-scores, respectively. HAZ is a measure of linear growth and reflects
cumulated and chronic health insults. WHZ measures the nutritional effects of short-term shocks,
while WAZ is though of as a composite index of HAZ and WHZ, and has been used in many
epidemiological studies on the impact of child nutrition on mortality (Pelletier et al., 2003).
While many studies have used each of these three indicators in isolation, we consider them
altogether to assess their different and common underlying factors.
Control variables include a set of child characteristics (age, sex, breastfeeding status, birth order,
preceding birth interval and birth size), maternal characteristics (educational attainment,
employment status, marital status, age at child birth, husband education if married, weight and
height), and household characteristics (economic status, access to or utilization of health care
services, household size, number of children under 5 in the household, and age and gender of
household head). Household economic status (HES) is measured by an index constructed using
principal component analysis (Filmer and Pritchett, 2001). Nine items reflecting household
wealth and environmental conditions were utilized (car or truck, motorcycle, refrigerator,
electricity, radio, television, finished floor, flush toilet, and piped water in the household) The
16
indicator for use of health care services is constructed similarly, with indicator variables
including prenatal visits, tetanus injection during pregnancy, medical assistance at delivery,
knowledge of oral rehydration solutions (ORS) and possession of a health card for the child.
These analyses were performed using pooled data from the four years (1988, 1993, 1998 and
2003) to ensure cross-year comparability.
Details on the distributions of all variables are presented in Table 1. We note that the
distributions of child gender and age did not significantly change during the period 1988-2003,
but average child age significantly increased from 17.4 to 18.1 in 1998-2003. The proportion of
first-born children was the highest in 1998 (24%), and as expected, there was a significant
increase in birth interval from 30.8 months in 1988 to 36.1 months in 2003. Average birth order
declined during this period, consistent with the slight increase in the proportion of first-born
children. Contrary to our expectations, breastfeeding rose, as also observed by DeRose (2006),
and the proportion of children with small birth size increased. Maternal characteristics were also
affected during the period of growth. Maternal age at childbirth slightly rose, and the proportion
of children born to married mothers decreased, in favor of those whose parents were living
together without being formally married. As expected, the proportion of mothers working for
cash sharply increased along with education, but education sharply declined after 1998. There
was also a general increase in maternal weight, but height stabilized at the same level in 1993-
1998, and declined afterwards. Consistent with trends in maternal education, husband education
generally increased in 1988-1998, but declined afterwards. The positive economic performance
of the country during this period is reflected in the significant increase in household economic
status. Health care utilization also increased, but significantly deteriorated after 1998. This
17
decline may be attributable to the decentralization of the health care system in 1996 (MOH,
1998; Bossert and Beauvais, 2002; Nyonator and Kutzia, 1999), increasing user fees as found in
other settings (Mbugua et al., 1995; Blas and Limbambala, 2001; Palmer et al., 2004; Manzi et
al,, 2005), and general decline in financing of health care sector, as evidenced by drop in per
capita health care expenditure between 1998 and 2003 (Figure 3). Household size and number of
children under 5 declined in general, but slightly increased after 1998. We also note a decline in
the proportion of children living in household headed by male in 1988-1998, but this proportion
sharply increased in 2003. The same pattern was observed in the average age of household head,
indicating that growth impacted on household structures. As we have noticed, the year 1998 was
a turning point for many factors, despite the growth, and this is expected to have affected trends
in the prevalence of malnutrition in the country.
Prevalence of malnutrition in Ghana, 1988-2003
Prevalence of all forms of malnutrition during the period 1988-2003 in Ghana is reported in
Table 2 and further illustrated in Figure 4. The proportion of stunted children declined from 30%
in 1988 to 27% in 1993 and to 21% in 1998, but significantly increased to 27% in 2003. Wasting
had an opposite trend, increasing from almost 8% in 1988 to 12% in 1993 and 13% in 1998, but
declining to almost 10% in 2003. These opposite trends in stunting and wasting raise questions
about the determinants of chronic and acute malnutrition, and how the responses of these
determinants to macroeconomic changes may have different impacts on different indicators of
child health. Underweight progressively declined from 30% in 1988 to 24% in 2003, while the
fraction of children presenting any of the three forms of malnutrition previously mentioned
remained stable at around 40%, with little variance during this period.
18
Determinants of childhood malnutrition during the economic upturns
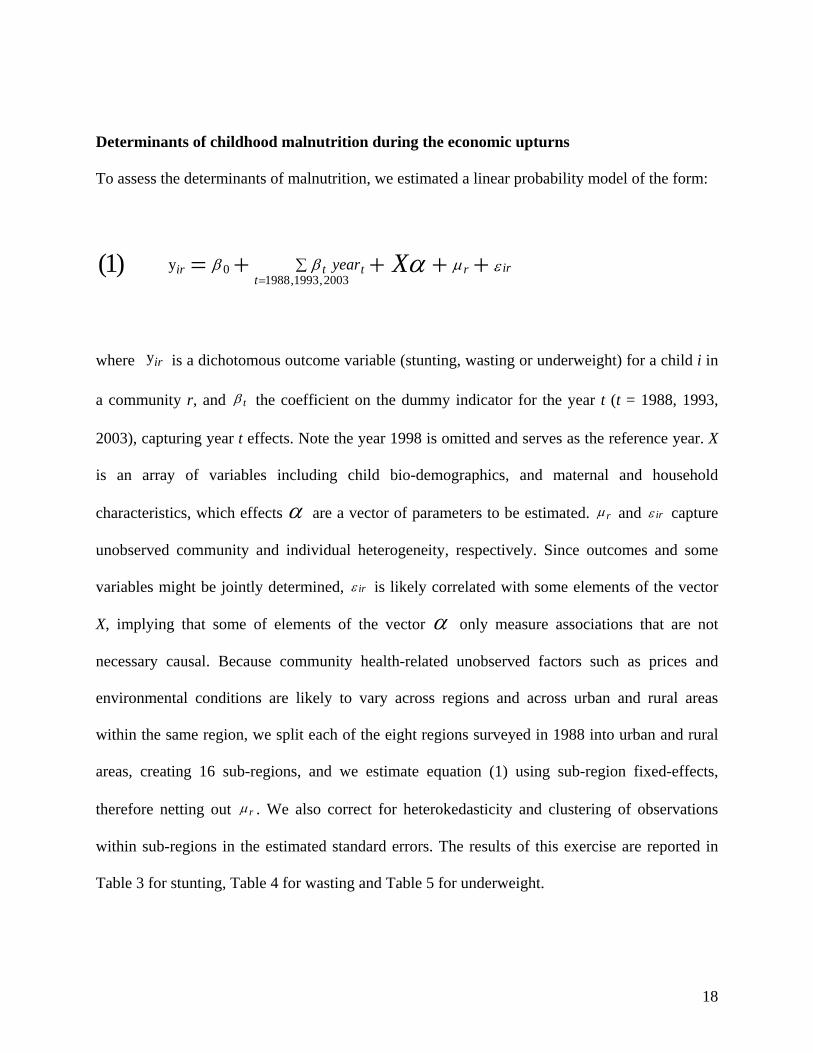
To assess the determinants of malnutrition, we estimated a linear probability model of the form:
εμββ α irrt
ttir Xyear ++++= ∑= 2003,1993,1988
0y )1(
where y ir is a dichotomous outcome variable (stunting, wasting or underweight) for a child i in
a community r, and β t the coefficient on the dummy indicator for the year t (t = 1988, 1993,
2003), capturing year t effects. Note the year 1998 is omitted and serves as the reference year. X
is an array of variables including child bio-demographics, and maternal and household
characteristics, which effects α are a vector of parameters to be estimated. μ r and ε ir capture
unobserved community and individual heterogeneity, respectively. Since outcomes and some
variables might be jointly determined, ε ir is likely correlated with some elements of the vector
X, implying that some of elements of the vector α only measure associations that are not
necessary causal. Because community health-related unobserved factors such as prices and
environmental conditions are likely to vary across regions and across urban and rural areas
within the same region, we split each of the eight regions surveyed in 1988 into urban and rural
areas, creating 16 sub-regions, and we estimate equation (1) using sub-region fixed-effects,
therefore netting out μ r . We also correct for heterokedasticity and clustering of observations
within sub-regions in the estimated standard errors. The results of this exercise are reported in
Table 3 for stunting, Table 4 for wasting and Table 5 for underweight.
19
Results
We comment on results presented in Tables 3-5 using a comparative approach, which consists of
examining the effect of each independent variable on the three outcomes simultaneously. This
approach has the potential to further our understanding of the mechanism driving trends in
different indicators of child nutrition during a period of economic change. In each table, Column
(I) estimates the effects of child bio-demographic factors after adjusting for the years effects.
Column (II) adds maternal characteristics to variables in Column (I), and Column (III) further
adjusts for household characteristics. Column (IV) adds three variables (child birth size and
mother’s weight and height) that were not collected in 1988, but were collected in the subsequent
surveys. Therefore Columns I-III are estimated using the pooled 1988, 1993, 1998 and 2003
surveys, while Column IV is estimated using only the three last surveys. We mainly comment on
results of Column (III) since it is the full model and refer to Column (IV) when necessary.
Child bio-demographics
Tables 3-5 show that the prevalence of all forms of malnutrition was consistently higher in male
as compared to female children during the period of economic growth in Ghana. We note from
Columns (III) that stunting, wasting and underweight were respectively 3.2, 1.3 and 1.0
percentage points greater among boys than girls, but the results for wasting and underweight are
not statistically significant at the 10% level. Studies have found that during childhood, male
experience higher incidence of health conditions resulting in growth failure as compared to
female (Rudy et al, 2002). This is attributed to the immune system, which is thought to be
weaker for the former.
20
As expected, age had a curvilinear relationship with each indicator of malnutrition. Increase in
the probability of malnutrition associated with a one-month increase in child age is 3.2
percentage points for stunting, 1.7 percentage points for wasting, and 4.3 percentage points for
underweight. The association of age with nutritional status is classical, especially in developing
countries where the prevalence of malnutrition generally rises after 6 months of age to reach its
maximum between 12-23 months, and then declines afterwards (Pongou et al., 2006;
Lamontagne et al., 1998; Engle and Zeitlin, 1996).
Larger birth interval was associated with lower prevalence of malnutrition. Column (III) of each
table shows that a one-month increase in preceding birth interval was associated with a 0.1 pp
decrease in the probability of each form of malnutrition. This result confirms the positive effect
of birth spacing on child nutritional status (Thuita et al., 2005; Mozumder et al., 2000). Greater
birth spacing positively affects child health by limiting the number of children to look after
within a limited period, enabling mothers to fully recover from preceding childbearing and
allowing them to engage in revenues generating activities that reduce poverty within the
household (Miller and Xiao, 1999).
We also find that extended breastfeeding was associated with worsening child nutritional status.
Conditional on age, the prevalence of stunting was on average 13.0 percentage points greater
among children who were still breastfeeding at the time of the survey as compared to those who
had already been weaned. This difference was 4.2 percentage points for wasting, and 15.7
percentage points for underweight. Similar findings were obtained in Cameroon (Pongou et al.,
2006) and other developing countries (Caulfield et al., 1996). However, given that malnutrition
21
is generally not prevalent among children under 6 months of age, this finding raises question
about the quality and quantity of supplementation given to breastfeeding children beyond 6
months of age. It is also possible that breastfeeding in these ages is used as substitutes for less
calories, especially in poor households. We tested this hypothesis and found that the difference in
prevalence of stunting between breastfeeding children and weaned children is the largest among
children from the poorest households (19.2 percentage points, p<0.001) and not significant at all
among the richest children (6.7 percentage points, p=0.207) (results not shown). This finding is
consistent with studies in Sudan (Fawzi et al., 1998). Therefore, the relationship between
breastfeeding and nutritional status in our study should not be necessary regarded as causal. It is
possible that children of perceived small stature are breastfed for longer periods to compensate
for their slow growth as illustrated in Simondon et al. (2001), and further discussed in Kramer
(2003). Studies in Mexico have found a positive relationship between breastfeeding and child
growth (2005).
We found a curvilinear relationship between birth order and stunting. A unit increase in birth
rank was associated with increase in the probability of being stunted with a diminishing marginal
effect. The results were qualitatively similar for wasting and underweight, although the effect
was smaller and not statistically significant at the 10% level for wasting. Birth order has been
generally found to be associated with worsening child health and nutrition (Horton, 1988). The
cost of child rearing implies that as the number of children increases, fewer resources are left to
be invested in higher rank children. In the context of sub-Saharan Africa where kinship networks
constitute a major form of insurance, the diminishing marginal effect may reflect the fact that
22
younger children are supported by older ones, especially when the age gap between the oldest
and the youngest is huge.
Birth size was only available in 1993, 1998 and 2003. The effect of this variable is estimated in
Column (IV). As expected, larger birth size was associated with lower prevalence of
malnutrition. Large size at birth was associated with a 9.4, 4.7 and 14.4 percentage points
decrease in the probability of being stunted, wasted and underweight, respectively. This finding
implies that birth size is a determinant of both chronic and acute malnutrition.
Maternal characteristics
Maternal age at childbirth is a significant determinant of child nutritional status (Lima et al.,
1990; Rikimaru et al., 1998; Deodhar and Jarad, 1999). Tables 3 and 5 (Column (III)) shows that
one year increase in mother’s age at childbirth was associated with a 1.5 percentage points
decrease in the probability of stunting, and a 1.5 percentage points decrease in the probability of
underweight. Very young mothers are not generally biologically mature, which do not allow
normal development of the fetus, resulting in low birth size and other biological deficiencies,
which are reflected in child growth after birth. They also may lack the resources and the
adequate knowledge and experience necessary for child rearing, implying inappropriate feeding
and treatment of infectious diseases (Appoh and Krekling, 2005; Ruel et al., 1992; Islam et al.,
1994; Rahman et al., 1993).
Marital status also is an indicator of exposure to factors that protect health. Children born to
married mothers attract the attention of both parents and in most cases enjoy the emotional and
23
financial stability of their family. We find that these children fared better than children born to
divorced mothers and mothers not living with their partners. This was especially true for stunting
(Table 3, Columns II & III) and underweight (Table 5, Columns II & III).
Parental education has been found to be a significant determinant of child health in many studies
(Barrera, 1990; Lavy et al., 1996; Handa, 1999). Our study shows that children born to mothers
with more education were less likely to be malnourished (Tables 3-5). However this effect was
very weak, and generally lost statistical power when other variables were controlled, implying
that the role of higher maternal education was explained by better economic status and better
health care utilization associated with this class. Similarly, husband education did not have a
significant independent effect on stunting and underweight. Its effect on wasting was positive
(Table 5, Column (IV)).
Children born to mothers working for cash had lower prevalence of wasting and underweight,
but the effect of “working for cash” was not significant on wasting. Revenues generating
activities may reduce food and monetary poverty, which is reflected in child nutritional status.
The effects of mothers’ biological factors such as weight and height are also tested in Column
(IV) of Tables 3-5. Mother’s height may capture genetic endowment as well as family
background while weight after netting out the effect of height may capture a dimension of
permanent household economic status. These variables were associated with lower prevalence of
malnutrition by all measures, but the effect of height on wasting was not significant. These
24
findings are consistent with the literature on the determinants of child health (Frongillo et al.,
1997; Islam et al., 1994; Rahman et al., 1993).
Household characteristics
Numerous studies have documented the positive effects of household characteristics (e.g.
income, health care utilization, etc.) on child health and nutrition (Thomas and Strauss, 1992;
Thomas, 1994; Pleto et al., 1991; Adekunle, 2005). Our constructed index of household
economic status was associated with lower prevalence of malnutrition. A unit increase in the
economic status index resulted in a 1.2 percentage points decrease in the probability of stunting
(Table 3, Column (III)). After controlling for mother’s weight and height, the effect of this
variable diminished to non-significance, maybe reflecting the fact that adult anthropometric
measures capture to a certain extent the resources available to households. The effect of
economic status on wasting was not statistically significant, but became meaningful after
controlling for maternal biological factors (Table 4, Columns III-IV) (note that the effect of
health care utilization which was significant in Column III became non-significant in Column
IV, maybe indicating that the roles of economic status and health care utilization are joint, and
cannot be separate from each other). We also note that better economic status was associated
with a lower prevalence of underweight, even after controlling for mother’s weight and height
(Table 5, Columns III-IV).
Health care utilization was also associated with lower prevalence of all forms of malnutrition
(Tables 3-5). Better use of health care implies adequate prenatal and postnatal treatments,
appropriate feeding practices and better management of infectious diseases, all resulting in
25
improved child nutritional status. It is however important to note that this variable is constructed
mainly using prenatal and postnatal health care use indicators and its effect is highest on
stunting; therefore implying that early childhood conditions have a long-term impact on child
health.
Household size and number of children under five have been found to affect child nutrition
(Horton, 1988; Pleto et al., 1991; Waters et al., 2004). These variables also capture the level of
household resources available to each household member. In general, we find no significant
effects of these variables on any form of malnutrition during the Ghana economic upturns. But
the number of children under the age of 5 was found to be associated with increase probability of
stunting after controlling for all factors. It has been argued that increase in the number of
children generally increases food competition within the household, resulting in lower quantity
of food for each child (LeGrand and Phillips, 1996; Delpeuch et al., 2000). But it is important to
note that when the effect of birth interval is significant, the effect of number of children is not
significant and vice-versa (Table 3, Columns III-IV), therefore implying that these variables are
correlated and have joint significant effects.
Other household factors also found to have an effect on child nutritional status during the
economic upturns in Ghana were the gender and age of household head. The prevalence of
stunting was on average 2.6 percentage points lower in male-headed households as compared to
female-headed households. The results are in the same direction for wasting and underweight,
although they are not statistically significant. In developing countries, male household headship
generally implies the presence of a female (generally the mother) in the household while the
26
converse is not true. This implies that children living in such households generally benefit from
the presence of both parents, which positively impacts on their health. Also, male headship is
generally associated with greater resources and less poverty (Mberu, 2006), implying a greater
investment in child health. Our result for head of household is different from other studies
(Kennedy & Peters 1992; Staten et al. 1998). Older household heads were associated with lower
prevalence of stunting (Table 3, Columns III-IV) and higher prevalence of wasting (Table 4
Column III).
We note that the three forms of malnutrition examined had some common determinants during
the 1980s and 1990s economic upturns in Ghana. Child bio-demographics prominently featured
among these factors as well as some maternal and household characteristics. It should however
be noted that the effects of many of these variables varied across outcomes in magnitude and
statistical significance. Stunting and underweight essentially had the same determinants, but
household factors like gender and age of household head were significantly associated with
stunting, but not with underweight. Age of household head had an opposite effect on stunting
and wasting, implying that some factors may yield mixed effects on child health. These findings
may help understand why different trends in different indicators of malnutrition were observed
during the period of growth experienced by the country.
Understanding trends in the prevalence of malnutrition
In this section, we assess the extent to which trends in different measures of child nutritional
status during the period of economic growth in Ghana were driven by trends or changes in the
distributions of their determinants as studied in the previous section. We hypothesize that if a
27
factor is associated with lower prevalence of malnutrition (e.g. economic status) and is positively
affected by an economic upturn (e.g. increase in economic status during economic growth in
Ghana), then the level of malnutrition will decrease. So in general, trends in malnutrition are
determined both by trends in its underlying determinants and the direction in which malnutrition
is affected by these determinants. Table 6 summarizes our assumption about the expected trend
in malnutrition as a result of the combination of both factors. However, this approach to
estimating the contribution of changes in the distributions of determinants to trends in
malnutrition raises an important issue that should be addressed. Changes in the level of
malnutrition might also result from changes in the effects of its determinants over time. For
instance, if the effect of economic status increases during a positive macro economic shock
because the benefits of this shock accrued only to the richest class, we might still observe change
in the level of malnutrition even if there is little change in average income. To address this issue
in our study, we estimate a model in which variables are interacted with year’s dummies to
assess changes across years in the coefficient on each independent variable (results not shown).
We note that the effect of sex and birth interval changed across years, but these changes were not
statistically significant. We can therefore attempt to explain trends in different indicators of
malnutrition only based on the assumption highlighted in Table 6.
We explain trends in different measures of malnutrition in Ghana based on equation (1), but with
a different order of inclusion of independent variables. For each outcome, we first estimate
equation (1) only with years dummies, with the year 1998 being our reference year (this year was
a turning point in the trends of stunting and wasting, and change in the level of underweight
between 1998 and 2003 was not statistically significant) (Tables 7-10, Columns (I)). We

28
additionally adjust for child sex and age (Tables 7-10, Columns (II)). Based on the determinants
of malnutrition (Tables 3-5) and their trends (Table 1), variables that are expected to have driven
trends in the observed direction (Figure 4) are first added and those that are expected to have
acted in the opposite direction are included afterwards. This also implies that the order of
inclusion of these variables should change across outcomes. The rationale underlying this order
of inclusion is based on Table 6 and the observed trends pictured in Figure 4. If a variable is
associated with lower prevalence of malnutrition and if this variable increased between 1988 and
1998 while the level of malnutrition decreased, then the inclusion of this variable in the model is
expected to decrease the coefficient on the year 1988. That is, if the distribution of the variable
in 1988 were the same as in 1998, the prevalence of malnutrition would have been lower in 1988
than it actually was. This would also mean that increase in the level of this variable mediated
some part of the decrease in malnutrition.
Because the year 1998 was a turning point in trends in stunting and wasting and because change
between 1998 and 2003 was not statistically significant for underweight, we mainly seek to
understand these trends for the periods 1988-1998 and 1998-2003 for the first two indicators and
only for the period 1988-1998 for the latter. Results are presented in Tables 7-10.
Stunting
Period 1988-1998
The results for the period 1988-1998 are presented in Table 7. We are only interested in how the
coefficient on the year 1988 responds to inclusion of additional factors. After adjusting for sub-
region effects, we note that the proportion of stunted children decreased by 10.5 percentage

29
points between 1988 and 1998 (Column (I)). Further adjustment for child sex and age changes
little in the coefficient on the year 1988 (Column (II)). This is not surprising since the age and
sex distributions of children did not change during the period of interest (Table 1). After
controlling for child preceding birth interval and birth order and their quadratic terms, this
coefficient dropped to 0.098 (Column (III)). This drop is explained by the fact that birth interval
for instance was associated with lower level of stunting and its level in general rose between
1988 and 1998 (for birth order, it is just the opposite). Column (IV) additionally controls for
maternal education, age at childbirth and its quadratic term, husband education, economic status,
household size and number of children under five in the household. A close look at these
variables show that the direction in which each of them is associated with stunting and their
trends during 1988-1998 imply that they mediated decrease in this form of malnutrition during
this period. This resulted in a drop in the coefficient on the year 1988 to 0.069. Note that this
coefficient is significantly different from the first coefficient 0.105 at the 5% level. Control of
the remaining determinants in Column (V) did not show any mediating effects of these factors.
We therefore conclude that 34% of the total decrease in stunting between 1988 and 1998 could
be explained by changes in the distributions of variables included in Columns (III-IV).
Period 1998-2003
The proportion of stunted children increased by 6.4 percentage points between 1998 and 2003 in
Ghana. This is reflected in the robust coefficient on the year 2003 in Table 8, Column (I).
Controlling for child sex and age decreases this coefficient to 0.055 (Column (II)). This could be
explained by the small increase in average child age between 1998 and 2003 (Table 1). After
further controls for breastfeeding status, birth order and its quadratic term and health care use
30
index in Column (III), this coefficient diminishes to 0.043. This finding implies that rise in the
prevalence of stunting after 1998 was associated with higher birth rank probably due to declines
in the level of fertility of women with fewer children, extended breastfeeding and declines in the
use of primary health care services. Ghana decentralized its health care system in 1996
(Nyonator and Kutzin, 1999). This reform was associated with increase in user fees, leading to a
decline in health care utilization. Our results suggest that this situation contributed to
deteriorating child linear growth after 1998. When controlling for the remaining variables in
Columns IV-V, we note little mediating effects due to these factors.
Wasting
Wasting increased by 4.8 percentage points between 1988 and 1998 and then declined by 3.1
percentage points between 1998 and 2003 (Table 9, Columns (I)). Controlling for child sex and
age has no effects on the coefficients on the years 1988 and 2003 (Column (II)). After
controlling for breastfeeding status (Column (III)), we observe a slight change in the effect of
year 1988, indicating that increase in wasting during the period 1988-1998 was correlated with
extended breastfeeding. The effect of year 2003 on the contrary increases. Columns IV-V lead to
the conclusion that the factors included in our analysis had little mediating effects on the trend in
wasting during the period of interest.
Underweight
The proportion of underweight children significantly decreased by 5.5 percentage points between
1988 and 1998 and further decreased by 2.1 percentage points in 2003 (Table 10, Column (I)).
Controlling for child age and sex explains little in the trends observed in 1988-1998 (Column
31
(II)). Controls in Column (III) show that part of the decrease in underweight could be explained
by declines in birth order and increase in preceding birth interval. After adding economic status
index, health care use index, maternal age at child birth and its quadratic term and employment
status, household size and number of children under five in the household, the coefficient of the
year 1988 drops to 0.023 and becomes statistically non different from zero. Trends in the
variables included in Column (IV) explained nearly 50% of the total decrease in underweight
between 1988 and 1998 in Ghana.
Trends in different measures of childhood malnutrition in Ghana during the period of economic
growth were partly explained by child, maternal and household factors included in our analysis.
However, that only part of these trends could be explained suggests that there was a country
factor affecting the health of all social classes. We also note that the explanatory factors for
changes in the level of malnutrition differed across measures, as well as the share explained by
these factors, reflecting the fact that determinants of malnutrition differ in magnitude and
statistical significance across outcomes.
Conclusion
We examine child nutrition in Ghana during the economic recovery of the 1980s and 1990s. Our
analysis indicates that the three indicators of malnutrition analyzed in our study had different
responses to growth. Stunting declined between 1988 and 1998, but significantly increased
afterwards. Wasting followed an opposite path increasing from 8 to 13% in 1988-1998, and then
decreasing to 10% in 2003. Underweight progressively fell from 30% in 1998 to 24% in 2003.
These different trends also demonstrate differences in the sets of factors generating these
32
outcomes, as confirmed by our analysis. We note that factors such as child gender, male
household headship, and age of household head significantly impacted stunting, while their
effects on both wasting and underweight were not significant. Birth order, maternal age at
childbirth, marital status, and mother’s height were common factors to both stunting and
underweight. Finally, preceding birth interval, prolonged breastfeeding, birth size, mother’s
weight, household economic status, and health care utilization were associated with the three
outcomes.
We note that the distributions of these determinants changed during economic growth.
Household economic status increased, as well as health care utilization, but this latter factor
declined after 1998, following the health care system reform in the country in 1996. We showed
that these factors partly explained trends in stunting and underweight during the 1990s growth.
Even though household income increased in Ghana during the period 1988 – 2003, user fees and
competing demands for services (i.e. water, food etc.) might have decreased the demand for care
for children, especially after the 1996 decentralization, explaining increase in stunting after 1998.
Changes in the distributions of other bio-demographic factors also explained changes in child
nutritional status. Most notable is the increase in birth interval that partly mediated decrease in
stunting and underweight in 1988-1998. Prolonged breastfeeding surprisingly increased, and was
associated with increase in malnutrition.
Although household income responded positively to macro level economic upturns in Ghana
during the 1990s, we show that possible explanations for the mixed results in the three measures
of malnutrition could be associated with other child, maternal, and household level factors. As
33
the place of women in Ghanaian society and the labor force changed due to economic growth,
women modified their decision-making on marriage, childbirth, education, and other factors to
mirror the macroeconomic change.
The findings from the study are significant to policy development as well as intervention
approaches. Most of the factors associated with childhood malnutrition can be prevented
through intervention and educational programs. Increase in stunting after 1998 implies that
macro-level economic growth that may lead to improvement in household economic factors may
not necessarily translate into improvement in child health and nutrition. The approach to
eliminating childhood malnutrition must be comprehensive approach and pointed, underscoring
the importance of interventions that address characteristics associated with specific populations
within communities. Policy and interventions should emphasis individual, community and
governmental level approaches. Empowering parents with necessary tools and information
concerning the importance of proper nutrition could potentially overcome differences in social
groups, and mechanisms of decision-making that negatively impacts child malnutrition. Further
research into this topic would be instrumental to effectively addressing the malnutrition crisis in
Ghana in particular and developing countries in general.

34
References
Adekunle, L., 2005. The effect of family structure on a sample of malnourished urban Nigerian children. Food and Nutrition Bulletin 26(2), 230-233.
African Economic Outlook 2005-2006., Accessed September 1, 2006 at www.oecd.org/dev/publications/africanoutlook
Alvarado, B.E., Zunzunegui, M.V., Delisle, H., Osorno, J. 2005. Growth Trajectories Are Influenced by Breast-Feeding and Infant Health in an Afro-Colombian Community. Journal of Nutrition 135(9), 2171 - 2178.
Appoh, L.Y., Krekling, S., 2005. Maternal nutritional knowledge and child nutritional status in the Volta Region of Ghana. Maternal and Child Nutrition 1(2), 100-110.
Aryeetey, E., Fosu, A.K., 2002. Explaining African Economic Growth Performance: The Case of Ghana, paper prepared for the African Economic Research Consortium, Kenya. Accessed September 1, 2006 at http://www.gdnet.org/pdf/fosu.pdf Aryeetey, E., Fosu, A.K., 2003. Economic Growth in Ghana: 1960-2000. Mimeo. African Economic Research Consortium, Nairobi. Barrera, A., 1990. The Role of Maternal Schooling and its Interaction with Public Health Programs in Child Health Production. Journal of Development Economics 32(1), 69–91.
Becker, G., 1981. A Treatise on Family. Harvard University Press, Cambridge.
Becker, G., Lewis, H.G., 1973. On the Interaction between Quantity and Quality of Children. The Journal of Political Economy 81, S279-S288.
Behrman, J.R., 1988. Nutrition, health, birth order and seasonality: Intrahousehold allocation among children in rural India. Journal of Developmental Economics 28(1), 43-62.
Behrman, J.R., Wolfe, B.L., 1984. More evidence on nutrition demand: Income seems overrated and women’s schooling underemphasized. Journal of Development Economics 14(1&2), 104–128.
Behrman, J.R., Wolfe, B.L., 1987. How does mother’s schooling affect the family’s health, nutrition, medical care usage, and household sanitation? Journal of Econometrics 36, 185-204.
35
Behrman, J.R., Rosenzweig, M.R., 2004. Returns to birthweight. Review of Economics and Statistics 86(2), 586-601.
Birdsall, N., 1991. Birth order effects and time allocation. Research in Population Economics 191-213.
Black, R.E., Morris, S.S., Bryce, J., 2003. Where and why are 10 million children dying every year? Lancet 361(9376), 2226-2234.
Blas, E., Limbambala, M., 2001. User-payment, decentralization and health service utilization in Zambia. Health Policy and Planning 16(2), 19-28.
Bossert, T.J., Beauvais, J.C., 2002. Decentralization of health systems in Ghana, Zambia, Uganda and the Philippines: a comparative analysis of decision space. Health Policy and Planning 17(1), 14-31.
Caulfield, L.E., Bentley, M.E, Ahmed, S., 1996. Is prolonged breastfeeding associated with malnutrition? Evidence from nineteen demographic and health surveys. International Journal of Epidemiology 25(4), 693-703.
Chang, S.M., Walker, S.P., Grantham-McGregor, S., Powell, C.A., 2002. Early childhood stunting and later behaviour and school achievement. Journal of Child Psychology and Psychiatry 43(6), 775-783.
Choudhury, A.Y., Bhuiya, A., 1993. Effects of biosocial variables on changes in nutritional status of rural Bangladeshi children, pre- and post-monsoon flooding. J Biosocial Science 25(3), 351-357.
Christiaensen, L., Demery L., Paternostro S., 2003. Macro and Micro Perspectives of Growth and Poverty in Africa. World Bank Economic Review 17(3), 317-347.
Coulombe, H., McKay, A., 2003. Selective Poverty Reduction in a Slow Growth Environment: Ghana in the 1990s. mimeo. University of Bath. Paper presented at ISSER-Cornell International Conference on Ghana at the Half Century, Accra, July 2004.
Danquah, M., Sources of Growth in Ghana. Accessed September 1, 2006 at http://unpan1.un.org/intradoc/groups/public/documents/IDEP/UNPAN023359.pdf
de Onis, M., Blossner, M., Borghi, E., Frongillo, E.A., Morris, R., 2004. Estimates of Global Prevalence of Childhood Underweight in 1990 and 2015. Journal of America Medical Association 291(21), 2600-2606.
de Onis, M., Frongillo, E.A., Blossner, M., 2000. Is Malnutrition Declining? An Analysis of Changes in Levels of Child Malnutrition since 1980. Bulletin of the World Health Organization 78(10), 1222-1233.
36
Delpeuch, F., Traissac, P., Martin-Prevel, Y., Massamba, J.P., Maire, B., 2000. Economic crisis and malnutrition: socioeconomic determinants of anthropometric status of preschool children and their mothers in an African urban area. Public Health Nutrition 3(1), 39-47.
Deodhar, J., Jarad, R., 1999. Study of the prevalence of and high risk factors for fetal malnutrition in term newborns. Annals of Tropical Pediatrics 19(3), 273-277.
DeRose, L., 2006. Women’s Work and Breastfeeding Simultaneously Rise in Ghana. Forthcoming in Economic Development and Cultural Change.
Easterly, W., Levine, R., 1997. Africa's Growth Tragedy: Policies and Ethnic Divisions. Quarterly Journal of Economics 112(4), 1203-1250.
Edmonds, E. V., 2004. How well do improvements in economic status track non-monetary measures of well-being? Evidence from child height. Unpublished manuscript. Dartmouth University.
Engle, P.L., Zeitlin, M., 1996. Active feeding behaviour compensates for low interest in food among young Nicaraguan children. Journal of Nutrition 126(7), 1808–1816.
Ezzati, M., Lopez, A.D., Rodgers, A., Vander Hoorn, S., Murray, C.J., Comparative Risk Assessment Collaborating Group., 2002. Selected Major Risk Factors and Global and Regional Burden of Disease. Lancet 360(9343), 1347-1360.
Fawzi, W.W., Herrera, M.G., Nestel, P., Amin, A.E., Mohamed, K.A., 1998. A longitudinal study of prolonged breastfeeding in relation to child undernutrition. International Journal of Epidemiology 27, 255-260
Filmer, D., Pritchett L.H., 2001. Estimating Wealth Effects without Expenditure Data--Or Tears: An Application to Educational Enrollments in States of India. Demography 38(1), 115–132.
Food Security Assessment., 2005. Economic Research Services/USDA. Accessed September 1, 2006 at http://www.ers.usda.gov/publications/GFA17/GFA17c.pdf
Frongillo, E,A,, de Onis, M., Hanson, K.M., 1997. Socio-economic and demographic factors are associated with worldwide patterns of stunting and wasting of children. Journal of Nutrition 127(12), 2302-9.
Glewwe, P., Jacoby, H., 1993. Delayed Primary School Enrollment and Childhood Malnutrition in Ghana, An Economic Analysis. Living Standards Measurement Study. Working Paper No. 98. World Bank, Washington, D.C.
Glewwe, P., 1999. Why does mother's schooling raise child health in developing countries? Evidence from Morocco. Journal of Human Resources 34(1), 124-159.
37
Haddad, L., Alderman, H., Appleton, S., Song, L., Yohannes, Y., 2003. Reducing child malnutrition: How far does income growth take us? World Bank Economic Review 17(1):107-131.
Handa S., 1999. Maternal Education and Child Height. Economic Development and Cultural Change 47(2), 421-37.
Hill, K., Adansi-Pipim, G., Assogba, L., Foster, A., Mukiza-Gapere, J., Paxson, C., 1993. Demographic effects of economic reversals in Sub-Saharan Africa. Washington: National Research Council. National Academy Press. Washington D.C.
Horton, S., 1988. Birth Order and Child Nutritional Status: Evidence from the Philippines. Economic Development and Cultural Change 36(2), 341-354.
Horton, S. Child nutrition and family size in the Philippines. Journal of Development Economics 23(1), 161-176.
Islam, M.A., Rahman, M.M., Mahalanabis, D., 1994. Maternal and socio-economic factors and the risk of severe malnutrition in a child: a case-control study. European Journal of Clinical Nutrition 48(6), 416–424.
Johnson, F.C., Rogers, B.L., 1993. Children’s nutritional status in female headed households in the Dominican Republic. Social science & medicine 37(11), 1293-1301.
Kennedy, E., Peters, P., 1992. Household Food Security and Child Nutrition: The Interaction of Income and Gender of Household Head. World Development 20(8), 1077-1085.
Khorshed Alam Mozumder, A. B. M., Barkat-E-Khuda, Kane, T.T., Levin, A., Ahmed, S., 2000. The effect of birth interval on malnutrition in Bangladeshi infants and young children. Journal Biosocical Science 32(3), 289-300.
Kramer, M., 2003. Breastfeeding and child health, growth, and survival. International Journal of Epidemiology 32(1), 96-98.
Kumar, D., Goel, N.K., Mitta, P.C., Misra, P., 2006. Influence of infant-feeding practices on nutritional status of under-five children. Indian Journal of Pediatrics 73(5), 417-421.
Kunbur, R., 2001. Economic Policy, Distribution and Poverty: The Nature of Disagreements, World Development 29(6), 1083-94.
Lamontagne, J.F., Engle, P.L., Zeitlin, M.F., 1998. Maternal employment, childcare, and nutritional status of 12-18-month-old children in Managua, Nicaragua. Social Science & Medicine 46(3), 403–414.
Lavy, V., Strauss, J., Thomas, D., de Vreyer, P., 1996. Quality of Health Care, Survival and Health Outcomes in Ghana. Journal of Health Economics 15(3), 333-357.

38
Lee, L., Rosenzweig M.R., Pitt M.M., 1997. The effects of improved nutrition, sanitation, and water quality on child health in high-mortality populations. Journal of Econometrics 77, 209-235.
LeGrand, T.K., Phillips, J.F., 1996. The effect of fertility reductions on infant and child mortality: Evidence from matlab in rural Bangladesh. Population Studies 50(1), 51–68.
Lima, M., Figueira, F., Ebrahim, G.J., 1990. Malnutrition Among Children of Adolescent Mothers in a Squatter Community of Recife, Brazil. Journal of Tropical Pediatrics 36(1), 14-19.
Lopez, A.D., Mathers, C.D., Ezzati, M., Jamison, D., Murray, C.J.L., 2006. The global and regional burden of disease and risk factors. Systematic analysis of population health data. Lancet 367(9524), 1747-1757.
Madise, N.J., Mathews, Z., Margetts, B., 1999. Heterogeneity of child nutritional status between households: A comparison of six-sub-Saharan African countries. Population Studies 53(3), 331-343.
Madzingira, N., 1995. Malnutrition in children under five in Zimbabwe: effect of socioeconomic factors and disease. Social Biology 42(3-4), 239-246.
Maleta, K., Virtanen S.M., Espo M., Kulmala, T., Ashorn, P., 2003. Childhood malnutrition and its predictors in rural Malawi. Pediatric & Perinatal Epidemiology 17(4):384-390.
Manzi, F., Schellenberg, J.A., Adam, T., Mshinda, H., Victora, C.G., Bryce, J., 2005. Out-of-pocket payments for under-five health care in rural southern Tanzania. Health Policy and Planning 20(1), 85-93.
Martin, R.M., 2001. Commentary: does breastfeeding for longer cause children to be shorter? International Journal of Epidemiology 30(3), 481–484.
Mberu, B., 2006. Household Structure and Living Conditions in Nigeria. Forthcoming in Journal of Marriage and Family.
Mbugua, J.K., Bloom, G.H., Segall, M.M., 1995. Impact of user charges on vulnerable groups: the case of Kibwezi in rural Kenya. Social Science Medicine 41(6), 829-835.
McKay, A., Aryeetey, E., 2004. Operationalizing Pro-poor Growth: Ghana Case Study. Joint Development Initiative of AFD, BMZ, GTZ, KfZ Development Bank, DFID, and the World Bank. Accessed September 1 at http://siteresources.worldbank.org/INTPGI/Resources/342674-1115051237044/oppgghana.pdf
Miller, C.F., Xiao, J.J., 1999. Effects of birth spacing and timing on mothers' labor force participation. Atlantic Economic Journal 27(4), 410-21.
MOH-Republic of Ghana Ministry of Health, 1998. Health sector five year programme of work: 1997-2001. March 1998. Accra, Ghana: Ministry of Health.
39
Molbak, K., Jakobsen, M., Sodemann, M., Aaby, P., 1997. Is malnutrition associated with prolonged breastfeeding?. International Journal of Epidemiology 26(2), 458-459.
Molbak, K., Gottschau, A., Aaby, P., Hojlyng, N., Ingholt, L., da Silva, A.P., 1994 Prolonged breast feeding, diarrhoeal disease, and survival of children in Guinea-Bissau. British Medical Journal 308(6941),1403-1406.
Mosley, W.H., Chen, L., 1984. An analytical framework for the study of child survival in developing countries. Population and Development Review 10, 25-45.
Nyonator, F., Kutzin, J., 1999. Health for Some?: The Effects of User Fees in Volta Region of Ghana. Health Policy and Planning 14(4), 329-341.
O’Connell, S., Ndulu, B., 2000. Africa’s Growth Experience: A Focus on the Sources of Growth” Mimeo, AERC, Nairobi.
Onyango, A.W., Esrey, S.A., Kramer, M.S., 1999. Continued breastfeeding and child growth in the second year of life: a prospective cohort study in western Kenya. Lancet 354(9195), 2041-2045.
Palmer, N., Mueller, D.H., Gilson, L., Mills, A., Haines, A., 2004. Health financing to promote access in low-income settings - how much do we know? Lancet 364 (9442), 1365-1370.
Paxson, C., Schady, N., 2005. Child health and economic crisis in Peru. The World Bank Economic Review 19(2), 203-223.
Pelletier, D.L., Frongillo, E.A., 2003. Changes in Child Survival are Strongly Associated with Changes in Malnutrition in Developing Countries. Journal of Nutrition 133(1), 107-119.
Performance: The Case of Ghana, paper prepared for the African Economic Research
Pleto, G.H., Urgello, J., Allen, L.H., Chavez, A., Martinez, H., Meneses, L., Capacchione, C., Backstrand, J., 1991. Household size, food intake and anthropometric status of school-age children in a highland Mexican area. Social Science & Medicine 33(10), 1135-1140.
Pongou, R., Ezzati, M., Salomon, J. A., 2006. Household and Community Socioeconomic and Environmental Determinants of Child Nutritional Status in Cameroon. BMC Public Health 6:98.
Pongou, R., Salomon, J.A., Ezzati, M., 2006. Health impacts of macroeconomic crises and policies: determinants of variation in childhood malnutrition trends in Cameroon. International Journal of Epidemiology 35(3), 648-656.
Pritchett, L., Lawrence, H., 1996. Wealthier is Healthier. Journal of Human Resources 31(4), 841-868.
Rahman, M., Roy, S.K., Ali, M., Mitra, A.K., Alam, A.N., Akbar, M.S., 1993. Maternal Nutritional Status as a Determinant of Child Health. Journal of Tropical Pediatrics 39(2), 86-88.
40
Rikimaru, T., Yartey, J.E., Taniguchi. K., Kennedy, D.O., Nkrumah, F.K., 1998. Risk factors for the prevalence of malnutrition among urban children in Ghana. Journal of Nutritional Science and Vitaminology 44(3), 391-407.
Rudy, B.J., Wilson, C.M., Durako, S., Moscicki, A., Muenz, L., Douglas, S.D., 2002. Peripheral Blood Lymphocyte Subsets in Adolescents: a Longitudinal Analysis from the REACH Project. Clinical and Diagnostic Laboratory Immunology 9(5), 959-965.
Ruel, M.T., Habicht, J., Pindtrup-Anderson, P., Grohn, Y., 1992. The mediating effects of maternal nutrition knowledge on the association between maternal schooling and child nutrition status in Lesotho. American Journal of Epidemiology 135(8), 904–914.
Simondon, K.B., Costes, R., Delaunay, V., Diallo, A., Simondon, F., 2001. Children’s height, health and appetite influence mothers’ weaning decisions in rural Senegal. International Journal of Epidemiology 30, 476-481.
Staten, L.K., Dufour, D.L., Reina, J.C., Supr, G.B., 1998. Household headship and nutritional status: Female-headed versus male/dual-headed households. American Journal of Human Biology 10(6), 699-709.
Smith, L., Haddad, L., 2002. How potent is economic growth in reducing undernutrition? What are the pathways of impact? Economic Development and Cultural Change 51, 55-76.
Teal, F., 1995. Does "getting prices right" work? Micro evidence from Ghana. The Centre for the Study of African Economies. Working Paper Series. Working Paper 36. Accessed at http://www.bepress.com/csae/paper36.
Thomas, D., 1994. Like Father, like Son; Like Mother, like Daughter: Parental Resources and Child Height. The Journal of Human Resources 29(4), 950-988.
Thomas, D., Strauss, J., 1992. Prices, infrastructure, household characteristics and child height. Journal of Development Economics 39(2), 301-331.
Thuita, F.M., Mwadime, R.K., Wang’ombe, J.K., 2005. Child nutritional status and maternal factors in an urban slum in Nairobi, Kenya. East African Medical Journal 82(4):209-15.
Ukwuani, F.A., Suchindran, C.M., 2003. Implications of women's work for child nutritional status in sub-Saharan Africa: a case study of Nigeria. Social Science and Medicine 56(10), 2109-21.
USAID., 1992. Accessed September 16, 2005 at http://pdf.dec.org/pdf_docs/PDACF141.pdf
Villalpando, S., 2000. Feeding Mode, Infections, and Anthropometric Status in Early Childhood. Pediatrics 106(5), 1282-1283.
Waters, H., Saadah, F., Surbakti, S., Heywood, P., 2004. Weight-for-age malnutrition in Indonesian children, 1992–1999. International Journal of Epidemiology 33(3), 589-595.

41
Weinreb, L., Cheryl, W., Jennifer, P., Richard, S., David, H., Linda, S., Craig, G., 2002. Hunger: Its Impact on Children’s Health and Mental Health. Pediatrics 110 (4), 41.
World Bank Group., 2004. Accessed September 16, 2005. http://www.worldbank.org/cgibin/sendoff.cgi?page=/data/countrydata/aag/gha_aag.pdf

42
Table 1: Summary Statistics. Standard deviations are in parentheses
Variables All sample 1988 1993 1998 2003 N 7043 1836 1751 1602 1854 Year 1988 0.30 (0.46) 1.00 (0.00) 0.00 (0.00) 0.00 (0.00) 0.00 (0.00) Year 1993 0.22 (0.42) 0.00 (0.00) 1.00 (0.00) 0.00 (0.00) 0.00 (0.00) Year 1998 0.23 (0.42) 0.00 (0.00) 0.00 (0.00) 1.00 (0.00) 0.00 (0.00) Year 2003 0.24 (0.43) 0.00 (0.00) 0.00 (0.00) 0.00 (0.00) 1.00 (0.00) Child bio-demographics Male 0.50 (0.50) 0.50 (0.50) 0.50 (0.50) 0.50 (0.50) 0.49 (0.50) Female 0.50 (0.50) 0.50 (0.50) 0.50 (0.50) 0.50 (0.50) 0.51 (0.50) Age 17.60 (9.75) 17.49 (9.69) 17.40 (9.95) 17.44 (9.67) 18.08 (9.69) First born 0.22 (0.41) 0.20 (0.40) 0.21 (0.41) 0.24 (0.43) 0.22 (0.41) Preceding birth interval 33.66 (27.37) 30.79
(22.78) 34.65 (27.00) 33.90 (28.24) 36.09 (31.49)
Still breastfeeding 0.64 (0.48) 0.61 (0.49) 0.65 (0.48) 0.64 (0.48) 0.66 (0.47) Breastfeeding is missing 0.00 (.07) 0.00 (0.07) 0.00 (0.05) 0.01 (0.09) 0.00 (0.07) Birth order 3.59 (2.35) 3.80 (2.44) 3.48 (2.20) 3.47 (2.39) 3.53 (2.31) Birth size was small 0.15 (0.35) NA 0.12 (0.32) 0.13 (0.34) 0.18 (0.38) Birth size was average 0.39 (0.49) NA 0.46 (0.50) 0.29 (0.45) 0.41 (0.49) Birth size was large 0.46 (0.50) NA 0.42 (0.49) 0.57 (0.49) 0.40 (0.49) Maternal characteristics Age at child birth 27.40 (6.82) 27.11 (6.84) 27.22 (6.67) 27.32 (6.84) 28.00 (6.90)
Married 0.79 (0.41) 0.85 (0.36) 0.77 (0.42) 0.72 (0.45) 0.81 (0.39) Never married 0.03 (0.16) 0.03 (0.17) 0.02 (0.15) 0.02 (0.15) 0.03 (0.18) Widowed 0.01 (0.08) 0.01 (0.08) 0.00 (0.071) 0.01 (0.08) 0.01 (0.10) Divorced 0.03 (0.16) 0.03 (0.17) 0.03 (0.18) 0.027 (0.16) 0.016 (0.12) Living together 0.12 (0.32) 0.06 (0.23) 0.15 (0.35) 0.18 (0.39) 0.10 (0.30) Not living together 0.03 (0.17) 0.03 (0.16) 0.02 (0.15) 0.04 (0.19) 0.03 (0.18) Works for cash 0.67 (0.47) 0.51 (0.50) 0.66 (0.47) 0.76 (0.43) 0.78 (0.41) “Works for cash” is missing 0.11 (0.32) 0.03 (0.17) 0.20 (0.40) 0.14 (0.35) 0.00 (0.00)
education 4.79 (4.52) 4.75 (4.50) 4.86 (4.50) 4.96 (4.61) 4.63 (4.47) Weight 559.37
(119.14) NA 547.42 (98.33) 555.96
(117.75) 573.44 (135.28)
Weight is missing 0.00 (0.07) NA 0.00 (0.05) 0.00 (0.05) 0.01 (0.10) Height 1573.99
(170.67) NA 1579.46
(111.77) 1580.31 (176.39)
1563.08 (205.54)
Height is missing 0.01 (0.09) NA 0.00 (0.06) 0.00 (0.06) 0.01 (0.12) Household characteristics Husband education 4.94 (5.42) 6.28 (5.28) 6.25 (5.05) 7.15 (5.63) 5.39 (5.60) Husband education is missing 0.37 (.48) 0.10 (0.30) 0.36 (0.48) 0.08 (0.28) 0.12 (0.32)
Economic status index 0.04 (1.83) -0.30 (1.62) -0.05 (1.78) 0.14 (1.83) 0.47 (2.03) Health care use index 0.24 (1.31) -0.01 (1.38) 0.27 (1.34) 0.53 (1.16) 0.26 (1.25) Household size 6.14 (3.10) 7.21 (3.60) 5.58 (2.84) 5.54 (2.67) 5.90 (2.66) # children under 5 in the household
1.92 (1.01) 2.18 (1.22) 1.86 (0.90) 1.77 (0.88) 1.80 (0.84)
Household head is male 0.67 (0.47) 0.67 (0.47) 0.64 (0.48) 0.65 (0.48) 0.74 (0.44)

43
Age of household head 40.36 (14.09) 43.18 (15.11)
37.70 (12.78) 38.97 (13.53) 40.57 (13.79)
NA=Non available

44
Table 2: Trends in prevalence of malnutrition in Ghana, 1988-2003 1988 1993 1998 2003 Stunting (% HAZ < -2 SDs) 30.0 (1.1) 26.8 (1.1) 20.6 (1.0) 27.4 (1.0) Underweight (% WAZ < -2 SDs) 30.3 (1.1) 28.2 (1.1) 25.7 (1.1) 24.1 (1.0) Wasting (% WHZ < -2 SDs) 7.7 (0.6) 12.0 (0.8) 13.2 (0.8) 9.7 (0.7) Standard errors are in parentheses.
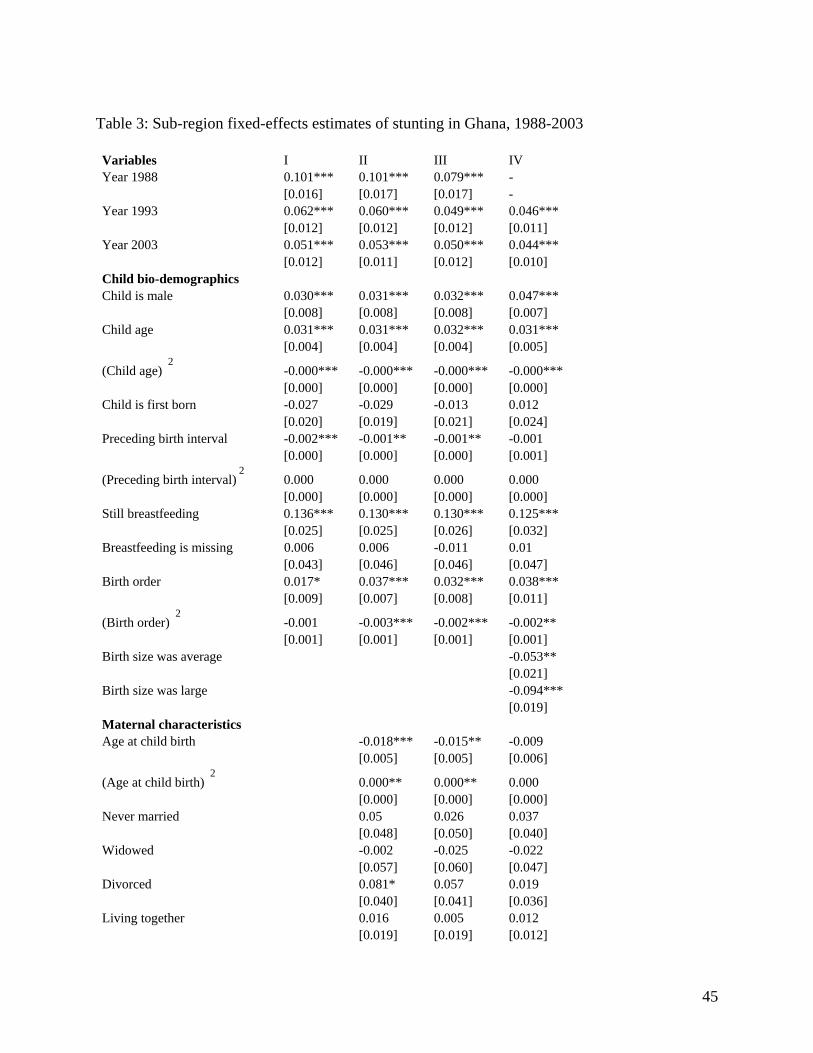
45
Table 3: Sub-region fixed-effects estimates of stunting in Ghana, 1988-2003 Variables I II III IV Year 1988 0.101*** 0.101*** 0.079*** - [0.016] [0.017] [0.017] - Year 1993 0.062*** 0.060*** 0.049*** 0.046*** [0.012] [0.012] [0.012] [0.011] Year 2003 0.051*** 0.053*** 0.050*** 0.044*** [0.012] [0.011] [0.012] [0.010] Child bio-demographics Child is male 0.030*** 0.031*** 0.032*** 0.047*** [0.008] [0.008] [0.008] [0.007] Child age 0.031*** 0.031*** 0.032*** 0.031*** [0.004] [0.004] [0.004] [0.005]
(Child age) 2
-0.000*** -0.000*** -0.000*** -0.000*** [0.000] [0.000] [0.000] [0.000] Child is first born -0.027 -0.029 -0.013 0.012 [0.020] [0.019] [0.021] [0.024] Preceding birth interval -0.002*** -0.001** -0.001** -0.001 [0.000] [0.000] [0.000] [0.001]
(Preceding birth interval)2
0.000 0.000 0.000 0.000 [0.000] [0.000] [0.000] [0.000] Still breastfeeding 0.136*** 0.130*** 0.130*** 0.125*** [0.025] [0.025] [0.026] [0.032] Breastfeeding is missing 0.006 0.006 -0.011 0.01 [0.043] [0.046] [0.046] [0.047] Birth order 0.017* 0.037*** 0.032*** 0.038*** [0.009] [0.007] [0.008] [0.011]
(Birth order) 2
-0.001 -0.003*** -0.002*** -0.002** [0.001] [0.001] [0.001] [0.001] Birth size was average -0.053** [0.021] Birth size was large -0.094*** [0.019] Maternal characteristics Age at child birth -0.018*** -0.015** -0.009 [0.005] [0.005] [0.006]
(Age at child birth) 2
0.000** 0.000** 0.000 [0.000] [0.000] [0.000] Never married 0.05 0.026 0.037 [0.048] [0.050] [0.040] Widowed -0.002 -0.025 -0.022 [0.057] [0.060] [0.047] Divorced 0.081* 0.057 0.019 [0.040] [0.041] [0.036] Living together 0.016 0.005 0.012 [0.019] [0.019] [0.012]
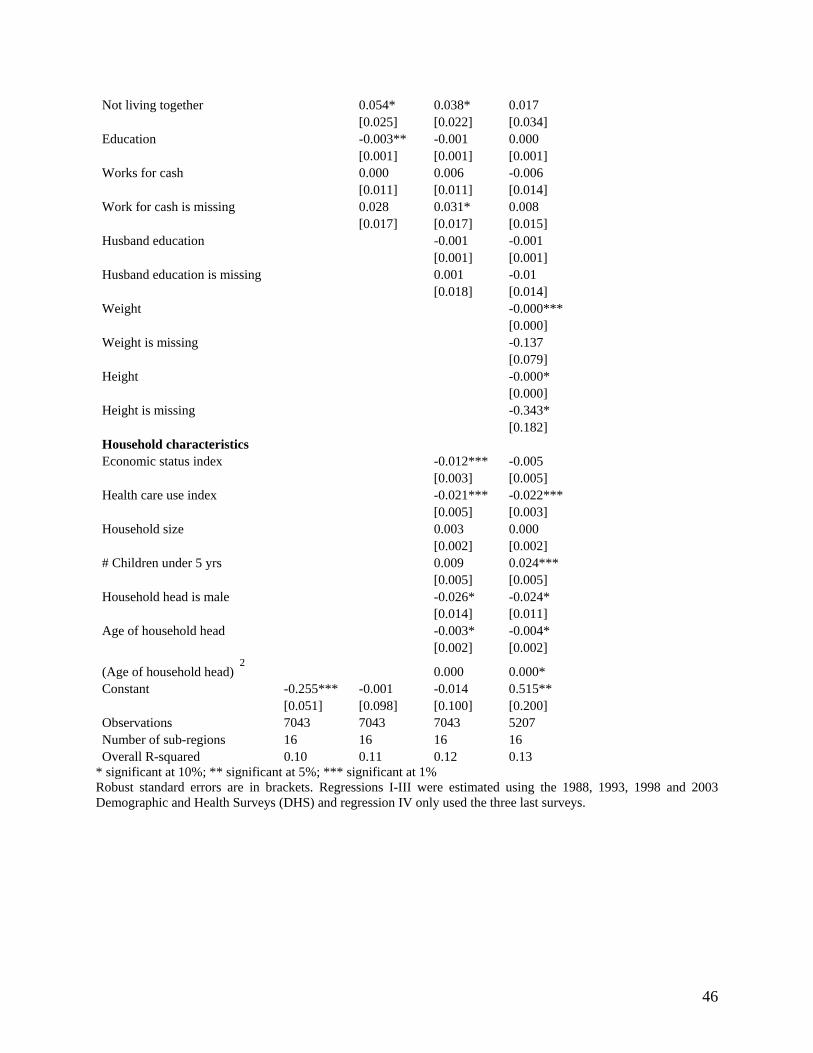
46
Not living together 0.054* 0.038* 0.017 [0.025] [0.022] [0.034] Education -0.003** -0.001 0.000 [0.001] [0.001] [0.001] Works for cash 0.000 0.006 -0.006 [0.011] [0.011] [0.014] Work for cash is missing 0.028 0.031* 0.008 [0.017] [0.017] [0.015] Husband education -0.001 -0.001 [0.001] [0.001] Husband education is missing 0.001 -0.01 [0.018] [0.014] Weight -0.000*** [0.000] Weight is missing -0.137 [0.079] Height -0.000* [0.000] Height is missing -0.343* [0.182] Household characteristics Economic status index -0.012*** -0.005 [0.003] [0.005] Health care use index -0.021*** -0.022*** [0.005] [0.003] Household size 0.003 0.000 [0.002] [0.002] # Children under 5 yrs 0.009 0.024*** [0.005] [0.005] Household head is male -0.026* -0.024* [0.014] [0.011] Age of household head -0.003* -0.004* [0.002] [0.002]
(Age of household head) 2
0.000 0.000* Constant -0.255*** -0.001 -0.014 0.515** [0.051] [0.098] [0.100] [0.200] Observations 7043 7043 7043 5207 Number of sub-regions 16 16 16 16 Overall R-squared 0.10 0.11 0.12 0.13
* significant at 10%; ** significant at 5%; *** significant at 1% Robust standard errors are in brackets. Regressions I-III were estimated using the 1988, 1993, 1998 and 2003 Demographic and Health Surveys (DHS) and regression IV only used the three last surveys.
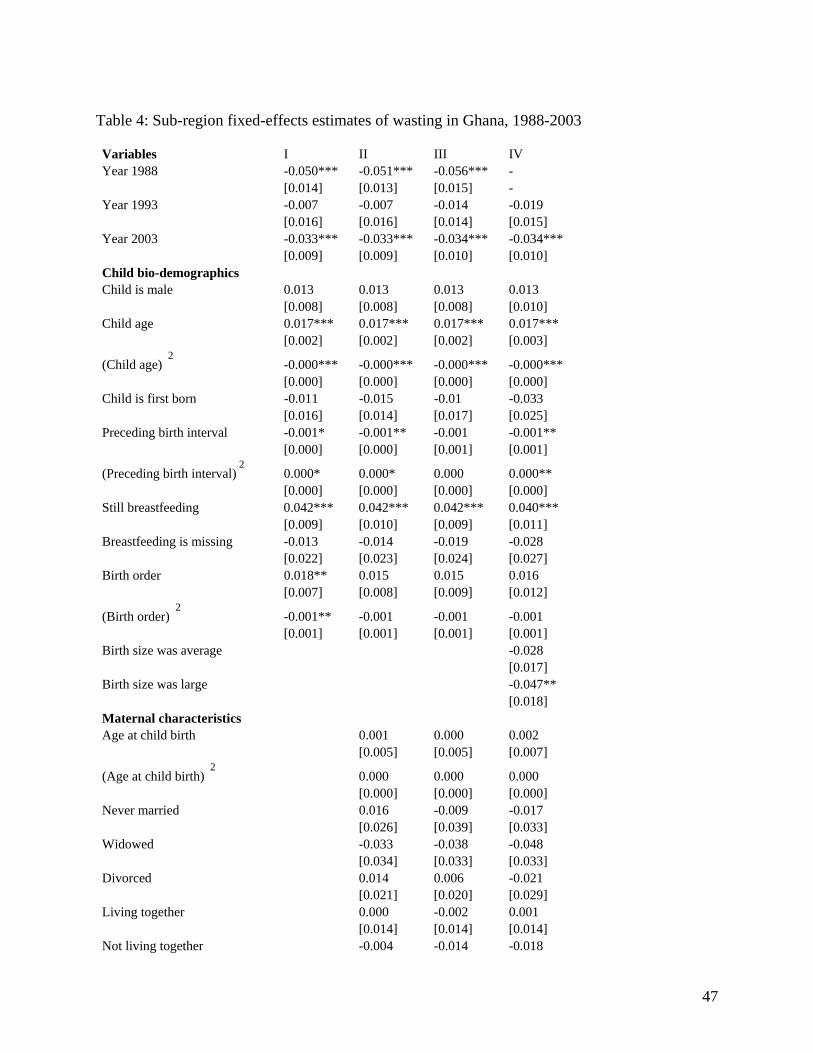
47
Table 4: Sub-region fixed-effects estimates of wasting in Ghana, 1988-2003 Variables I II III IV Year 1988 -0.050*** -0.051*** -0.056*** - [0.014] [0.013] [0.015] - Year 1993 -0.007 -0.007 -0.014 -0.019 [0.016] [0.016] [0.014] [0.015] Year 2003 -0.033*** -0.033*** -0.034*** -0.034*** [0.009] [0.009] [0.010] [0.010] Child bio-demographics Child is male 0.013 0.013 0.013 0.013 [0.008] [0.008] [0.008] [0.010] Child age 0.017*** 0.017*** 0.017*** 0.017*** [0.002] [0.002] [0.002] [0.003]
(Child age) 2
-0.000*** -0.000*** -0.000*** -0.000*** [0.000] [0.000] [0.000] [0.000] Child is first born -0.011 -0.015 -0.01 -0.033 [0.016] [0.014] [0.017] [0.025] Preceding birth interval -0.001* -0.001** -0.001 -0.001** [0.000] [0.000] [0.001] [0.001]
(Preceding birth interval)2
0.000* 0.000* 0.000 0.000** [0.000] [0.000] [0.000] [0.000] Still breastfeeding 0.042*** 0.042*** 0.042*** 0.040*** [0.009] [0.010] [0.009] [0.011] Breastfeeding is missing -0.013 -0.014 -0.019 -0.028 [0.022] [0.023] [0.024] [0.027] Birth order 0.018** 0.015 0.015 0.016 [0.007] [0.008] [0.009] [0.012]
(Birth order) 2
-0.001** -0.001 -0.001 -0.001 [0.001] [0.001] [0.001] [0.001] Birth size was average -0.028 [0.017] Birth size was large -0.047** [0.018] Maternal characteristics Age at child birth 0.001 0.000 0.002 [0.005] [0.005] [0.007]
(Age at child birth) 2
0.000 0.000 0.000 [0.000] [0.000] [0.000] Never married 0.016 -0.009 -0.017 [0.026] [0.039] [0.033] Widowed -0.033 -0.038 -0.048 [0.034] [0.033] [0.033] Divorced 0.014 0.006 -0.021 [0.021] [0.020] [0.029] Living together 0.000 -0.002 0.001 [0.014] [0.014] [0.014] Not living together -0.004 -0.014 -0.018

48
[0.023] [0.026] [0.033] Education -0.001 -0.001 -0.002* [0.001] [0.001] [0.001] Works for cash -0.004 -0.002 -0.005 [0.008] [0.009] [0.010] Work for cash is missing 0.004 0.004 -0.005 [0.014] [0.015] [0.017] Husband education 0.001 0.002** [0.001] [0.001] Husband education is missing 0.021 0.027* [0.014] [0.014] Weight -0.000*** [0.000] Weight is missing -0.197*** [0.028] Height 0.000 [0.000] Height is missing -0.003 [0.049] Household characteristics Economic status index 0.001 -0.008** [0.002] [0.002] Health care use index -0.005* 0.003 [0.003] [0.004] Household size 0.000 -0.001 [0.002] [0.002] # Children under 5 yrs 0.004 0.003 [0.005] [0.006] Household head is male -0.012 -0.012 [0.008] [0.009] Age of household head 0.002** 0.002 [0.001] [0.001]
(Age of household head) 2
0.000 0.000 [0.000] [0.000] Constant -0.031 -0.041 -0.088 0.032 [0.029] [0.061] [0.065] [0.112] Observations 7297 7297 7297 5330 Number of sub-regions 16 16 16 16 Overall R-squared 0.03 0.03 0.03 0.04
* significant at 10%; ** significant at 5%; *** significant at 1% Robust standard errors are in brackets. Regressions I-III were estimated using the 1988, 1993, 1998 and 2003 Demographic and Health Surveys (DHS) and regression IV only used the three last surveys.

49
Table 5: Sub-region fixed-effects estimates of underweight in Ghana, 1988-2003 Variables I II III IV Year 1988 0.053*** 0.045** 0.031* - [0.014] [0.016] [0.017] - Year 1993 0.027* 0.024* 0.017 0.01 [0.013] [0.013] [0.013] [0.016] Year 2003 -0.034** -0.032** -0.035** -0.041** [0.014] [0.014] [0.015] [0.016] Child bio-demographics Child is male 0.008 0.009 0.01 0.022 [0.011] [0.012] [0.012] [0.013] Child age 0.042*** 0.042*** 0.043*** 0.040*** [0.004] [0.004] [0.004] [0.005]
(Child age) 2
-0.001*** -0.001*** -0.001*** -0.001*** [0.000] [0.000] [0.000] [0.000] Child is first born -0.026 -0.026 -0.023 -0.037 [0.028] [0.030] [0.031] [0.033] Preceding birth interval -0.002** -0.001** -0.001** -0.002*** [0.001] [0.001] [0.001] [0.000]
(Preceding birth interval)2
0.000* 0.000* 0.000* 0.000*** [0.000] [0.000] [0.000] [0.000] Still breastfeeding 0.161*** 0.156*** 0.157*** 0.144*** [0.021] [0.021] [0.021] [0.025] Breastfeeding is missing 0.009 0.007 -0.004 0.014 [0.052] [0.055] [0.055] [0.057] Birth order 0.016* 0.035*** 0.030*** 0.032** [0.008] [0.008] [0.009] [0.013]
(Birth order) 2
-0.001 -0.002* -0.002 -0.002 [0.001] [0.001] [0.001] [0.001] Birth size was average -0.097*** [0.018] Birth size was large -0.141*** [0.017] Maternal characteristics Age at child birth -0.014** -0.013** -0.007 [0.006] [0.006] [0.008]
(Age at child birth) 2
0.000 0.000 0.000 [0.000] [0.000] [0.000] Never married 0.052 0.04 0.023 [0.039] [0.046] [0.050] Widowed 0.012 -0.01 -0.027 [0.043] [0.044] [0.050] Divorced 0.007 -0.007 -0.034 [0.031] [0.032] [0.035] Living together 0.021 0.014 0.009 [0.017] [0.017] [0.021]

50
Not living together 0.053** 0.044* 0.042 [0.025] [0.022] [0.028] Education -0.002 0.000 -0.001 [0.002] [0.002] [0.002] Works for cash -0.025* -0.021 -0.022* [0.014] [0.013] [0.013] Work for cash is missing 0.003 0.005 -0.01 [0.021] [0.021] [0.019] Husband education -0.001 0.000 [0.001] [0.001] Husband education is missing -0.005 -0.008 [0.014] [0.017] Weight -0.001*** [0.000] Weight is missing -0.327*** [0.097] Height 0.000 [0.000] Height is missing -0.227 [0.138] Household characteristics Economic status index -0.008** -0.019*** [0.003] [0.003] Health care use index -0.019*** -0.001 [0.005] [0.006] Household size 0.003 0.000 [0.002] [0.003] # Children under 5 yrs -0.001 0.007 [0.004] [0.009] Household head is male -0.022 -0.013 [0.018] [0.013] Age of household head 0.000 -0.002 [0.002] [0.001]
(Age of household head) 2
0.000 0.000 [0.000] [0.000] Constant -0.246*** -0.037 -0.037 0.467** [0.068] [0.098] [0.101] [0.211] Observations 7043 7043 7043 5207 Number of sub-regions 16 16 16 16 Overall R-squared 0.08 0.08 0.09 0.11
* significant at 10%; ** significant at 5%; *** significant at 1% Robust standard errors are in brackets. Regressions I-III were estimated using the 1988, 1993, 1998 and 2003 Demographic and Health Surveys (DHS) and regression IV only used the three last surveys.
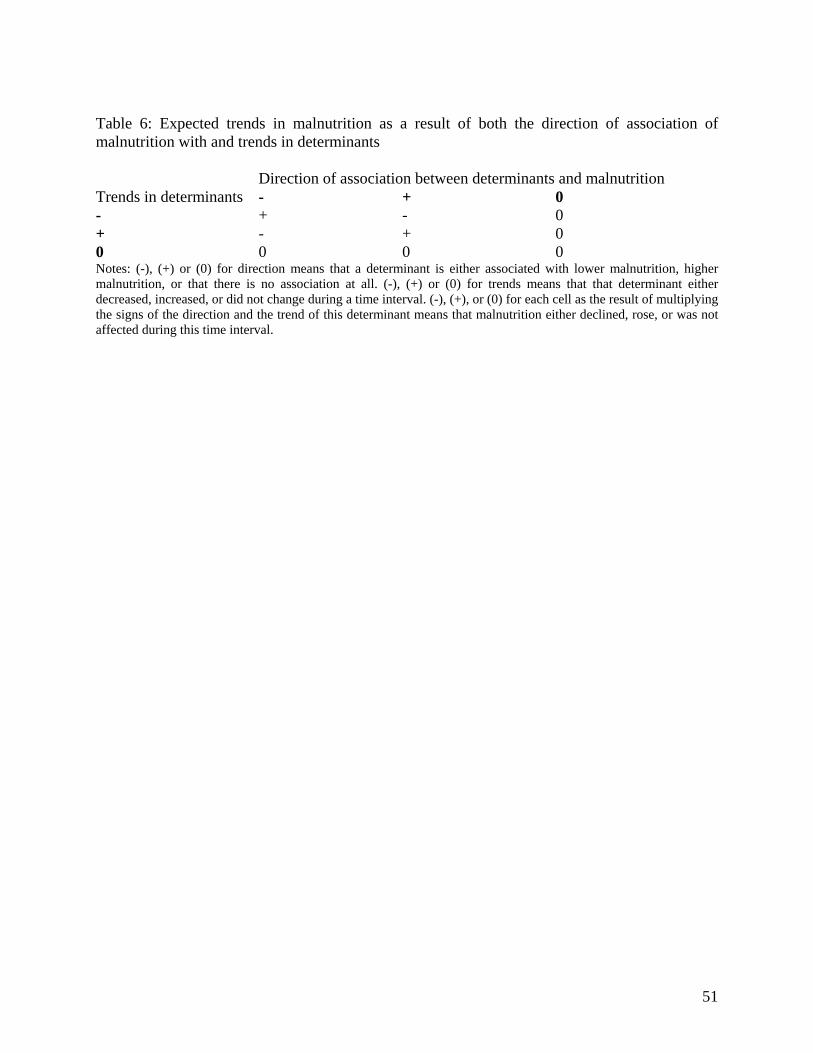
51
Table 6: Expected trends in malnutrition as a result of both the direction of association of malnutrition with and trends in determinants Direction of association between determinants and malnutrition Trends in determinants - + 0 - + - 0 + - + 0 0 0 0 0 Notes: (-), (+) or (0) for direction means that a determinant is either associated with lower malnutrition, higher malnutrition, or that there is no association at all. (-), (+) or (0) for trends means that that determinant either decreased, increased, or did not change during a time interval. (-), (+), or (0) for each cell as the result of multiplying the signs of the direction and the trend of this determinant means that malnutrition either declined, rose, or was not affected during this time interval.
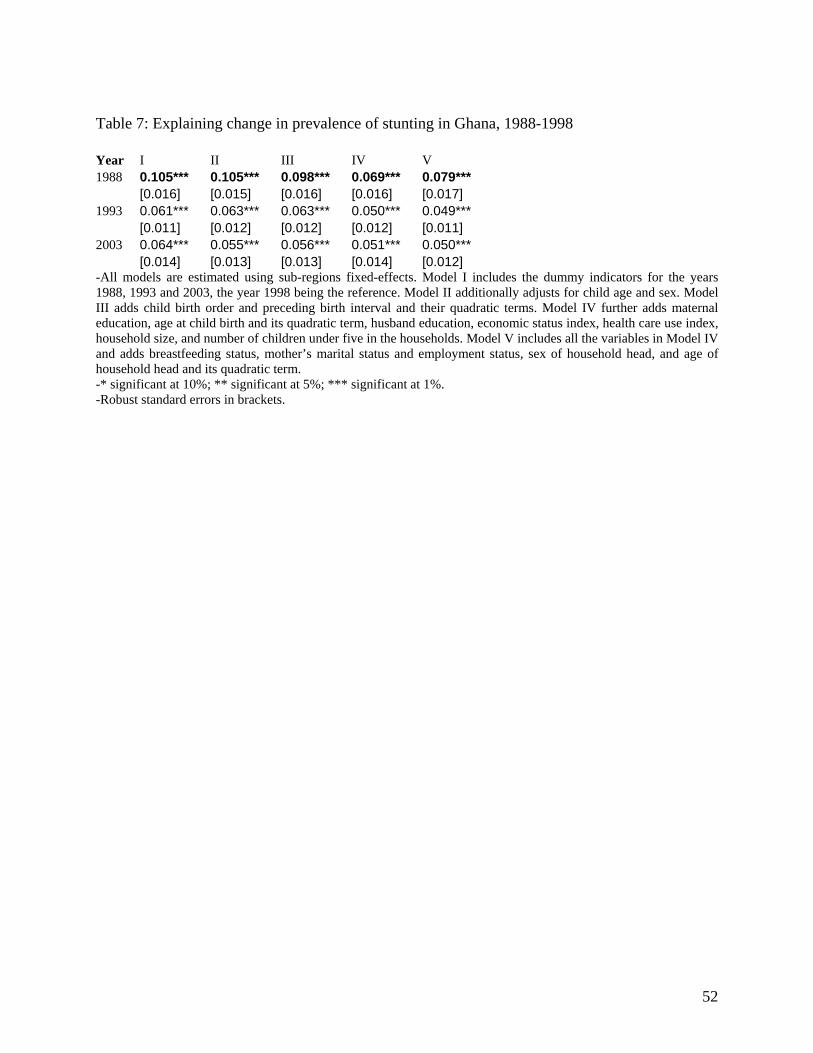
52
Table 7: Explaining change in prevalence of stunting in Ghana, 1988-1998 Year I II III IV V 1988 0.105*** 0.105*** 0.098*** 0.069*** 0.079*** [0.016] [0.015] [0.016] [0.016] [0.017] 1993 0.061*** 0.063*** 0.063*** 0.050*** 0.049*** [0.011] [0.012] [0.012] [0.012] [0.011] 2003 0.064*** 0.055*** 0.056*** 0.051*** 0.050*** [0.014] [0.013] [0.013] [0.014] [0.012] -All models are estimated using sub-regions fixed-effects. Model I includes the dummy indicators for the years 1988, 1993 and 2003, the year 1998 being the reference. Model II additionally adjusts for child age and sex. Model III adds child birth order and preceding birth interval and their quadratic terms. Model IV further adds maternal education, age at child birth and its quadratic term, husband education, economic status index, health care use index, household size, and number of children under five in the households. Model V includes all the variables in Model IV and adds breastfeeding status, mother’s marital status and employment status, sex of household head, and age of household head and its quadratic term. -* significant at 10%; ** significant at 5%; *** significant at 1%. -Robust standard errors in brackets.
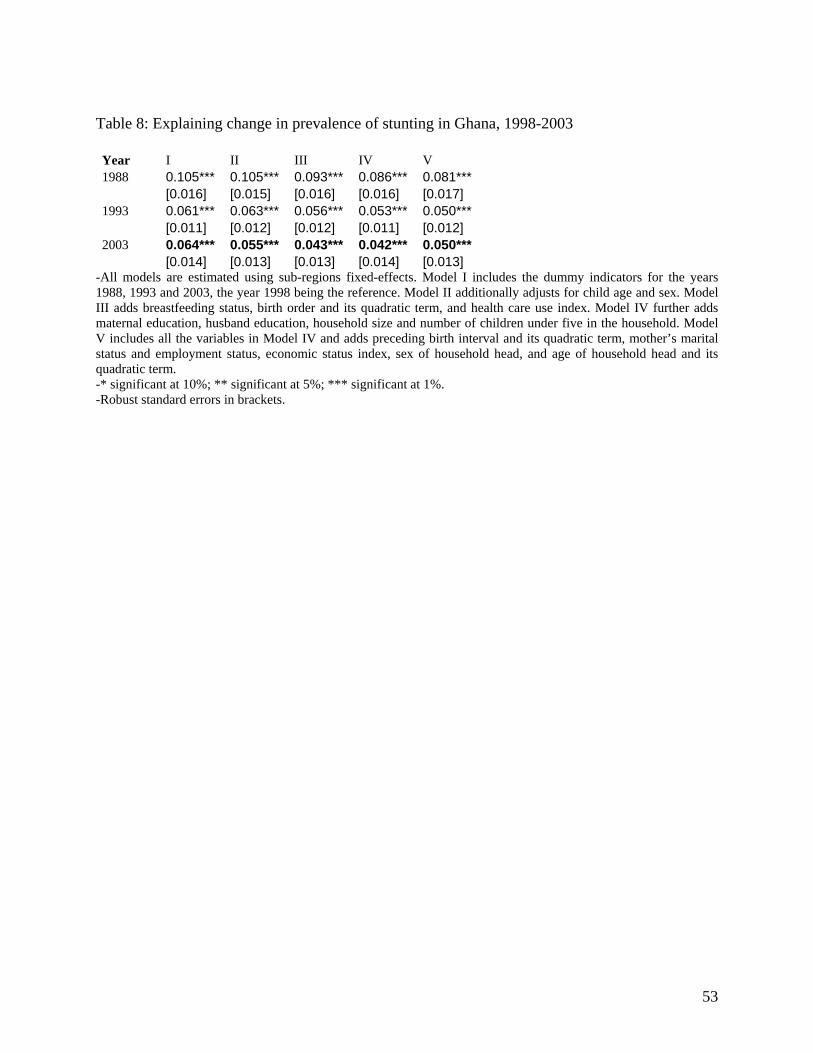
53
Table 8: Explaining change in prevalence of stunting in Ghana, 1998-2003 Year I II III IV V 1988 0.105*** 0.105*** 0.093*** 0.086*** 0.081*** [0.016] [0.015] [0.016] [0.016] [0.017] 1993 0.061*** 0.063*** 0.056*** 0.053*** 0.050*** [0.011] [0.012] [0.012] [0.011] [0.012] 2003 0.064*** 0.055*** 0.043*** 0.042*** 0.050*** [0.014] [0.013] [0.013] [0.014] [0.013]
-All models are estimated using sub-regions fixed-effects. Model I includes the dummy indicators for the years 1988, 1993 and 2003, the year 1998 being the reference. Model II additionally adjusts for child age and sex. Model III adds breastfeeding status, birth order and its quadratic term, and health care use index. Model IV further adds maternal education, husband education, household size and number of children under five in the household. Model V includes all the variables in Model IV and adds preceding birth interval and its quadratic term, mother’s marital status and employment status, economic status index, sex of household head, and age of household head and its quadratic term. -* significant at 10%; ** significant at 5%; *** significant at 1%. -Robust standard errors in brackets.
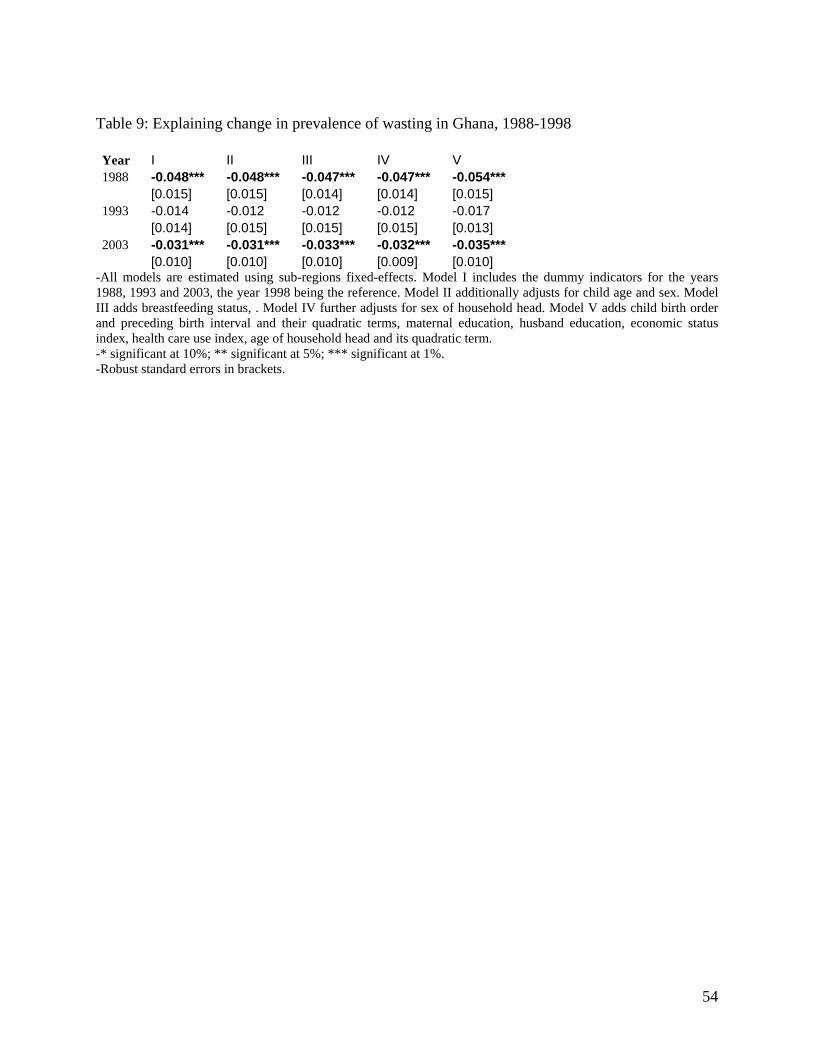
54
Table 9: Explaining change in prevalence of wasting in Ghana, 1988-1998 Year I II III IV V 1988 -0.048*** -0.048*** -0.047*** -0.047*** -0.054*** [0.015] [0.015] [0.014] [0.014] [0.015] 1993 -0.014 -0.012 -0.012 -0.012 -0.017 [0.014] [0.015] [0.015] [0.015] [0.013] 2003 -0.031*** -0.031*** -0.033*** -0.032*** -0.035*** [0.010] [0.010] [0.010] [0.009] [0.010]
-All models are estimated using sub-regions fixed-effects. Model I includes the dummy indicators for the years 1988, 1993 and 2003, the year 1998 being the reference. Model II additionally adjusts for child age and sex. Model III adds breastfeeding status, . Model IV further adjusts for sex of household head. Model V adds child birth order and preceding birth interval and their quadratic terms, maternal education, husband education, economic status index, health care use index, age of household head and its quadratic term. -* significant at 10%; ** significant at 5%; *** significant at 1%. -Robust standard errors in brackets.
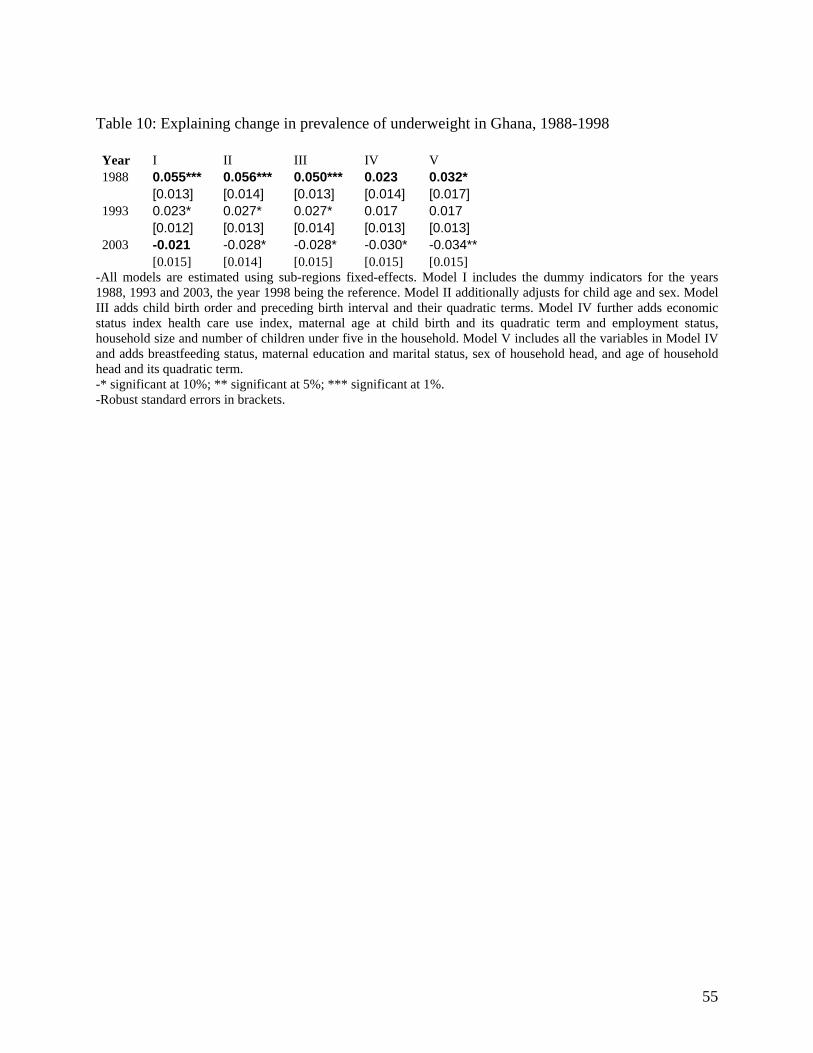
55
Table 10: Explaining change in prevalence of underweight in Ghana, 1988-1998 Year I II III IV V 1988 0.055*** 0.056*** 0.050*** 0.023 0.032* [0.013] [0.014] [0.013] [0.014] [0.017] 1993 0.023* 0.027* 0.027* 0.017 0.017 [0.012] [0.013] [0.014] [0.013] [0.013] 2003 -0.021 -0.028* -0.028* -0.030* -0.034** [0.015] [0.014] [0.015] [0.015] [0.015]
-All models are estimated using sub-regions fixed-effects. Model I includes the dummy indicators for the years 1988, 1993 and 2003, the year 1998 being the reference. Model II additionally adjusts for child age and sex. Model III adds child birth order and preceding birth interval and their quadratic terms. Model IV further adds economic status index health care use index, maternal age at child birth and its quadratic term and employment status, household size and number of children under five in the household. Model V includes all the variables in Model IV and adds breastfeeding status, maternal education and marital status, sex of household head, and age of household head and its quadratic term. -* significant at 10%; ** significant at 5%; *** significant at 1%. -Robust standard errors in brackets.
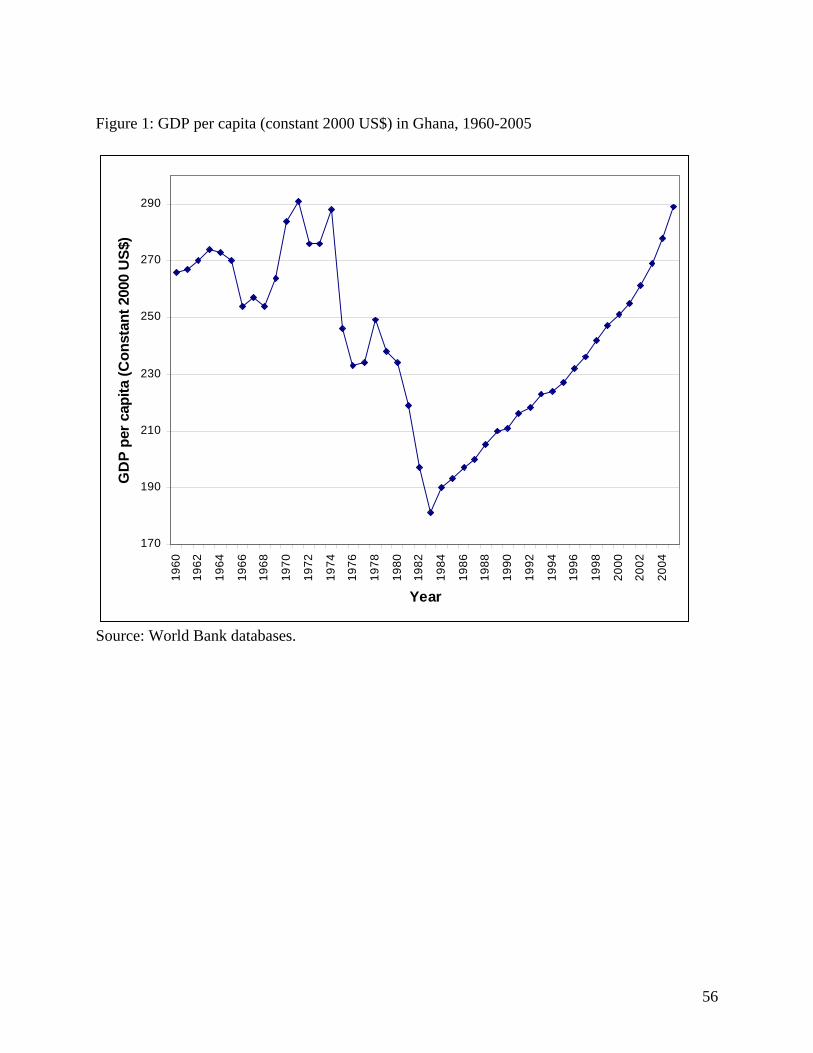
56
Figure 1: GDP per capita (constant 2000 US$) in Ghana, 1960-2005
170
190
210
230
250
270
290
1960
1962
1964
1966
1968
1970
1972
1974
1976
1978
1980
1982
1984
1986
1988
1990
1992
1994
1996
1998
2000
2002
2004
Year
GD
P pe
r cap
ita (C
onst
ant 2
000
US$
)
Source: World Bank databases.

57
Figure 2: Annual inflation rate (consumer prices) in Ghana, 1965-2005
-20
0
20
40
60
80
100
120
14019
65
1967
1969
1971
1973
1975
1977
1979
1981
1983
1985
1987
1989
1991
1993
1995
1997
1999
2001
2003
2005
Year
Ann
ual i
nfla
tion
rate
Source: World Bank databases.
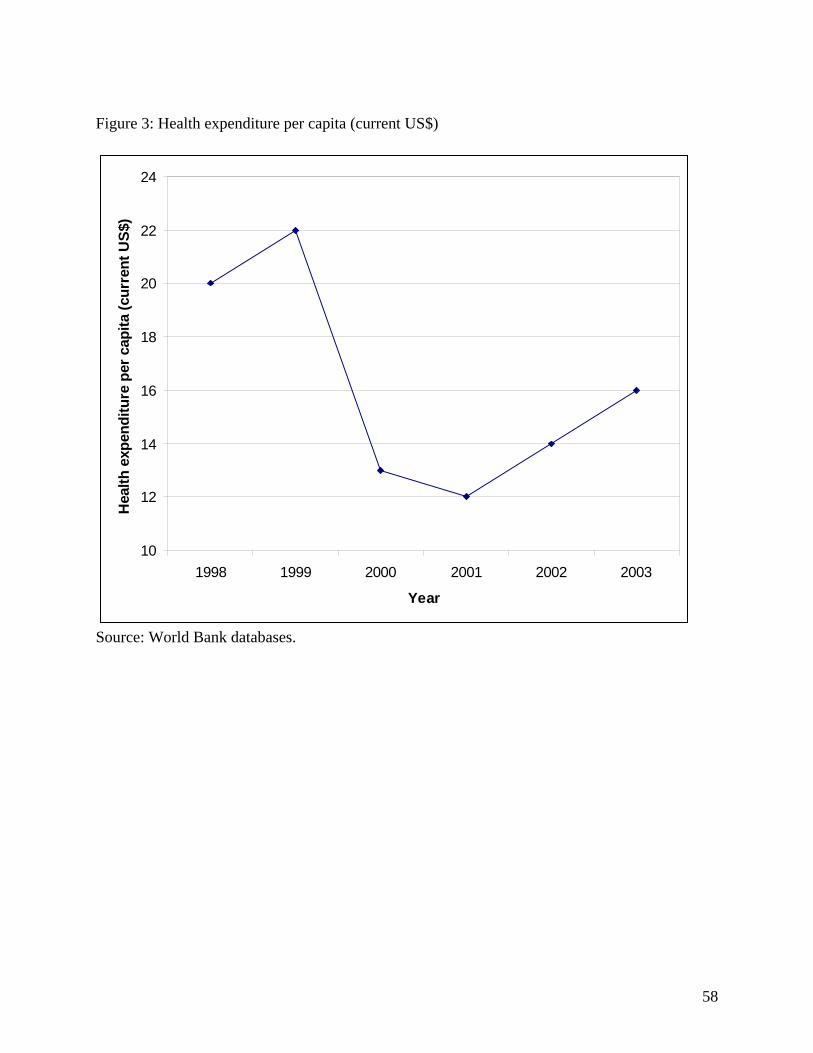
58
Figure 3: Health expenditure per capita (current US$)
10
12
14
16
18
20
22
24
1998 1999 2000 2001 2002 2003
Year
Hea
lth e
xpen
ditu
re p
er c
apita
(cur
rent
US$
)
Source: World Bank databases.
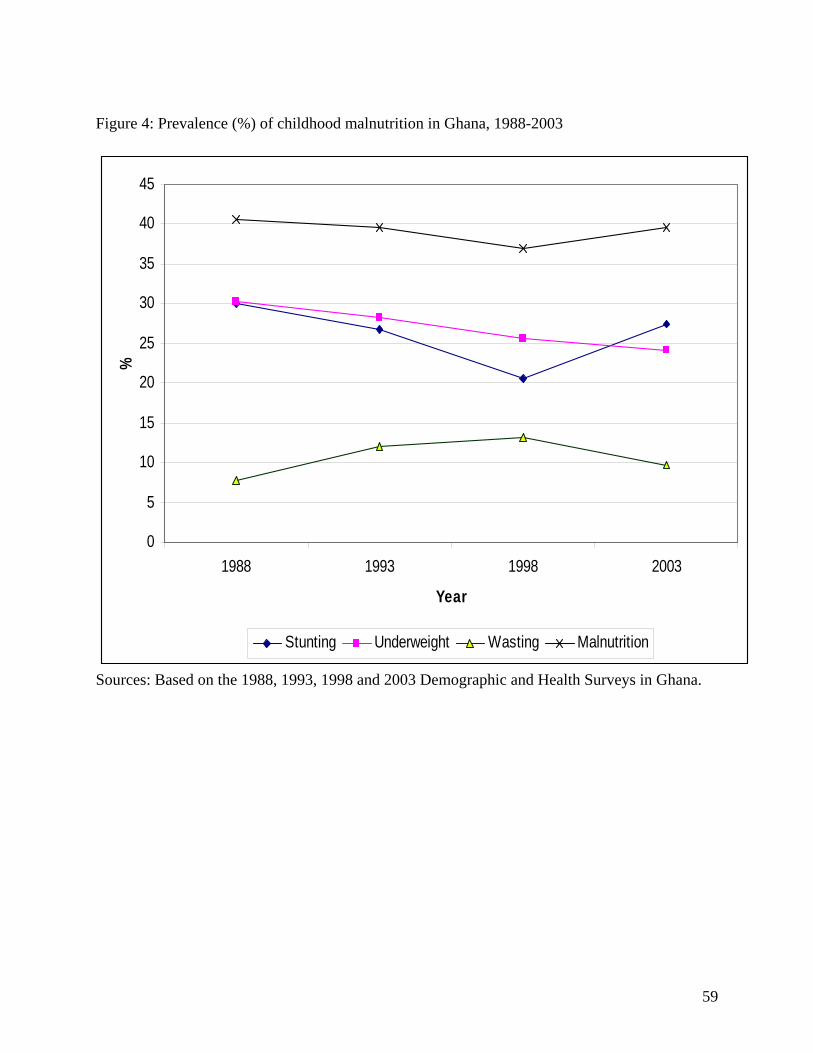
59
Figure 4: Prevalence (%) of childhood malnutrition in Ghana, 1988-2003
0
5
10
15
20
25
30
35
40
45
1988 1993 1998 2003
Year
%
Stunting Underweight Wasting Malnutrition
Sources: Based on the 1988, 1993, 1998 and 2003 Demographic and Health Surveys in Ghana.