Embed Size (px)
Citation preview
Educational Evaluation and Policy AnalysisWinter 2002, Vol. 24, No. 4, pp. 305-331
Does External Accountability Affect Student Outcomes?A Cross-State Analysis
Martin CarnoySusanna Loeb
Stanford University
We developed a zero-to-five index of the strength of accountability in 50 states based on the use of high-
stakes testing to sanction and reward schools, and analyzed whether that index is related to student gains
on the NAEP mathematics test in 1996-2000. The study also relates the index to changes in student
retention in the 9th grade and to changes in high school completion rates over the same period. The
results show that students in high-accountability states averaged significantly greater gains on the NAEP
8th-grade math test than students in states with little or no state measures to improve student perfor-
mance. Furthermore, students in high-accountability states do not have significantly higher retention
or lower high school completion rates.
Keywords: capacity building, external accountability, high school survival rates, high stakes, inclusionl
exclusion, retention rates, standards-based reforms, state assessment, student performance, test scores
THE current wave of assessment-based schoolaccountability reforms combines two traditionsin American education-public accountabilityand student testing. The combination seems to bechanging what schools do and how they do it.Strong accountability increases state control,even as other reforms, such as charter schoolsand choice plans, strive to decentralize educa-tional decision-making. This article examinesfactors associated with stronger accountabilityand asks whether stronger statewide approachesto accountability achieve their declared goal ofimproving student outcomes.
Students' performance on tests is the main mea-sure states use for gauging educational improve-ment. However, improvements on state tests maynot be an accurate measure of educational gains,
since schools may substitute for more durablestudent learning by using strategies to increaseperformance on the particular testing instrument.Because of this, it is important to use altemativemeasures to gauge the success of these policies. Inthis article, we use a variety of measures of aver-age student performance at the state level, includ-ing National Association of Educational Progress(NAEP) math test scores, 9th-grade retention rates,and high school survival rates (the proportion ofstudents who reach the 12th grade).
We are interested in five questions:
1. Do states adopting strong accountabilitymeasures have different characteristics from stateswithout such measures? In particular, are therefactors that influence which states adopt strong
Funding was provided by OERI under a grant to the Consortium for Policy Research in Education (CPRE). The authors would
like to thank Paula Razquin and Tiffany Smith for their invaluable help in developing the enrollment data used in the article. We
would also like to thank CPRE's Susan Fuhrman and Margaret Goertz, as well as the anonymous EEPA reviewers, for their use-
ful comments, and Don McLaughlin of the American Institutes of Research, Palo Alto, CA, and Arnold Goldstein of the National
Center of Educational Statistics in Washington, D.C., for their crucial help regarding the NAEP results. The analysis of the data
and interpretations expressed in this article are wholly the authors and should not he attributed either to OERI or CPRE.
305
Carnoy and Loeb
accountability that also independently affectlater student outcomes? This analysis is impor-tant for assessing whether our subsequent as-sessment of the relationship between account-ability and student performance may be drivenby an underlying factor that influenced imple-mentation, as well as for identifying controls touse in these analyses.
2. Do states with strong accountability sys-tems see larger increases in national assessmenttest results?
3. Do states with strong accountability see in-creases in their retention rates in 9th grade rela-tive to states with weak accountability? Oncethese systems are implemented, they are sup-posed to improve the likelihood that students fin-ish high school. But according to some analysts,the pressure on schools to do well on high schoolminimum competency tests pushes administra-tors and teachers to increase retention rates in thefirst year of high school (Haney, 2000).
4. Do high school progression rates in stateswith strong accountability increase or decreaserelative to progression rates in states with weakaccountability? If accountability raises studentperformnance in the earlier grades, this should ul-timately raise the proportion completing highschool; if, however, strong accountability in-creases retention rates in earlier grades, it couldwell reduce survival rates.
5. Does the relationship between accountabil-ity and student outcomes differ between racial/ethnic groups?
Standards-Based Reformand the Role of Testing
In the past, accountability and assessmentwere only loosely connected. Assessment wasused mainly to divide students into academictracks or for diagnostic purposes, helping schooladministrators and teachers see whether studentswere learning loosely defined state curricula. Ac-countability has traditionally been based in com-munity participation and parent control, as rep-resented by local school boards. Schools havebeen accountable to district administrators, who,in tum, answer to elected boards.' Parents havealso been able to influence schools directly. Schooltest results enter into parental decisions on whereto live and fuel parent criticisms of school boardactions, especially in higher income neighbor-hoods.2 The link between traditional local ac-
306
countability and traditional student assessmenthas long been important in neighborhoods withhigh parent participation. In the majority ofschools, however, this link has either been indi-rect, acting through family residential choice, orpractically nonexistent. It has been especiallyweak in low-income communities and large urbanschool districts.
The use of student testing at the state levelwith consequences for students and even as ameasure of school performance is also not new.New York has used Regent examinations to teststudents' command of high school curriculumsince the 19th century. The Iowa Test of BasicSkills (ITBS) has been given to 8th graders inIowa since 1935. It was subsequently applied inmany other states for students in many grades.However, the purpose of the ITBS was (and inIowa, continues to be) diagnostic. How wellstudents, classes, or schools performed on ITBS-type tests had few consequences. Schools storedthe data, and school results were often publishedin local newspapers, but few administrators werecompelled to take action because of declinesin scores or continued low performance. High-stakes testing, such as the Regents, the Scholas-tic Aptitude Test (SAT), or Advanced Placement(AP) tests, were mainly related to college en-trance and focused on individual student perfor-mance, not school performance. Even so, JohnBishop has tried to develop an empirical case thatsuch individual tests have had positive effects onoverall student performance, since students un-derstand the benefits of perfonning well on thesetests and getting students to pass them is part ofschools' objectives (Bishop, 1998).
Texas was a pioneer in using a state assess-ment test in order to measure school performancedirectly and both to sanction those schools notmeeting improvement norms and to rewardschools exceeding norms. Other states, such asSouth Carolina and North Carolina began imple-menting such systems a few years later.
Based on these new types of state account-ability systems, educators developed the notionof standards-based reform in the late 1980s.They incorporated two main concepts: aligmnentand capacity building (Smith, O'Day, & Cohen1990; O'Day & Smith, 1993). Alignment meansthat, in order to focus on improving outcomes,school systems need to set clear standards andalign curriculum and accountability mechanisms
Does External Accountability Affect Student Outcomes? A Cross-State Analysis
with those standards. For example, if the com-munity feels that all students should learn to readat a certain level or better by 3rd grade, that levelhas to be clearly defined for parents and teachersand curriculum has to be designed to meet thatstandard. The assessment system should be alignedwith the curriculum to measure what teachers aresupposed to be teaching, and the accountabilitymechanisms need to provide incentives and sanc-tions aligned with success or failure in achievingthe standard. Testing students on the standards-based curriculum is meant to measure how wellthe system is meeting standards.
The second concept is capacity building.Standards-based reform does not necessarilyassume that alignment alone can improve edu-cation. Educational reform needs to improvethe capacity of.teachers and administrators todeliver better education. Coherent organization,built around aligned standards and assessment,can produce the increased capacity to deliverimproved education. If teachers know what toteach, and the organization acts to support theirefforts to achieve the defined standard, this in-creases the collective capacity of the school orthe district to deliver education. Much of thepolicy literature on building capacity focuseson organizational change (Talbert, McLaughlin,& Rowan, 1993; Elmore, 1995; Cohen & Ball,1999). But, capacity is not just embedded inorganization.
Standards-based reform considers that an im-portant component of improving education isincreasing the "quality" of teachers and educa-tional administrators. "Quality" teachers need toknow the subject matter they are teaching and beeffective pedagogues. Principals and superinten-dents need to know how to manage schools andschool districts. Such outright skills also con-stitute capacity. For education in classroomsto improve, these skills also have to be raised(Darling-Hammond, 1997).
In the standards-based reform movement, test-ing is just one component of a much broader anddeeper set of sustained changes that proponentsclaim are needed for educational improvement tooccur. Testing can be used in several ways. It canbe an indicator to tell administrators and teacherswhether they are reaching the organization's goalsand to provide information on which elements ofthe curriculum are reaching students and whichare not. It can be used as a measure of success or
failure in an incentive system. It can be used as agauge to increase standards, to assess curricula,or to provide technical assistance. It can be usedas a mechanism to allocate additional resourcesin order to improve outcomes for groups havingdifficulty reaching the standard.
Testing in the states that implemented ac-countability systems has been used in several ofthese ways. But, in contrast with the 1984 Texasreform, which addressed a number of differentfacets of standards-based reform-including rais-ing teacher salaries from very low levels to attractbetter-prepared individuals into teaching-testinghas been the central element of most recently im-plemented accountability systems. Between 1980and 1996, per-pupil spending in Texas rose 60%adjusted for inflation compared to a 37% increasein spending per-pupil nationally. Increased re-sources have not been linked disproportionatelyto the implementation of accountability in moststates. With the focus on measurable and easilyunderstood results, test scores are rapidly becom-ing the end-all of state accountability reforms.This has generated considerable controversy re-garding their effect on student outcomes. 3
Which States are Likelyto Choose Strong Accountability?
In making average student scores on state testsa main gauge of school performance, state schoolofficials have shifted influence over teacher andprincipal behavior from local school boards anddistrict offices to the statehouse. The new account-ability reforms ratchet up the degree of centralstate power over schools and reduce local controlover school policy. Before assessing the impactof accountability on students, it is important toask what underlying conditions move politiciansand educational policy makers to shift schoolaccountability from local communities to stateregulatory agencies. By understanding the causesof implementation of accountability, we can de-sign more accurate models for estimating the re-lationship between accountability and studentoutcomes.
Analyzing why some states are more likely tolegislate and attempt to implement strong, out-come based state accountability systems is com-plex because states may vary in their motiva-tion.4 A number of studies in the past 30 yearshave attempted to model the diffusion of publicsector reforms (see, for example, Walker, 1969;
307
Carnoy and Loeb
Berry and Berry, 1990). More recently, Minstrom(2000) has modeled and tested the considera-tion and adoption of school choice legislation bystates in the period 1987-1993. He estimates thatthe main predictors of school choice adoptionare the actions of political actors that have a con-summate interest in pushing for greater choiceand those, notably teachers' unions, positionedagainst choice. His model does not include studentdemographics.5
In our analysis, we do not attempt specificallyto model the diffusion of standards-based re-forms. Rather, our purpose is to develop a recur-sive model of the effect of strength of account-ability on student performance, in which strengthof accountability is itself a function of variablesthat may affect student performance. For our pur-poses, only political, demographic, and edu-cational variables that could influence both thestrength of accountability reforms and possiblystudent outcomes are relevant. "Educational en-trepreneurs" no doubt also have had an effect onstandards-based reforms.6 However, because theentrepreneurs are unlikely to impact student out-comes independent of the reforms, we do notinclude these in our model. Other factors mayimpact both accountability strength and studentoutcomes. For example, if changing student testscores influence implementation then we mightattribute to accountability outcome changes thatare simply a continuation of a trend. Thus, it isimportant to assess the relationship betweenchanges in test scores prior to accountability andthe strength of the accountability system.
Demographic characteristics of states mayalso influence both accountability and studentoutcomes, as may resources available forschools. Further, states in which power is alreadymore centralized may have less of a political leapto make in implementing strong, state-led,assessment-based accountability reforms. Financ-ing and policy-making in southem states comparedto the North and West tended to be somewhatmore centralized 30 years ago than today.7 Casestudies of states such as Kentucky, Texas, andVermont also suggest that litigation challengingthe structural inequality of local educationalfinancing-inequality strongly related to racial/ethnic or social class composition of schooldistricts-was associated with reform tying as-sessment to state administered accountability(Rhoten et. al., 2003). Thus, we include popu-
308
lation, racial/ethnic composition, the percent ofschool revenues coming from the state, and rev-enue levels, as well as student test.scores, in ourmodel of accountability strength. Althoughthere is much to criticize in the way we specifyour model, we are limited by a small samplesize of only 50 states. Our estimates providegreater explanatory power than do Mintrom's(2000), albeit for a different reform.
Expected Outcomesof "Strong" Accountability
The expressed purpose of the new state ac-countability systems is to raise student achieve-ment and, more generally, to improve the qualityof schooling. By testing pupils, states hope toprovide performance benchmarks for schoolsthat would, in President Bush's words, "leave nochild behind." School administrators and teach-ers, exposed to scrutiny by published test scores,are expected to improve educational delivery toavoid "failing" and to gain the rewards of highacademic achievement. States with strong ac-countability systems reward schools that performwell on tests and send negative signals to thosethat do not. A clear measure of the effect of strongaccountability systems is thus whether they havea positive effect on test scores.'
The NAEP tests students approximately everyfour years in mathematics and reading at the 4thand 8th grades. These tests, designed at the fed-eral level and considered a reasonable assessmentof student knowledge in these subjects, have beenused by many analysts to gauge whether studentsare learning more or less over time. More re-cently (since 1990), NAEP scores have also beenavailable by state, although not every state par-ticipates in the assessment. Some states parti-cipate some years, and not in others. Since theNAEP math test was given in 1996 and 2000,it provides a good measure of whether state ac-countability systems-many of which came intobeing in the mid-1990s-are having a significanteffect on student learning outcomes.
The stated objective of higher standards (forexample, requiring all students to pass 9th-gradealgebra or biology to graduate from high school)and statewide assessment, including high schoolexit tests, is to increase schools' focus on howmuch students learn. This new focus may haveunintended consequences, at least in the shortand medium run. Raising the bar on student leam-
Does External Accountability Affect Student Outcomes? A Cross-State Analysis
ing in high school may make it more difficult forstudents to pass courses, hence increasing stu-dent retention and decreasing graduation rates.Dee (2002), analyzing the introduction of mini-mum competence testing and course graduationrequirements, found reductions in educational at-tainment, particularly for black students. Jacobs(2001) found similar results for low-achievingstudents in Chicago; and Lillard and DeCicca(2001) found that graduation requirements couldincrease dropout rates. In his analysis of Texasdata, Haney (2000) found that the implicit reten-
tion rates in the 9th grade (the number of 9thgrade students that remained classified as 9thgraders for a second year) increased steadily afterthe early 1980s to the mid-1990s for all ethnicgroups, but particularly for blacks and Hispanics.He associated this trend with the implementationof statewide assessment and particularly with theTexas Assessment of Academic Skills (TAAS)high school exit testing, first implemented in1991. We reanalyzed Texas enrollment data andconfirmed Haney's 9th-grade retention finding.However, we were not as convinced that increasedretention in 9th grade could be associated with theTAAS high school exit test, given in the 10thgrade. If there is a link between retention andstate policies in Texas it is likely to date back tothe implementation of accountability in a moregeneral sense and not to the current policy(Carnoy, Loeb, & Smith, 2001).9
Evidence of higher retention rates due to thenew focus on assessment is important because,at the individual level, retention is a strong pre-dictor of dropping out. For example, Rumberger(1995) shows that retained students are fourtimes more likely to drop out, even after control-ling for a host of background and school mea-sures. In Texas in the 1980s, increased 9th-graderetention rates were clearly associated with de-clining high school completion rates for allethnic groups (as measured by the ratio of thenumber of students graduating to the numberof students in the 8th grade four years earlier).Yet, graduation rates stopped declining in theearly 1990s, just as the 10th grade TAAS exit testwas implemented across the state; by the end ofthe 1990s, the graduation rate was rising. Thus, afew years after the implementation of the highschool exit test, retention rates had leveled offand graduation rates had begun to climb (Carnoy,Loeb, & Smith, 2001).
There are several possible explanations forthese Texas trends. One is that the exit test hasbeen easy enough or graded easily enough, sothat it has not affected the decision of studentswho would not have dropped out anyway. A sec-ond is that it has taken some years for the posi-tive effects of the accountability system to be feltin Texas high schools, so that the initial impactof stronger accountability through assessmentwas to increase retention rates, hence increasedropouts, but by the mid-1990s, student perfor-mance had improved sufficiently to increase grad-uation rates. Finally, financial resources mayhave played a role. As we mentioned earlier,Texas increased real spending per student muchmore than the national average in 1980-1996.The courts also mandated more equal distributionof spending across districts, and Texas beganto implement the court order in the early 1990s.Now that enough other states have implementedaccountability systems, we can use cross-stateanalysis to assess the relationship between thesereforms and both progression through high schooland performance on an independent measure ofachievement, NAEP.
Model
Our model is recursive. First, we estimate ac-countability implementation as a function of theaverage level of test scores in the state in the early1990s, test-score gains in the early 1990s, the per-cent of Latinos and African Americans in the state,the state population, the percent of school rev-enues raised at the state level in 1963 and 1995,average per-pupil revenues in 1990, and the yearlychange in revenues in the early 1990s.
Ai = PO +PIT +P2Ri +P3Pi +SiP4 +DiP5 +£, (1)
where
A = strength of accountability in state i (scaleof 0 to 5),
T = average scale score of 4th grade studentsin state i on the 1992 mathematics NAEP(in alternative specifications, we usethe percent basic in reading and thechange in percent basic in reading from1992-1994),
R = the proportion of African American andHispanic (public school) students in state i,
P = the state population,
309
Carnoy and Loeb
S = the proportion of schools' funds comingfrom the state rather than local sources in1963 and 1995, and
D = dollars per pupil revenues in 1990 and theyearly percent change in revenue from1990 to 1995.
Next, we look at student achievement as afunction of accountability, testing whether thepercent of 8th graders or 4th graders achieving atthe basic skills level or better increased more be-tween 1996 and 2000 in states with "strong" out-come-based accountability than in states with"weak" accountability. We control for the 1996test score to test whether lower scoring states in1996 had a significantly higher gain in the nextfour years independent of the accountabilityindex. We include as controls those variables thatwere significant predictors of accountabilitystrength in Equation 1. We also include popula-tion growth and growth in the percent of Black orHispanic students.
GI = 4o + 01Ai + 2Pr1 i + XiO3 + CiO4 + e, (2)
where
G change the percent of 8th grade or 4thgrade students in state i who demonstratedbasic skills or better on the mathematicsNAEP between 1996 and 2000,10
Pr the 1996 level of the outcome measure,X controls from Equation 1, andC the change in population and in the per-
cent of Black or Hispanic students.
We ran a number of specification checks onthis basic model. One specification focuses onscale scores, but we are more interested in thepercent of students passing at different skill lev-els (basic skills or better and proficient or better)because that allows us to test whether strongeraccountability just affects gains in basic skills oralso in higher level skills. As described in moredetail, we check the estimated coefficient for ac-countability for possible bias due to exclusionfrom the NAEP math test of students classified asspecial education or limited English proficient.
Using a specification similar to Equation 2, butincluding an additional control for 1996 test score,we test whether 9th-grade retention (the number ofstudents in the 9th grade divided by the number ofstudents in the 8th grade the year before) rose
more in the late 1990s in states with strong ac-countability than in states with weak account-ability. We also test whether 10th to 12th gradesurvival rates and 8th to 12th grade survival ratesincreased more in states with strong accountabil-ity than in states with weak accountability.
Rti or Sr = Oo + 01Ai + 02Pri + XiO3
+ CQ04 +p5 E+s, (3)
where
Rt 9th-grade retention rate in state i,1996-2001,
Sr high school survival rates in state i, andE 8th grade percent demonstrating at least
basic skills in NAEP math in 1996.
We ran a number of specification checks onthis basic model as well.
DataWe used four sets of data. For test scores, we
used the posted NAEP math results by state fromThe Nation's Report Card available at http://nces.ed.gov/nationsreportcard/states. We used anumber of different test scores to estimate Equa-tions 1, 2 and 3.11 In Equation 1, if most stateswere making their decisions to implement thenew accountability systems in the early to mid-1990s, the most relevant scores are on the 1992and 1994 reading tests and the 1992 math test. InEquation 2, the outcome measure is the latest oneavailable, the gain in score on the NAEP mathtest from 1996 to 2000. We estimate the effect ofthe accountability index and other variables onboth the 8th-grade results and the 4th-grade re-sults. In checking for possible bias from exclu-sion, we use an alternative set of gain scores pro-vided by McLaughlin (2001) as the dependentvariable in one set of alternative estimates. In an-other set of estimates of Equation 2, we use twoalternative exclusion adjustments provided to usby the National Center of Educational Statistics(NCES) as control variables. In Equation 3, themost relevant measure of test score is thel9968th-grade math results, since these directly pre-cede in time the changing 9th-grade retentionrates and student survival rates in high school.
For retention rate and survival rate studentoutcome measures, we used enrollment figuresthat we gathered from a number of different
Does External Accountability Affect Student Outcomes? A Cross-State Analysis
sources including state department of educationweb pages and the National Center for Educa-tion Statistics. Using data on 8th, 9th, 10th, and12th grade enrollment for the years 1992-93through 2000-2001, we calculate (a) the ratio ofstudents in the 9th grade in year t to the numberof students in the 8th grade in year t-1, (b) the ratioof the number of students in the 12th grade in yeart to the number in the 10th grade in year t-2 and(c) the ratio of the number of students in the 12thgrade in year t to the number in the 8th grade inyear t-4.12 We were unable to obtain sufficient en-rollment data for Idaho, North Dakota and Utah. 13
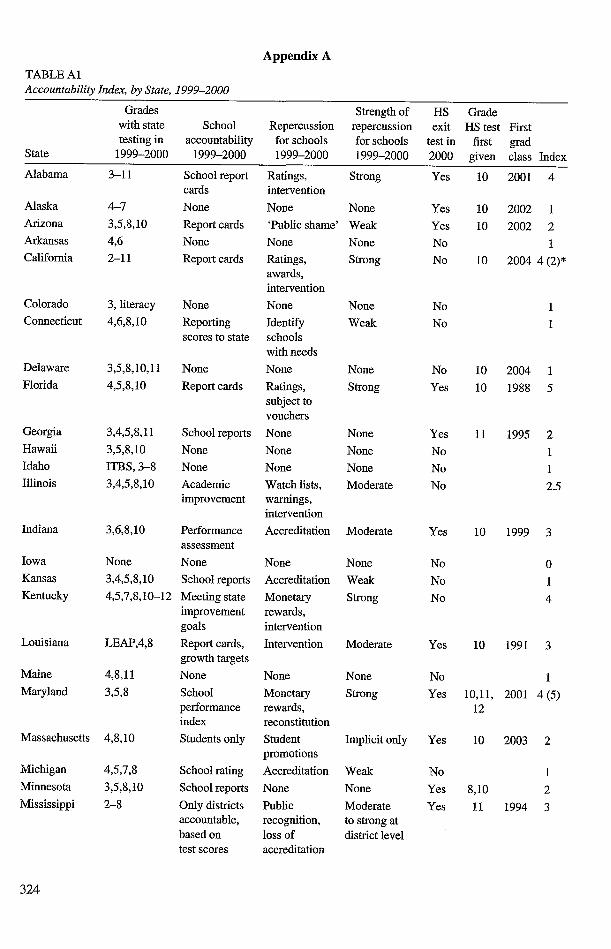
For accountability strength, we use the data-base developed by the Consortium for Policy Re-search in Education (CPRE), available on theCPRE web site http://www.cpre.org/Publications/Publications_Accountability.htm. The databaseprovides information on state testing and ac-countability policies as of 1999-2000 (the yearwe used as our benchmark). From the database,we constructed a scale of accountability levels 0to 5, based on pre-2000 accountability condi-tions, with states such as Iowa and Nebraska,that do not have any state-level accountabilityrequirements for schools or districts coded 0,and states with "maximum" state-level demandson schools and that require a high school com-petency exam for graduation, such as Texas,North Carolina, New Jersey, and Florida coded 5.Appendix A reports our index, state by state.
The 0-5 scale captures degrees of state extemalpressure on schools to improve student achieve-ment according to state-definedperformance cri-teria. States receiving a zero do not test studentsstatewide or do not set any statewide standardsfor schools or districts. States that require statetesting in the elementary and middle grades andthe reporting of test results to the state but noschool (or district) sanctions or rewards (no orweak extemal pressure) get a 1. Those states thattest at the elementary and middle school levelsand have moderate school or district account-ability sanctions/rewards or, altematively, a highschool exit test (that sanctions students but pres-sures schools to improve student performance)get a 2. Those states that test at the lower and mid-dle grades, have moderate accountability reper-cussions for schools and districts, and require anexit test in high school, get a 3. Those that testand place strong pressure on schools or districtsto improve student achievement (threat of recon-
stitution, principal transfer, loss of students) butdo not require a high school exit test get a 4. Statesreceiving a 5 test students in primary and middlegrades, strongly sanction and reward schools ordistricts based on improvement in student testscores, and require a high school minimum com-petency exit test for graduation. 14
Results
Descriptions of the variables central to theanalysis appear in Appendix B. We see thataverage math test scores rose in the period 1996to 2000 for all three race/ethnic groups in boththe 4th and 8th grades. This was not the case inall states, however (see maximum and minimumscore changes). A much lower proportion ofBlacks and Hispanics compared to Whites achieveat the basic skills level of proficiency or betterand at the proficient level or better. In the worstperforming state, Mississippi, only one percentof Blacks score at the proficient level or above.In the states in which Black students performbest, such as New York, about 8-10 percent scoreat the proficient level or above. In the states whereWhite students perform best, such as Connecticut,more than 40% scored at the proficient level orbetter on the 2000 test.
We also see that the ratio of 9th graders in2000-2001 to 8th graders in 1999-2000 averagedapproximately 1.19 for Black students across thestates. With no population growth, this wouldindicate an approximately 19% retention of stu-dents in the 9th grade. In 1996 the correspondingrate was 18%. There are large differences be-tween Black and White students. In both 1996and 2001 the retention ratio averaged only sixpercent for White students. The ratio of 12th gradeenrollment in 2001 to 8th grade enrollment in 1997captures students' progression through highschool. We see that on average this ratio is 0.85for Whites and 0.75 for Blacks. With no popula-tion growth this would indicate that 85% (75%)of 8th graders in 1997 progressed to 12th gradefour years later.
States' Implementationof Strong Accountability
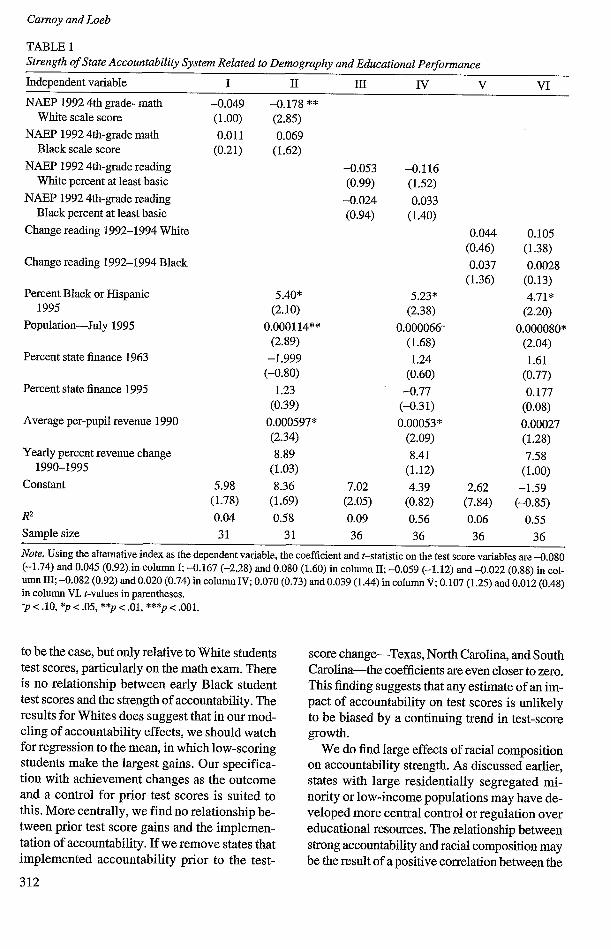
The results of our estimates of the strength ofstate accountability equation appear in Table 1.We hypothesize that states with lower studenttest scores earlier in the 1990s would be morelikely to implement strong systems. This appears
311
I
Carnoy and Loeb
TABLE 1Strength of State Accountability System Related to Demography and Educational Perfonnance
Independent variable
NAEP 1992 4th grade- mathWhite scale score
NAEP 1992 4th-grade mathBlack scale score
NAEP 1992 4th-grade readingWhite percent at least basic
NAEP 1992 4th-grade readingBlack percent at least basic
I II 1 IV v VI
-0.049(1.00)
0.011(0.21)
-0.178 **(2.85)
0.069(1.62)
-0.053
(0.99)-0.024(0.94)
-0.116(1.52)
0.033(1.40)
Change reading 1992-1994 White 0.044 0.105(0.46) (1.38)
Change reading 1992-1994 Black 0.037 0.0028(1.36) (0.13)
Percent Black or Hispanic 5.40* 5.23* 4.71*1995 (2.10) (2.38) (2.20)
Population-July 1995 0.0001 14** 0.000066- 0.000080*(2.89) (1.68) (2.04)
Percent state finance 1963 -1.999 1.24 1.61(-0.80) (0.60) (0.77)
Percent state finance 1995 1.23 -0.77 0.177(0.39) (-0.31) (0.08)
Average per-pupil revenue 1990 0.000597* 0.00053* 0.00027(2.34) (2.09) (1.28)
Yearly percent revenue change 8.89 8.41 7.581990-1995 (1.03) (1.12) (1.00)
Constant 5.98 8.36 7.02 4.39 2.62 -1.59(1.78) (1.69) (2.05) (0.82) (7.84) (-0.85)
R2 0.04 0.58 0.09 0.56 0.06 0.55Sample size 31 31 36 36 36 36Note. Using the alternative index as the dependent variable, the coefficient and t-statistic on the test score variables are -0.080(-1.74) and 0.045 (0.92) in.column I; -0.167 (-2.28) and 0.080 (1,60) in column II; -0.059 (-1.12) and -0.022 (0.88) in col-umn III; -0.082 (0.92) and 0.020 (0.74) in column IV; 0.070 (0.73) and 0.039 (1.44) in column V; 0.107 (1.25) and 0.012 (0.48)in column VI. t-values in parentheses.-p <.10, *p <.05, **p <.01, ***p <.001.
to be the case, but only relative to White studentstest scores, particularly on the math exam. Thereis no relationship between early Black studenttest scores and the strength of accountability. Theresults for Whites does suggest that in our mod-eling of accountability effects, we should watchfor regression to the mean, in which low-scoringstudents make the largest gains. Our specifica-tion with achievement changes as the outcomeand a control for prior test scores is suited tothis. More centrally, we find no relationship be-tween prior test score gains and the implemen-tation of accountability. If we remove states thatimplemented accountability prior to the test-
score change-Texas, North Carolina, and SouthCarolina-the coefficients are even closer to zero.This finding suggests that any estimate of an im-pact of accountability on test scores is unlikelyto be biased by a continuing trend in test-scoregrowth.
We do find large effects of racial compositionon accountability strength. As discussed earlier,states with large residentially segregated mi-nority or low-income populations may have de-veloped more central control or regulation overeducational resources. The relationship betweenstrong accountability and racial composition maybe the result of a positive correlation between the
Does External Accountability Affect Student Outcomes? A Cross-State Analysis
proportion of minority students in the state andthe centralization of school policy, either for ear-lier historical reasons related to segregation orfor more recent historical reasons related to liti-gation over the distribution of public resourcesfor education. The point estimates on the per-centage of minority students imply that stateswith 20 percentage points more Blacks and His-panics have accountability systems that are ap-proximately one index number stronger.
To test the centralization hypothesis, we in-cluded as an explanatory variable the proportionof public school funding revenues coming fromthe state in 1963-64 and in 1994-95. The dataon the proportion of school revenue coming fromthe state in the early 1960s predates the Serranodecision (1971) that moved many states to morecentralized funding formulas to achieve greaterrevenue equalization among school districts.Most southern states had more centralized schoolfinancing systems in 1963. Schools in an averagesouthem state received 58% of their funding fromthe state, compared with 36% in states outsidethe South. However, school finance in some south-em states, such as Virginia was relatively decen-tralized. And some Westem states such as Utahand New Mexico, whose politics continue to bedominated by rural interests, and Hawaii, with acompletely different political history, have evenmore centralized school finance systems than theSouth. In any case, when accountability strengthin 2000 is regressed alone against the propor-tion of school revenues coming from the state in1963, the relationship is statistically significant.But when percent minority is included as an in-dependent variable, centralization of school fi-nance seems to play no significant role in ex-plaining the strength of the accountability system.Measures of financial centralization in the mid-1990s, when many of today's state accountabilitysystems were being organized are much less sig-nificant in explaining the strength of the account-ability system even in the bivariate model.
More populous states with correspondinglylarger absolute numbers of disadvantaged mi-norities, larger school systems, and larger citiesalso appear to implement stronger accountabilitysystems. These conditions could imply greaterdifficulty in implementing local school improve-ment reforms and greater pressure for state-levelcontrols. States vary in size from Wyoming with480,000 people to California with 33 million.
Finally, while yearly growth in revenues doesnot predict accountability implementation, thelevel of resources in 1990 does. Using the resultsreported in Table 1 we choose to include the per-cent Black or Hispanic students in 1995, the pop-ulation in 1995, and per-pupil revenues in 1990as controls in our assessment of accountabilityeffects.
Do States with Stronger AccountabilitySee Greater Test-Score Gains?
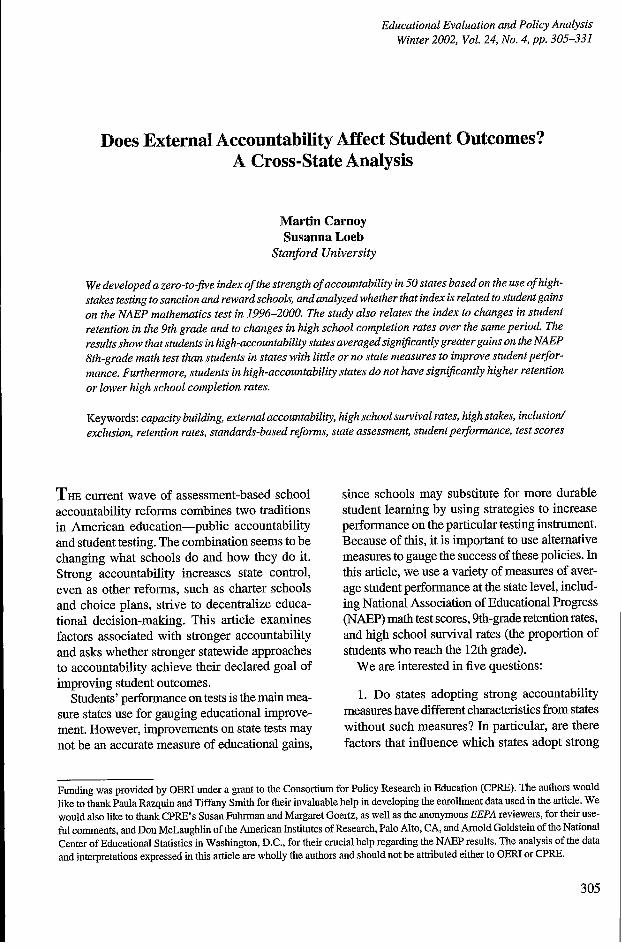
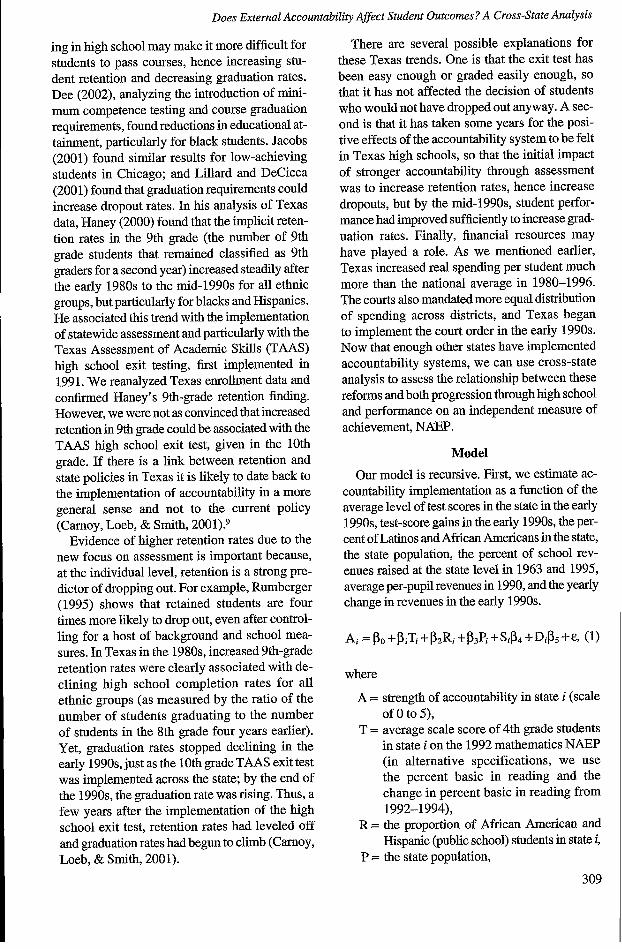
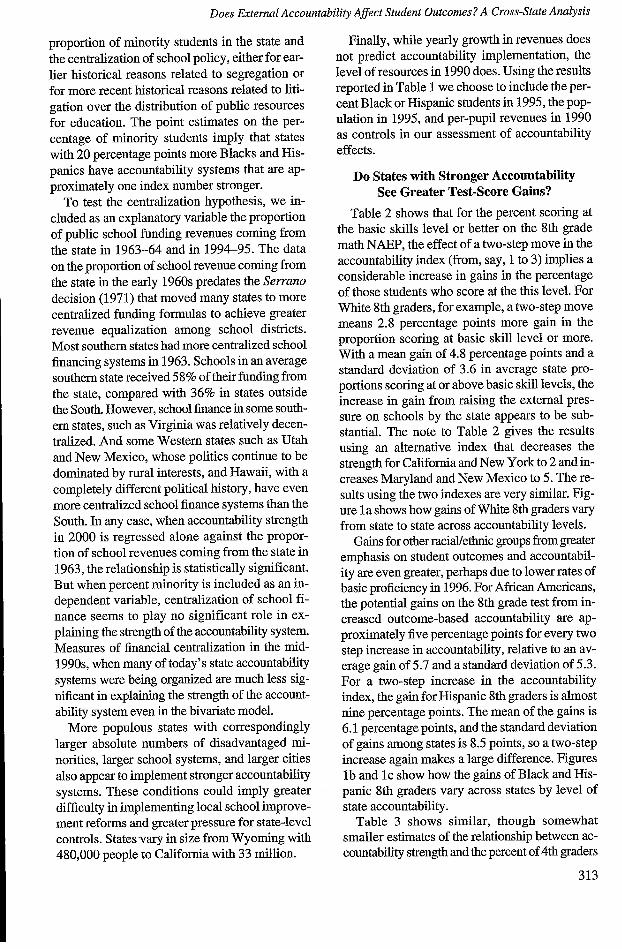
Table 2 shows that for the percent scoring atthe basic skills level or better on the 8th grademath NAEP, the effect of a two-step move in theaccountability index (from, say, 1 to 3) implies aconsiderable increase in gains in the percentageof those students who score at the this level. ForWhite 8th graders, for example, a two-step movemeans 2.8 percentage points more gain in theproportion scoring at basic skill level or more.With a mean gain of 4.8 percentage points and astandard deviation of 3.6 in average state pro-portions scoring at or above basic skill levels, theincrease in gain from raising the external pres-sure on schools by the state appears to be sub-stantial. The note to Table 2 gives the resultsusing an altemative index that decreases thestrength for California and New York to 2 and in-creases Maryland and New Mexico to 5. The re-sults using the two indexes are very similar. Fig-ure la shows how gains of White 8th graders varyfrom state to state across accountability levels.
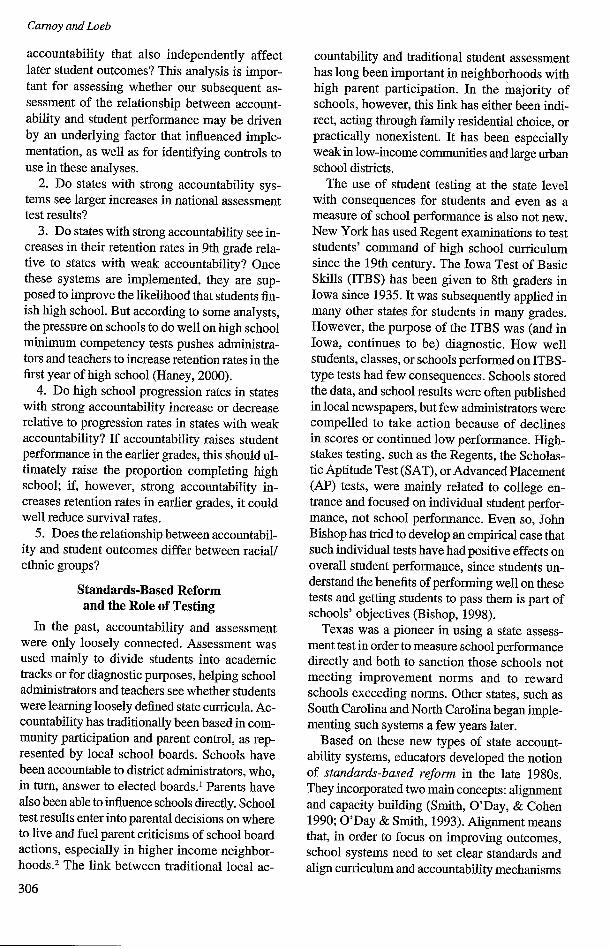
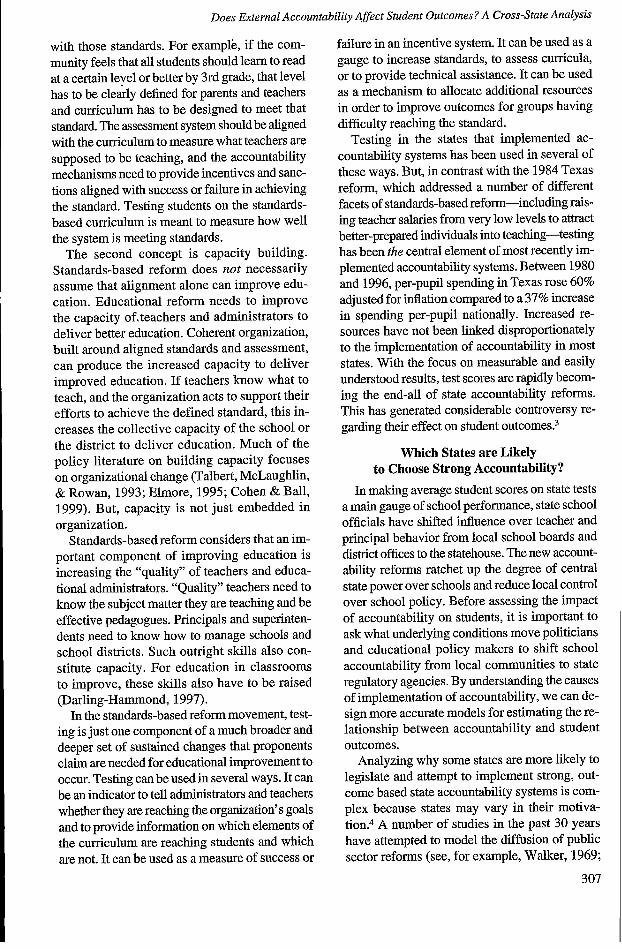
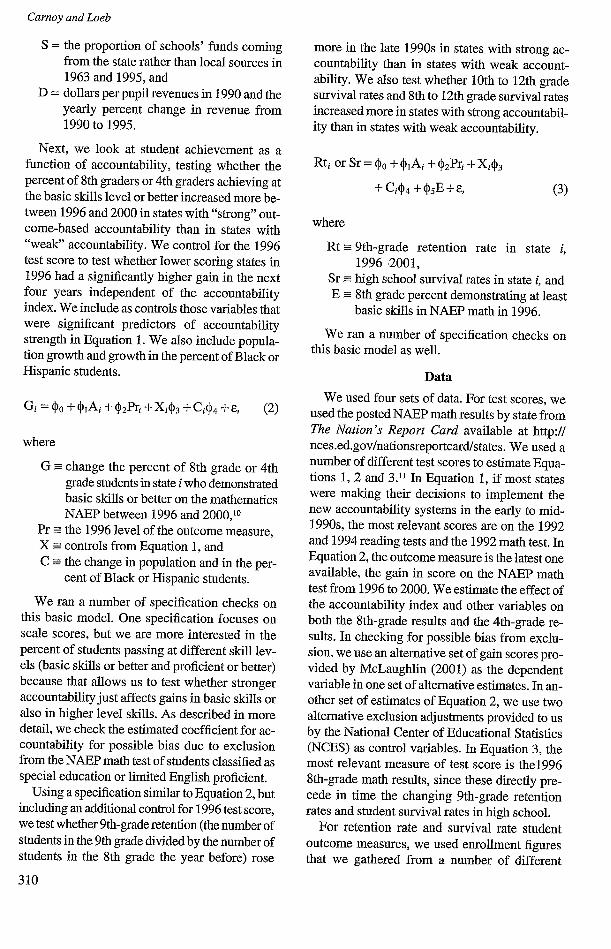
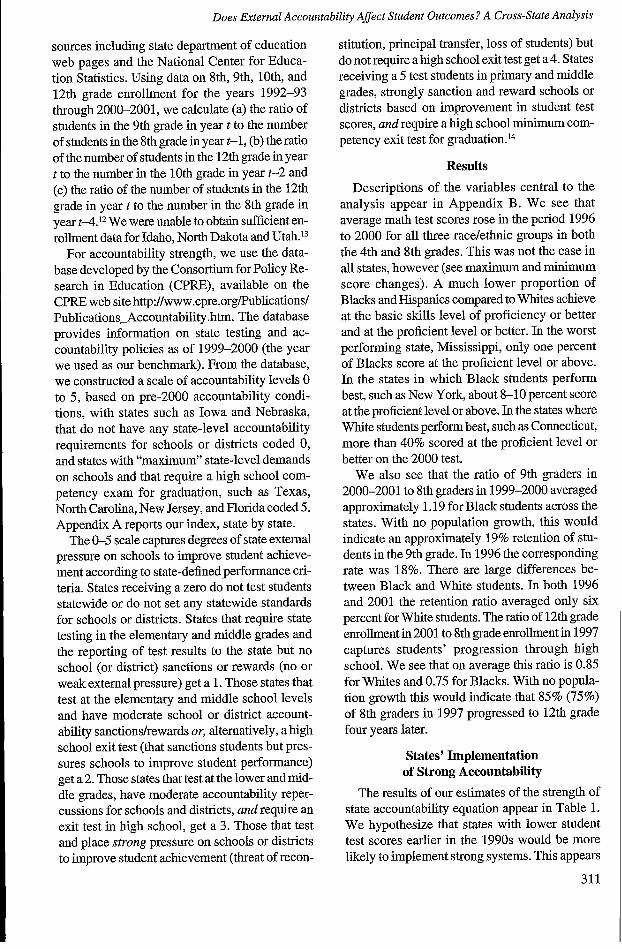
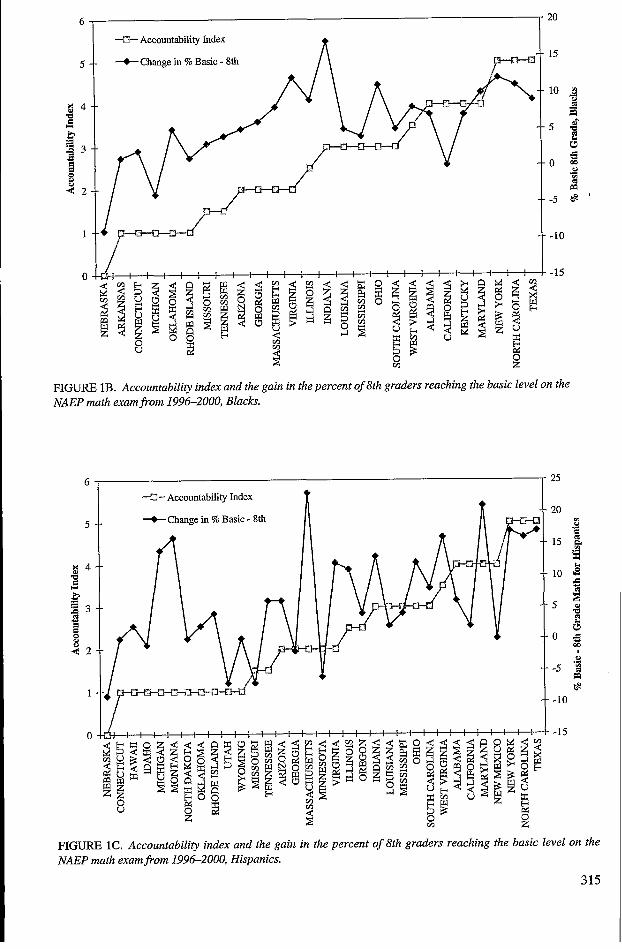
Gains for other racial/ethnic groups from greateremphasis on student outcomes and accountabil-ity are even greater, perhaps due to lower rates ofbasic proficiency in 1996. For African Americans,the potential gains on the 8th grade test from in-creased outcome-based accountability are ap-proximately five percentage points for every twostep increase in accountability, relative to an av-erage gain of 5.7 and a standard deviation of 5.3.For a two-step increase in the accountabilityindex, the gain for Hispanic 8th graders is almostnine percentage points. The mean of the gains is6.1 percentage points, and the standard deviationof gains among states is 8.5 points, so a two-stepincrease again makes a large difference. Figureslb and lc show how the gains of Black and His-panic 8th graders vary across states by level ofstate accountability.
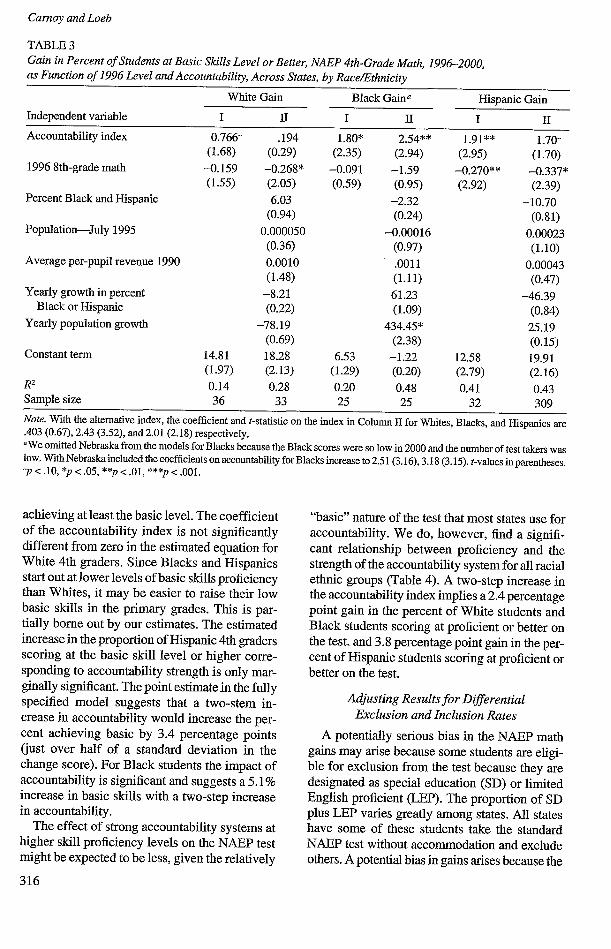
Table 3 shows similar, though somewhatsmaller estimates of the relationship between ac-countability strength and the percent of 4th graders
313
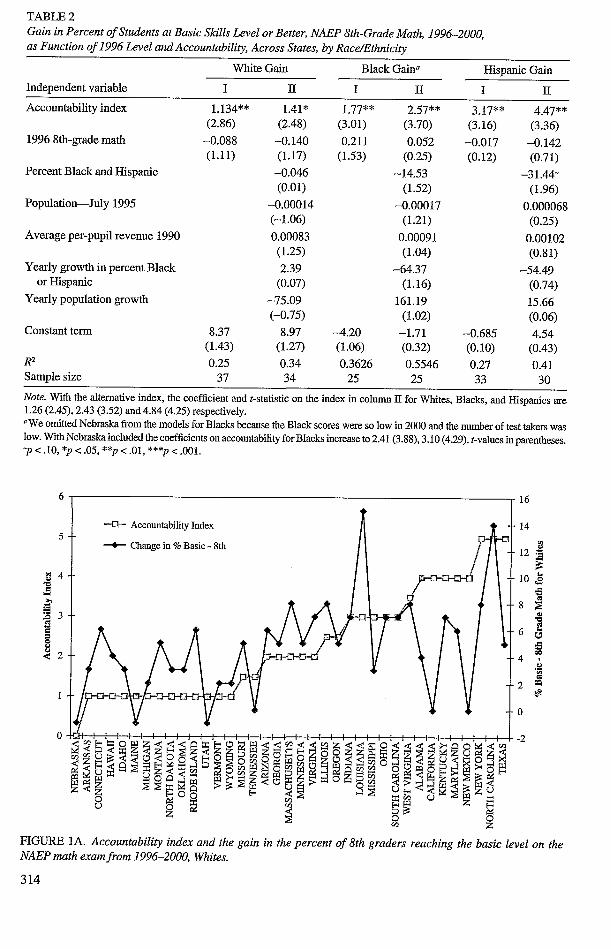
TABLE 2Gain in Percent of Students at Basic Skills Level or Better, NAEP 8th-Grade Math, 1996-2000,as Function of 1996 Level and Accountability, Across States, by Race/Ethnicity
White Gain Black Gaina Hispanic Gain
Independent variable I II I II I IIAccountability index 1.134** 1.41* 1.77** 2.57** 3.17** 4.47**
(2.86) (2.48) (3.01) (3.70) (3.16) (3.36)1996 8th-grade math -0.088 -0.140 0.211 0.052 -0.017 -0.142
(1.11) (1.17) (1.53) (0.25) (0.12) (0.71)Percent Black and Hispanic -0.046 -14.53 -31.44-
(0.01) (1.52) (1.96)Population-July 1995 -0.00014 -0.00017 0.000068
(-1.06) (1.21) (0.25)Average per-pupil revenue 1990 0.00083 0.00091 0.00102
(1.25) (1.04) (0.81)Yearly growth in percent Black 2.39 -64.37 -54.49
or Hispanic (0.07) (1.16) (0.74)Yearly population growth -75.09 161.19 15.66
(-0.75) (1.02) (0.06)Constant term 8.37 8.97 -4.20 -1.71 -0.685 4.54
(1.43) (1.27) (1.06) (0.32) (0.10) (0.43)R2 0.25 0.34 0.3626 0.5546 0.27 0.41Sample size 37 34 25 25 33 30
Note. With the alternative index, the coefficient and t-statistic on the index in column II for Whites, Blacks, and Hispanics are1.26 (2.45), 2.43 (3.52) and 4.84 (4.25) respectively."We omitted Nebraska from the models for Blacks because the Black scores were so low in 2000 and the number of test takers waslow. With Nebraska included the coefficients on accountability for Blacks increase to 2.41 (3.88), 3.10 (4.29). t-values in parentheses.-p <.10, *p <.05, **p <.01, ***p <.001.
5
0
16
14
-12 *
10 ad
8 :
6 p
.c
.4
2 0
-2
FIGI1RE IA. Accountability index and the gain in the percent of 8th graders reaching the basic level on theNAEP math exam from 1996-2000, Whites.
314
I
20
5-
# 4'ar.
i 3,a2
2 2
0
15
10 y
-5 I
-10
--15
FIGURE lB. Accountability index and the gain in the percent of 8th graders reaching the basic level on the
NAEP math exam from 1996-2000, Blacks.
25
- 20
15 vs
I-*10 °
.5 XCs
0 m
x
--5 a0
-10
-15
FIGURE 1C. Accountability index and the gain in the percent of 8th graders reaching the basic level on the
NAEP math exam from 1996-2000, Hispanics.
315
--M} Accountability Index
+ Change in % Basic - 8th5
x 4'aa
i 3
00
2
1
0
6
Carnoy and Loeb
TABLE 3Gain in Percent of Students at Basic Skills Level or Better, NAEP 4th-Grade Math, 1996-2000,as Function of 1996 Level and Accountability, Across States, by Race/Ethnicity
White Grai
Independent variable
Accountability index
1996 8th-grade math
Percent Black and Hispanic
I
0.766-(1.68)
-0.159(1.55)
Population-July 1995
Average per-pupil revenue 1990
Yearly growth in percentBlack or Hispanic
Yearly population growth
Constant term 14.81(1.97)0.1436Sample size
(C-C(26
(00.0(O0.i(1
-8(O
-78(O
18(2
0.
in Black Gain"
II I II
.194 1.80* 2.54**1.29) (2.35) (2.94)1.268* -0.091 -1.59!.05) (0.59) (0.95)5.03 -2.32).94) (0.24)00050 -0.00016.36) (0.97)0010 .0011.48) (1.11).21 61.23.22) (1.09).19 434.45*.69) (2.38).28 6.53 -1.22.13) (1.29) (0.20).28 0.20 0.4833 25 25
Hispanic Gain
I II
1.91** 1.70-(2.95) (1.70)
-0.270** -0.337*(2.92) (2.39)
-10.70(0.81)
0.00023(1.10)
0.00043(0.47)
-46.39(0.84)25.19(0.15)
12.58 19.91(2.79) (2.16)0.41 0.43
32 309Note. With the alternative index, the coefficient and t-statistic on the index in Column II for Whites, Blacks, and Hispanics are.403 (0.67), 2.43 (3.52), and 2.01 (2.18) respectively."We omitted Nebraska from the models for Blacks because the Black scores were so low in 2000 and the number of test takers waslow. With Nebraska included the coefficients on accountability for Blacks increase to 2.51 (3.16), 3.18 (3.15). t-values in parentheses.-p <.10, *p <.05, **p <.01, ***p <.001.
achieving at least the basic level. The coefficientof the accountability index is not significantlydifferent from zero in the estimated equation forWhite 4th graders. Since Blacks and Hispanicsstart out at lower levels of basic skills proficiencythan Whites, it may be easier to raise their lowbasic skills in the primary grades. This is par-tially bome out by our estimates. The estimatedincrease in the proportion of Hispanic 4th gradersscoring at the basic skill level or higher corre-sponding to accountability strength is only mar-ginally significant. The point estimate in the fullyspecified model suggests that a two-stem in-crease in accountability would increase the per-cent achieving basic by 3.4 percentage points(just over half of a standard deviation in thechange score). For Black students the impact ofaccountability is significant and suggests a 5.1 %increase in basic skills with a two-step increasein accountability.
The effect of strong accountability systems athigher skill proficiency levels on the NAEP testmight be expected to be less, given the relatively
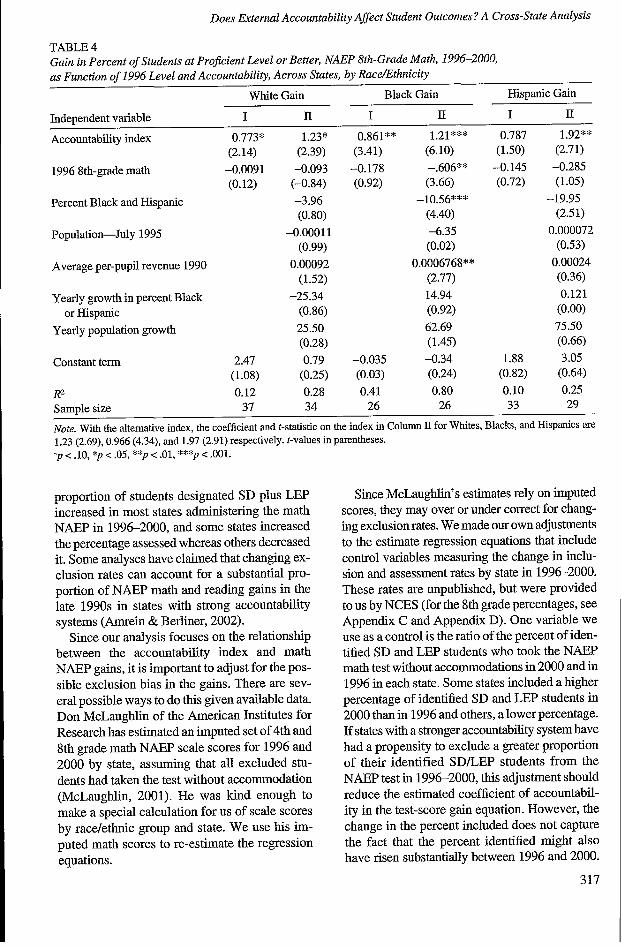
"basic" nature of the test that most states use foraccountability. We do, however, find a signifi-cant relationship between proficiency and thestrength of the accountability system for all racialethnic groups (Table 4). A two-step increase inthe accountability index implies a 2.4 percentagepoint gain in the percent of White students andBlack students scoring at proficient or better onthe test, and 3.8 percentage point gain in the per-cent of Hispanic students scoring at proficient orbetter on the test.
Adjusting Results for DifferentialExclusion and Inclusion Rates
A potentially serious bias in the NAEP mathgains may arise because some students are eligi-ble for exclusion from the test because they aredesignated as special education (SD) or limitedEnglish proficient (LEP). The proportion of SDplus LEP varies greatly among states. All stateshave some of these students take the standardNAEP test without accommodation and excludeothers. A potential bias in gains arises because the
Does External Accountability Affect Student Outcomes? A Cross-State Analysis
TABLE 4Gain in Percent of Students at Proficient Level or Better, NAEP 8th-Grade Math, 1996-2000,
as Function of 1996 Level and Accountability, Across States, by Race/Ethnicity
White Gain Black Gain Hispanic Gain
Independent variable I II I II I II
Accountability index 0.773* 1.23* 0.861** 1.21*** 0.787 1.92**(2.14) (2.39) (3.41) (6.10) (1.50) (2.71)
1996 8th-grade math -0.0091 -0.093 -0.178 -. 606** -0.145 -0.285(0.12) (-0.84) (0.92) (3.66) (0.72) (1.05)
Percent Black and Hispanic -3.96 -10.56*** -19.95(0.80) (4.40) (2.51)
Population-July 1995 -0.00011 -6.35 0.000072(0.99) (0.02) (0.53)
Average per-pupil revenue 1990 0.00092 0.0006768** 0.00024(1.52) (2.77) (0.36)
Yearly growth in percent Black -25.34 14.94 0.121
or Hispanic (0.86) (0.92) (0.00)
Yearly population growth 25.50 62.69 75.50(0.28) (1.45) (0.66)
Constant term 2.47 0.79 -0.035 -0.34 1.88 3.05(1.08) (0.25) (0.03) (0.24) (0.82) (0.64)
R2 0.12 0.28 0.41 0.80 0.10 0.25
Sample size 37 34 26 26 33 29
Note. With the alternative index, the coefficient and t-statistic on the index in Column II for Whites, Blacks, and Hispanics are
1.23 (2.69), 0.966 (4.34), and 1.97 (2.91) respectively. t-values in parentheses.-p <.10, *p < .0, **p <.01, ***p <.001.
proportion of students designated SD plus LEPincreased in most states administering the mathNAEP in 1996-2000, and some states increasedthe percentage assessed whereas others decreasedit. Some analyses have claimed that changing ex-clusion rates can account for a substantial pro-portion of NAEP math and reading gains in thelate 1990s in states with strong accountabilitysystems (Amrein & Berliner, 2002).
Since our analysis focuses on the relationshipbetween the accountability index and mathNAEP gains, it is important to adjust for the pos-sible exclusion bias in the gains. There are sev-eral possible ways to do this given available data.Don McLaughlin of the American Institutes forResearch has estimated an imputed set of 4th and8th grade math NAEP scale scores for 1996 and2000 by state, assuming that all excluded stu-dents had taken the test without accommodation(McLaughlin, 2001). He was kind enough tomake a special calculation for us of scale scoresby race/ethnic group and state. We use his im-puted math scores to re-estimate the regressionequations.
Since McLaughlin's estimates rely on imputedscores, they may over or under correct for chang-ing exclusion rates. We made our own adjustmentsto the estimate regression equations that includecontrol variables measuring the change in inclu-sion and assessment rates by state in 1996-2000.These rates are unpublished, but were providedto us by NCES (for the 8th grade percentages, seeAppendix C and Appendix D). One variable weuse as a control is the ratio of the percent of iden-tified SD and LEP students who took the NAEPmath test without accommodations in 2000 and in1996 in each state. Some states included a higherpercentage of identified SD and LEP students in2000 than in 1996 and others, a lower percentage.If states with a stronger accountability system havehad a propensity to exclude a greater proportionof their identified SD/LEP students from theNAEP test in 1996-2000, this adjustment shouldreduce the estimated coefficient of accountabil-ity in the test-score gain equation. However, thechange in the percent included does not capturethe fact that the percent identified might alsohave risen substantially between 1996 and 2000.
317
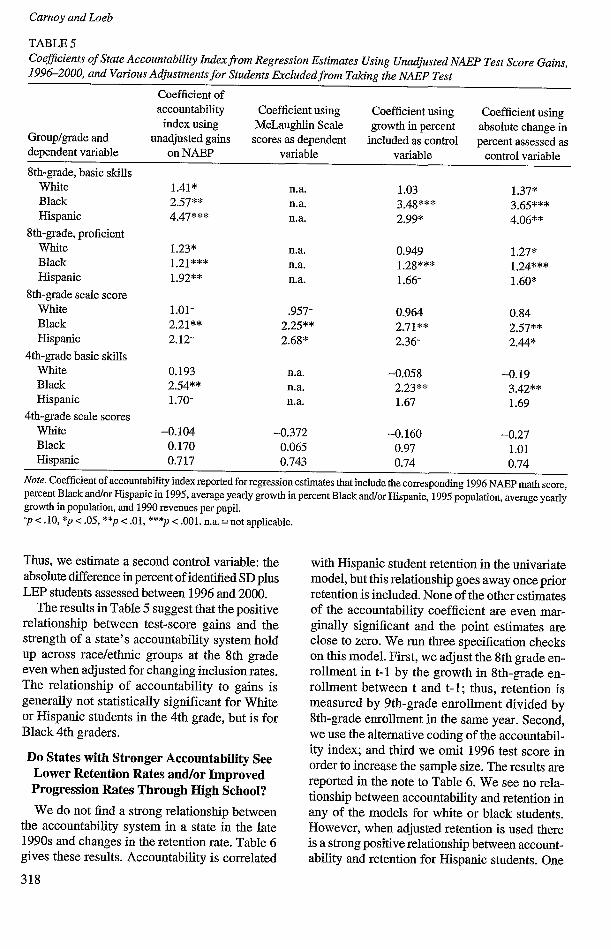
Carnoy and Loeb
TABLE 5Coefficients of State Accountability Index from Regression Estimates Using Unadjusted NAEP Test Score Gains,1996-2000, and Various Adjustments for Students Excluded from Taking the NAEP Test
Coefficient ofaccountability Coefficient using Coefficient using Coefficient using
index using McLaughlin Scale growth in percent absolute change inGroup/grade and unadjusted gains scores as dependent included as control percent assessed asdependent variable on NAEP variable variable control variable8th-grade, basic skills
White 1.41* n.a. 1.03 1.37*Black 2.57** n.a. 3.48*** 3.65***Hispanic 4.47*** n.a. 2.99* 4.06**
8th-grade, proficientWhite 1.23* n.a. 0.949 1.27*Black 1.21*** n.a. 1.28*** 1.24***Hispanic 1.92** n.a. 1.66- 1.60*
8th-grade scale scoreWhite 1.01- .957- 0.964 0.84Black 2.21** 2.25** 2.71** 2.57**Hispanic 2.12- 2.68* 2.36- 2.44*
4th-grade basic skillsWhite 0.193 n.a. -0.058 -0.19Black 2.54** n.a. 2.23** 3.42**Hispanic 1.70- n.a. 1.67 1.69
4th-grade scale scoresWhite -0.104 -0.372 -0.160 -0.27Black 0.170 0.065 0.97 1.01Hispanic 0.717 0.743 0.74 0.74
Note. Coefficient of accountability index reported forregression estimates that include the corresponding 1996 NAEP math score,percent Black and/or Hispanic in 1995, average yearly growth in percent Black and/or Hispanic, 1995 population, average yearlygrowth in population, and 1990 revenues per pupil.p < .10, *p <.05, **p < .01, ***p <.001. n.a. = not applicable.
Thus, we estimate a second control variable: theabsolute difference in percent of identified SD plusLEP students assessed between 1996 and 2000.
The results in Table 5 suggest that the positiverelationship between test-score gains and thestrength of a state's accountability system holdup across race/ethnic groups at the 8th gradeeven when adjusted for changing inclusion rates.The relationship of accountability to gains isgenerally not statistically significant for Whiteor Hispanic students in the 4th grade, but is forBlack 4th graders.
Do States with Stronger Accountability SeeLower Retention Rates and/or ILnprovedProgression Rates Through High School?
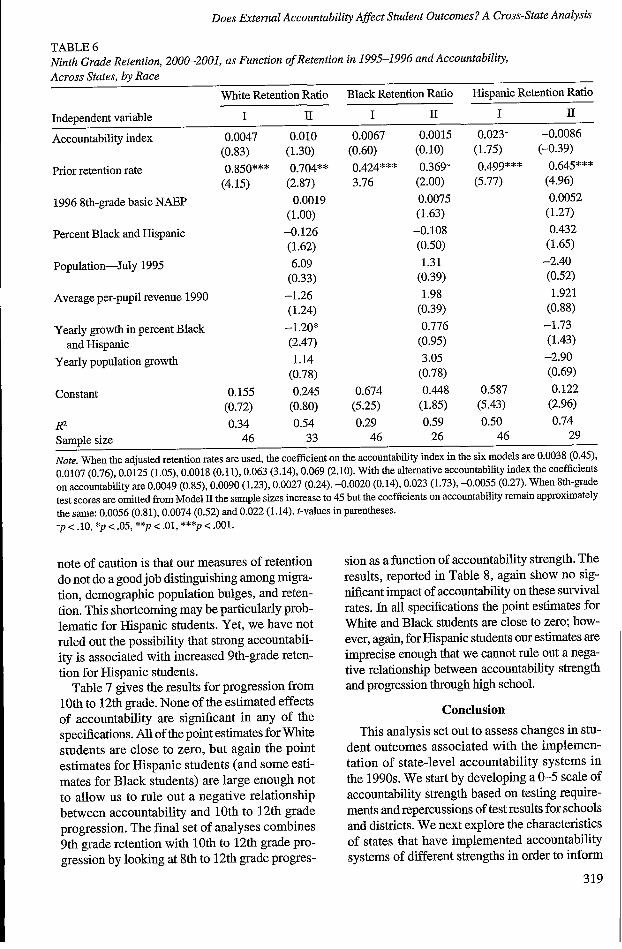
We do not find a strong relationship betweenthe accountability system in a state in the late1990s and changes in the retention rate. Table 6gives these results. Accountability is correlated
with Hispanic student retention in the univariatemodel, but this relationship goes away once priorretention is included. None of the other estimatesof the accountability coefficient are even mar-ginally significant and the point estimates areclose to zero. We run three specification checkson this model. First, we adjust the 8th grade en-rollment in t-I by the growth in 8th-grade en-rollment between t and t-1; thus, retention ismeasured by 9th-grade enrollment divided by8th-grade enrollment in the same year. Second,we use the altemative coding of the accountabil-ity index; and third we omit 1996 test score inorder to increase the sample size. The results arereported in the note to Table 6. We see no rela-tionship between accountability and retention inany of the models for white or black students.However, when adjusted retention is used thereis a strong positive relationship between account-ability and retention for Hispanic students. One
Does External Accountability Affect Student Outcomes? A Cross-State Analysis
TABLE 6Ninth Grade Retention, 2000-2001, as Function of Retention in 1995-1996 and Accountability,
Across States, by Race
White Retention Ratio Black Retention Ratio Hispanic Retention Ratio
Independent variable I 11 I II I II
Accountability index 0.0047 0.010 0.0067 0.0015 0.023- -0.0086
(0.83) (1.30) (0.60) (0.10) (1.75) (-0.39)
Prior retention rate 0.850*** 0.704** 0.424*** 0.369- 0.499*** 0.645***(4.15) (2.87) 3.76 (2.00) (5.77) (4.96)
1996 8th-grade basic NAEP 0.0019 0.0075 0.0052(1.00) (1.63) (1.27)
Percent Black and Hispanic -0.126 -0.108 0.432(1.62) (0.50) (1.65)
Population-July 1995 6.09 1.31 -2.40(0.33) (0.39) (0.52)
Average per-pupil revenue 1990 -1.26 1.98 1.921(1.24) (0.39) (0.88)
Yearly growth in percent Black -1.20* 0.776 -1.73
and Hispanic (2.47) (0.95) (1.43)
Yearly population growth 1.14 3.05 -2.90(0.78) (0.78) (0.69)
Constant 0.155 0.245 0.674 0.448 0.587 0.122
(0.72) (0.80) (5.25) (1.85) (5.43) (2.96)
R 2 0.34 0.54 0.29 0.59 0.50 0.74
Sample size 46 33 46 26 46 29
Note. When the adjusted retention rates are used, the coefficient on the accountability index in the six models are 0.0038 (0.45),
0.0107 (0.76), 0.0125 (1.05), 0.0018 (0.11), 0.063 (3.14), 0.069 (2.10). With the alternative accountability index the coefficients
on accountability are 0.0049 (0.85), 0.0090 (1.23), 0.0027 (0.24), -0.0020 (0.14), 0.023 (1.73), -0.0055 (0.27). When 8th-grade
test scores are omitted from Model lI the sample sizes increase to 45 but the coefficients on accountability remain approximately
the same: 0.0056 (0.81), 0.0074 (0.52) and 0.022 (1.14). t-values in parentheses.-p <.10, *p <.05, **p <.01, ***p <.001.
note of caution is that our measures of retentiondo not do a goodjob distinguishing among migra-tion, demographic population bulges, and reten-tion. This shortcoming may be particularly prob-lematic for Hispanic students. Yet, we have notruled out the possibility that strong accountabil-ity is associated with increased 9th-grade reten-tion for Hispanic students.
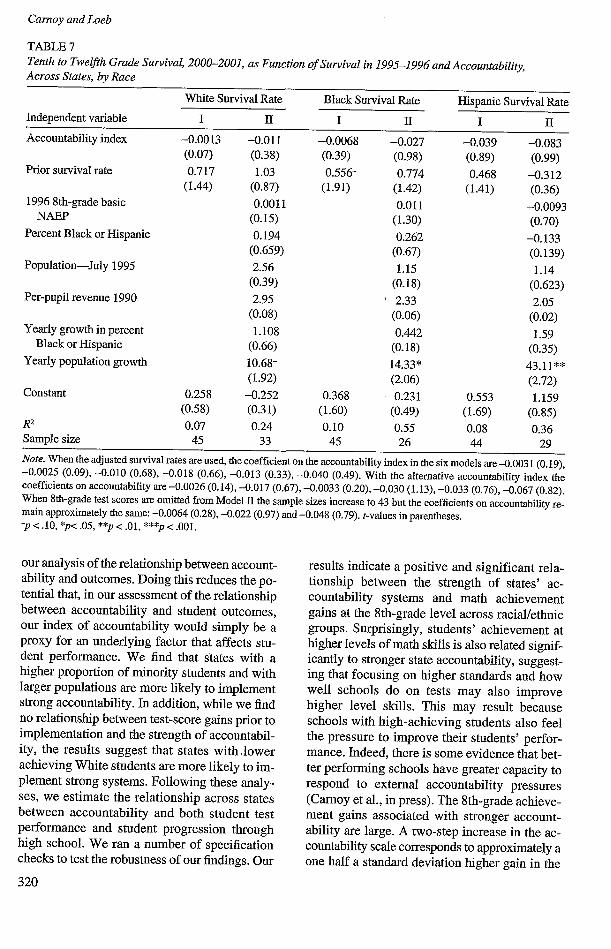
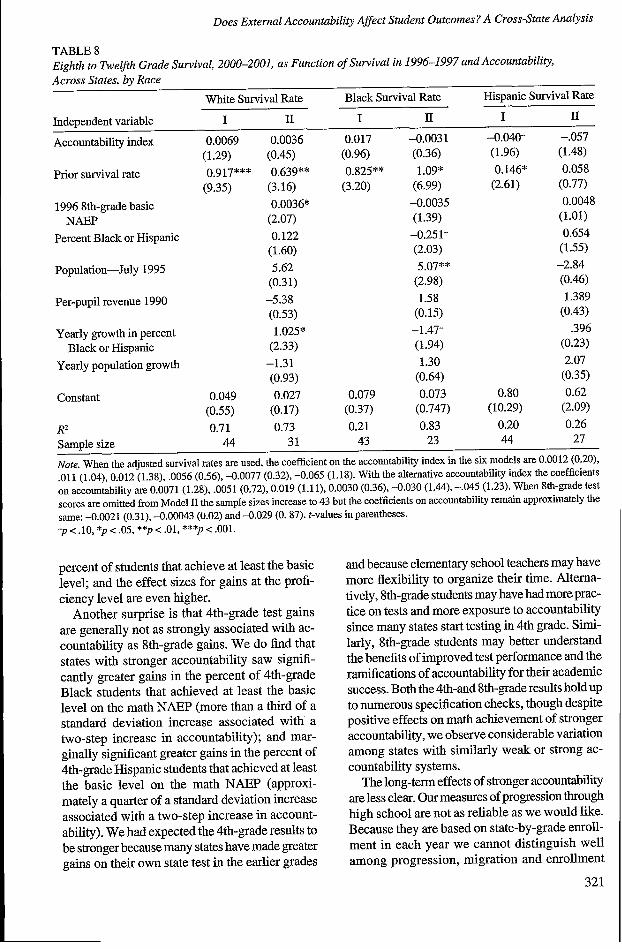
Table 7 gives the results for progression from10th to 12th grade. None of the estimated effectsof accountability are significant in any of thespecifications. All of the point estimates for Whitestudents are close to zero, but again the pointestimates for Hispanic students (and some esti-mates for Black students) are large enough notto allow us to rule out a negative relationshipbetween accountability and 10th to 12th gradeprogression. The final set of analyses combines9th grade retention with 10th to 12th grade pro-gression by looking at 8th to 12th grade progres-
sion as a function of accountability strength. Theresults, reported in Table 8, again show no sig-nificant impact of accountability on these survivalrates. In all specifications the point estimates forWhite and Black students are close to zero; how-ever, again, for Hispanic students our estimates areimprecise enough that we cannot rule out a nega-tive relationship between accountability strengthand progression through high school.
Conclusion
This analysis set out to assess changes in stu-dent outcomes associated with the implemen-tation of state-level accountability systems inthe 1990s. We start by developing a 0-5 scale ofaccountability strength based on testing require-ments and repercussions of test results for schoolsand districts. We next explore the characteristicsof states that have implemented accountabilitysystems of different strengths in order to inform
319
Carnoy and Loeb
TABLE 7Tenth to Twelfth Grade Survival, 2000-2001, as Function of Survival in 1995-1996 and Accountability,Across States, by Race
White Survival Rate Black Survival Rate Hispanic Survival RateIndependent variable I II I II I IIAccountability index -0.0013 -0.011 -0.0068 -0.027 -0.039 -0.083
(0.07) (0.38) (0.39) (0.98) (0.89) (0.99)Prior survival rate 0.717 1.03 0.556- 0.774 0.468 -0.312
(1.44) (0.87) (1.91) (1.42) (1.41) (0.36)1996 8th-grade basic 0.0011 0.011 -0.0093
NAEP (0.15) (1.30) (0.70)Percent Black or Hispanic 0.194 0.262 -0.133
(0.659) (0.67) (0.139)Population-July 1995 2.56 1.15 1.14
(0.39) (0.18) (0.623)Per-pupil revenue 1990 2.95 2.33 2.05
(0.08) (0.06) (0.02)Yearly growth in percent 1.108 0.442 1.59
Black or Hispanic (0.66) (0.18) (0.35)Yearly population growth 10.68- 14.33* 43.11**
(1.92) (2.06) (2.72)Constant 0.258 -0.252 0.368 0.231 0.553 1.159
(0.58) (0.31) (1.60) (0.49) (1.69) (0.85)R2 0.07 0.24 0.10 0.55 0.08 0.36Samnple size 45 33 45 26 44 29Note. When the adjusted survival rates are used, the coefficient on the accountability index in the six models are-0.0031 (0.19),-0.0025 (0.09), -0.010 (0.68), -0.018 (0.66), -0.013 (0.33), -0.040 (0.49). With the alternative accountability index thecoefficients on accountability are -0.0026 (0.14), -0.017 (0.67), -0.0033 (0.20), -0.030 (1.13), -0.033 (0.76),-0.067 (0.82).When 8th-grade test scores are omitted from Model If the sample sizes increase to 43 but the coefficients on accountability re-main approximately the same: -0.0064 (0.28),-0.022 (0.97) and -0.048 (0.79). t-values in parentheses.-p <.10, lp< .05, **p <.01, **8p <.001.
our analysis of the relationship between account-ability and outcomes. Doing this reduces the po-tential that, in our assessment of the relationshipbetween accountability and student outcomes,our index of accountability would simply be aproxy for an underlying factor that affects stu-dent performance. We find that states with ahigher proportion of mninority students and withlarger populations are more likely to implementstrong accountability. In addition, while we findno relationship between test-score gains prior toimplementation and the strength of accountabil-ity, the results suggest that states with lowerachieving White students are more likely to im-plement strong systems. Following these analy-ses, we estimate the relationship across statesbetween accountability and both student testperformance and student progression throughhigh school. We ran a number of specificationchecks to test the robustness of our findings. Our
320
results indicate a positive and significant rela-tionship between the strength of states' ac-countability systems and math achievementgains at the 8th-grade level across racial/ethnicgroups. Surprisingly, students' achievement athigher levels of math skills is also related signif-icantly to stronger state accountability, suggest-ing that focusing on higher standards and howwell schools do on tests may also improvehigher level skills. This may result becauseschools with high-achieving students also feelthe pressure to improve their students' perfor-mance. Indeed, there is some evidence that bet-ter perfonning schools have greater capacity torespond to extemal accountability pressures(Carnoy et al., in press). The 8th-grade achieve-ment gains associated with stronger account-ability are large. A two-step increase in the ac-countability scale corresponds to approximately aone half a standard deviation higher gain in the
Does External Accountability Affect Student Outcomes? A Cross-State Analysis
TABLE 8Eighth to Twelfth Grade Survival, 2000-2001, as Function of Survival in 1996-1997 and Accountability,
Across States, by Race
Wuite Survival Rate Black Survival Rate Hispanic Survival Rate
Independent variable I II I II I II
Accountability index 0.0069 0.0036 0.017 -0.0031 -0.040- -.057
(1.29) (0.45) (0.96) (0.36) (1.96) (1.48)
Prior survival rate 0.917*** 0.639** 0.825** 1.09* 0.146* 0.058
(9.35) (3.16) (3.20) (6.99) (2.61) (0.77)
1996 8th-grade basic 0.0036* -0.0035 0.0048
NAEP (2.07) (1.39) (1.01)
Percent Black or Hispanic 0.122 -0.251- 0.654
(1.60) (2.03) (1.55)
Population-July 1995 5.62 5.07** -2.84(0.31) (2.98) (0.46)
Per-pupil revenue 1990 -5.38 1.58 1.389
(0.53) (0.15) (0.43)
Yearly growth in percent 1.025* -1.47- .396
Black or Hispanic (2.33) (1.94) (0.23)
Yearly population growth -1.31 1.30 2.07
(0.93) (0.64) (0.35)
Constant 0.049 0.027 0.079 0.073 0.80 0.62
(0.55) (0.17) (0.37) (0.747) (10.29) (2.09)
R2 0.71 0.73 0.21 0.83 0.20 0.26
Sample size 44 31 43 23 44 27
Note. When the adjusted survival rates are used, the coefficient on the accountability index in the six models are 0.0012 (0.2U),
.011 (1.04), 0.012 (1.38), .0056 (0.56), -0.0077 (0.32), -0.065 (1.18). With the alternative accountability index the coefficients
on accountability are 0.0071 (1.28), .0051 (0.72), 0.019 (1.11), 0.0030 (0.36), -0.030 (1.44),-.045 (1.23). When 8th-grade test
scores are omitted from Model lI the sample sizes increase to 43 but the coefficients on accountability remain approximately the
same: -0.0021 (0.31), -0.00043 (0.02) and -0.029 (0. 87). t-values in parentheses.
-p <.10, *p <.05, **p <.01, ***p <.001.
percent of students that achieve at least the basiclevel; and the effect sizes for gains at the profi-ciency level are even higher.
Another surprise is that 4th-grade test gainsare generally not as strongly associated with ac-countability as 8th-grade gains. We do find thatstates with stronger accountability saw signifi-cantly greater gains in the percent of 4th-gradeBlack students that achieved at least the basiclevel on the math NAEP (more than a third of astandard deviation increase associated with atwo-step increase in accountability); and mar-ginally significant greater gains in the percent of4th-grade Hispanic students that achieved at leastthe basic level on the math NAEP (approxi-mately a quarter of a standard deviation increaseassociated with a two-step increase in account-ability). We had expected the 4th-grade results tobe stronger because many states have made greatergains on their own state test in the earlier grades
and because elementary school teachers may havemore flexibility to organize their time. Alterna-tively, 8th-grade students may have had more prac-tice on tests and more exposure to accountabilitysince many states start testing in 4th grade. Simi-larly, 8th-grade students may better understandthe benefits of improved test performance and theramifications of accountability for their academicsuccess. Both the 4th-and 8th-grade results hold upto numerous specification checks, though despitepositive effects on math achievement of strongeraccountability, we observe considerable variationamong states with similarly weak or strong ac-countability systems.
The long-term effects of stronger accountabilityare less clear. Our measures of progression throughhigh school are not as reliable as we would like.Because they are based on state-by-grade enroll-ment in each year we cannot distinguish wellamong progression, migration and enrollment
321
Carnoy and Loeb
changes due to demographic population bulges.We find no evidence of a relationship between ac-countability and 9th-grade retention, progressionfrom 10th to 12th grade or progression from 8thto 12th for Black or White students. However wecannot rule out the possibility that accountabilityis associated with increased retention and de-creased progression for Hispanic students. Of themany specifications, only a few show a significantrelationship between accountability and these out-comes, but the point estimates are not accurate.
Certainly the results show no evidence of apositive affect of accountability on student pro-gression through high school. Why might we findpositive test score effects but not positive attain-ment effects? There are a number of possible ex-planations. First, while the NAEP results suggestthat students in states with strong accountabilityprograms are learning more than simply how toscore well on their own state tests, these programsmay be improving test taking skills but notchanging factors that influence educational at-tainment and other outcomes of significance. Analternative explanation is that despite the positiveeffects of high-stakes accountability on math testscores, it may simply be too early to assess thelong-term implications of this relatively new pol-icy initiative on attainment outcomes. We maysee attainment effects as the students who havespent more of their education under accountabil-ity systems move through high school. Our find-ing that states with stronger accountability sys-tems have higher math gains on the 8th-gradeNAEP may mean that students in those stateswill be more likely to do well in their 9th-gradecourses and be more likely to graduate. On aver-age, states with higher math scores do have lower9th-grade retention rates, but this relationship ismuch weaker for African American students.African American students' average achievementmay be sufficiently low in 8th grade that marginalincreases in performance are not enough to im-prove high school course pass rates significantly,especially if standards for passing these coursesare being raised. A third possibility is that out-comes for younger children are more easily in-fluenced than those for high school students.Even though the current 4th and 8th grade studentsare performing better on the NAEP, other factorsmay affect them in high school and reverse theimpact of accountability even on test perfor-mance. A final possible explanation is that higher
322
scores on the NAEP math test may not measure"real" learning. A somewhat higher test score onthe NAEP may not measure the learning thatconverts into better grades in math, English, andsocial studies courses in high school, enablingstudents to complete high school with their co-hort. We cannot distinguish among these possi-bilities with this analysis.
In summary, this article provides evidence thatstates that implemented stronger accountabilitysystems in the 1990s saw larger gains in studentperformance on the National Assessment ofEducation Progress mathematics exam between1996 and 2000. These results are robust to nu-merous specification checks including controlsfor exclusion of students from the test due toclassification into special education or limitedEnglish proficiency. A positive relationship isevident at both the basic level and at the profi-cient level of achievement and for both 8th gradeand 4th grade, though the 8th grade results arestronger. This positive relationship is evidentfor Black, White and Hispanic students.
NoteslThe definition of community has changed over
time, particularly in urban areas, and in many urbancommunities beginning a century ago, business inter-ests became more influential in school policy thanparent groups (Tyack, 1974).
2 Evidence suggests that in choosing schools, parentsare as conscious of the socio-economic background ofstudents attending a school as they are of student testscores (Wells & Crain, 1992).
3 Grissmer and Flanagan (1998) made headlines in1998 when they released a study showing that Texasand North Carolina, two states that had implemented"strong" accountability systems early (Texas in themid-1980s and North Carolina in the early 1990s),made much larger gains than other states in the mathportion of the National Assessment of EducationalProgress (NAEP) between 1992 and 1996. The studysupported claims by the Texas Education Agency(TEA) that minority students made the largest gains,at least in primary school mathematics. These resultssuggested that state accountability systems could helplift academic achievement substantially and that low-performing students could be the primary beneficiariesof the new accountability reforms. Later studies weremore critical though they did not contradict Grissmerand Flanagan. For example, Rand's Stephen Kleinand his colleagues claimed that Texas' NAEP readingscores made only average increases. Their main argu-ment was that the Texas assessment instrument (TAAS)scores rose over the 1994-1998 period, but were not
Does External Accountability Affect Student Outcomes? A Cross-State Analysis
reflected in as great a gain in NAEP scores (Klein,Hamilton, McCaffrey, & Stecher, 2000).
4 Strong accountability is represented by a system ofstate student testing with consequences for schoolsbased on their students' test score improvement andconsequences for students based on their passing highschool exit exams (see Goertz & Duffy, 2001, andTable 1 in this article).
5 Mintrom (2000) showed that the presence of"educational entrepreneurs" pushing school choicein a state was one of only a few significant variablesexplaining the adoption of school choice legislation,two others were opposition of teachers' unions toschool choice and relatively low student test scoregains in the preceding period.
6 For example, Ross Perot in Texas and Rick Mills,the current Education Commissioner in New Yorkand former Commissioner in Vermont, represent in-fluential actors who successfully pushed for schoolaccountability.
7 Some analysts have claimed that southern stateswere more likely to centralize the financing and ad-ministration of public services in the 19th century be-cause of white competition for resources with blacksin economies decimated by the Civil War. HoraceMann Bond (1939) argued, for example, that in Al-abama lowland whites centralized control over scarceeducational resources as a way to cut blacks out ofpublic services and regain political power after Re-construction. Desegregation in the South in the 1970smay have fortified state government influence overlocal schools.
8 In cross-state and cross-national comparisons,Bishop et al. (2001) did not find a relationship be-tween minimum competency exams and student testperformance.
9 Texas has tested students since the early 1980s.The Texas Assessment of Basic Skills was adminis-tered from 1980 through 1985 in grades 5 and 9 andfrom 1981 through 1985 in grade 3. Students were re-quired to retake the 9th grade test in grades 10, 11 and12 if they had not passed it. The Texas EducationalAssessment Management System (TEAMS) was ad-ministered in 1986 through 1989 in grades 1, 3, 5, 7,and 9 (math, reading and writing) and in grades 11 and12 (math and English language arts).
10 Results using levels as the outcome, instead ofchanges, give similar results.
" For the 1992 NAEP reading exam, the followingstates do not have data: Alaska, Idaho, Illinois, Indi-ana, Kansas, Montana, Nevada, Ohio, Oklahoma, Ore-gon, South Dakota, Vermont, and Washington. For the1994 NAEP reading exam, the same states are missingwith the exception of Montana and Washington. Forthe 1992 NAEP mathematics exam Alaska, Idaho,Illinois, Kansas, Montana, Nevada, Oregon, South
Dakota, Vermont, and Washington are missing forWhite students and the same states plus Hawaii, Iowa,Minnesota, New Mexico, Utah, and Wyoming aremissing for Black students. Thirteen states; Alaska,Colorado, Delaware, Florida, Iowa, Kansas, Nevada,New Hampshire, New Jersey, Pennsylvania, SouthDakota, Washington, and Wisconsin do not haveeither the 2000 NAEP math data or an earlier compar-ison year (1996, 1992, or 1990) for 8th graders. Ofthe 37 states with 2000 NAEP scores, all but Illinois,Ohio, and Oklahoma had 1996 scores. For those threestates, we interpolated between 1992 and 2000 to geta 1996 score for Illinois, and between 1990 and 2000to get a 1996 score for Ohio and Oklahoma. The situ-ation was identical for the 4th-grade NAEP math examexcept for Illinois, which had no 1992 score, so itwas left out of the 4th-grade regression estimates. Ofthe 37 states, Arkansas, Kentucky, Maine, and Ver-mont were not in the estimates for Hispanic students.Of the 37 states, Hawaii, Idaho, Maine, Minnesota,Montana, New Mexico, North Dakota, Oregon, Utah,Vermont, and Wyoming are not in the estimates forBlack students.
12 Our outcome measures are correlated. Generally4th-and 8th-grade scores are highly positively corre-lated (for basic proficiency, the correlations are 0.86,0.70, and 0.75 for Whites, Blacks and Hispanics, re-spectively). Test scores are not strongly correlatedwith retention rates for Whites but are for Hispanics(-0.043, 0.18, and -0.37 with 8th grade basic forWhites, Blacks and Hispanics). These scores are pos-itively correlated with 10th to 12th grade progression(0.31, 0.10, and 0.07). Ninth grade retention is con-sistently negatively correlated with 10th to 12th gradeprogression (-0.24, -0.23, and -0.25).
13 The drawback of these measures is that they con-found migration into the state with progression throughhigh school. We create an alternative measure whichadjust the base (i.e., the t-I 8th grade enrollment) bythe percent increase in 8th grade enrollment duringthe progression time. The problem with this alterna-tive measure is that it confounds demographic changesnot due to migration with the progression rate. Theresults for the two measures are similar.
14 Our estimates of state external pressure on localeducational authorities are, by their nature, some-what interpretive, especially in the "middle range"of 2s and 3s. Margaret Goertz, the co-author of thedatabase, checked this index and, in all but a fewcases, agreed with the values we assigned. She ar-gued, for example, that in New York and California,the accountability system had not been in place longenough to count as strong accountability. We in-cluded her values as a check on the robustness of ourresults. The change made little change in the regres-sion estimates.
323
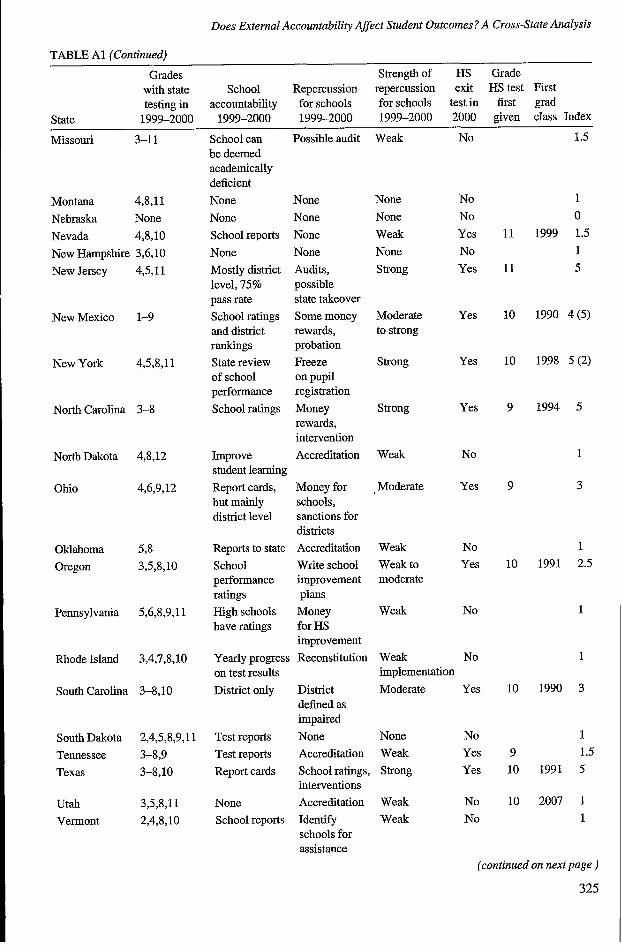
Appendix ATABLE AlAccountability Index, by State, 1999-2000
Grades Strength of HS Gradewith state School Repercussion repercussion exit HS test Firsttesting in accountability for schools for schools test in first grad
State 1999-2000 1999-2000 1999-2000 1999-2000 2000 given class Index
Alabama 3-11 School report Ratings. Strong Yes 10 2001 4
Alaska
Arizona4-7
3,5,8,10
cards interventionNone None NoneReport cards 'Public shame' Weak
Arkansas 4,6 None NoneCalifornia 2-11 Report cards Ratings,
awards,intervention
Colorado 3, literacy None NoneConnecticut 4,6,8,10 Reporting Identify
scores to state schoolswith needs
Delaware 3,5,8,10,11 None NoneFlorida 4,5,8,10 Report cards Ratings,
subject tovouchers
Georgia 3,4,5,8,11 School reports NoneHawaii 3,5,8,10 None NoneIdaho ITBS, 3-8 None NoneIllinois 3,4,5,8,10 Academic Watch lists,
improvement warnings,intervention
Indiana 3,6,8,10 Performance Accreditationassessment
Iowa None None NoneKansas 3,4,5,8,10 School reports AccreditationKentucky 4,5,7,8,10-12 Meeting state Monetary
improvement rewards,goals intervention
Louisiana LEAP,4,8 Report cards, Interventiongrowth targets
Maine 4,8,11 None NoneMaryland 3,5,8 School Monetary
performance rewards,index reconstitution
Massachusetts 4,8,10 Students only Studentpromotions
Michigan 4,5,7,8 School rating AccreditationMinnesota 3,5,8,10 School reports NoneMississippi 2-8 Only districts Public
accountable, recognition,based on loss oftest scores accreditation
Yes 10 2002 1Yes 10 2002 2
None NoStrong No
None NoWeak No
None NoStrong Yes
None Yes
None No
None NoModerate No
Moderate Yes
None No
Weak NoStrong No
Moderate Yes
None No
Strong Yes
Implicit only Yes
Weak No
None Yes
Moderate Yesto strong atdistrict level
110 2004 4 (2)*
11
10 2004 110 1988 5
11 1995 2
1
1
2.5
10 1999 3
0
4
10 1991 3
110,11, 2001 4 (5)
12
10 2003 2
18,10 2
11 1994 3
324
Does External Accountability Affect Student Outcomes? A Cross-State Analysis
TABLE Al (Continued)
Grades Strength of HS Gradewith state School Repercussion repercussion exit HS test Firsttesting in accountability for schools for schools test in first grad
State 1999-2000 1999-2000 1999-2000 1999-2000 2000 given class Index
Missouri 3-11 School can Possible audit Weakbe deemedacademicallydeficient
Montana 4,8,11 None None None
Nebraska None None None None
Nevada 4,8,10 School reports None Weak
New Hampshire 3,6,10 None None None
New Jersey 4,5,11 Mostly district Audits, Stronglevel, 75% possiblepass rate state takeover
New Mexico 1-9 School ratings Some money Moderateand district rewards, to strongrankings probation
New York 4,5,8,11 State review Freeze Strongof school on pupilperformance registration
North Carolina 3-8 School ratings Money Strongrewards,intervention
North Dakota 4,8,12 Improve Accreditation Weakstudent learning
Ohio 4,6,9,12 Report cards, Money for Moderatebut mainly schools,district level sanctions for
districts
Oklahoma 5,8 Reports to state Accreditation Weak
Oregon 3,5,8,10 School Write school Weak toperformance improvement moderateratings plans
Pennsylvania 5,6,8,9,11 High schools Money Weakhave ratings for HS
Rhode Island 3,4,7,8,10
South Carolina 3-8,10
improvement
Yearly progress Reconstitution Weakon test results implementation
District only District Moderatedefined asimpaired
No 1.5
No
No
Yes
No
Yes
10
11 1999 1.5
1
11 5
Yes 10 1990 4 (5)
Yes 10 1998 5 (2)
Yes 9 1994 5
No
Yes 9
1
3
No 1
Yes 10 1991 2.5
No
No
1
1
Yes 10 1990 3
South Dakota 2,4,5,8,9,11 Testreports None None
Tennessee 3-8,9 Test reports Accreditation Weak
Texas 3-8,10 Report cards School ratings, Stronginterventions
Utah 3,5,8,11 None Accreditation Weak
Vermont 2,4,8,10 School reports Identify Weakschools forassistance
No
Yes
Yes
No
No
1
9 1.510 1991 5
10 2007 1
1
(continued on next page)
325
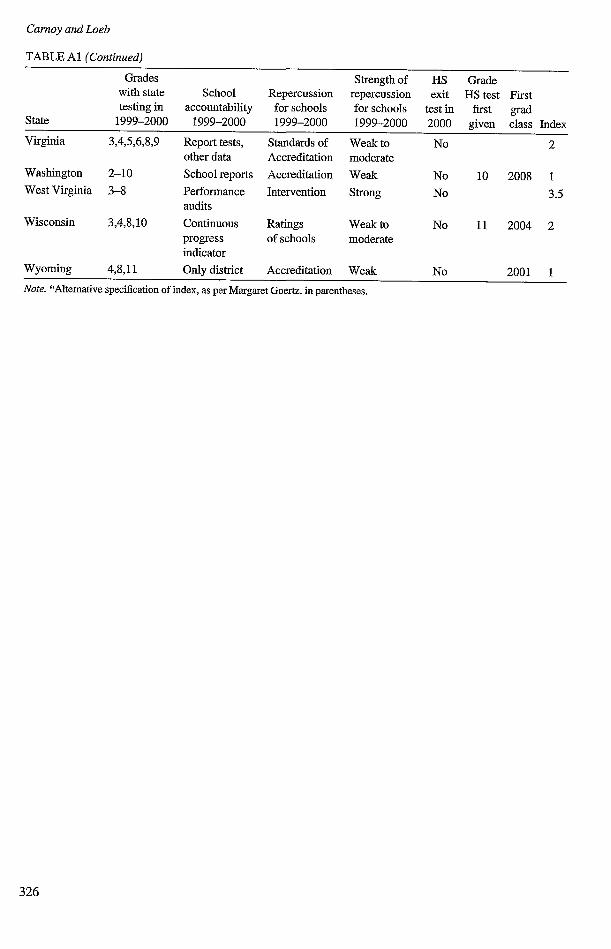
Carnoy and Loeb
TABLE Al (Continued)
Grades Strength of HS Gradewith state School Repercussion repercussion exit HS test Firsttesting in accountability for schools for schools test in first grad
1999-2000 1999-2000 1999-2000 1999-2000 2000 given class IndexState
Virginia 3,4,5,6,8,9 Report tests, Standards of Weak to No 2other data Accreditation moderate
Washington 2-10 School reports Accreditation Weak No 10 2008 1West Virginia 3-8 Performance Intervention Strong No 3.5
auditsWisconsin 3,4,8,10 Continuous Ratings Weak to No 11 2004 2
progress of schools moderateindicator
Wyoming 4,8,11 Only district Accreditation Weak No 2001 1Note. *Alternative specification of index, as per Margaret Goertz, in parentheses.
326
Appendix B
TABLE B1Descriptive Statisticsfor Analysis Variables
Variable Sample Size M SD Min. Max.
Accountability Index 50 2.12 1.44 0 5
NAEP Scores1996 4th grade % basic - Whites1996 4th grade % basic - Blacks1996 4th grade % basic - Hispanics2000 4th grade % basic - Whites2000 4th grade % basic - Blacks2000 4th grade % basic - Hispanics1996 8th grade % basic - Whites1996 8th grade % basic - Blacks1996 8th grade % basic - Hispanics2000 8th grade % basic - Whites2000 8th grade % basic - Blacks2000 8th grade % basic - Hispanics1996 8th grade % proficient - Whites1996 8th grade % proficient - Blacks1996 8th grade % proficient - Hispanics2000 8th grade % proficient - Whites2000 8th grade % proficient - Blacks2000 8th grade % proficient - Hispanics
Change in NAEP Score 1996-20004th grade % basic - Whites4th grade % basic - Blacks4th grade % basic - Hispanics4th grade scale score - Whites4th grade scale score - Blacks4th grade scale score - Hispanics8th grade % basic - Whites8th grade % basic - Blacks8th grade % basic - Hispanics8th grade % proficient - Whites8th grade % proficient - Blacks8th grade % proficient - Hispanics8th grade scale score - Whites8th grade scale score - Blacks8th Grade Scale Score - Hispanics
Progression Rates9th grade 1996/ 8th grade 1995 - Whites9th grade 1996/ 8th grade 1995 - Blacks9th grade 1996 / 8th grade 1995 - Hispanics9th grade 2001 / 8th grade 2000 - Whites9th grade 2001/ 8th grade 2000 - Blacks9th grade 2001 / 8th grade 2000 - Hispanics12th grade 1996/ 10th grade 1994 -Whites12th grade 1996 / 10th grade 1994 - Blacks12th grade 1996/ 10th grade 1994 - Hispanics12th grade 2001 / 10th grade 1999 - Whites12th grade 2001 / 10th grade 1999 - Blacks12th grade 2001 / 10th grade 1999 - Hispanics
36 71.92 6.2527 30.93 6.6332 42.66 9.8736 77.00 6.4827 38.67 9.0432 48.22 8.7737 70.49 6.9526 27.50 6.1333 37.36 9.4137 75.24 6.9526 33.23 8.2233 43.48 11.5137 26.46 6.8126 3.81 1.8633 8.18 3.6037 30.46 7.2726 5.35 2.3033 10.73 5.00
36 5.08 3.9827 7.74 6.6032 5.56 6.3235 3.16 2.9635 4.48 5.0035 2.88 4.7337 4.76 3.6226 5.73 5.4233 6.12 8.5037 4.00 3.0926 1.54 2.1233 2.55 4.1233 2.26 3.2533 3.63 6.7333 3.33 7.95
63 8618 4724 6666 8921 6030 6856 8016 4011 5559 8618 4815 6812 371 82 19
14 441 101 23
-2 13-11 21-13 19-3.62 8.39-3.77 14.57-7.33 15.41-1 15-9 17-9 23-2 13-3 6-6 11-3.36 11.17-9.61 23.05
-13.98 21.73
47 1.06 0.04 1.00 1.1847 1.18 0.14 0.85 1.5047 1.26 0.21 0.88 2.3548 1.06 0.06 0.84 1.2348 1.19 0.12 0.89 1.4648 1.26 0.17 0.83 1.9547 0.86 0.05 0.72 0.9747 0.74 0.09 0.48 0.9347 0.87 0.18 0.44 1.4347 0.87 0.14 0.67 1.7547 0.77 0.16 0.49 1.6246 0.88 0.40 0.46 3.16
(continued on next page)
327
I
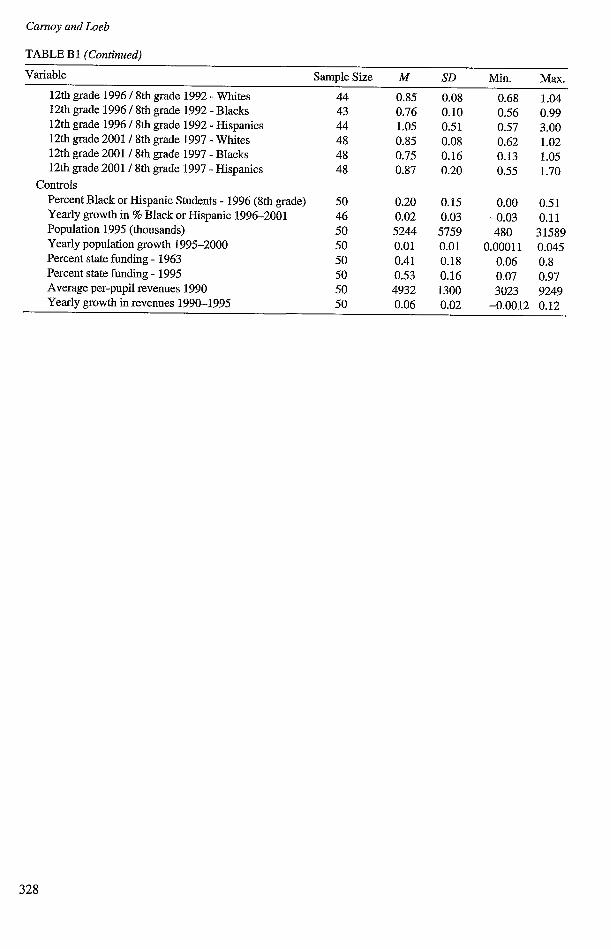
Carnoy and Loeb
TABLE B 1 (Continued)
Variable Sample Size M SD Min. Max.
12th grade 1996 / 8th grade 1992 - Whites 44 0.85 0.08 0.68 1.0412th grade 1996/ 8th grade 1992- Blacks 43 0.76 0.10 0.56 0.9912th grade 1996/ 8th grade 1992 - Hispanics 44 1.05 0.51 0.57 3.0012th grade 2001 / 8th grade 1997 - Whites 48 0.85 0.08 0.62 1.0212th grade 2001 / 8th grade 1997 - Blacks 48 0.75 0.16 0.13 1.0512th grade 2001 / 8th grade 1997 - Hispanics 48 0.87 0.20 0.55 1.70
ControlsPercent Black or Hispanic Students - 1996 (8th grade) 50 0.20 0.15 0.00 0.51Yearly growth in % Black or Hispanic 1996-2001 46 0.02 0.03 -0.03 0.11Population 1995 (thousands) 50 5244 5759 480 31589Yearly population growth 1995-2000 50 0.01 0.01 0.00011 0.045Percent state funding - 1963 50 0.41 0.18 0.06 0.8Percent state funding - 1995 50 0.53 0.16 0.07 0.97Average per-pupil revenues 1990 50 4932 1300 3023 9249Yearly growth in revenues 1990-1995 50 0.06 0.02 -0.0012 0.12
328
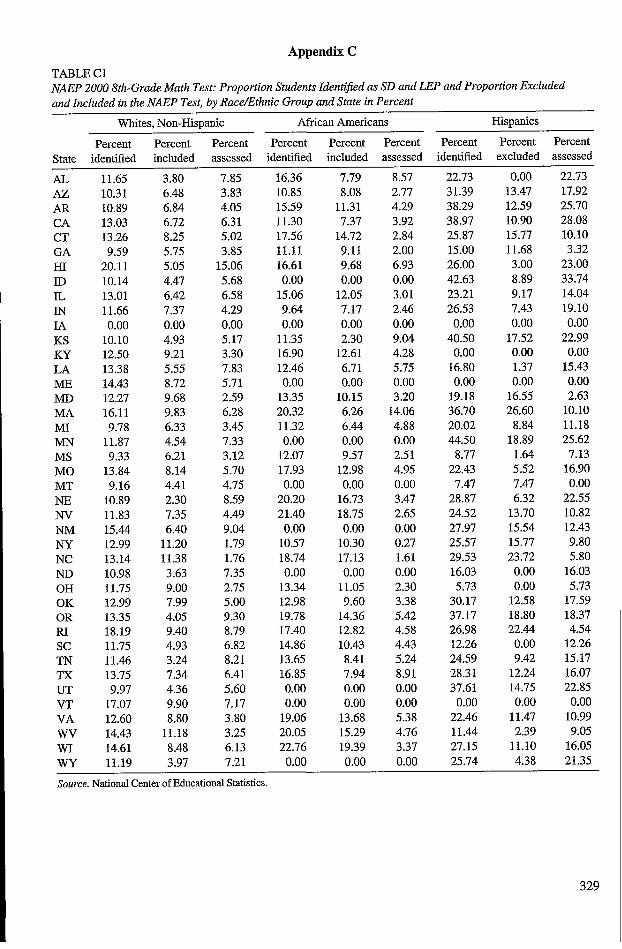
Appendix C
TABLE ClNAEP 2000 8th-Grade Math Test: Proportion Students Identified as SD and LEP and Proportion Excludedand Included in the NAEP Test, by Race/Ethnic Group and State in Percent
Whites, Non-Hispanic African Americans
Percent Percent Percent Percent Percent Percent Percent Percent Percent
State identified included assessed identified included assessed identified excluded assessed
AL 11.65AZ 10.31AR 10.89CA 13.03CT 13.26GA 9.59HI 20.11ID 10.14IL 13.01IN 11.66IA 0.00KS 10.10KY 12.50LA 13.38ME 14.43MD 12.27MA 16.11MI 9.78MIN 11.87MS 9.33MO 13.84MT 9.16NE 10.89NV 11.83NM 15.44NY 12.99NC 13.14ND 10.98OH 11.75OK 12.99OR 13.35RI 18.19SC 11.75TN 11.46TX 13.75UT 9.97VT 17.07VA 12.60WV 14.43WI 14.61WY 11.19
3.806.486.846.728.255.755.054.476.427.370.004.939.215.558.729.689.836.334.546.218.144.412.307.356.40
11.2011.383.639.007.994.059.404.933.247.344.369.908.80
11.188.483.97
7.853.834.056.315.023.85
15.065.686.584.290.005.173.307.835.712.596.283.457.333.125.704.758.594.499.041.791.767.352.755.009.308.796.828.216.415.607.173.803.256.137.21
16.3610.8515.5911.3017.5611.1116.610.00
15.069.640.00
11.3516.9012.460.00
13.3520.3211.320.00
12.0717.930.00
20.2021.40
0.0010.5718.740.00
13.3412.9819.7817.4014.8613.6516.850.000.00
19.0620.0522.76
0.00
7.79 8.578.08 2.77
11.31 4.297.37 3.92
14.72 2.849.11 2.009.68 6.930.00 0.00
12.05 3.017.17 2.460.00 0.002.30 9.04
12.61 4.286.71 5.750.00 0.00
10.15 3.206.26 14.066.44 4.880.00 0.009.57 2.51
12.98 4.950.00 0.00
16.73 3.4718.75 2.650.00 0.00
10.30 0.2717.13 1.610.00 0.00
11.05 2.309.60 3.38
14.36 5.4212.82 4.5810.43 4.438.41 5.247.94 8.910.00 0.000.00 0.00
13.68 5.3815.29 4.7619.39 3.370.00 0.00
22.7331.3938.2938.9725.8715.0026.0042.6323.2126.53
0.0040.50
0.0016.800.00
19.1836.7020.0244.50
8.7722.43
7.4728.8724.5227.9725.5729.5316.035.73
30.1737.1726.9812.2624.5928.3137.610.00
22.4611.4427.1525.74
0.00 22.7313.47 17.9212.59 25.7010.90 28.0815.77 10.1011.68 3.323.00 23.008.89 33.749.17 14.047.43 19.100.00 0.00
17.52 22.990.00 0.001.37 15.430.00 0.00
16.55 2.6326.60 10.10
8.84 11.1818.89 25.62
1.64 7.135.52 16.907.47 0.006.32 22.55
13.70 10.8215.54 12.4315.77 9.8023.72 5.80
0.00 16.030.00 5.73
12.58 17.5918.80 18.3722.44 4.54
0.00 12.269.42 15.17
12.24 16.0714.75 22.850.00 0.00
11.47 10.992.39 9.05
11.10 16.054.38 21.35
Source. National Center of Educational Statistics.
329
Hispanics
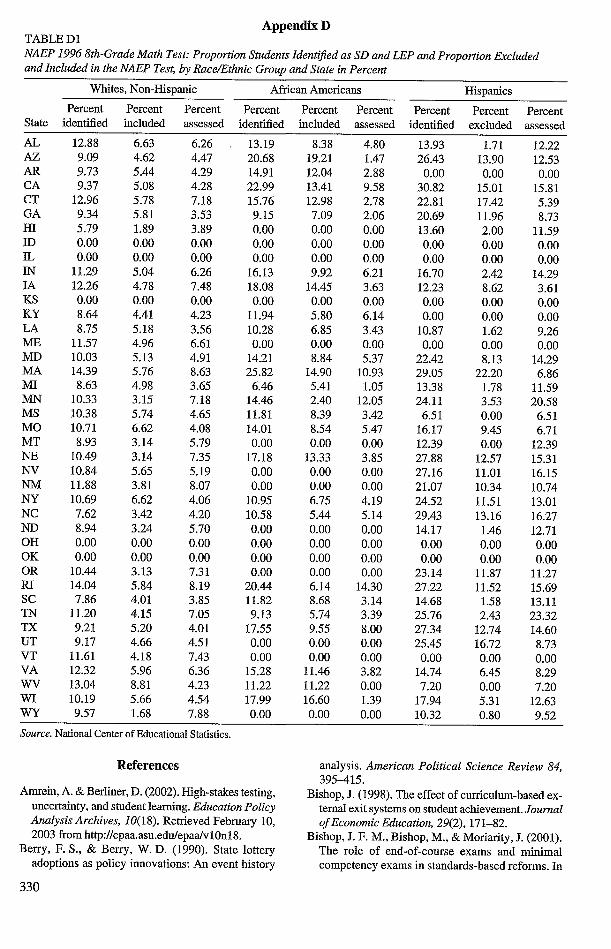
Appendix DTABLE DlNAEP 1996 8th-Grade Math Test: Proportion Students Identified as SD and LEP and Proportion Excludedand Included in the NAEP Test, by Race/Ethnic Group and State in Percent
Whites, Non-Hispanic African Americans Hispanics
Percent Percent Percent Percent Percent Percent Percent Percent PercentState identified included assessed identified included assessed identified excluded assessed
AL 12.88AZ 9.09AR 9.73CA 9.37CT 12.96GA 9.34HI 5.79ID 0.00IL 0.00IN 11.29IA 12.26KS 0.00KY 8.64LA 8.75ME 11.57MD 10.03MA 14.39MI 8.63MN 10.33MS 10.38MO 10.71MT 8.93NE 10.49NV 10.84NM 11.88NY 10.69NC 7.62ND 8.94OH 0.00OK 0.00OR 10.44RI 14.04SC 7.86TN 11.20TX 9.21UT 9.17VT 11.61VA 12.32WV 13.04WI 10.19WY 9.57
6.634.625.445.085.785.811.890.000.005.044.780.004.415.184.965.135.764.983.155.746.623.143.145.653.816.623.423.240.000.003.135.844.014.155.204.664.185.968.815.661.68
6.264.474.294.287.183.533.890.000.006.267.480.004.233.566.614.918.633.657.184.654.085.797.355.198.074.064.205.700.000.007.318.193.857.054.014.517.436.364.234.547.88
13.1920.6814.9122.9915.769.150.000.000.00
16.1318.080.00
11.9410.280.00
14.2125.826.46
14.4611.8114.010.00
17.180.000.00
10.9510.580.000.000.000.00
20.4411.829.13
17.550.000.00
15.2811.2217.990.00
8.38 4.8019.21 1.4712.04 2.8813.41 9.5812.98 2.787.09 2.060.00 0.000.00 0.000.00 0.009.92 6.21
14.45 3.630.00 0.005.80 6.146.85 3.430.00 0.008.84 5.37
14.90 10.935.41 1.052.40 12.058.39 3.428.54 5.470.00 0.00
13.33 3.850.00 0.000.00 0.006.75 4.195.44 5.140.00 0.000.00 0.000.00 0.000.00 0.006.14 14.308.68 3.145.74 3.399.55 8.000.00 0.000.00 0.00
11.46 3.8211.22 0.0016.60 1.390.00 0.00
13.9326.430.00
30.8222.8120.6913.600.000.00
16.7012.230.000.00
10.870.00
22.4229.0513.3824.116.51
16.1712.3927.8827.1621.0724.5229.4314.170.000.00
23.1427.2214.6825.7627.3425.450.00
14.747.20
17.9410.32
1.71 12.2213.90 12.530.00 0.00
15.01 15.8117.42 5.3911.96 8.732.00 11.590.00 0.000.00 0.002.42 14.298.62 3.610.00 0.000.00 0.001.62 9.260.00 0.008.13 14.29
22.20 6.861.78 11.593.53 20.580.00 6.519.45 6.710.00 12.39
12.57 15.3111.01 16.1510.34 10.7411.51 13.0113.16 16.271.46 12.710.00 0.000.00 0.00
11.87 11.2711.52 15.69
1.58 13.112.43 23.32
12.74 14.6016.72 8.730.00 0.006.45 8.290.00 7.205.31 12.630.80 9.52
Source. National Center of Educational Statistics.
References analysis. American Political Science Review 84,395-415.
Amrein, A. & Berliner, D. (2002). High-stakes testing, Bishop, J. (1998). The effect of curriculum-based ex-uncertainty, and student leaming. Education Policy ternal exit systems on student achievement. JournalAnalysis Archives, 10(18). Retrieved February 10, of Economic Education, 29(2), 171-82.2003 from http://epaa.asu.edu/epaa/vlOnl8. Bishop, J. F. M., Bishop, M., & Moriarity, J. (2001).
Berry, F. S., & Berry, W. D. (1990). State lottery The role of end-of-course exams and minimaladoptions as policy innovations: An event history competency exams in standards-based reforms. In
330
Does External Accountability Affect Student Outcomes? A Cross-State Analysis
D. Ravitch (Ed.), Brooking Papers in EducationalPolicy 2001, (pp.267-34 5). Washington, DC: Brook-ings Institution.
Bond, H. M. (1939). Negro education in Alabama:A study in cotton and steel. Washington, DC: TheAssociated Publishers Inc.
Carnoy, M., Loeb, S., & Smith, T. (2001). Do higherstate test scores in Texas make for better high schooloutcomes? CPRE Research Report No. RR-047.Philadelphia, PA: Consortium for Policy Researchin Education.
Carnoy, M. et al. (in press) The new accountability:high schools and high stakes testing. New York:Routledge.
Cohen, D. K., & Ball, D. L. (1999). Instruction, ca-
pacity and improvement. CPRE Research ReportNo. RR-043. Philadelphia, PA: Consortium for Pol-icy Research in Education.
Darling-Hammond, L. (1997). The quality of teach-ers matters most. The Journal of Staff Develop-ment 18(1).
Dee, T. S. (2002). Standards and student outcomes:Lessonsfrom the "first wave" of education reforms.Working paper PEPG 02-08. Swarthmore College.
Elmore, R. (1995). Teaching, learning, and schoolorganization: Principles of practice and the regu-larities of schooling. Educational AdministrationQuarterly, 31(3), 355-374.
Goertz, M. E., & Duffy, M. C. (2001). Assessmentand accountability systems in 50 states: 1999-2000.CPRE Research Report No. RR-046. Philadelphia,PA: Consortium for Policy Research in Education.
Grissmer, D., & Flanagan, A. (1998). Exploring rapid
achievement gains in North Carolina and Texas.Washington, DC: National Education Goals Panel.
Haney, W. 2000. Reportfor testimony in Glforum v.
Texas EducationAgency. Boston, MA: Boston Col-lege, School of Education.
Jacobs, B. A. (2001). Getting tough? The impact ofhigh school graduation exams. EEPA 23 (2): 99-122.
Klein, S. P., Hamilton, L. S., McCaffrey, D. F., &Stecher, B. M. (2000). What do test scores in Texastell us? RAND Issue Paper. Santa Monica, CA:RAND.
Lillard, D. R., & DeCicca, P. P. (2001). Higher stan-dards, more dropouts? Evidence within and acrosstime. Economics of Education Review 20, 459-473.
McLaughlin, D. (2001). Exclusions and accommoda-tions affect state NAEP gain statistics: Mathemat-ics, 1996 to 2000. Palo Alto, CA: American Insti-tutes for Research.
Mintrom, M. (2000). Policy entrepreneurs and school
choice. Washington, DC: Georgetown UniversityPress.
National Center for Educational Statistics. (2001).
The nation's report card: State mathematics 2000
report. Report No. 2001519. Washington, DC:
Author.O'Day, J. A., & Smith, M. S. (1993). School reform
and equal opportunity: An introduction to the edu-
cation symposium, Stanford Law and Policy Re-
view 4, 15-20.Rhoten, D., Carnoy, M., Elmore, R., & Chabran, M.
(2003). The conditions and characteristics of as-
sessment and accountability: The case of four states.
In M. Carnoy et al. (Eds.), High schools and the new
accountability: A schools-eye view of standards-
based reforms. Manuscript submitted for publica-tion. New York: Routledge.
Rumberger, R. (1995). Dropping out of middle school:
A multilevel analysis of students and schools. Amer-
ican Educational Research Journal, 32(3),583-625.Serrano v. Priest, California State Supreme Court
(1971).Smith, M. S., O'Day, J. A., & Cohen, D. K. (1990).
National curriculum, American style: What might
it look like? American Educator 14(4). 10-17,
40-43.Talbert, J. E., McLaughlin, M., & Rowan, B. (1993).
Understanding context effects on secondary schoolteaching. Teachers College Record, 95(1), 45-68.
Tyack, D. (1974). The one best system: A history of
American urban education. Cambridge, MA: Har-vard University Press.
Walker, L. 1969. The diffusion of innovations amongthe American states. American Political Science Re-
view 63, 880-899.Wells, A. S., & Crain, R. L. (1992). Do parents
choose school quality or school status? A socio-
logical theory of free market education. In P. W.
Cookson (Ed.), The choice controversy (pp. 65-81).Newbury Park, CA: Corwin Press.
Authors
MARTIN CARNOY is Professor of Education,School of Education, Stanford University, Stanford,CA 94305; [email protected]. His area of special-
ization is the economics of education.SUSANNA LOEB is Assistant Professor, School of
Education, Stanford University, 224 CEBS 520 GalvezMall, Stanford, CA 94305; [email protected]. Her
area of specialization is the economics of education.
Manuscript Received June 3, 2002Revision Received January 2, 2003
Accepted January 23, 2003
331
COPYRIGHT INFORMATION
TITLE: Does External Accountability Affect Student Outcomes?A Cross-State Analysis
SOURCE: Educ Eval Policy Anal 24 no4 Wint 2002WN: 0234903465003
The magazine publisher is the copyright holder of this article and itis reproduced with permission. Further reproduction of this article inviolation of the copyright is prohibited. To contact the publisher:http://www.aera.net/
Copyright 1982-2003 The H.W. Wilson Company. All rights reserved.