Embed Size (px)
Citation preview
Outcomes Based Accountability - DSP July 2009
Outcomes BasedAccountability
Presentation to Dorset Strategic Partnership Annual Conference
July 2009Steve Pitt
Outcomes Based Accountability - DSP July 2009
Outcomes Based Accountability
Mark Friedman, The Fiscal Policy Studies Institute, Santa Fe, New Mexico
WEBSITES:www.raguide.orgwww.resultsaccountability.com

Outcomes Based Accountability - DSP July 2009
Outcomes Based Accountability - DSP July 2009
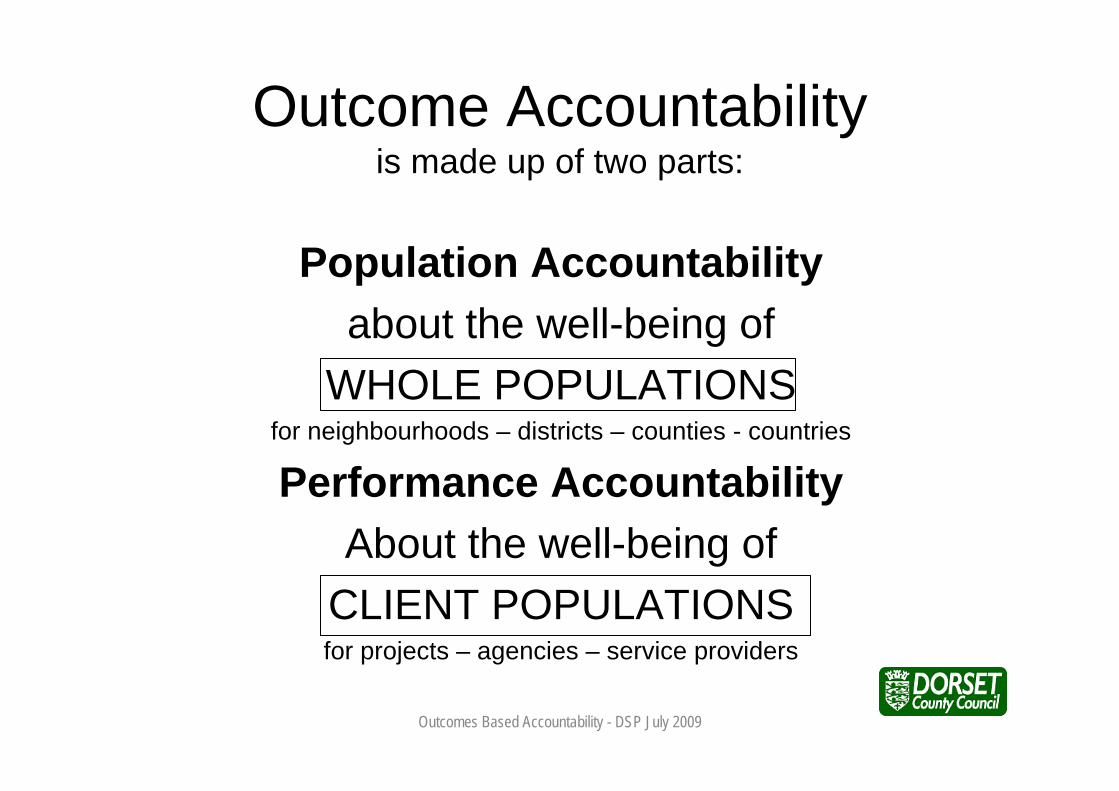
Outcome Accountabilityis made up of two parts:
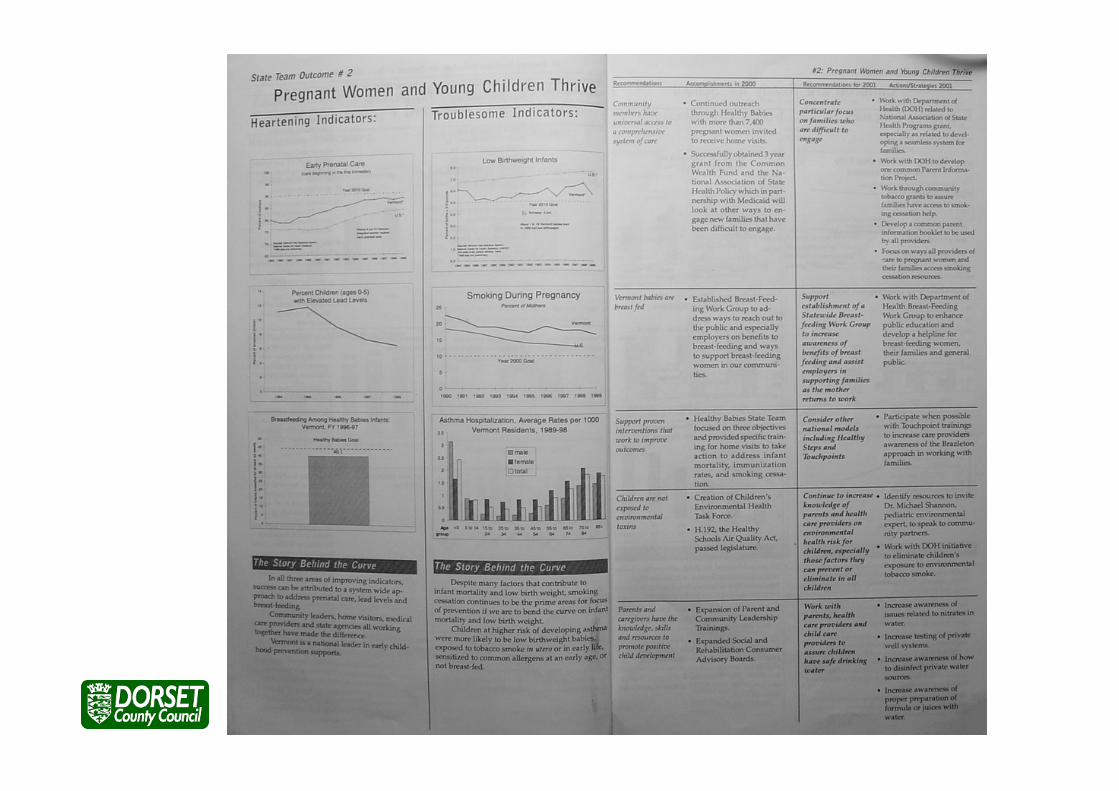
Population Accountabilityabout the well-being of
WHOLE POPULATIONSfor neighbourhoods – districts – counties - countries
Performance AccountabilityAbout the well-being of
CLIENT POPULATIONSfor projects – agencies – service providers
Outcomes Based Accountability - DSP July 2009
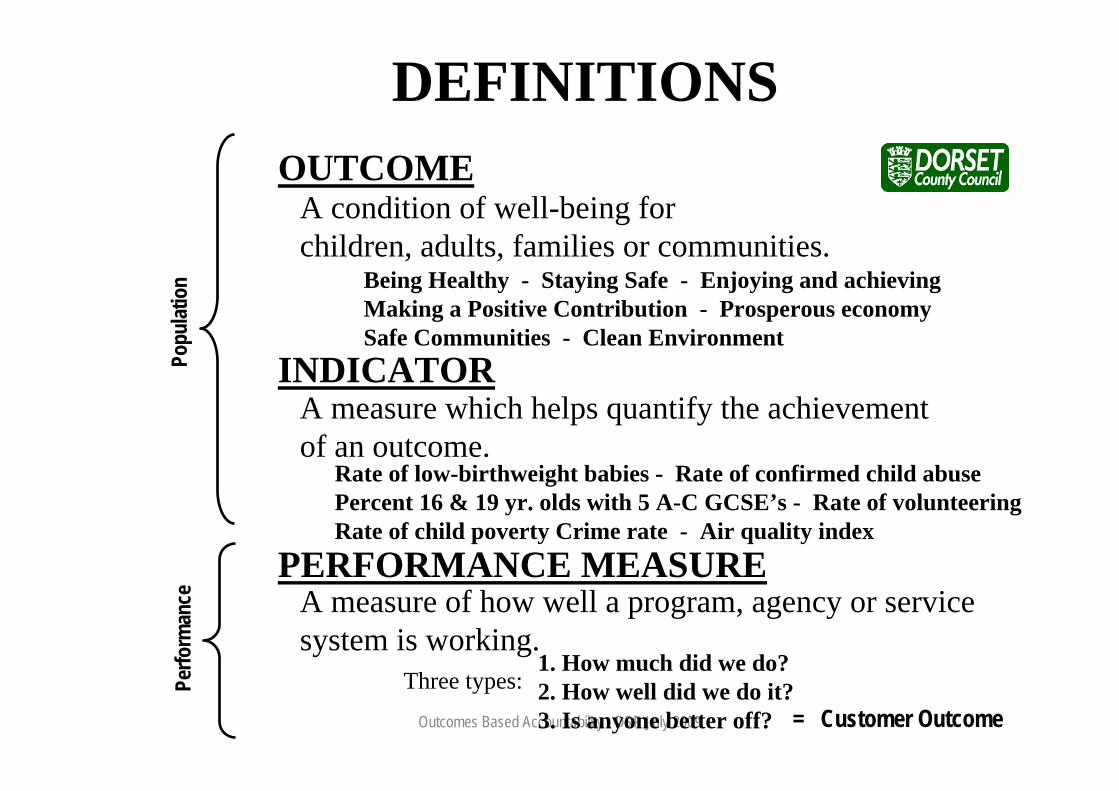
DEFINITIONS
Being Healthy - Staying Safe - Enjoying and achievingMaking a Positive Contribution - Prosperous economy Safe Communities - Clean Environment
Rate of low-birthweight babies - Rate of confirmed child abuse Percent 16 & 19 yr. olds with 5 A-C GCSE’s - Rate of volunteering Rate of child poverty Crime rate - Air quality index
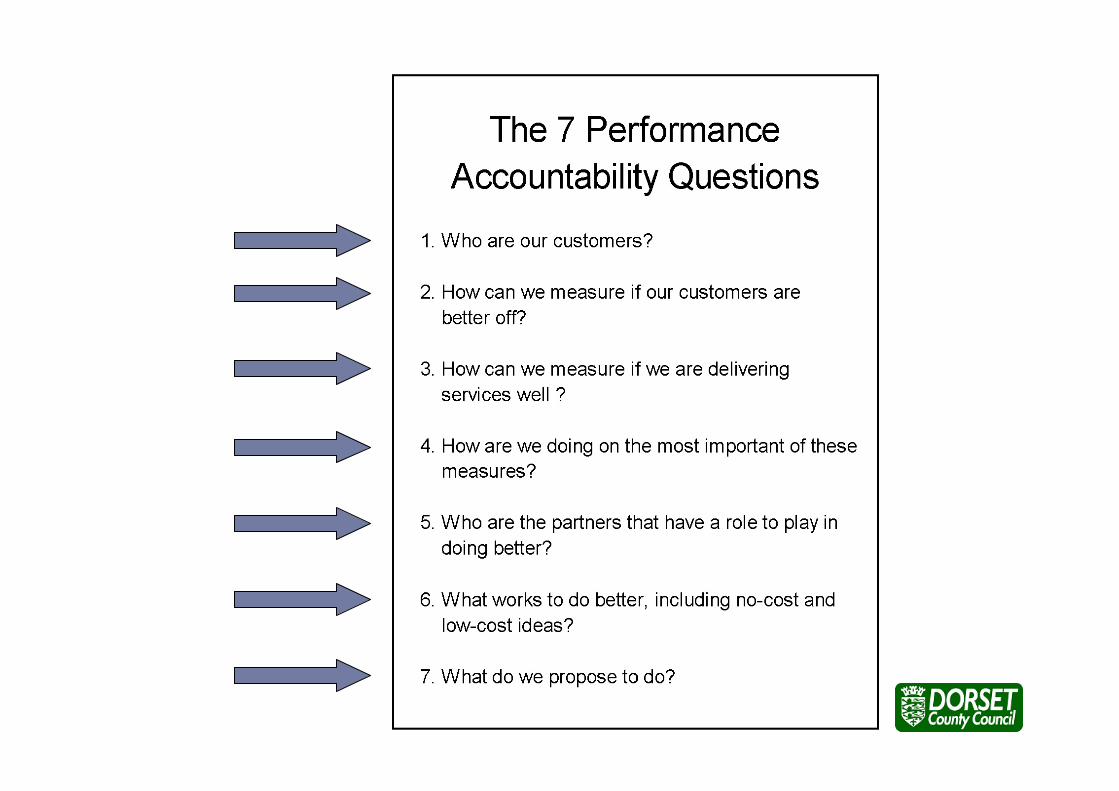
1. How much did we do? 2. How well did we do it? 3. Is anyone better off?
OUTCOME
INDICATOR
PERFORMANCE MEASURE
A condition of well-being for children, adults, families or communities.
A measure which helps quantify the achievement of an outcome.
A measure of how well a program, agency or service system is working.
Three types:= Customer Outcome
Popu
latio
nPe
rform
ance
Outcomes Based Accountability - DSP July 2009
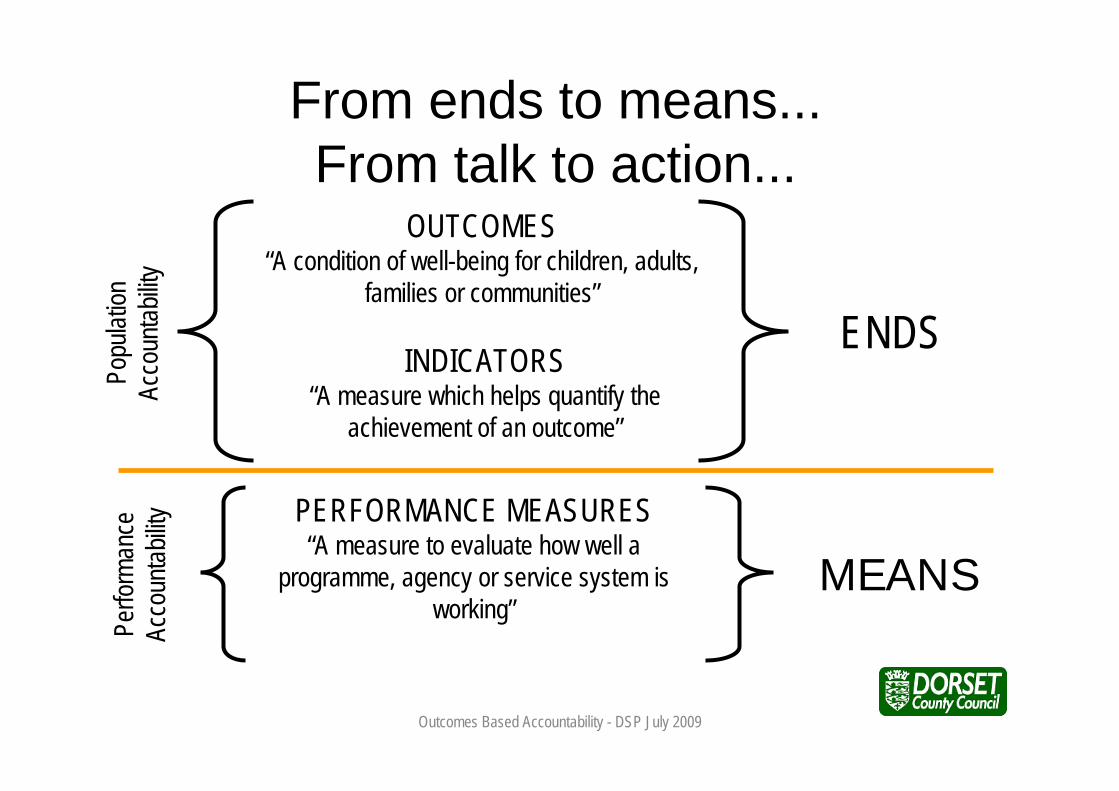
From ends to means...From talk to action...
ENDS
OUTCOMES“A condition of well-being for children, adults,
families or communities”
PERFORMANCE MEASURES“A measure to evaluate how well a
programme, agency or service system is working”
MEANS
INDICATORS“A measure which helps quantify the
achievement of an outcome”
Popu
lation
Ac
coun
tabilit
yPe
rform
ance
Acco
untab
ility
Outcomes Based Accountability - DSP July 2009
POPULATIONACCOUNTABILITY
For Whole Populationsin a Geographic Area
Outcomes Based Accountability - DSP July 2009
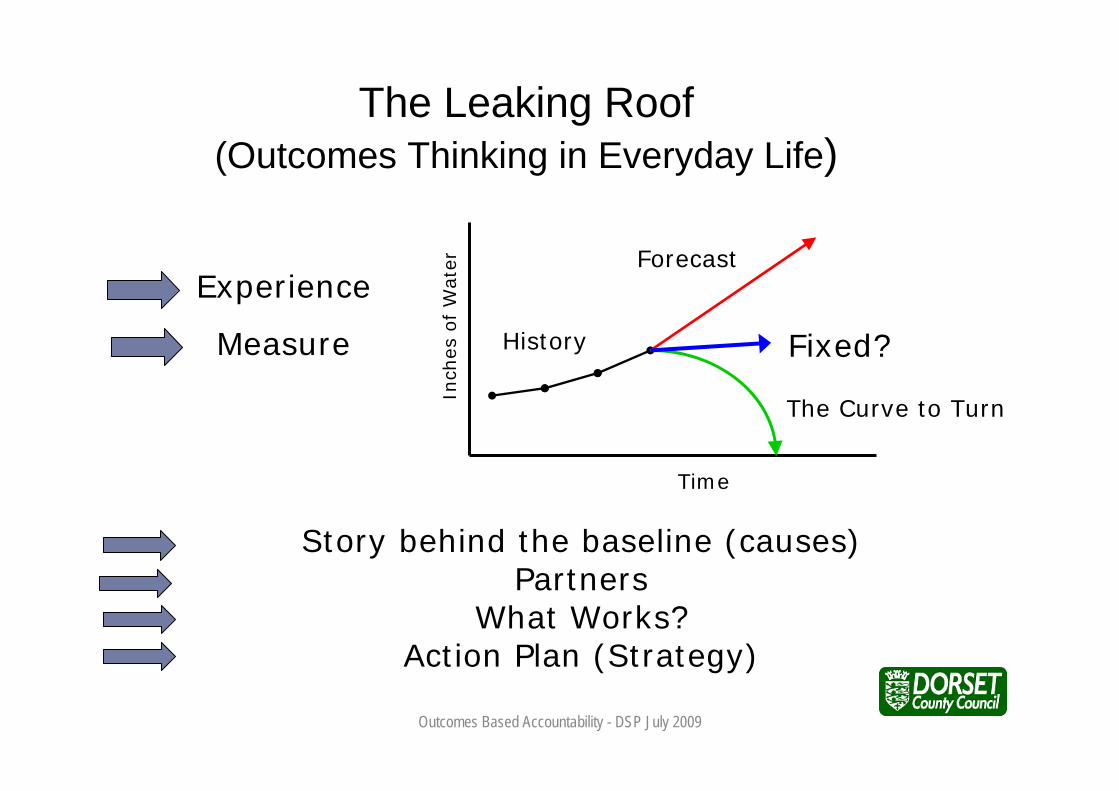
The Leaking Roof(Outcomes Thinking in Everyday Life)
Inch
es o
f W
ater
Time
Experience
Measure
Story behind the baseline (causes)Partners
What Works?Action Plan (Strategy)
Forecast
Fixed?History
The Curve to Turn
Outcomes Based Accountability - DSP July 2009
Outcomes
Outcomes Based Accountability - DSP July 2009
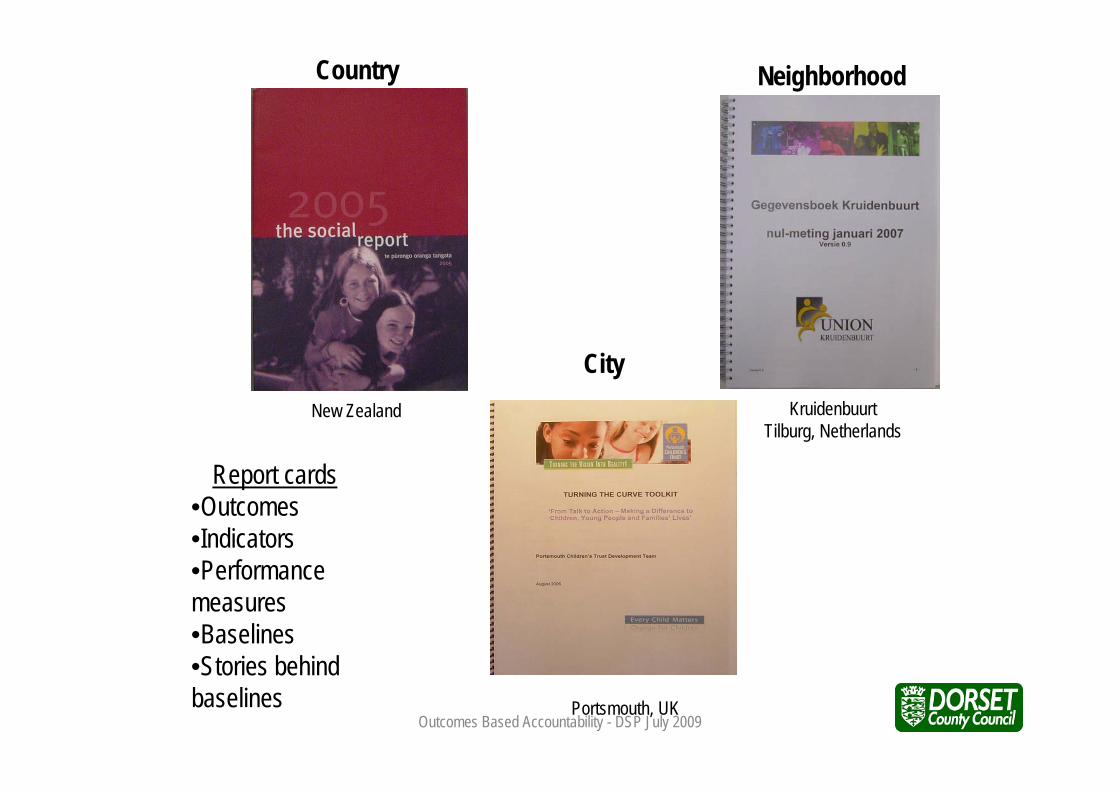
New Zealand KruidenbuurtTilburg, Netherlands
Portsmouth, UK
Country Neighborhood
City
Report cards•Outcomes•Indicators•Performance measures•Baselines•Stories behind baselines
Outcomes Based Accountability - DSP July 2009
Outcomes Based Accountability - DSP July 2009
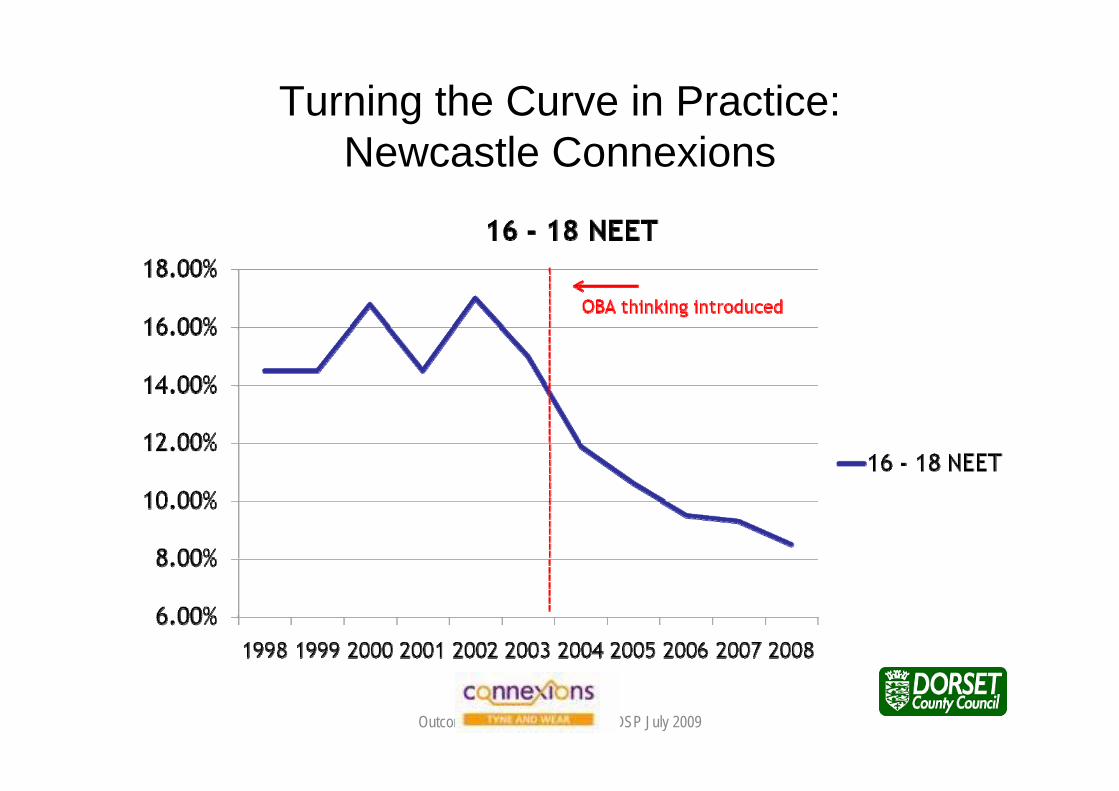
Turning the Curve in Practice:Newcastle Connexions
Outcomes Based Accountability - DSP July 2009
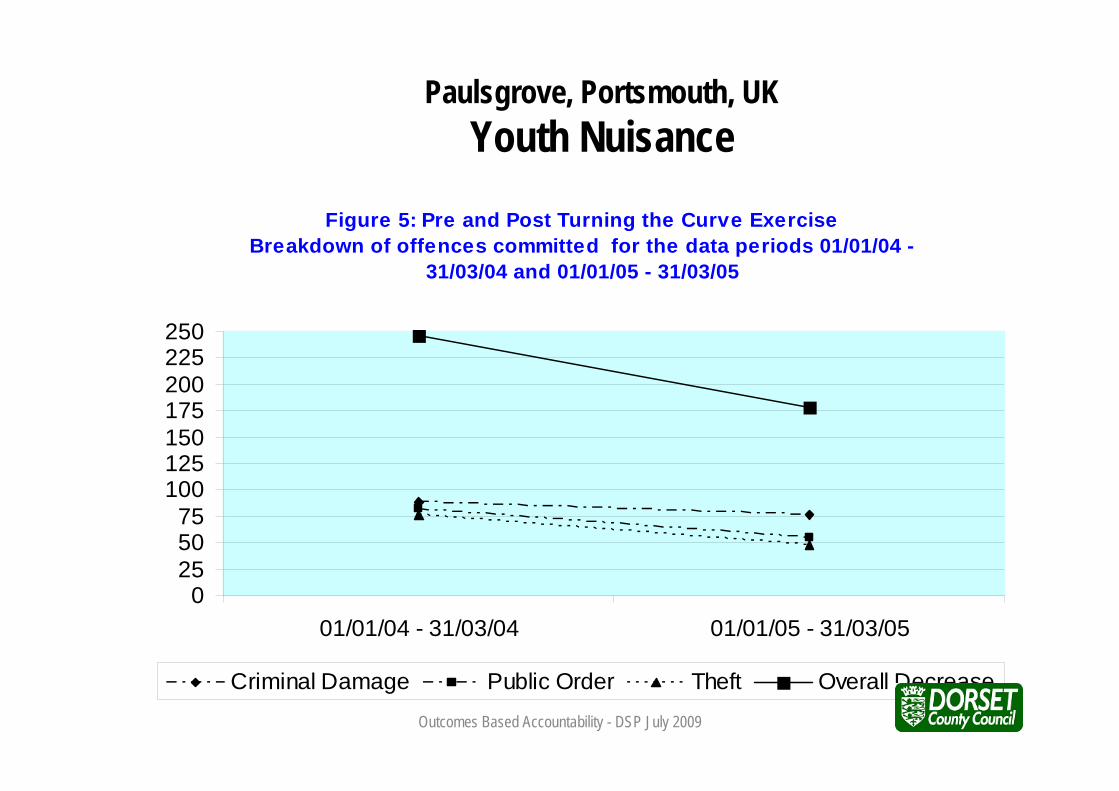
Figure 5: Pre and Post Turning the Curve ExerciseBreakdown of offences committed for the data periods 01/01/04 -
31/03/04 and 01/01/05 - 31/03/05
0255075
100125150175200225250
01/01/04 - 31/03/04 01/01/05 - 31/03/05
Criminal Damage Public Order Theft Overall Decrease
Paulsgrove, Portsmouth, UKYouth Nuisance
Outcomes Based Accountability - DSP July 2009
Performance Accountability
For Services, Agencies and Service Systems
Outcomes Based Accountability - DSP July 2009
Outcomes Based Accountability - DSP July 2009
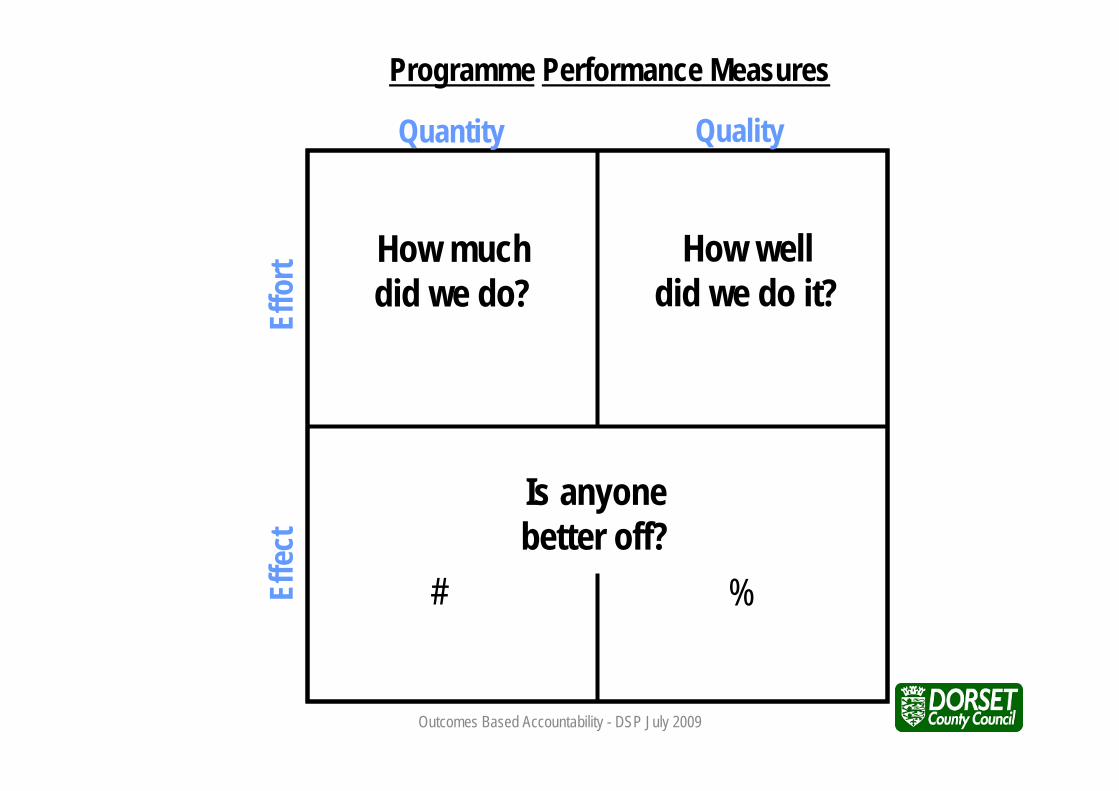
How much did we do?
Programme Performance Measures
How welldid we do it?
Is anyonebetter off?
Quantity Quality
Effe
ct
E
ffort
# %
Outcomes Based Accountability - DSP July 2009
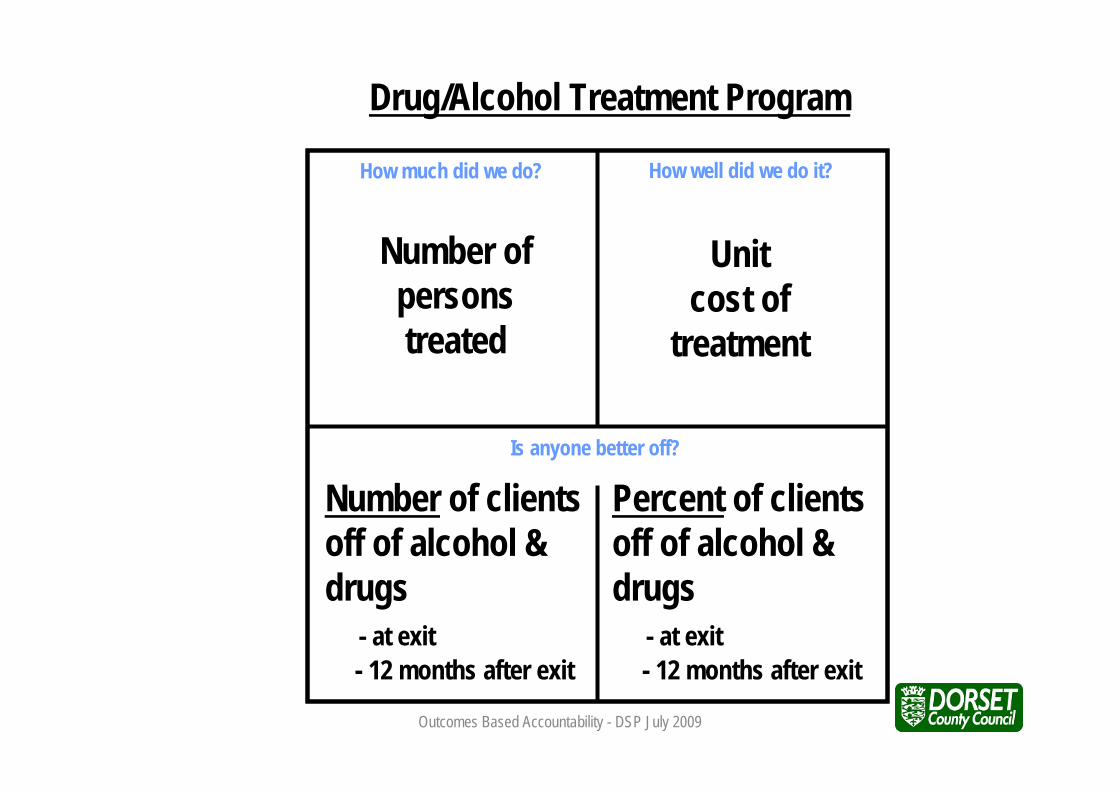
How much did we do?
Drug/Alcohol Treatment Program
How well did we do it?
Is anyone better off?
Number ofpersonstreated
Unitcost of
treatment
Number of clientsoff of alcohol & drugs
- at exit- 12 months after exit
Percent of clientsoff of alcohol & drugs
- at exit- 12 months after exit
Outcomes Based Accountability - DSP July 2009
How Population
&Performance Accountability
FIT TOGETHER
Outcomes Based Accountability - DSP July 2009
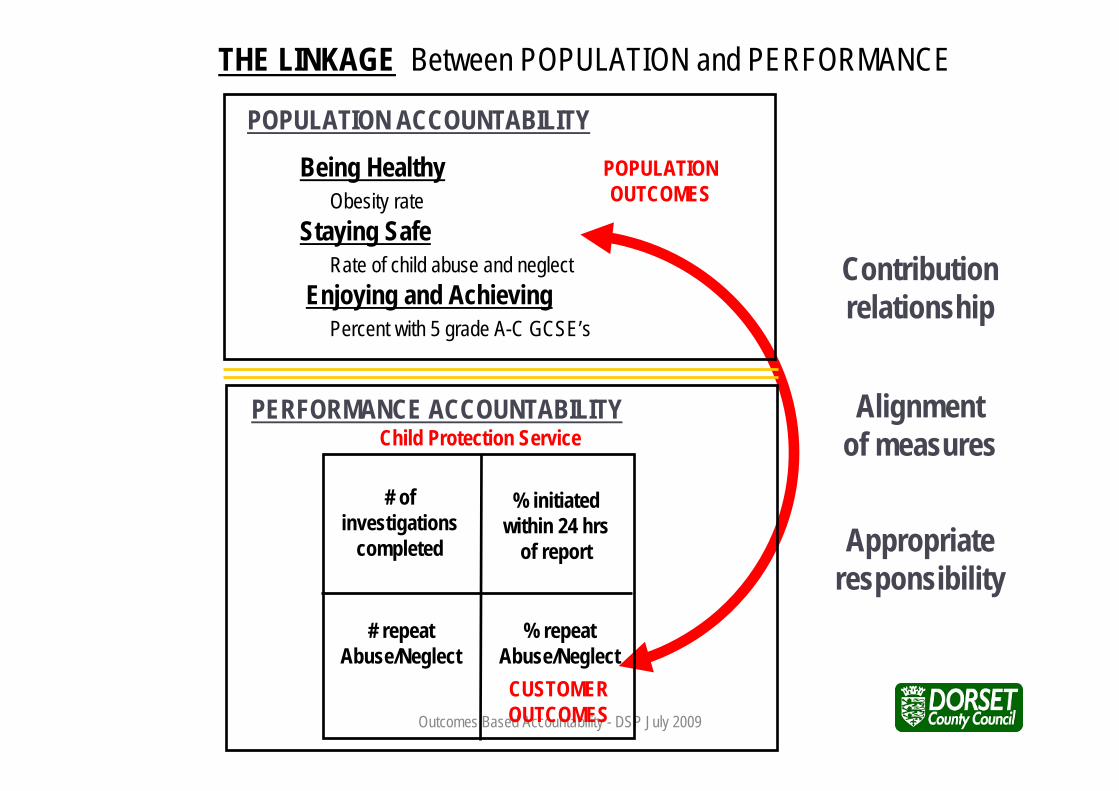
Contributionrelationship
Alignmentof measures
Appropriateresponsibility
THE LINKAGE Between POPULATION and PERFORMANCE
POPULATION ACCOUNTABILITY
Being HealthyObesity rate
Staying SafeRate of child abuse and neglect
Enjoying and AchievingPercent with 5 grade A-C GCSE’s
CUSTOMEROUTCOMES
# ofinvestigations
completed
% initiatedwithin 24 hrs
of report
# repeatAbuse/Neglect
% repeatAbuse/Neglect
PERFORMANCE ACCOUNTABILITY
POPULATIONOUTCOMES
Child Protection Service
Outcomes Based Accountability - DSP July 2009
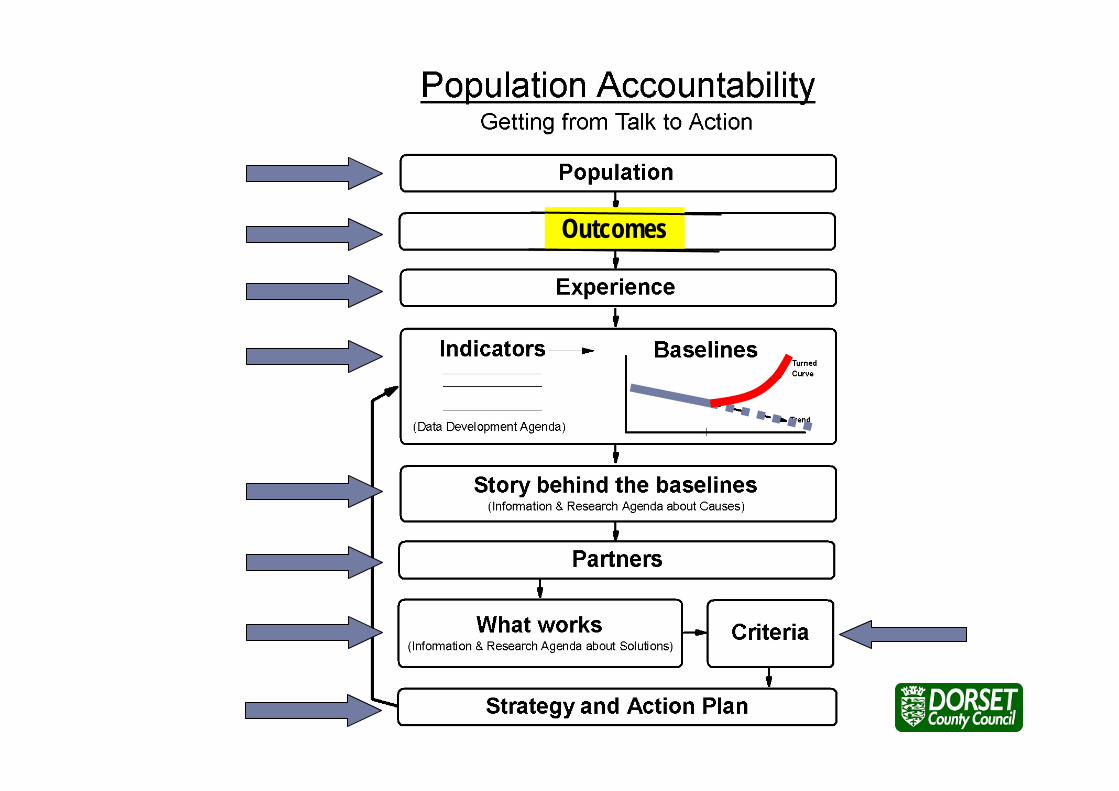
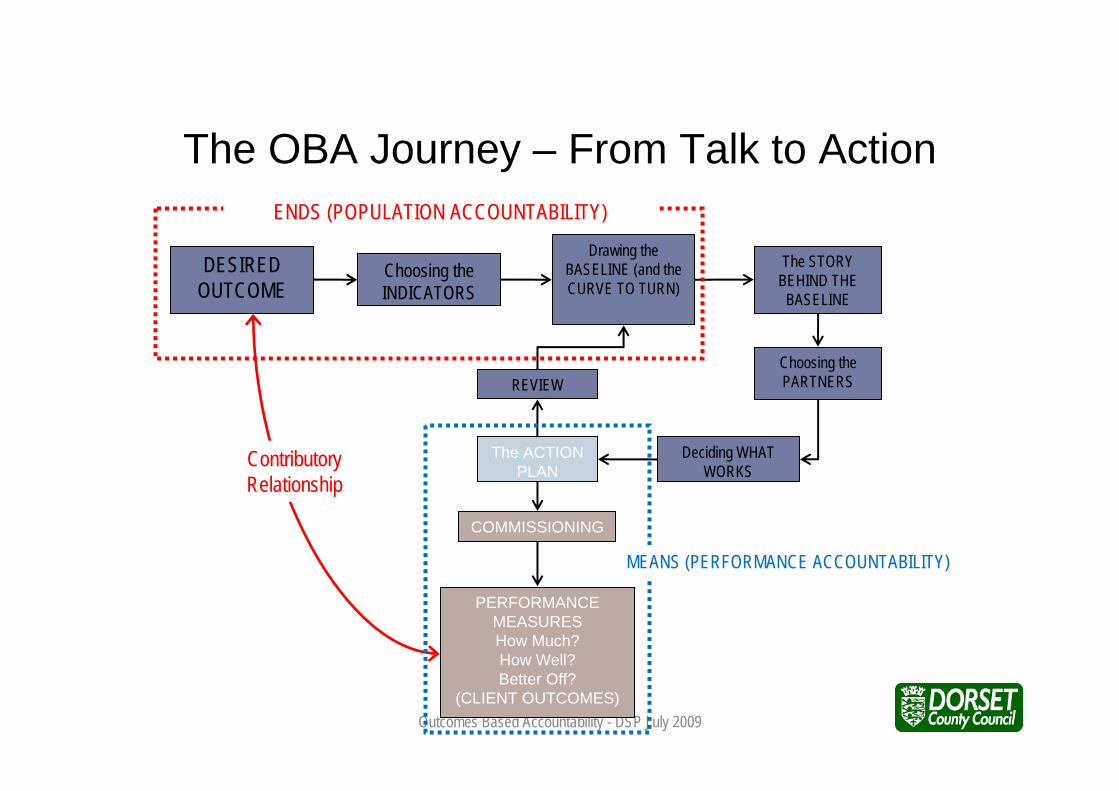
The OBA Journey – From Talk to Action
DESIREDOUTCOME
Choosing the INDICATORS
Drawing the BASELINE (and the CURVE TO TURN)
The STORY BEHIND THE
BASELINE
Choosing the PARTNERS
Deciding WHAT WORKS
The ACTION PLAN
REVIEW
COMMISSIONING
PERFORMANCE MEASURESHow Much?How Well?Better Off?
(CLIENT OUTCOMES)
Contributory Relationship
ENDS (POPULATION ACCOUNTABILITY)
MEANS (PERFORMANCE ACCOUNTABILITY)
Outcomes Based Accountability - DSP July 2009
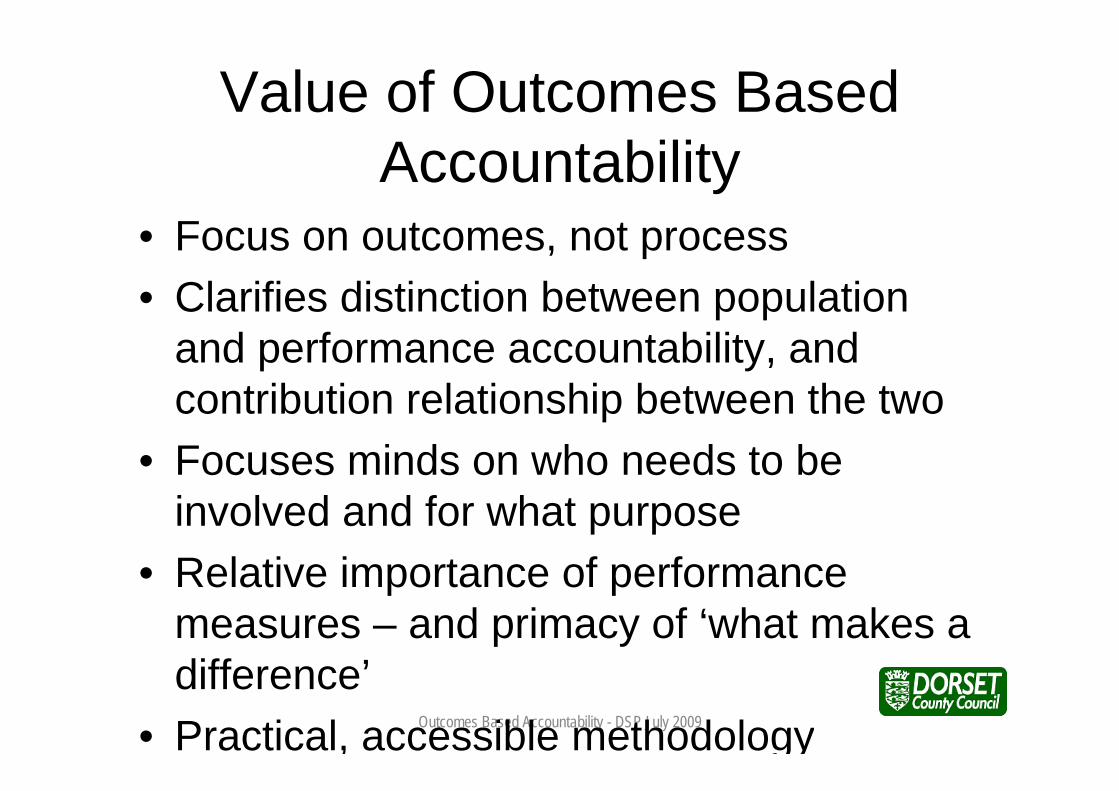
Value of Outcomes Based Accountability
• Focus on outcomes, not process• Clarifies distinction between population
and performance accountability, and contribution relationship between the two
• Focuses minds on who needs to be involved and for what purpose
• Relative importance of performance measures – and primacy of ‘what makes a difference’
• Practical, accessible methodology