Embed Size (px)
Citation preview
vt v"'"'"
1973USDA FOREST SERVICE RESEARCH PAPER PNW-163
Does Harvestin West Slope Douglas-firIncrease Peak Flowin Small Forest Streams?
PLEASE DO NOT REMOVE FROMFILES
PACIFIC NORTHWEST FOREST AND RANGE EXPERIMENT STATIONUS. DEPARTMENT OF AGRICULTURE FOREST SERVICEPORTLAND, OREGON
CONTENTSPage
THE STUDY AND ANALYSIS 3
RESULTS 5Average Peak Streamflow Increased 5Peaks From First Fall Storms Increased 7Antecedent Precipitation Influences Peak Streamflow 7
30-Day Antecedent Precipitation 8Above Average Streamflow Peaks Little Changed 10Increased Peaks Do Not Reach Excessive Levels 10Patchcut Logging Has Minor Influence on Streamflow Peaks 11
CONCLUSIONS 12
LITERATURE CITED 13

zaftraiiiiiiMArk
The highly productive Douglas-firregion of Oregon and Washington lies tothe west of the crest of the Cascades.Precipitation in this region ranges fromabout 25 inches to well over 100 inchesannually, most of which comes during thewinter months. Rainfall during the wetseason fills the soil reservoir with thewater needed to meet the demands ofdense stands of rapidly growing trees.It is not unusual for precipitation to exceedthe storage capacity of this soil reservoirwhich lends in turn to flooding of streamsand rivers. Flooding may be seriouslocally or in rare cases may cause ex-treme damage over large areas. Duringor after each of these floods, accusationsare freely voiced that the peak streamflowfrom the storm and resulting damage todownstream structures were made worseby logging in the Douglas-fir forests. Butis this really true? Evidence is generallymeager, but some field-scale studies areincreasing our knowledge of forest-floodrelations.
In a detailed analysis of an experi-ment at the Coweeta h y drologic Laboratoryin North Carolina, Hewlett and Ilelycy(1970) show the effect of clear felling(with felled trees left in place) on theproduction of floodwaters. The noncom-mercial nature of the Coweeta experimentallowed these authors to make a cleardistinction between the effects of clear-cutting alone and the additional effects ofroads and logging on stormflow volumesand peaks. Although the main peak flowsincreased slightly, the evidence that clearfelling resulted in an increase in recordpeak flows was not conclusive. Theauthors, however, point out that therewas a significant increase in total volumethroughout the stormflow period andspeculate that such increases could,under some circumstances, contributesignificantly to downstream flooding.
In the Pacific Northwest, Gilleran, 1/—Harper, 2/ and Hsich,-3/ analyzing datafrom the Alsca watersheds in the Douglas-fir forests of the Oregon Coast Ranges,found significant changes in some factorscontrolling maximum streamflow fromsmall- to moderate-sized storms. Ingeneral, they found that roads whichaltered :1 to 4 percent of the drainage areahad little influcncc'on peak streamflow.\Olen over 12 percent of the drainagearea was in roads, there was a significantincrease in peak flows which was furtherincreased when 75 percent of the landsurface in the drainage was logged. Clear-cut drainages also showed marked increasesin peak flows--sonic as much as one-thirdin the winter months. Largest changes inpeak streamflow were on the smallestsubwntersheds. The main drainage showedless change in peak flows.
These two studies present statisti-call y sound conclusions of the averagechange over a wide range of peak flowsfrom several years of record. However,when we are concerned with damages fromhigh strcamflow, we must look mostclosel y , not at the average condition, butat the largest streamflow events whichoccur only infrequently. Such streamflowperiods are sufficiently rare within thespan of time between logging and reestab-lishment of the forest that they must beexamined individually and, therefore, are
1" Dennis James Gilleran. Rapid calibrationof coastal streams to detect effects of road building.M. S. thesis on file at Oreg. State Univ., Corvallis,51 p. , 1968.
2/ Warren Charles Harper. Changes in stormhvdrograph due to clearcut logging. Ti. S. thesis onfile at Oreg. State Univ. , Corvallis, 116 p., 19G9.
2/ Frederick Shukong Hsieh. Storm runoffresponse from road building and logging on smallwatersheds in the Oregon Coast Range. M. S. thesison file at Oreg. State Univ., Corvallis, 149 p., 1970.
not readily subject to statistical analysis.In their study, Hewlett and Helvey (1970)found that of two record high peak flows,one was higher after clearcutting thanwould be expected; the other lower. Ourstudy shows considerable evidence thatclearcutting does not necessarily increasemajor peak flows.
In discussing the effect of logging onpeak flows, I find it necessary to makesome assumptions. My first assumptionis that logging--including clearcutting--has no significant influence on either totalprecipitation or on the intensity with whichit falls. This has been fairly well acceptedover the years.
The second assumption is that the hy-drologic properties of forest soils are notgreatly changed by timber harvest. Loggingactivities may alter soil characteristicsto some extent; but we are reasonably surethat in the Pacific Northwest, infiltrationrates on most of a logged area arc rarelyreduced below precipitation rates.
In western Oregon, Dyrness (1969)reported rapid percolation rates for sur-face horizons due to the porous and highlyaggregated nature of the soil. Surfacerunoff (overland flow), seldom, if ever,occurs over extensive areas of forest land.Dyrness (1965, 1967) estimated that about4 to 20 percent of a cable-yarded clearcutwas deeply disturbed or compacted to someextent. In tractor-logged areas, overone-third of the area may be compactedor deeply disturbed. With the exceptionof the tractor skidroads, these areas aregenerally discontinuous, and do not neces-sarily have surface infiltration ratessufficiently reduced to cause other thanlocal surface runoff. Truck and skidroads,landings, gravel pits, and other severelydisturbed areas are exceptions; butsurface runoff that does occur usuallyflows to other areas where the infiltrationcapacity is sufficient to handle it.
Slash burning may alter soil prop-erties where the intensity of the burn ishigh; but in most slash burns, severelyburned areas represent only a small por-tion of the total area. Tarrant (1956) foundthat although severe slash burning loweredthe rate of water movement into some soils,the area severely burned was so small thatthe overall effect on soil moisture prop-erties and water flow was minor.
Conditions favorable for infiltrationare maintained where continuous forestproduction is practiced such that soonafter logging a new cover of vegetationappears which in a short time is dominatedby forest trees. Clearcutting the foreststo convert to another cover or use ormeasures to prevent revegetation do not fitthe above conditions. In the great majorityof cases, both private and governmentforests are managed for continuous forestproduction.
Under these conditions, in which themajor portion of the forest soil remainshydrologically active, peak streamflowshould be a function primarily of precipi-tation characteristics, stream channelgeometry, and antecedent moisture condi-tions. If this is the case, forest covershould play a relatively minor role indetermining the peak rate of streamflowduring our major storms when rainfall ishigh and soils are near saturation duringthe midwinter rainy season. Other cri-teria of storm runoff characteristics suchas mean peak flow, time to rise, totalvolume of stormflow, and frequency ofstormflows of a given size have been usedto demonstrate that forest cutting changesthe storm hydrograph. However, whenflood damage to drainage structures or otherimprovements are considered, the maximumpeak is most important. In this study,therefore, we have considered only theeffect of logging on maximum instantaneousflows from major storms.
2
etilt; . /kg*
Ak4;it
■4 • _ 47,
•t .
•
c •••., , r ••• • ••
• ,
,..A111111W42116
THE STUDY AND ANALYSISThe data on which this report is based
came from experimental watersheds on theU. S. Forest Service's H. J. Andrews Ex-perimental Forest, an area typical of muchof the west slopes of the central CascadeRange. The results should be generallyapplicable to forested areas in the PacificNorthwest west of the Cascade crest andother areas where the soils are relativelydeep and porous and where precipitationassociated with major storms occursprimarily from warm, moist, stable air-masses which produce large quantities ofprecipitation at low intensities. Theresults would not necessarily apply toareas where precipitation is frequentlyof high intensity nor to those drainagesthat have a maximum peak from snowmeltin the spring. The latter is highly variabledepending on accumulated snow and seasonof melt.
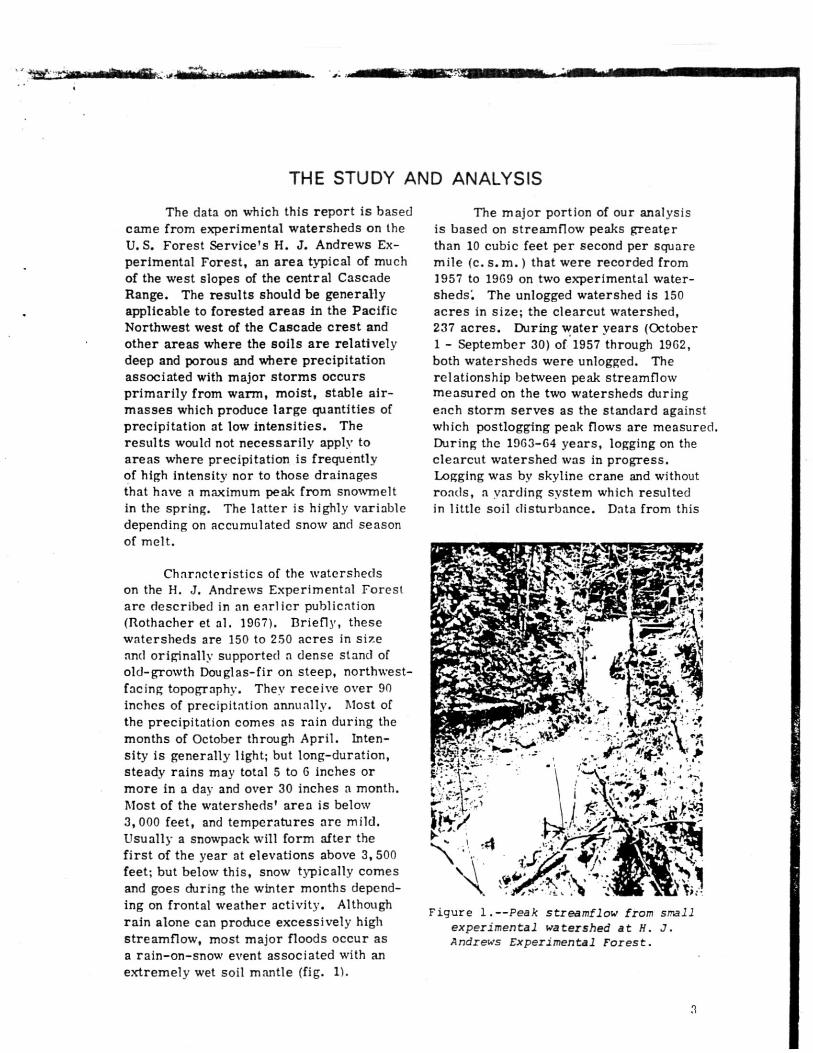
Characteristics of the watershedson the H. J. Andrews Experimental Forestare described in an earlier publication(Rothacher et al. 1967). Briefly, thesewatersheds are 150 to 250 acres in sizeand originally supported a dense stand ofold-growth Douglas-fir on steep, northwest-facing topography. They receive over 90inches of precipitation annually. Most ofthe precipitation comes as rain during themonths of October through April. Inten-sity is generally light; but long-duration,steady rains may total 5 to 6 inches ormore in a day and over 30 inches a month.Most of the watersheds' area is below3,000 feet, and temperatures are mild.Usually a snowpack will form after thefirst of the year at elevations above 3,500feet; but below this, snow typically comesand goes during the winter months depend-ing on frontal weather activity. Althoughrain alone can produce excessively highstreamflow, most major floods occur asa rain-on-snow event associated with anextremely wet soil mantle (fig. 1).
The major portion of our analysisis based on streamflow peaks greaterthan 10 cubic feet per second per squaremile (c. s. m.) that were recorded from1957 to 1969 on two experimental water-sheds'. The unlogged watershed is 150acres in size; the clearcut watershed,237 acres. During water years (October1 - September 30) of 1957 through 1962,both watersheds were unlogged. Therelationship between peak streamflowmeasured on the two watersheds duringeach storm serves as the standard againstwhich postlogging peak flows are measured.During the 1963-64 years, logging on theclearcut watershed was in progress.Logging was by skyline crane and withoutroads, a yarding system which resultedin little soil disturbance. Data from this
Figure 1.--Peak streamflow from smallexperimental watershed at H. J.Andrews Experimental Forest.
4
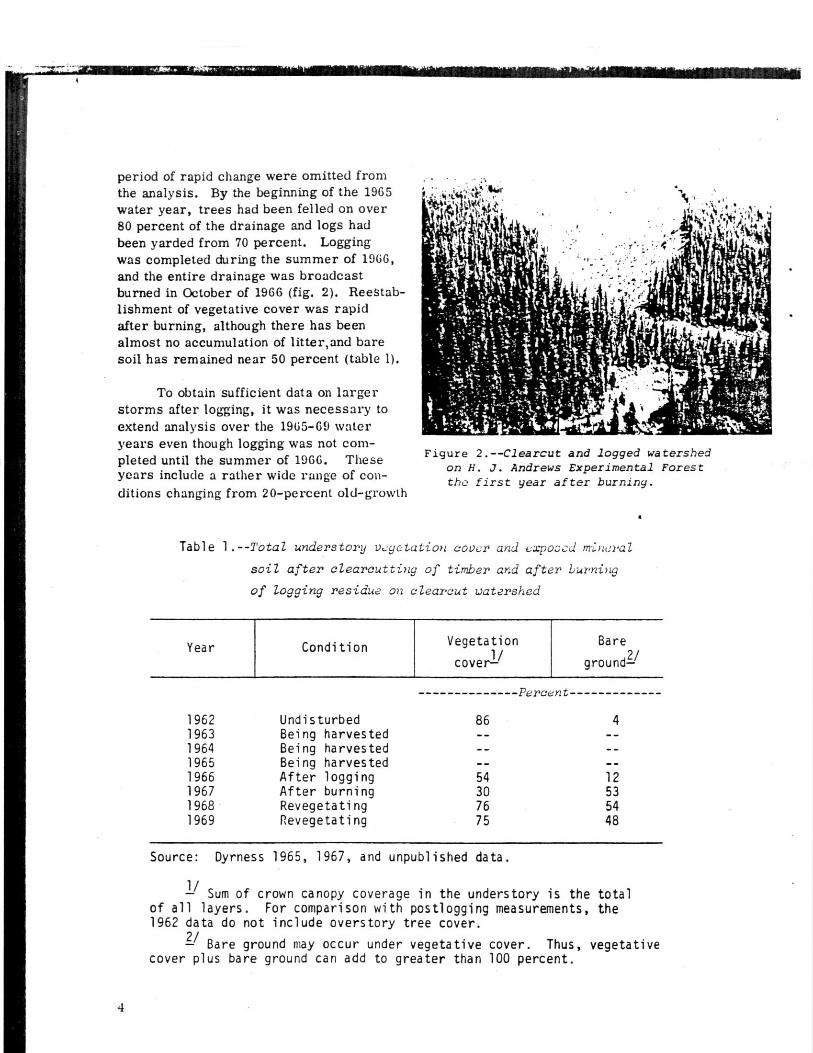
period of rapid change were omitted fromthe analysis. By the beginning of the 1965water year, trees had been felled on over80 percent of the drainage and logs hadbeen yarded from 70 percent. Loggingwas completed during the summer of 1966,and the entire drainage was broadcastburned in October of 1966 (fig. 2). Reestab-lishment of vegetative cover was rapidafter burning, although there has beenalmost no accumulation of litter,and baresoil has remained near 50 percent (table I).
To obtain sufficient data on largerstorms after logging, it was necessary toextend analysis over the 1965-69 wateryears even though logging was not com-pleted until the summer of 1966. Theseyears include a rather wide range of con-ditions changing from 20-percent old-growth
Figure 2.--Clearcut and logged watershedon H. J. Andrews Experimental Forestthe first year after burning.
Table 1.- -Total understory vegetation cover and E:spo.:;cd ir:n(:ral
soil after clearcutting of timber and after burning
of logging residue on clearcut watershed
Year ConditionVegetation
cover"
Bare
ground?/
1962 Undisturbed 86
Percent
41963 Being harvested1964 Being harvested1965 Being harvested1966 After logging 54 121967 After burning 30 531968 Revegetati ng 76 541969 Revegetati ng 75 48
Source: Dyrness 1965, 1967, and unpublished data.
1/ Sum of crown canopy coverage in the understory is the total
of all layers. For comparison with postlogging measurements, the1962 data do not include overstory tree cover.
--?/ Bare ground may occur under vegetative cover. Thus, vegetativecover plus bare ground can add to greater than 100 percent.
4
cover to completely logged and freshlyburned, then to a partial cover of herba-ceous and low shrubby vegetation cover.These conditions are, however, in sharpcontrast to an old-growth forest. Thetransition is that which usually takes placeduring conversion from old-growth tosecond-growth Douglas-fir stands, i.e.,the land does not remain devoid of vegeta-tion for any appreciable length of time.
Peak flows for the 1965-69 wateryears were compared with predicted flowsbased on the 1957-62 calibration periodusing standard linear regression techniques.In an attempt to better explain the devia-tions of postlogging peak flows from theprelogged relation, a stepwise regressionwas performed on the posttreatment datato test the following series of factorsrelated to precipitation patterns andindirectly to antecedent moisture conditions:
Precipitation:
Total for day of peak streamflow.Maximum 6-hour intensitypreceding peak.7-day total preceding peak.14-day total preceding peak.30-day total preceding peak.Day number (representing timesince fall rains began).
There are, of course, other factorsthat we know influence peak flows suchas soil properties, snow cover, andchannel geometry. For the study area,soil properties influencing streamflowdid not change greatly. Snow and soilwetness are indirectly represented inthe precipitation factors.
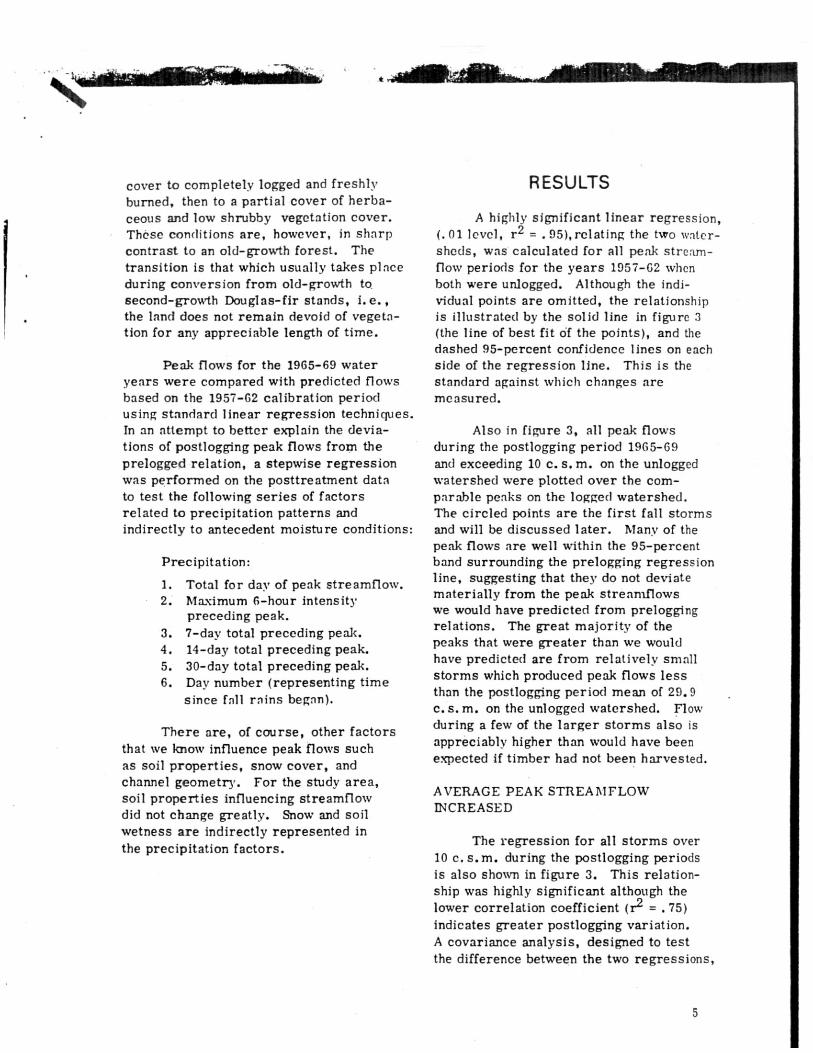
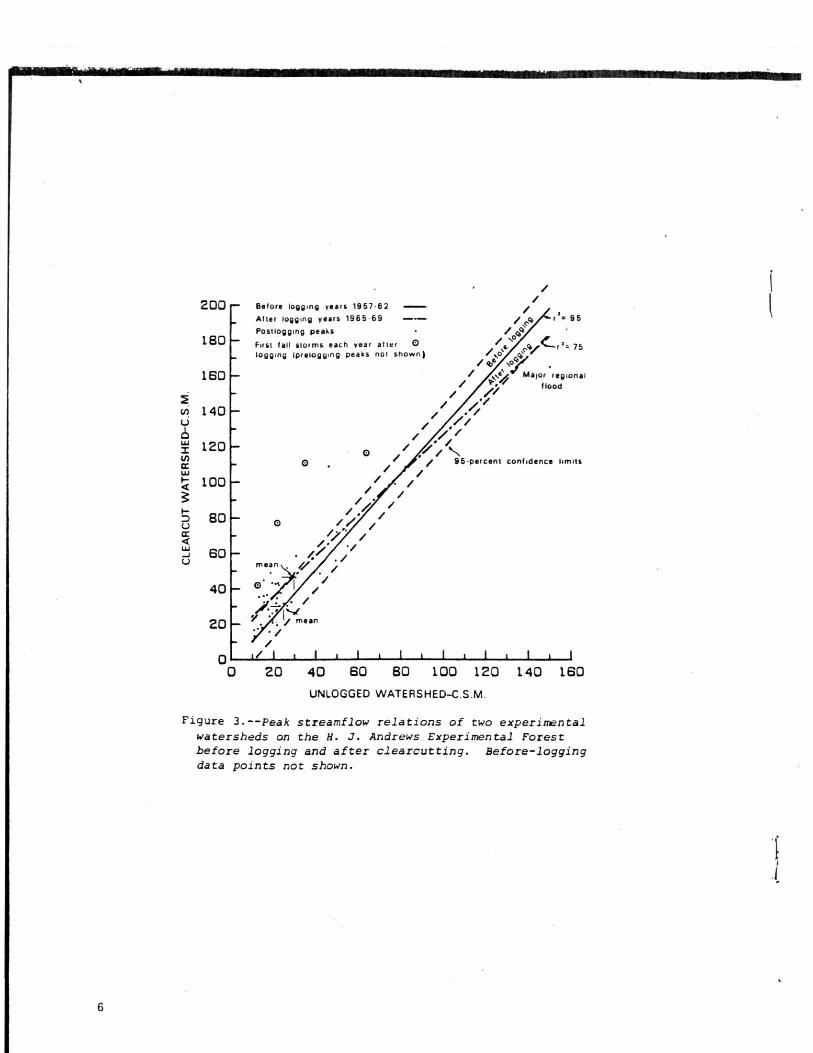
RESULTSA highly significant linear regression,
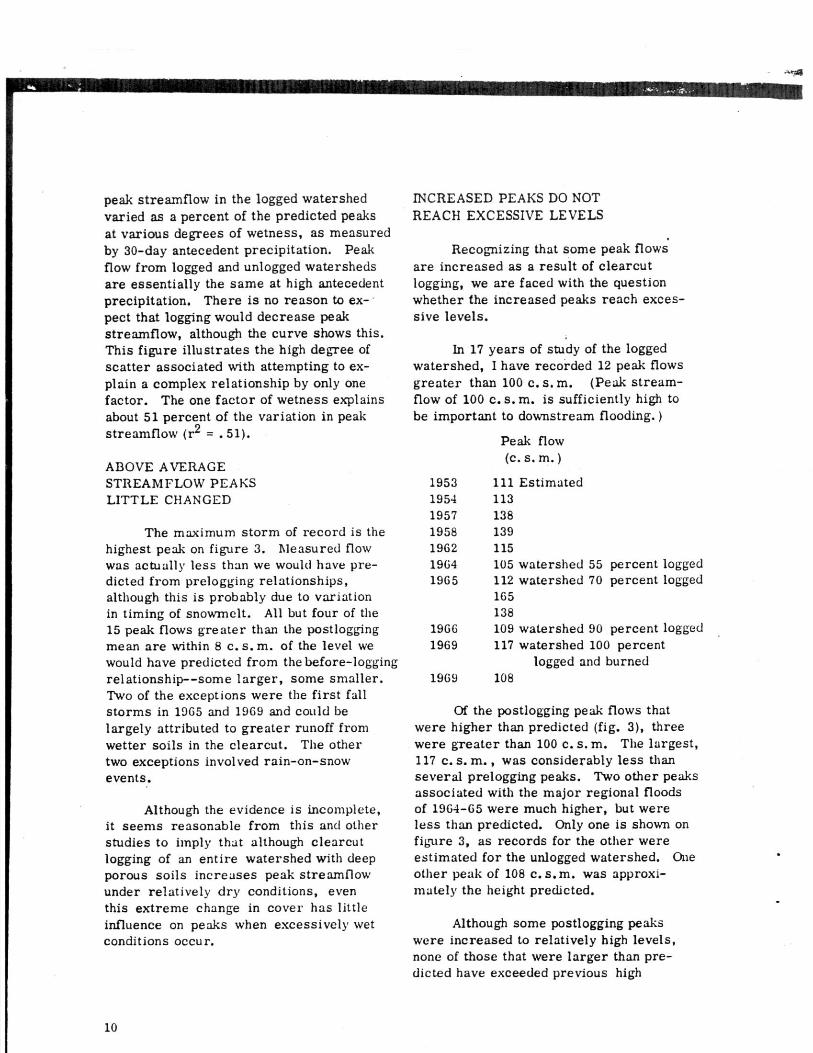
(.01 level, r2 = .95),relating the two water-sheds, was calculated for all peak stream-flow periods for the years 1957-62 whenboth were unlogged. Although the indi-vidual points are omitted, the relationshipis illustrated by the solid line in figure 3(the line of best fit of the points), and thedashed 95-percent confidence lines on eachside of the regression line. This is thestandard against which changes aremeasured.
Also in figure 3, all peak flowsduring the postlogging period 1965-69and exceeding 10 c. s. m. on the unloggedwatershed were plotted over the com-parable peaks on the logged watershed.The circled points are the first fall stormsand will be discussed later. Many of thepeak flows are well within the 95-percentband surrounding the prelogging regressionline, suggesting that they do not deviatematerially from the peak streamflowswe would have predicted from preloggingrelations. The great majority of thepeaks that were greater than we wouldhave predicted are from relatively smallstorms which produced peak flows lessthan the postlogging period mean of 29.9c. s. m. on the unlogged watershed. Flowduring a few of the larger storms also isappreciabl y higher than would have beenexpected if timber had not been harvested.
AVERAGE PEAK STREAMFLOWINCREASED
The regression for all storms over10 c. s. m. during the postlogging periodsis also shown in figure 3. This relation-ship was highly significant although thelower correlation coefficient (r 2 = . 75)indicates greater postlogging variation.A covariance analysis, designed to testthe difference between the two regressions,
5
200-
180-
160-
140-
120-
100-
80 -
60 r-
40
20-
Oo
O
mean•
/
/ mean
/ c r 9 5/ 4'1>
r 75/ 4274'
Major regional
//flood
//.///
///0 /
/ 95-percent confidence limits
Before logging years 195762Al ter logging years 1965 69Postlogging peaksFirst tall storms each year alter 0logging (pretogwing peaks not shown)
tit t I 111111111
20 40 60 80 1.00 120 140 160UNLOGGED WATERSHED-C.S.M.
Figure 3.--Peak streamflow relations of two experimentalwatersheds on the H. J. Andrews Experimental Forestbefore logging and after clearcutting. Before-loggingdata points not shown.
6
shows that the Flores are Ficriiflrn^111-duTerent (.03-level), indicating that log-ging has caused a general change in peakstreamflow. The slopes of regressions,however, indicate that extremely highpeak flows may be no greater after loggingthan would have been expected beforelogging. Unfortunately, data for majorstorms which occur during the period ofminimum vegetation cover after loggingare rare and the postlogging regressionis strongly influenced by the single highpoint which represents the major regionalstorm of December 1964.
Hydrologists have traditionally usedregression analyses to predict responseof one watershed that is to be treatedfrom another control watershed. At theaverage peak flow (30 c. s. m.) of thecontrol watershed for the 1965-69 period,we would predict a flow of 37 c.s.m. forthe logged watershed if it had remainedunlogged and 46 c. s. m. if it were logged.The magnitude of this increase agreesroughly with those reported in the Alseastudy in the Oregon Coast Ranges (seefootnotes 2 and 3) and with Hewlett andHelvey's results from clear felling withoutlogging in the southern Appalachians.
PEAKS FROM FIRST FALLSTORMS INCREASED
Particularly significant are thosestreamflow peaks that are circled onfigure 3. These resulted from the firstlarge storms of the rainy season followingthe characteristically long, dry summers.We find that these streamflow peaks arefrom 40 to over 200 percent higher thanwe would have predicted from the preloggingrelationship. Since similar size peaksmeasured later in the winter season(uncircled dots) show less deviation frompredicted flows, it appears that at leastpart of the explanation could be related toantecedent moisture condition.
• •■•,-
of the dry summer we have measured
over 6 inches more water stored in thesoil in logged areas than in adjacenttimbered areas. Decreased evapotran-spiration from the clearcut area resultsin less moisture storage capacity. This,in turn, results in greater streamflowfrom the clearcut during the first fallstorms. In forested.areas, more of thisprecipitation can be stored in the driersoils. To some lesser degree, thisdifference in soils can influence peakflows during other periods of the year,especially following extended periods ofno precipitation and during early springwhen transpiration is again more active.In midwinter, after soils are thoroughly-'and approximately equally wet, thereappears to be little difference in peakflows of major storms between loggedand unlogged areas.
ANTECEDENT PRECIPITATIONINFLUENCES PEAKSTRF.AMFLOW
Stepwise regressions relating peaksto antecedent precipitation were calculatedfor both watersheds for the period beforelogging (1957-62) and for the period afterlogging was essentially completed (1965-69).
Before logging on the logged water-shed, precipitation the day of the peakflow was by far the most influential factor,accounting for 59 percent of the variationin size of peak, i. e. , r 2 = . 59; the 30-dayantecedent precipitation accounted foranother 8 percent; the day number of thestreamflow peak and the 6-hour intensity,another 2 percent each. Total variationexplained by the four factors was 71percent.
After logging, precipitation on theday of peak streamflow was again themost influential factor related to peak
7
flow, accounting for 56 percent of thevariation; 6-hour intensity accounted foranother 6 percent; 30-day antecedent pre-cipitation, an additional 4 percent; andday number of the streamflow peak, 2percent. Total variation accounted forwas 68 percent. The 30-day antecedentprecipitation factor as an indicator ofsoil wetness might well be less variableafter logging, as we have indicated thatsoils in clearcut areas tend to dry out lessthan those under a complete forest cover.Similarly, after logging, we might expectstreamflow to be more responsive to6-hour intensity because more precipita-tion reaches the soil surface directlywithout first being intercepted by treecrowns.
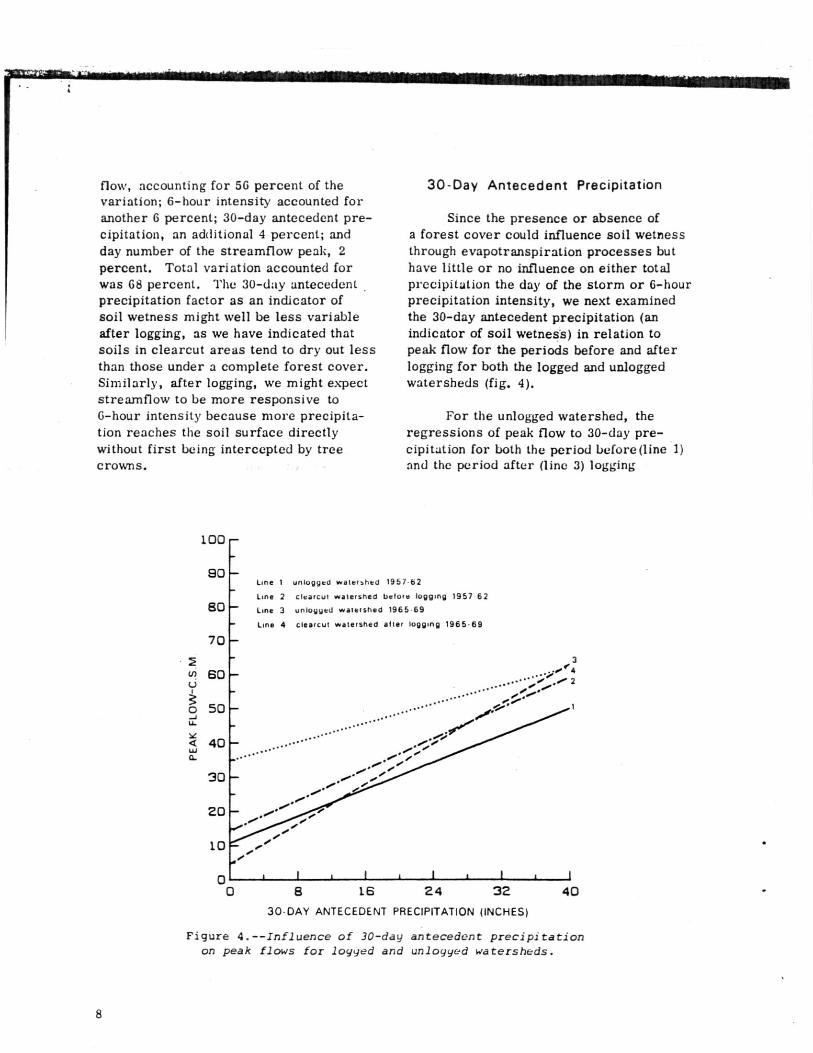
30-Day Antecedent Precipitation
Since the presence or absence ofa forest cover could influence soil wetnessthrough evapotranspiration processes buthave little or no influence on either totalprecipitation the day of the storm or 6-hourprecipitation intensity, we next examinedthe 30-day antecedent precipitation (anindicator of soil wetness) in relation topeak flow for the periods before and afterlogging for both the logged and unloggedwatersheds (fig. 4).
For the unlogged watershed, theregressions of peak flow to 30-day pre-cipitation for both the period before(line 1)and the period after (line 3) logging
100
90Line 1 unlogged watershed 1957-62
Line 2 clearcui watershed before logging 1957 62BO Line 3 unlogged watershed 1965 69
Line 4 clearcut watershed after logging 1965.69
70
60
50 a—.
40
30 /
20
10 „e.
1 t
16 24 32 4030-DAY ANTECEDENT PRECIPITATION (INCHES)
Figure 4.--Influence of 30-day antecedent precipitationon peak flows for loyyed and unloyyed watersheds.
3/e4
.••••••/ 2
i/
oo
1
8
20
-400
; 41161111111111M511116ftridll'
were highly significant. In a covarianceanalysis, slope of the regressions and theadjusted mean were nonsignificant (lines1 and 3), indicating no difference betweenthe two periods. We would expect this,since there was no change in cover on thiswatershed throughout the entire study.
For the logged watershed, the rela-tionship shown in figure 4 was significantbefore logging (line 2) but nonsignificantafter logging (line 4). As for the unloggedwatershed, the slopes of the regressionswere not significantly different, but theadjusted means were highly significantlydifferent for the two periods (lines 2 and 4).This would suggest that logging increasesthe average peak flows, although an y in-fluence the 30-day antecedent precipitation
200
180
has on strenmflow is weak in the post-logging period. In figure 4, note that thereappears to be a convergence of the beforeand after logging curves (lines 2 arid 4) forthe clearcut watershed at high 30-day pre-cipitation totals. This is even more pro-nounced for the unlogged and clearcutwatersheds for the 1965-69 period (lines3 and 4). Data from our brief period ofrecord show 30-day'antecedent precipita-tion exceeded 37 inches. At this point,there is very little difference between theregressions, suggesting that logging mayhave relatively little influence on peakstreamflow under excessively wet conditions.
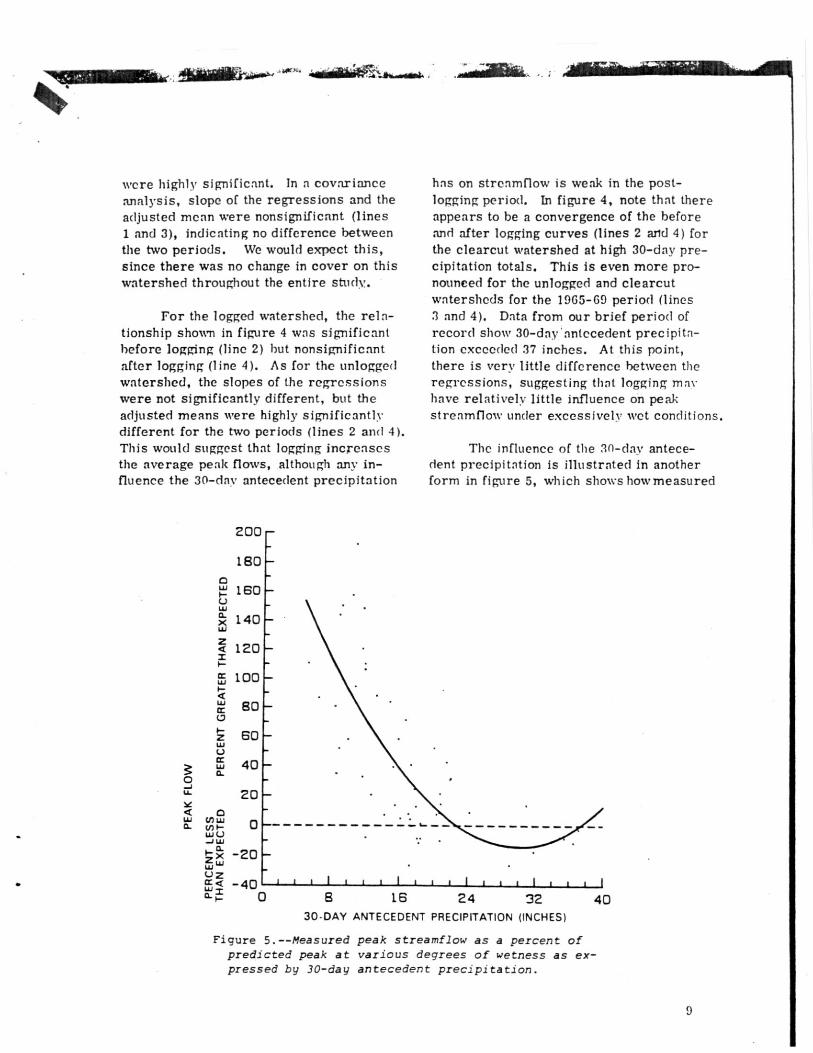
The influence of the 3n-day antece-dent precipitation is illustrated in anotherform in figure 5, which shows howmeasured
160LUQ-x 140 -wLL1
a
•
120o-cc 100 —J
U.180 —
z
cr
60Li,UL1J 40
I 1
1 1 1 1111111_111i
16 24 32
4030-DAY ANTECEDENT PRECIPITATION (INCHES)
Figure 5.--Measured peak streamflow as a percent ofpredicted peak at various degrees of wetness as ex-pressed by 30-day antecedent precipitation.
peak streamflow in the logged watershedvaried as a percent of the predicted peaksat various degrees of wetness, as measuredby 30-day antecedent precipitation. Peakflow from logged and unlogged watershedsare essentially the same at high antecedentprecipitation. There is no reason to ex-pect that logging would decrease peakstreamflow, although the curve shows this.This figure illustrates the high degree ofscatter associated with attempting to ex-plain a complex relationship by only onefactor. The one factor of wetness explainsabout 51 percent of the variation in peakstreamflow (r2 = .51).
ABOVE AVERAGESTREAMFLOW PEAKSLITTLE CHANGED
The maximum storm of record is thehighest peak on figure 3. Measured flowwas actually less than we would have pre-dicted from prelogging relationships,although this is probably due to variationin timing of snowmelt. All but four of the15 peak flows greater than the postloggingmean are within 8 c. s. m. of the level wewould have predicted from the before-loggingrelationship--some larger, some smaller.Two of the exceptions were the first fallstorms in 1965 and 1969 and could belargely attributed to greater runoff fromwetter soils in the clearcut. The othertwo exceptions involved rain-on-snowevents.
Although the evidence is incomplete,it seems reasonable from this and otherstudies to imply that although clearcutlogging of an entire watershed with deepporous soils increases peak streamflowunder relatively dry conditions, eventhis extreme change in cover has littleinfluence on peaks when excessively wetconditions occur.
INCREASED PEAKS DO NOTREACH EXCESSIVE LEVELS
Recognizing that some peak flowsare increased as a result of clearcutlogging, we are faced with the questionwhether the increased peaks reach exces-sive levels.
In 17 years of study of the loggedwatershed, I have recorded 12 peak flowsgreater than 100 c. s. m. (Peak stream-flow of 100 c. s. m. is sufficiently high tobe important to downstream flooding.)
Peak flow(c. s. m. )
1953 111 Estimated1954 1131957 1381958 1391962 1151964 105 watershed 55 percent logged1965 112 watershed 70 percent logged
165138
1966 109 watershed 90 percent logged1969 117 watershed 100 percent
logged and burned1969
108
Of the postlogging peak flows thatwere higher than predicted (fig. 3), threewere greater than 100 c. s. m. The largest,117 c. s. m. , was considerably less thanseveral prelogging peaks. Two other peaksassociated with the major regional floodsof 1964-65 were much higher, but wereless than predicted. Only one is shown onfigure 3, as records for the other wereestimated for the unlogged watershed. Oneother peak of 108 c. s. m. was approxi-mately the height predicted.
Although some postlogging peakswere increased to relatively high levels,none of those that were larger than pre-dicted have exceeded previous high
10
140
2120
w
100LIJ}--<
800
60
0 40—J
20
/ ./- //o
/. X 7 // y
/// •
de /
/44 • /.•0
/
Unlogged 1953-59
95-percent confidence limits
Roads 1960-62
Logging, burning,and roads 1963-68
1st fall storm each year after logging
1111180 100 120
00
120 40 60
streamflow peaks. Major floods typicallyoccur from mid-November on. Two ofthe postlogging peaks over 100 c. s. m.occurred early in the wet season at a timewhen major floods are unlikely. Latermajor storms that occur under thoroughlywet soil conditions would be expected toproduce streamflow peaks little changedby logging.
PATCHCUT LOGGING HASMINOR INFLUENCE ONSTREAMFLOW PEAKS
Under current patchcutting practices,only about 1 to 2 percent of large drainagesare cut at any one time. On smaller drain-ages of several hundred acres, approxi-mately one-quarter of the area might
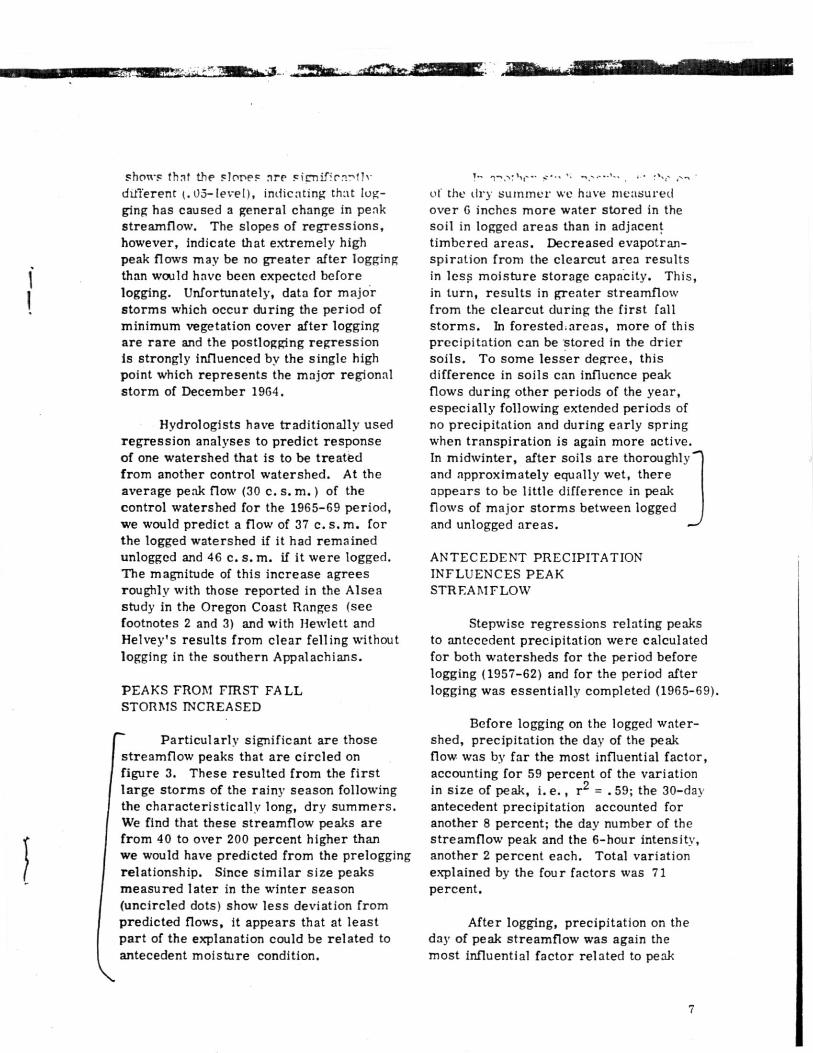
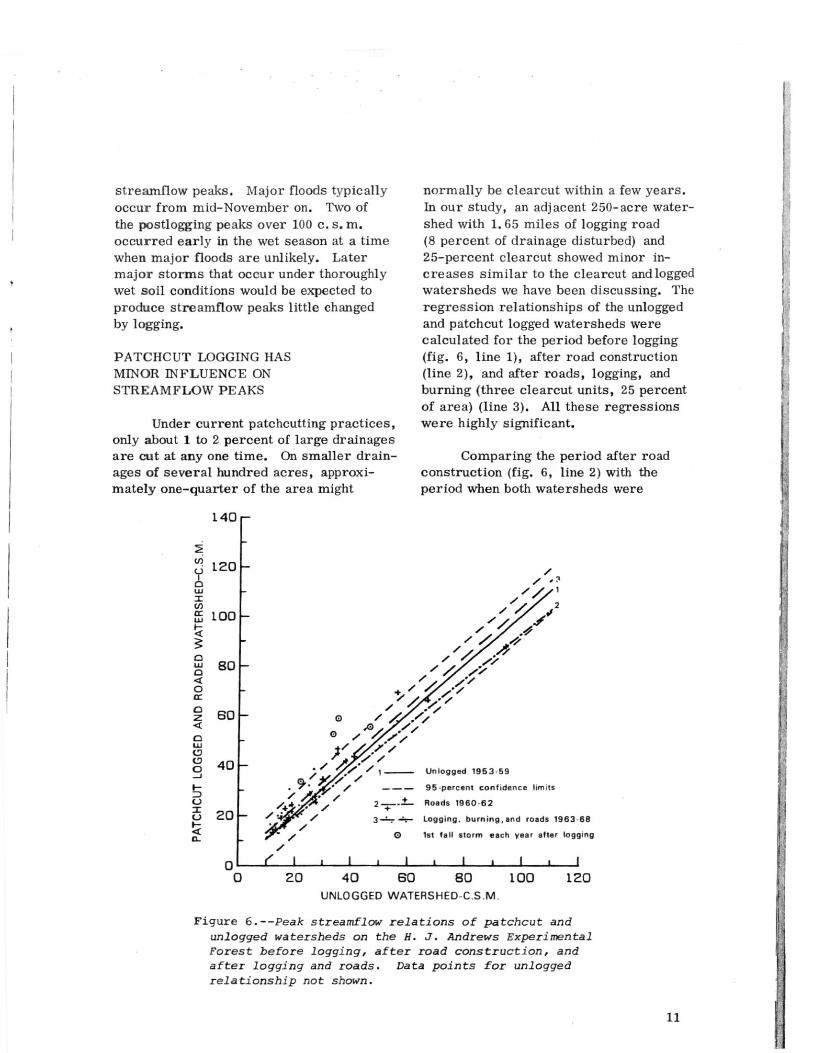
normally be clearcut within a few years.In our study, an adjacent 250-acre water-shed with 1.65 miles of logging road(8 percent of drainage disturbed) and25-percent clearcut showed minor in-creases similar to the clearcut and loggedwatersheds we have been discussing. Theregression relationships of the unloggedand patchcut logged watersheds werecalculated for the period before logging(fig. 6, line 1), after road construction(line 2), and after roads, logging, andburning (three clearcut units, 25 percentof area) (line 3). All these regressionswere highly significant.
Comparing the period after roadconstruction (fig. 6, line 2) with theperiod when both watersheds were
UNLOGGED WATERSHED-C.S.M
Figure 6.--Peak streamflow relations of patchcut andunlogged watersheds on the H. J. Andrews ExperimentalForest before logging, after road construction, andafter logging and roads. Data points for unloggedrelationship not shown.
11
unlogged (line 1), I found that the slopesof the lines were highly significantlydifferent. There appears to be no logicalreason why the slopes should be differentin the direction shown (lower peaks afterroads).
Comparing the period after loggingwhich includes road construction (fig. 6,line 3) with the before-logging period(line 1), I found a nonsignificant differencein slope but a highly significant differencein adjusted means--27. 5 c. s. m. before,30.3 c. s. m. after logging and roads. Isee no evidence of a trend toward lesschange at high flows, most probably be-cause no peak flows greater than 60 c. s. m.are included in the analysis. Unfortunately,records of the largest storms during theperiod were lost when the gaging stationon the patchcut and roaded watershed wasdamaged by a debris avalanche during a50- to 100-year storm (Fredriksen 1965).
Later records for 1969, 1970, and1971 show no significant change from pre-logging peak flows. By this time, 6 to 8years after burning, the clearcut areaswere covered by a regrowth of vegetationthat gave crown coverage over almost90 percent of the area, although about23 percent of the soil surface was stillclassified as bare.
It seems safe to conclude from thisthat under the common patchcut form ofclearcut logging, the harvesting of timberwill result in appreciably increased peakrunoff only under unusual circumstances.Two conditions that might cause increasedrunoff are (1) exceptionally large quan-tities of precipitation at the end of the dryseason when there is a marked differencein soil wetness and (2) a rain-on-snowevent in which large quantities of precipi-tation coincide with melt of a larger accu-mulation of snow in logged areas. Becauseof timing of precipitation and snowmelt,
the latter situation is so highly variablethat peaks from logged watersheds aresometimes higher, sometimes lower thanwould be expected if the area were uncut.
CONCLUSIONS
Peak streamflow from small water-sheds in areas typified by the H. J.Andrews Experimental Forest is increasedby logging when antecedent precipitationis low, i.e., when water storage capacityof soils is less in the logged area thanunder the forest. If we examine onlythe size of the average peak flows, wewould conclude that logging increasespeak streamflow. However, the highestpeak flows for a given watershed arethe result of wet mantle conditions andmay be associated with rain-on-snowevents. Under these conditions thereare indications that the highest peakflows from logged watersheds are rarelygreater than they would have been ifno logging occurred. Statistical evidenceis weak, but present indications pointto the overriding influence of climaticpattern in determining major peak stream-flow. More data are needed, but theyare difficult to obtain because of theinfrequency of major storm events coin-ciding with treatment of gaged watersheds.Even without additional data, it wouldappear that the design of structures tohandle the water in small streams doesnot need an additional safety factor forincreased peak runoff from logged areasto avoid water damage. However,modifications of capacity or design ofdrainage structures may be required tohandle debris. In analysis of flooddamage caused by the recordbreakingstorms of 1964-65, Rothacher andGlazebrook (1968) found that most culvertswere hydraulically adequate. Thosethat failed were plugged with debris.
12

LITERATURE CITED
Dyrness, C. T.1965. Soil surface condition following tractor and high-lead logging in the Oregon
Cascades. J. For. 63(4): 272-275, illus.
1967. Soil surface conditions following skyline logging. USDA For. Serv. Res.Note PNW-55, 8 p. Pac. Northwest For. & Range Exp. Stn., Portland,Oreg.
1969. Hydrologic properties of soils on three small watersheds in the westernCascades of Oregon. USDA For. Serv. Res. Note PNW-111, 17 p., illus.Pac. Northwest For. & Range Exp. Stn., Portland, Oreg.
Fredriksen, R. L.1965. Christmas storm damage on the 11. J. Andrews Experimental Forest.
USDA For. Serv. Res. Note PNW-29, 10 p. Pac. Northwest For. &Range Exp. Stn. , Portland, Oreg.
Hewlett, John D. , and J. D. Helvey1970. Effects of forest clear-felling on the storm hydrograph. Water Resour.
Res. 6: 768-782, illus.
Rothacher, Jack, C. T. Dyrness, and Richard L. Fredriksen1967. Hydrologic and related characteristics of three small watersheds in the
Oregon Cascades. USDA For. Serv. Pac. Northwest For. & Range Exp.Stn., 54 p. Portland, Oreg.
and Thomas B. Glazebrook1968. Flood damage in the National Forests of Region 6. USDA For. Serv.
Pac. Northwest For. & Range Exp. Stn., 20 p. Portland, Oreg.
Tarrant, Robert F.1956. Effect of slash burning on some physical soil properties. For. Sci. 2:
18-22, illus.
13