Embed Size (px)
Citation preview
Does High-Growth Entrepreneurship Need
Public Markets? Evidence from Chinese IPOs⇤
Will Cong, Sabrina T. Howell, and Ran Zhang†
2/1/2017
Abstract
Beyond financing firm operations, public markets provide entrepreneursand early investors with liquidity, rewarding them for standardizing (or“professionalizing”) the firm. We explore how access to public markets af-fects firm standardization and venture capital (VC) investment. We exploitunique features of China’s approval-based listing process and occasionalIPO suspensions. Among firms approved to IPO at similar times, thesurprise suspensions of indeterminate length provide plausibly exogenousvariation in listing delay and thus access to public markets. We find thatsuspension-induced delay significantly reduces patent applications. Firmsfunded by domestic VCs are more affected than those with foreign or noVC funding. A negative capital supply shock does not seem to explain theresult, because delay does not affect contemporaneous investment or lever-age. Delay does, however, also lead to short-term increases in CEO pay. Ina separate analysis, we find evidence that the suspensions have had a chill-ing effect on aggregate VC investment in China. Overall, our findings areconsistent with Rajan (2012)’s treatise that high-growth entrepreneurshipneeds public markets.
⇤We received valuable comments from Zhiguo He, Steve Kaplan, and Holger Mueller. Thisresearch was funded in part by the Initiative on Global Markets, the Fama-Miller Center, andthe Polsky Center at the University of Chicago Booth School of Business. Danye Wang andXiao Zhang provided excellent research assistance.
†Cong: Chicago Booth, [email protected]; Howell: NYU Stern, [email protected]; Zhang: Peking Guanghua, [email protected].
1 Introduction
The relationship between the nature of the firm and its financing is most dynamicand arguably most consequential early in the firm’s lifecycle (Zingales 2000).
Rajan (2012) describes two transformations for the innovative high-risk firm.
First, it differentiates to produce a valuable and unique product or service. At
this stage, its value is closely tied to the entrepreneur’s human capital. Second,
the entrepreneur agrees to standardize the firm - often with the help of venturecapitalists - to give outside shareholders more control. Standardization makes
the value of the firm more contractable, and the entrepreneur’s human capitalreplaceable.
Equity markets, Rajan hypothesizes, are crucial to rewarding the en-trepreneur and the initial investors. In exchange for standardizing, the en-trepreneur extracts rents from future managers through the value of his shares in
the IPO. A vibrant and efficient public equity market permits entrepreneurs and
private investors to achieve liquidity and harvest the profit from the early stagefirm. Public markets also, of course, provide capital for continued growth.
This paper provides an initial attempt to empirically study how access to
public equity affects the high-growth entrepreneurship lifecycle. We first use asimple, stylized model to illustrate how firms’ standardization, VC investment,
and public listing interact. We draw heavily on Rajan (2012), but endogenize
VC investment, the investor’s role in standardization, and time-varying publicmarket access. The model predicts that when the expected value of public listing
opportunities decline, (1) VC investments decline; and (2) firms regress in their
standardization effort (especially VC-backed firms, which tend to be younger and
more entrepreneurial).The extent to which the high-growth entrepreneurial firm relies on func-
tioning public markets is important, yet it is challenging to study empirically.
The ideal experiment would study two identical firms, one with and one without
access to a well-developed stock market. Not only do firms endogenously decide
whether and when to go public, but it is also difficult to separate the effect of
1
public markets on the standardization process from the direct effect of capital
provision. We turn to a unique quasi-experimental setting in China.Public listing in China has three important features: (1) an approval-
based IPO system whose stringent requirements include consistent profitability;
(2) a significant period from approval to listing; and (3) a number of largely
unanticipated suspensions of all IPOs. The approval and listing processes takeseveral years and are mediated by Chinese regulators’ perceptions of aggregate
market conditions. The IPO suspensions - typically announced as surprises and
whose length was indeterminate until they ended - suddenly prohibited manycompanies that had already been approved from going public. These features
allow us to compare firms approved to IPO, that are not in dire need of capital,and that are exogenously assigned to differential (prospect of) access to publicmarkets.
This setup allows us to examine both the “front” and the “back” of the high-
growth entrepreneurial ecosystem. First, we ask how delayed access to publicmarkets affects firms that had already been approved to list. When the expectedvalue of the equity stake falls, the entrepreneur’s incentive to delay standard-
ization, entrenching himself and appropriating rents, increases. Second, we askwhether, by making exit opportunities more uncertain, the suspensions had a
chilling effect on contemporaneous venture capital investment in private Chinese
companies. Both questions relate to VC’s role midwifing the standardizationprocess in the innovative firms (Rajan 2012). Firm value and equity liquidity
provide strong incentives for the VCs.
We estimate the effect of delay in five IPO suspensions, using data that
includes Chinese IPO applications between 2004 and 2015. We restrict the sample
to firms approved to IPO in the year or six months before the announcement of anIPO suspension. Our main approach is to regress an outcome of interest, either
in the year of IPO approval, in the year of listing, or in subsequent years, on
the months of delay or an indicator for high delay. We also include a rich set ofcontrols, including industry and listing year fixed effects. While we cannot claim
2
time delays from application to listing are exogenous, we have strong evidence
that suspension-induced delay for firms approved within months prior to thesuspension is exogenous. The suspensions generate large differences in delay;
while the average delay for all IPO approvals is four months, it is nine months
among firms approved in the year before an IPO suspension. In t-tests, we show
that high and low-delay companies are similar before approval.Rajan (2012), Kaplan & Strömberg (2003), and others emphasize the im-
portance of patents and new CEO hires as standardization milestones. While
patents are often used to measure innovation, their role in the firm’s contractibil-ity is often overlooked. Applying for patents makes the value of the firm’s technol-
ogy contractible and observable, instead of being a trade secret or tacit. Amongcompanies approved in the year prior or six months before an IPO suspensionannouncement, we find a strong negative effect of delay on patent applications in
the year of approval. A month of delay reduces invention patent applications by
0.69 in the approval year (relative to a sample mean of 4.8 patents). This effectendures for several subsequent years. We find similar effects within granted andrejected patent applications, and across state-owned and private firms.
We also find essentially the same effect when we center firms around thelisting year, again limiting the estimation sample to firms approved in the year
prior to an IPO suspension announcement. This ensures that the treatment
we are analyzing is not listing, but rather delay. In conjunction with findingno effects on contemporaneous investment, leverage, or number of employees,
this also suggests that financial constraints do not explain the effect on patent
applications.
However, we find that additional delay has a stronger negative effect for
VC backed firms than for non-VC backed firms. This suggests that the standard-ization process is more critical for VC- backed firms; VC investment may be a
proxy for high-growth entrepreneurial firms. The type of VC matters. Relative
to state-backed or private Chinese VC, foreign VC funding appears to mitigatethe negative effect, possibly because foreign VCs have more experience with cor-
3
porate governance. We also find evidence that having a private sector (Chinese
or foreign) VC investor on the board during the IPO application process miti-gates the negative effect of delay. However, the type of VC funding and board
membership at IPO are endogenous. For example, it may be that foreign VCs
choose startups that will be less subject to entrenchment incentives.
Our results are broadly consistent with Baker & Gompers (2003) andHochberg (2012), who find among companies at IPO that VC funding is as-
sociated with more outsiders on the board and better corporate governance in
general. Both instrument for VC funding using a 1980 regulation that increasedthe supply of VC, as well as local VC investment in the company’s state. Our
approach is to contend that delay is exogenous to a firm’s prior financing, andfocus on the effect of additional delay interacted with VC funding.
We find that delayed companies tend to increase their CEO’s salary dra-
matically between the approval year and the following year. As we find no effect
on manager salaries overall or total firm payroll, this appears to reflect agencyproblems. We also find a strong negative effect of delay on earnings when theCEO at the time of IPO was also a firm founder. Relative to firms that have
replaced their founders, an extra month of delay decreases earnings in the yearfollowing IPO by 12 million RMB (relative to a mean of 644), and in the second
year after IPO by 30 million RMB (relative to a mean of 727). We do not find
strong relationships between CEO replacement and VC funding, in contrast withthe literature using U.S. data.
The paper’s second analysis turns to the “front” end of the entrepreneurial
ecosystem. We ask whether IPO suspensions affect contemporaneous VC invest-
ment. Anecdotal evidence from industry suggests this may occur. According to a
KPMG/CB Insights report following the 2012-2014 IPO suspension, “There areapproximately 800 companies still waiting for IPO listing approvals in China.
This has affected the overall deal flow, particularly for Series B and C investors
considering their exit strategies” (Insights (2016)).Controlling for market conditions in China and VC investment in the rest
4
of the world, we find evidence using weekly time series data that the suspensions
depressed both early and later stage VC investment in China. We find especiallystrong results for late stage investment; suspensions reduce weekly later stage
investment by about $53 million, relative to a mean of $181 million. They are
are robust to excluding the 2009 suspension associated with the global financial
crisis. We also examine subsamples of VC investment. For example, we show thatelite U.S. VC firms active in China reduced deals during suspensions, relative to
their deals in the U.S. This is evidence that neither fundraising from limited
partners nor global markets explain the main result.We are not the first to explore the link between capital markets and high-
growth entrepreneurship (Kerr & Nanda 2009, Black & Strahan 2002). Bernstein(2015) finds that firms’ innovation quality, measured as patent citations, de-creases after goign public. Bernstein uses periods of hot markets as instruments
for firms’ probability of retracting their IPO registrations. Our conclusions com-
plement Bernstein; while he focuses on the effect of going public on innovation,we are primarily concerned with patent applications as a proxy for standardiza-tion. Aggarwal & Hsu (2013) also find that public ownership reduces innovation
quality. Acharya & Xu (2016) provide evidence that the influence of public listingon innovation depends on the need for external capital.
Other related work includes Pagano et al. (1998) and Chemmanur et al.
(2009), who find opposite effects of IPOs in Italy and in the U.S. on firm in-vestments. Gilje & Taillard (2016) and Asker et al. (2014) compare private and
public firms’s responses to changes in investment opportunities. In a study of
32 countries, Brown et al. (2013) show that small firm R&D investment is as-
sociated with more developed and better regulated stock markets. We extend
these studies by focusing on standardization and providing a new identificationstrategy.1
Our paper also speaks to the body of work on the role of financial inter-1One exception is Sun (2017), which was brought to our attention in January, 2017, after
most of the empirical work in this paper was complete. Sun uses the IPO suspension in 2012to study how public listing affects investment.
5
mediaries in corporate governance and firm professionalization, beyond capital
provision.2 Hellmann & Puri (2002) show that venture capital is related to avariety of professionalization measures. Gompers et al. (2008) document that
VCs reacts rationally to signals from the public equity markets reflecting chang-
ing fundamentals proxied by Tobin’s Q. Our paper investigates the role of VC in
China, whose private equity sector remains understudied.China’s public equity and venture capital markets are the second largest
in the world after the U.S.3 We provide new insight into these markets, in part
using hand-collected data on private equity investments from IPO prospectuses.The importance of predictable, well-regulated IPO markets to high-growth en-
trepreneurial ecosystems is of particular urgency in China, where private busi-nesses are disadvantaged in debt markets, and where a high-stakes effort to shiftthe economy away from state-owned enterprises and low-skill manufacturing de-
pends on private sector innovation. Our findings indicate that it behooves China’s
policymakers to encourage a stock market that rewards entrepreneurs and earlystage investors for the expected future cash flows of their nascent enterprises.Further, our paper may help inform future regulations and the policy debate on
using a registration-based IPO system versus an approval-based IPO system.We cannot speak to the extent to which our findings apply outside of China.
Intensive state involvement contributes to large differences between Chinese and
U.S. markets and economic institutions. However, China’s growing startup andprivate equity ecosystem has been quickly converging to that in the U.S. and in
Europe (Zhou et al. 2016,Guo & Jiang 2013). Carpenter, Lu & Whitelaw (2016)
argue that after reforms in the early 2000s, stock prices on Chinese exchanges
have become as informative about future firm profits as those on U.S. exchanges,
and the Chinese stock market is in general serving its basic purpose of enabling2See Kaplan & Minton (1994); Shleifer & Vishny (1997); Bygrave & Timmons (1992), Gor-
man & Sahlman (1989).3According to EY global venture capital trends 2015, China’s venture investing in
2015 involves 49.2 billion USD and 1,611 deals, compared to 72.3 billion USD and3,916 deals in the US. http://www.ey.com/Publication/vwLUAssets/ey-global-venture-capital-trends-2015/$FILE/ey-global-venture-capital-trends-2015.pdf
6
private companies to efficiently raise capital from diffuse investors. Finally, this
paper’s quasi-experimental variation is only possible in China, which has uniquelypursued a strategy of suspending IPOs during periods of major market reforms
or perceived instability. All these warrant a focus on evidence from China.
The paper proceeds as follows. Section 2 introduces a simple theory high-
lighting the role of standardization in the high-growth firm lifecycle. Section 3describes the context we study, in particular China’s financing landscape, IPO
process, and the extent to which suspension-induced delay is exogenous to firm
outcomes. Section 4 and 5 describe the empirical strategy and the data. Sections6 and 7 present and discuss empirical findings. Section 8 concludes.
2 Transformation of the innovative enterprise
In this section we use a simple, stylized model to illustrate how firms’ standard-ization, VC investment, and public listing interact with one another. The model
captures key aspects of the high-growth entrepreneur’s transition from privateequity financing to standardization and ultimately to initial public equity financ-
ing. We draw heavily from Rajan (2012)’s AFA presidential address, in whichhe argues that the high-growth entrepreneur goes through two transformations.
First, he innovates and differentiates to create significant net present value. Sec-ond, to raise adequate capital, he standardizes (or “professionalizes”) the firm.The standardization process makes human capital more replaceable, and often
includes restructuring the firm into divisions, patenting intellectual property, andformalizing implicit employment agreements.
A vibrant stock market is crucial to this process. It incentivizes early
stage private equity financing, and incentivizes the entrepreneur to standardize.Thus the nature of the firm and its financing are intimately linked. We extend
Rajan’s work by endogenizing VC investment, considering their role in firms’
standardization, and modeling time-varying public market access.
Consider a three-period world. In the first period T = 0, a founder pos-
7
sesses a viable startup and finances the firm with personal or VC capital (as de-
scribed in Rajan (2012)). Suppose the entrepreneur retains a fraction ↵ 2 (0, 1] ofthe firm. At T = 1, the entrepreneur or the VC picks the degree � 1 to which
she standardizes the enterprise. Standardization reduces the idiosyncratic and
personalized aspects of the entrepreneur’s role. It implies greater routinization of
work, increasing replaceability of human capital. For example, patenting reducesthe firms’ reliance on specific individuals’ tacit knowledge, and makes the intel-
lectual property of the firm more easily verifiable. Motivated by empirical studies
such as Hellmann and Puri (2002) we assume the entrepreneur is less skilled atstandardization and can achieve a maximum standardization at �̄ < 1. In addi-
tion to setting the level standardization, the entrepreneur also exerts an effort µ
in innovation at a personal cost µ.4 At the end of the period, the entrepreneurproduces V E(µ) > 0, where V E
µ (µ) > 0 and V Eµµ(µ) < 0. Before production, the
controlling equity can replace the entrepreneur with another individual, who can
generate �V E.In the third period, T = 2, the company goes public, permitting the en-
trepreneur and any VC investors to liquidate their shares.5 We assume the total
value the firm produces given full access to public market is V C > V E(1), sig-nifying that a firms’ life-time revenue dwarfs its revenue as a nascent startup
enterprise. The expected payoff of the firm in the period is mV C , where m > 0 is
our key parameter of analysis. This parameter m broadly represents the impor-tance of public markets; a lower m might represent inefficient market valuation
(undervaluation), uncertainty associated with IPO timing and feasibility, addi-4The entrepreneur here really represents the entrepreneurial team and it does not matter
whether the entrepreneurs sets on the effort or standardization first. In Rajan (2012), theeffort is exerted by employees, we could alternatively use a CTO who owns certain shares of thecompany and innovates. Our modeling choice is based on simplicity of conveying the paper’sinsights.
5VCs are typically required to hold their shares for a period of time after IPO, and en-trepreneurs often continue leading the firm, but the period that they hold a significant fractionof the shares relative to the life of the firm is small. All we aim to capture is that entrepreneursand early investors have to exit at some point, potentially due to retirement, investment hori-zon, liquidity shocks, and contractral agreements. For example, Sahlman (1990) discusses theorganization of VC funds that prompts timely exits.
8
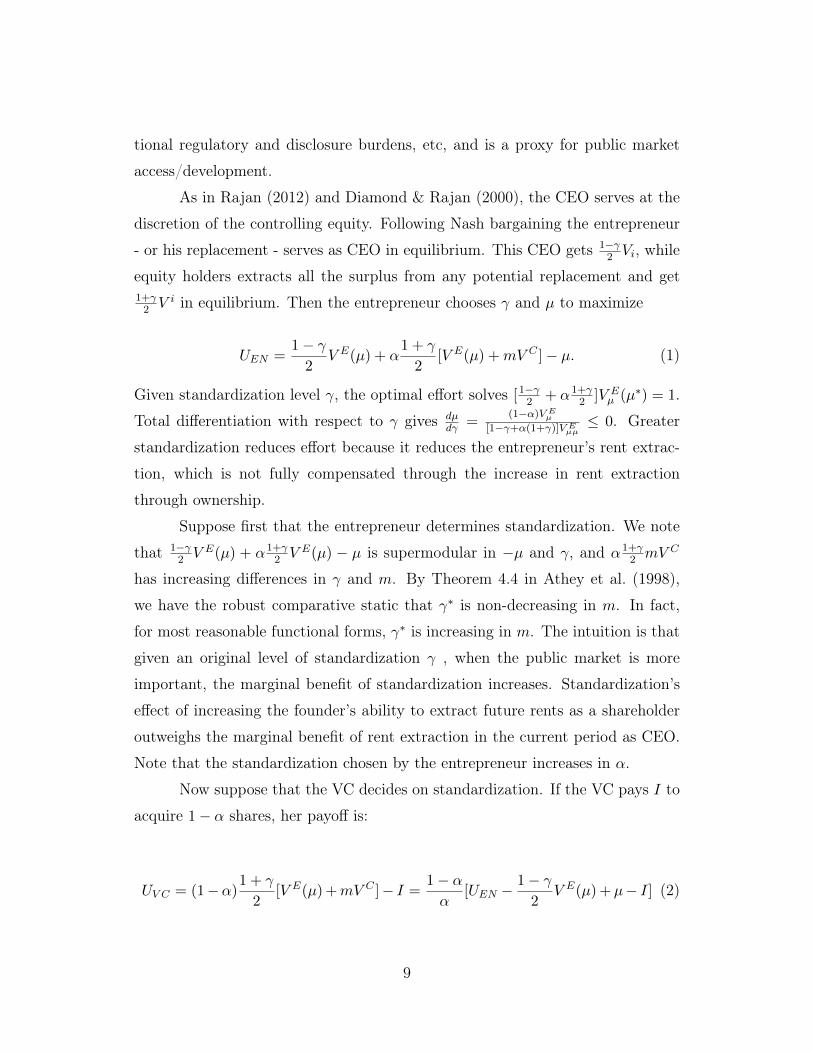
tional regulatory and disclosure burdens, etc, and is a proxy for public market
access/development.As in Rajan (2012) and Diamond & Rajan (2000), the CEO serves at the
discretion of the controlling equity. Following Nash bargaining the entrepreneur
- or his replacement - serves as CEO in equilibrium. This CEO gets 1��2 Vi, while
equity holders extracts all the surplus from any potential replacement and get1+�2 V i in equilibrium. Then the entrepreneur chooses � and µ to maximize
UEN =1� �
2V E(µ) + ↵
1 + �
2[V E(µ) +mV C ]� µ. (1)
Given standardization level �, the optimal effort solves [1��2 + ↵1+�
2 ]V Eµ (µ⇤) = 1.
Total differentiation with respect to � gives dµd� =
(1�↵)V Eµ
[1��+↵(1+�)]V Eµµ
0. Greaterstandardization reduces effort because it reduces the entrepreneur’s rent extrac-
tion, which is not fully compensated through the increase in rent extraction
through ownership.Suppose first that the entrepreneur determines standardization. We note
that 1��2 V E(µ) + ↵1+�
2 V E(µ) � µ is supermodular in �µ and �, and ↵1+�2 mV C
has increasing differences in � and m. By Theorem 4.4 in Athey et al. (1998),
we have the robust comparative static that �⇤ is non-decreasing in m. In fact,for most reasonable functional forms, �⇤ is increasing in m. The intuition is that
given an original level of standardization � , when the public market is moreimportant, the marginal benefit of standardization increases. Standardization’seffect of increasing the founder’s ability to extract future rents as a shareholder
outweighs the marginal benefit of rent extraction in the current period as CEO.
Note that the standardization chosen by the entrepreneur increases in ↵.
Now suppose that the VC decides on standardization. If the VC pays I toacquire 1� ↵ shares, her payoff is:
UV C = (1�↵)1 + �
2[V E(µ) +mV C ]� I =
1� ↵
↵[UEN � 1� �
2V E(µ) +µ� I] (2)
9
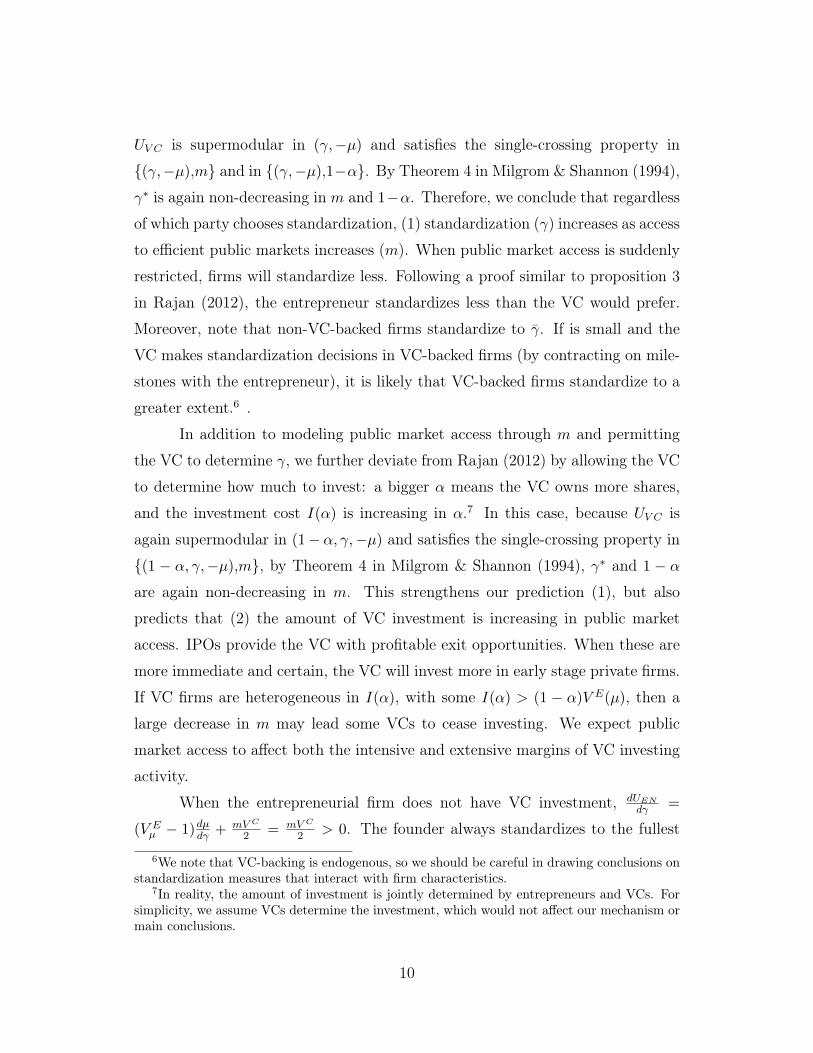
UV C is supermodular in (�,�µ) and satisfies the single-crossing property in
{(�,�µ),m} and in {(�,�µ),1�↵}. By Theorem 4 in Milgrom & Shannon (1994),�⇤ is again non-decreasing in m and 1�↵. Therefore, we conclude that regardless
of which party chooses standardization, (1) standardization (�) increases as access
to efficient public markets increases (m). When public market access is suddenly
restricted, firms will standardize less. Following a proof similar to proposition 3in Rajan (2012), the entrepreneur standardizes less than the VC would prefer.
Moreover, note that non-VC-backed firms standardize to �̄. If is small and the
VC makes standardization decisions in VC-backed firms (by contracting on mile-stones with the entrepreneur), it is likely that VC-backed firms standardize to a
greater extent.6 .In addition to modeling public market access through m and permitting
the VC to determine �, we further deviate from Rajan (2012) by allowing the VC
to determine how much to invest: a bigger ↵ means the VC owns more shares,
and the investment cost I(↵) is increasing in ↵.7 In this case, because UV C isagain supermodular in (1� ↵, �,�µ) and satisfies the single-crossing property in{(1 � ↵, �,�µ),m}, by Theorem 4 in Milgrom & Shannon (1994), �⇤ and 1 � ↵
are again non-decreasing in m. This strengthens our prediction (1), but alsopredicts that (2) the amount of VC investment is increasing in public market
access. IPOs provide the VC with profitable exit opportunities. When these are
more immediate and certain, the VC will invest more in early stage private firms.If VC firms are heterogeneous in I(↵), with some I(↵) > (1 � ↵)V E(µ), then a
large decrease in m may lead some VCs to cease investing. We expect public
market access to affect both the intensive and extensive margins of VC investing
activity.
When the entrepreneurial firm does not have VC investment, dUENd� =
(V Eµ � 1)dµd� + mV C
2 = mV C
2 > 0. The founder always standardizes to the fullest
6We note that VC-backing is endogenous, so we should be careful in drawing conclusions onstandardization measures that interact with firm characteristics.
7In reality, the amount of investment is jointly determined by entrepreneurs and VCs. Forsimplicity, we assume VCs determine the investment, which would not affect our mechanism ormain conclusions.
10
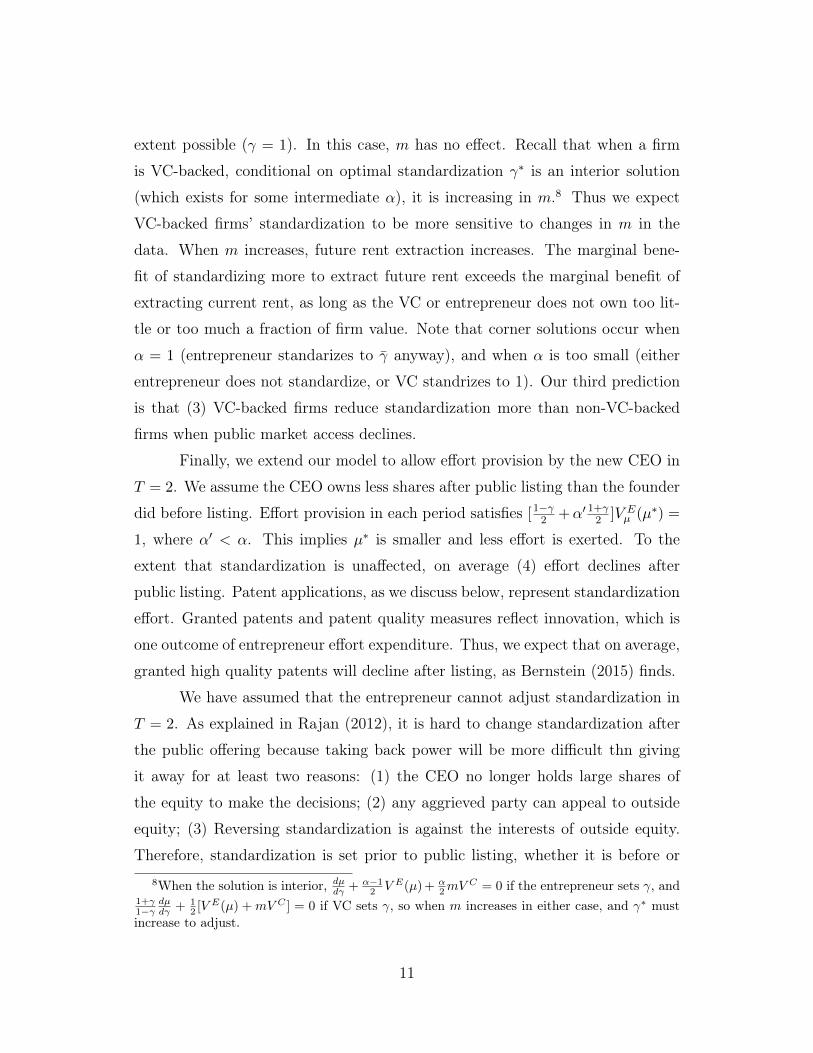
extent possible (� = 1). In this case, m has no effect. Recall that when a firm
is VC-backed, conditional on optimal standardization �⇤ is an interior solution(which exists for some intermediate ↵), it is increasing in m.8 Thus we expect
VC-backed firms’ standardization to be more sensitive to changes in m in the
data. When m increases, future rent extraction increases. The marginal bene-
fit of standardizing more to extract future rent exceeds the marginal benefit ofextracting current rent, as long as the VC or entrepreneur does not own too lit-tle or too much a fraction of firm value. Note that corner solutions occur when
↵ = 1 (entrepreneur standarizes to �̄ anyway), and when ↵ is too small (eitherentrepreneur does not standardize, or VC standrizes to 1). Our third prediction
is that (3) VC-backed firms reduce standardization more than non-VC-backedfirms when public market access declines.
Finally, we extend our model to allow effort provision by the new CEO in
T = 2. We assume the CEO owns less shares after public listing than the founder
did before listing. Effort provision in each period satisfies [1��2 +↵0 1+�
2 ]V Eµ (µ⇤) =
1, where ↵0 < ↵. This implies µ⇤ is smaller and less effort is exerted. To theextent that standardization is unaffected, on average (4) effort declines after
public listing. Patent applications, as we discuss below, represent standardizationeffort. Granted patents and patent quality measures reflect innovation, which is
one outcome of entrepreneur effort expenditure. Thus, we expect that on average,
granted high quality patents will decline after listing, as Bernstein (2015) finds.We have assumed that the entrepreneur cannot adjust standardization in
T = 2. As explained in Rajan (2012), it is hard to change standardization after
the public offering because taking back power will be more difficult thn giving
it away for at least two reasons: (1) the CEO no longer holds large shares of
the equity to make the decisions; (2) any aggrieved party can appeal to outsideequity; (3) Reversing standardization is against the interests of outside equity.
Therefore, standardization is set prior to public listing, whether it is before or8When the solution is interior, dµ
d� + ↵�12 V E(µ)+ ↵
2mV C = 0 if the entrepreneur sets �, and1+�1��
dµd� + 1
2 [VE(µ) +mV C ] = 0 if VC sets �, so when m increases in either case, and �⇤ must
increase to adjust.
11
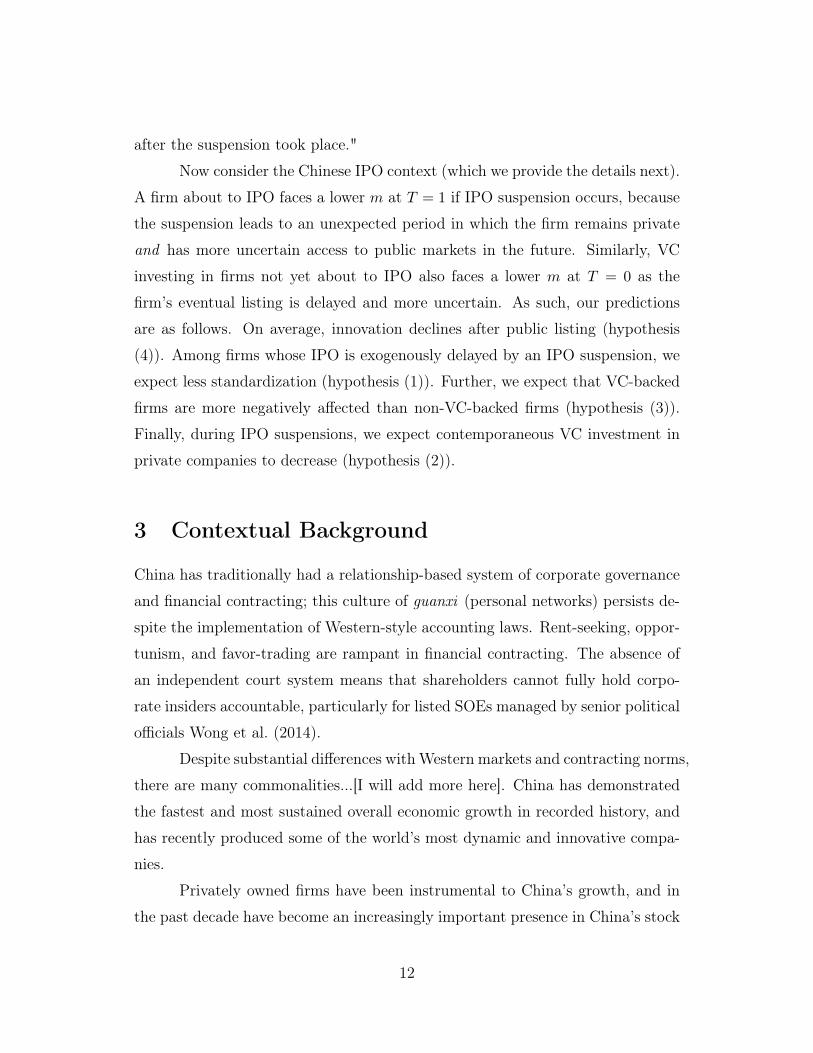
after the suspension took place."
Now consider the Chinese IPO context (which we provide the details next).A firm about to IPO faces a lower m at T = 1 if IPO suspension occurs, because
the suspension leads to an unexpected period in which the firm remains private
and has more uncertain access to public markets in the future. Similarly, VC
investing in firms not yet about to IPO also faces a lower m at T = 0 as thefirm’s eventual listing is delayed and more uncertain. As such, our predictions
are as follows. On average, innovation declines after public listing (hypothesis
(4)). Among firms whose IPO is exogenously delayed by an IPO suspension, weexpect less standardization (hypothesis (1)). Further, we expect that VC-backed
firms are more negatively affected than non-VC-backed firms (hypothesis (3)).Finally, during IPO suspensions, we expect contemporaneous VC investment inprivate companies to decrease (hypothesis (2)).
3 Contextual Background
China has traditionally had a relationship-based system of corporate governance
and financial contracting; this culture of guanxi (personal networks) persists de-spite the implementation of Western-style accounting laws. Rent-seeking, oppor-
tunism, and favor-trading are rampant in financial contracting. The absence ofan independent court system means that shareholders cannot fully hold corpo-rate insiders accountable, particularly for listed SOEs managed by senior political
officials Wong et al. (2014).Despite substantial differences with Western markets and contracting norms,
there are many commonalities...[I will add more here]. China has demonstrated
the fastest and most sustained overall economic growth in recorded history, andhas recently produced some of the world’s most dynamic and innovative compa-
nies.
Privately owned firms have been instrumental to China’s growth, and in
the past decade have become an increasingly important presence in China’s stock
12
markets (insert point about market share). Recognizing their importance, par-
ticularly in sectors perceived to be central to 21st century economic growth, thegovernment now aggressively promotes private entrepreneurship and innovation.
These private firms need public markets for the same reason that entrepreneurial
firms do elsewhere, but also because they have been disadvantaged by China’s
debt markets, which are dominated by state-owned banks that favor SOEs. Thispaper focuses on how public markets enable these private firms to access the
resources they need to grow.
3.1 Financing Enterprises in China
Banks have traditionally played a dominant role in funding private and public
enterprises in China. While new bank loans per year have more than tripledover the past decade, the credit has often been disproportionally allocated to
state-owned enterprises (e.g. Cong & Ponticelli (2016)). As important step in
modernizing its financial system, the Chinese government in 1990 established twodomestic stock exchanges: the Shanghai Stock Exchange (SSE) and the Shenzhen
Stock Exchange (SZSE). Chinese firms incorporated in mainland China couldapply to list A shares (for domestic investors) and B shares (for foreign investors)
on these exchanges. Alternatively, they can list on the Stock Exchange of HongKong (SEHK, H shares) or abroad. Domestic listings are either on a “main board”(for large and mature companies), or alternative boards for smaller, younger,and more entrepreneurial firms. These boards, notably the Small and Medium
Enterprises (SME) and Growth Enterprises Market (also called ChiNext, similar
to Nasdaq) boards, have less stringent listing criteria. These public markets havebeen growing quickly since their inception with now about 3,000 firms listed and
traded in the two exchanges. As of the end of 2015, the Chinese A share marketis the second largest in the world with a total market capitalization of more
than 7 trillion USD. Because the public bond market is still very much in its
infancy, publicly-listed firms mainly obtain their financing through issuance of
equity shares.
13
In its early years, China’s public markets primarily served SOEs, and the
majority of academic research on Chinese firms and public markets has focusedon SOE performance and political economy (e.g. Fan et al. (2007), see Carpenter
et al. (2016) for a review). A number of recent papers have demonstrated that
privately owned firms are more efficient than state owned firms Chen et al. (2015).
Examining private firms (using the same manufacturing survey data that weuse), Whited & Zhao (2016) find evidence that China’s economy suffers from
considerable misallocation of debt and equity across firms. By modeling debt
and equity as factors in a Hsieh & Klenow (2009)-style model, they show thatsmall firms suffer most from financial misallocation, facing excessively high costs
of both debt and equity.Because of the stringent requirements and long process of public listing
(discussed next), fast-growing enterprises without stable profit generation still
find it hard to access financing, which has spurred the development in venture
capital and private equity in China. According to China Venture Capital andPrivate Equity Association, by the end of 2013, there are 1225 VC and PE fundswith a total AUM of 47.5 billion USD that are invested in 13,615 firms.
3.2 The IPO Process in China
A company seeking to conduct its IPO in China’s domestic markets must navigatean elaborate approval process administered by the China Securities RegulatoryCommission (CSRC). Rather than a registration system as in the U.S., China
approves IPOs via an administrative governance system, which is intended to
protect retail investors who constitutes close to 80% of all investors and tendto be naive and less informed. The central steps are as follows. First, the firm
should hire financial professionals such as investment bankers and accountants for“tutorship”, restructuring the firm into a qualified stock share limited company
and preparing the financial and business documents. This “restructuring period”
often takes about three months but the preparation lasts 1� 3 years.9 The firm9See Cao et al. (2016) and www.legalink.chRootSiteslegalinkResourcesQuestionnairesIPOsAsiaLegalink%20IPO_China.pdf
14
then undergoes a period of “tutorship” during which the financial professionals
guide the firm for a few months on corporate governance and compliance. Unliketheir Western counterparts, the Chineses underwriters are legally responsible for
the materials submitted (Chen et al. 2014).
Second, the firm and underwriter submit an application package to the
CSRC. The stock Issuance Examination and Verification Committee (the “com-mittee”) of the CSRC uses this package of financial and nonfinancial information
to determine whether the applicant meets the regulator’s listing criteria and is
eligible to engage in an IPO. The CSRC’s listing criteria seek to ensure that onlyhealthy firms gain access to China’s public equity markets. Applicant companies
must meet stringent historical financial performance criteria to be eligible for anIPO.10 The firms applying for IPO form a queue based on the order of application.According to WIND database, as of October 20, 2016, there are 726 firms queu-
ing for approval. The list of firms waiting is published by the CSRC on a weekly
basis starting from February 2012, so the public could estimate the productivityof the CSRC on a timely manner and aspirant firms are generally aware of howmany candidates are waiting in front of them for IPO approval, as well as how
many have been approved recently.11 That said, the exact length of the queue istypically not a consideration for firms that want to list domestically, according to
key partners at Harvest Fund and Springs Capital, two of the largest private and
public funds in China. Firms still start the application as soon as they meet theexplicit requirements because the Chinese market gives higher valuations than
other markets.10Regulating IPOs is one of the major ways that the Chinese government has historically
sought to protect investors. All applicants must meet the following requirements: (1) Positivenet profits for the last three fiscal years prior to the application, and the cumulative net profitin the three years must exceed RMB 30 million; (2) Cumulative revenue in the three yearsprior to the IPO must equal at least RMB 300 million or cumulative cash flow from operationin three years prior to the IPO must be at least RMB 50 million; (3) Intangible assets cannotaccount for more than 20% of total assets; (4) Net assets in the year before the IPO must totalat least RMB 30 million; (5) the company did not suffer any unrecovered losses at the end ofits most recent fiscal period. In addition to these financial performance requirements, firmsare subject to other nonfinancial requirements, such as the existence of a functioning corporategovernance system and no record of illegal behavior or financial scandals.
11CSRC Discloses the queue for application: http://www.csrc.gov.cn/pub/newsite/xxpl/yxpl/.
15
Third, the committee then reviews the application documents and decides
on whether to approve the IPO.12 Committees usually have one year tenures andtoday consist of 25 members. In 2004, the committee composition changed from
one dominated by government officials to one dominated by selected private sec-
tor professionals (e.g. auditors, lawyers, bankers, and mutual fund managers).13
The criteria the CSRC uses to select candidates are not publicly known. Panelsconsisting of seven members are formed to oversee each IPO application, and
five or more affirmative votes are required for the application to be passed. This
stage on average takes 3 to 6 months but is highly variable. The committeetypically rejects about 20 percent of IPO applications (Yang 2013). If the com-
mittee approves the IPO application, the company may apply to list at one ofthe domestic exchanges. The chosen stock exchange reviews the application toascertain compliance with exchange rules. Exchange approval, by all accounts, is
a rubber stamp. Exchange rules mirror CSRC requirements, and the CSRC has
the ultimate authority to approve or deny an IPO and exchange listing.The approval and rejection meeting rate is determined by CSRC based
on market conditions.14 Interviews with regulators and other stakeholders indi-
cate that the CSRC is concerned that too many IPOs will reduce liquidity andpull down the market, because the price to earnings ratio of new IPOs is kept
below the market average. Therefore capital would naturally flow out of listed
companies and into newly listed companies, creating market turmoil instabilityin the financial market and reducing activities in most other listed stocks. Too
few IPOs would go against the intention to develop the stock market and spur12See http:www.cnbc.comid100525376 government quotas for IPOs were historically imposed
at either the provincial or municipal level, and they were more prevalent during the early stagesof market development.
13From 2004 to 2006, five members, or 20 percent of the total, were audit firms’ partners, withthe number rising to nine, or 36 percent, in 2007. Auditors are recommended for Committeemembership by the China Institute of Certified Public Accountants (the CICPA) and candidatesare selected by the CSRC.
14For example, the regulators are looking to cut down the line, by tightening the screeningstandards. In June, 2016, the CSRC launched a campaign to crack down on fraudulent ap-plicants. In July, it banned firms that have violated environmental protection laws within thepast three years from issuing new shares.
16
the economy. The number of IPOs are positively correlated with past market
returns. During the bull markets in 2006-2007, 2014-2015, CSRC sped up theprocess, and during bear markets, they slowed down the process.
Fourth, once an application is approved, the CSRC files the related docu-
ments. Then the CSRC allows the firm to go on road show, make public offer with
reasonable prices, and get listed. This stage generally takes from 2-6 months, pri-marily based on the judgment by the CSRC to stabilize the market.15 Compared
to the CSRC, the firm has limited ability to time the market at this stage. In
the rare cases that CSRC grants approved firms flexibility on when to list, thefirms time the listing based on aggregate market condition (more willing to list
when the market is doing well). Very rarely do firms and CSRC delay listing dueto disagreements on share prices, according to a former deputy director at CSRCShanghai.
3.3 IPO Suspensions
As an extreme form of regulating the IPO market, the central government and
CSRC occasionally suspend IPO activities to manage market conditions or imple-ment reforms. During these suspensions, all steps after an initial meeting (right
after submission of application) are stopped. From 1994-2015, there have beennine major IPO suspensions, and our data allows us to analyze five of them from2004-2015. Appendix Table 1 contains details about the nine suspensions.
The start and end of these suspensions are typically unannounced. For
example, after October 19, 2012, the CSRC simply ceased holding weekly review15According to CNBC, “If all goes well, and a company...it’s technically ready for an IPO.
But in fact, the full public offering department controls the green light and can flip the switch,or wait, as it sees fit based on market conditions and other factors.” According to a reportby the Reuters, in the middle of the bear market of early 2014, several approved IPOs wereeven pressured to postpone on issuance, as a means to stabilize the market. See, for example.http://www.cnbc.com/id/100525376. According to WIND, Bank of Guiyang, a city commercialbank, submits an IPO application on February 1st, 2015. The application was approved onDecember 23rd, 2015. However, it is not until July 20th, 2016, did the CSRC formally allowedthe Bank of Guiyang to go on the road show. The firm published its prospectus on July 27th,2016, and finally get listed on August 16th.
17
meetings, with no initial public explanation. Local financial press initially ex-
pected the suspension to be short, but instead it lasted more than a year. Thereis no evidence that the suspension was planned to last more than one year. Ap-
parently, the fact that the stock market reached historic low in mid 2013 made the
CSRC cautious in resuming the IPO market. More generally, the suspensions are
predicated on the CSRC’s concern for “market stability”, and not on individualfirms’ characteristics.16
Note that for identification, we do not require the suspensions to be ex-
ogenous. What is crucial is that conditional on being approved within a narrowwindow prior to a suspension, the delays are exogenous among these firms. The
orders of approval and of subsequent listing are largely determined by a firm’sposition in the queue, and the approved firms could not have anticipated thestart and the end of these suspensions at the time of application because of the
significant waiting time between application and approval and the fact that these
firms only experience the suspensions after approval.17
These institutional features make China an ideal setting for our empiricaltests, because (1) the IPO process is sufficiently long that the firms typically do
not foresee suspensions or future market conditions at the time of application;(2) once a firm has filed the application, the approval and listing are primarily
determined by the aggregate market conditions and CSRC’s actions; (3) there is
sufficient dispersion in the time from approval to listing that it is possible for asuspension to affect some approved firms but not other approved firms; (4) firms
listing on the main board are less prone to financial constraints, which allows
us to attribute our observations to public markets’ role in firm transformation16For example, the official announcements for the first two suspensions cite “consecutive
abnormal falls of the SSE Composite Index” and “327 debt event that disrupted normal trading”as the reasons. The latest suspension in 2015 was due to “abnormal volatile movements in thestock market”. See http://finance.sina.com.cn/stock/y/20150704/195622592273.shtml. Theseare also confirmed in our interviews conducted with senior CSRC officials (the intervieweesrequest to remain anonymous). Please contact the authors for more information.
17Based on interviews conducted with senior CSRC officials and CSRC docu-ments. For example, see -˝¡—⇢—L—°Ëñ!l�—L°h°8Â\A↵ athttp://www.csrc.gov.cn/pub/zjhpublic/G00306202/cyb/201202/P020120810637128285398.docand http://www.csrc.gov.cn/pub/newsite/fxjgb/gzdt/
18
beyond capital provision for investment.
3.4 Firm Standardization Metrics
Standardization (or professionalization, in the terms used by Hellmann & Puri(2002)) is in part about reducing the importance of person-specific human capital
to the value of the firm.
Patent applications
Patenting is a way to codify a firm’s intellectual property. Patent citations are
commonly used as a measure of innovation, but patent applications themselvesrepresent an effort to standardize the firm (Rajan 2012). This paper focuses on
patent applications as a proxy for standardization effort.
The number of patent applications in China skyrocketed from 83,045 in1995 to more than 2.3 million in 2014, at an annual growth rate of almost 20
percent.18 There are now more invention patents filed in China than in the
U.S. The State Intellectual Property Office (SIPO) administers China’s patentsystem.19 China has three classes of patents: invention, utility model, and design.Invention patents cover new technical solutions relating to a product, a process,
or improvement; utility model patents represent new technical solutions relating
to the shape, the structure, or their combination, of a product; and design patentscover new designs in relation to shapes, patterns, colors, or their combination, of
a product. Invention patent protection lasts twenty years from the application,while protection for the other two types of patents lasts ten years. Xie & Zhang
(2015) detail the patent filing and grant process, as well as general patterns.
China’s short patent history and less well-developed legal environment
have lead to concerns about whether Chinese patents reflect actual innovation.
Recent evidence suggests that while average quality may differ across countries,18Based on data from the State Intellectual Property Office (SIPO).19SIPO was first established in 1980 (originally known as the Patent Office), and the patent
law was passed on March 12, 1984, and put into effect on April 1, 1985. In the same year,China joined the Paris Convention, an international treaty on intellectual property.
19
patents generally serve the same purpose in China as they do elsewhere, namely to
protect and establish a firm’s control rights over a particular technology. Fang,Lerner & Chaopeng (2016) find patenting behavior in China that is generally
in line with U.S. studies. Within-firm increases in patent stocks are associated
with higher productivity, exports, and new product revenue. Fang, He & Li
(2016) note that after SOE reform in 2002, SOEs began to file more patents thanprivate firms, and further, their patents are more associated with TFP growth
than private firm patents. Fang, He & Li (2016) suggest that higher subsidies
and easy credit for SOEs enables their innovation. Wei et al. (2016) find thatpatent approval ratio is not usually high in China, and a variety of comparisons
suggest that Chinese patent quality also exhibits a real and robust improvementover time that is quite favorable relative to international experience.
CEO replacement
When a firm’s value is closely tied to specific human capital, equity is a poor form
of corporate finance. Particularly in the case of dispersed public equity, efficientvaluation requires separating residual control rights from management (Zingales2000). Often, the founder of a new venture is not the best person to manage it
once it is large and mature, and in particular once it must face the rigors of thepublic markets.
Observing a founder cede control to a new manager is one measure of stan-
dardization. For example, Hellmann & Puri (2002) find that VCs professionalizestartups in part by replacing founders with professional manager CEOs. Kaplanet al. (2009) also emphasize the importance of replaceable human capital in early
firm development, finding in a sample of 50 VC-backed firms that most replace
the founder with a new CEO prior to IPO. We document CEO changes prior to
IPO, focusing on whether the CEO at the time of listing was a founder of thecompany, or whether there was any change in the three years prior to IPO.
20
Stock option plans
Finally, we examine the introduction of stock option plans. We focus on the timebetween founding and stock option plan implementation.
4 Empirical Strategy
4.1 Effect of IPO suspensions on approved companies
We are interested in the importance of the prospect of public ownership on thefirm’s standardization process. The ideal experiment would examine a set of
firms at the IPO stage of their lifecycles, and then remove the option to go
public from a random subset. Obviously, this is quite impossible in the realworld. The literature has used market movements that lead firms to retract theirIPO applications (Bernstein 2015) and matching to private firms (Acharya & Xu
2016).
Here, we use China’s IPO suspensions, which imposed an uncertain pe-riod of delay on firms that were approved to IPO just before the suspensions
were announced. The key advantage of this empirical design is that all firmsin the sample sought to go public. There are clear disadvantages to the quasi-experiment. First, we may have failed to uncover some endogeneity in the delay in
the period immediately prior to the suspensions that affects our standardizationproxies but not other observables. Second, we are limited to an emerging market
economy. While we believe that China’s stock markets are large enough to meritindependent study, readers may question the relevance of an approach that, given
institutional differences across countries, can have only limited relevance to the
U.S. market.
In the main empirical design, we consider firms that ultimately listed in
China. In ongoing work, we examine firms that did not list in China, either be-cause they stayed private, purchased a shell company, or listed abroad. The goal
is to compare firms approved within a narrow window, but among whom some
21
experienced additional delay due to the IPO suspension. That is, we examine
the effect of a government-imposed delay in listing on outcomes among companiesthat were approved to IPO in the year prior to the IPO suspension announce-
ment. The ability of some firms to list before the suspension depended on their
position in the queue, which was unobservable prior to 2012. As explained in
Section 2, a company’s position in the queue and the effect of suspensions ondelay are exogenous as far as we are able to ascertain.
Figure 1 contains a schematic of the empirical approach; JD is the delayed,
or treated firm, while J1 is the control firm not affected by the delay. Figures2-5 show delay on the y-axis and approval/listing date on the x-axis. Figures 2
and 3 show all Chinese IPOs, while Figures 4 and 5 restrict the sample to thatused in our analysis. Figure 2 shows how companies approved immediately priorto the IPO suspensions (the grey bars) experienced much longer listing delays.
Figure 3 shows how these companies listed right after the suspensions ended. In
practice, we conservatively focus the analysis on the effect of months of delay.We estimate variants of Equation 1 among firms approved in the 365 days
prior to the IPO suspension announcement:
Yjt = ↵+ �1MonthsDelayj + �0Vjt + "jt (3)
In the present paper, we consider only firms that were approved and ultimately
listed. Yj is an outcome variable of interest; for example, patents filed in the
year of approval. Controls Vj include the following. First, we include a vector
of listing year fixed effects. Second, we include firm age, so that our effect isnot simply drive by delayed firms being older. Third, we include investment in
property, plants and equipment in the approval year, which encompasses R&Dinvestment. Finally, we include 2-digit SIC code industry fixed effects, a fixed
effect for the exchange (Shanghai or Shenzhen), firm total market capitalization,
leverage in the 2nd year prior to IPO, total proceeds from the IPO, and indicatorsfor whether the firm is state-owned and whether it previously received private
equity financing.
22
Two important ways to categorize the companies for our purposes is by
state ownership and prior VC funding. Following Hsieh & Song (2015), we definea firm as SOE if either the share of registered capital owned by the state is
equal or larger than 50 percent or if the state is reported as the controlling
shareholder. We examine the interaction between private financing and outcomes
by making use of hand-collected private equity investment data from the IPOprospectuses. Specifically, we interact the delay variable with measures of VC
investment, ownership, and presence on the company board.
Table 2 contains t-tests for differences of means across pre-IPO approvalyear patenting activity, firm characteristics, and financial variables in the 2nd
year prior to IPO. We report two-tailed as well as the more stringent upper andlower one-tailed tests. For invention patent applications, none of the tests find asignificant difference. For utility and design patent applications, the lower tail test
finds a significant difference at the 10% level. There is no significant difference for
market cap or IPO proceeds, but the difference for age is significant for the lowertail test at the 5% level. However, the difference is quite small in magnitude, atless than a year (relative to the sample mean of 11.3 years). Among the financial
variables, the only significant difference is in leverage. Perhaps surprisingly, thelow delay firms have somewhat more leverage than high delay firms. We do not
have a strong prior belief about why this is the case, but we control for leverage
in regressions.
4.2 Effect of suspensions on contemporaneous VC investment
An urgent question in academic and policy circles is whether high-growth en-trepreneurship ecosystems require well-developed public markets for investors and
founders to liquidate their equity. That is, do countries need strong, domesticexit options to develop a venture capital industry that can nurture high-growth
startups?
The ideal experiment would observe the same economy with and without
public markets. While imperfect, China’s IPO suspensions provide perhaps the
23
nearest thing to this experiment in the real world, and happen to be in arguably
the most important nascent market for high-growth entrepreneurship. We areinterested in the effect of an IPO suspension on VC investment. In Equation 2
below, we estimate an association between periods of IPO suspension and con-
temporaneous VC, using data at monthly and weekly frequencies. Controlling
for the market indices, as well as VC investment in the rest of the world (outsidemainland China), help give the coefficient of interest on the indicator for an IPO
suspension being in effect (�1) a a more causal interpretation. Nonetheless, a
conservative interpretation is to view the specification as testing for correlation.Specifically, the dependent variable is either the amount or number of deals
of early or later stage VC investment. Controls include either the Shenzhen andShanghai (SZ and SH, respectively) indices, or an overall China market index.We also control for PCRI’s rest-of-world VC investment at the relevant stage
(early or late). Let 1 | IPO Suspensiont be an indicator for the IPO market
being suspended in month or week t.
V C Chinat = ↵+�1 (1 | IPO Suspensiont)+�1SH Indext+�2SZ Indext+�3V C ROW t+"t
(4)Disturbances are likely autocorrelated, leading to underestimated standard errors.Therefore, our preferred approach uses heteroskedasticity and autocorrelation
consistent (HAC) standard errors (specifically, Newey-West errors).Note that this analysis is one of correlation, not causation. We hypothe-
size that IPO suspensions generate uncertainty about exit opportunity, but wecannot affirmatively identify the channel with our present data. For example,it may be that during IPO suspensions it is more difficult for private equity in-
vestors to fundraise from from limited partners. This would likely be because the
suspensions correlate with market downturns. While we control for the marketindex, we cannot rule out this channel.
24
4.3 Rejected Firms
In this section we explore outcomes for firms rejected by the CSRC IPO approvalcommittee. Only eighteen firms were approved and dropped out, primarily be-
cause regulators found evidence of fraud. No firm approved to IPO in China has
failed to do so and listed abroad instead. We focus on summarizing the corporate
finance outcomes for these firms to better understand why firms IPO in China. If
to raise capital, we might expect their leverage to increase or that they might listabroad. Listing abroad would also be consistent with a bonding or insider liq-
uidation rationale for going public. We compare rejects across categories: thosethat listed on a foreign exchange, those that stayed private, and those that were
approved around the same time and went public in China. While this analysis
will provide insight into Chinese corporate finance, it does not have a causal in-terpretation. Since we do not observe the reasons for rejection, any differencesmay be due to latent quality differences.
5 Data
This paper employs eight sources of data:
1. China Securities and Regulatory Commission (CSRC): To analyze the effectof suspension-induced delay on firms approved to IPO, we begin with thelist of firms that applied to be listed on the A-share Main Board of China’s
domestic exchanges (Shenzhen and Shanghai). CSRC provides this IPO
application and approval data; all firms applying to IPO at Shenzhen orShanghai exchanges must submit their applications to CSRC. Application
data is available for 2004-2015, inclusive. As explained in Section 3 anddescribed in Table 1 Panel 1, our current analysis makes use of 1,567 IPOs.
2. China Securities Market and Accounting Research (CSMAR)/Wind: The
Wind Financial Terminal (China’s Bloomberg terminal equivalent) and CS-MAR are the primary data providers are widely used by Chinese financial
25
institutions and by foreign institutional investors in China. We obtain IPO
prospectus data (sometimes called “predisclosure” data), listing, and finan-cial statement data from these sources. We also obtain patent data from
CSMAR, which in turn collects this data from China’s State Intellectual
Property Office (SIPO).
3. Compustat: We supplement the Chinese sources with Compustat data for
Chinese companies. This provides financial data for companies that applied
to IPO in China but instead had their primary IPO abroad.
4. Hand-collected private equity investment data: For this paper we hand-
collected data from IPO prospectuses for all IPOs between 2006 and 2013.20
[Will added: Can we collect more to include 2004-2015?] This data was
checked for accuracy with the commercial ChinaVenture Source database.Investor board membership was hand-collected from the resumes of boardmembers included in the IPO prospectus.
5. SDC VentureXpert: Commonly used to study U.S. VC investment, thisdatabase provides private equity investment data for Chinese companiesthat IPOd outside of China.
6. SDC New Issues: This database provides listing information for Chinese
companies that IPOd outside of China.
7. Annual Survey of Industrial Firms (ASIF): We complement our main data
sources with the ASIF from China’s National Bureau of Statistics, which
covers firms operating in the manufacturing, mining, and utility sectorsfrom year 1998 to 2013. All firms with annual sales above a given monetary
20The investment information comes from the prospectus section entitled “—L∫˙,≈µ” (“Basic introduction of issuer”). Within this section, the sub-section entitled “—w∫�;Å°⌧ ûEß6∫˙,≈µ” (“Basic introduction of major stockholders and ultimatecontrollers”) permits ascertaining whether a major stockholder is a venture capitalist or not.A second subsection entitled “—L∫Ñ°,b⇣ ÿ�” (“Equity Capital Formation andChange”) provides information on investment periods, amounts, and share holdings for themajor stockholders.
26
threshold are surveyed, making the survey effectively a Census of medium
to large private firms.21 While its sectoral coverage is limited, this dataallows us to compare private firms that are delayed IPO to the benchmark
of private firms in the same sector. It also offers an alternative source for
the financials of firms prior to their IPO.
8. Private Capital Research Institute (PCRI): Our analysis of the effect of the
IPO suspensions on contemporaneous VC investment relies on PCRI data.
This was provided to us as aggregated weekly time series for China andthe rest of the world, by investment stage and GP location. It includes
both investment values in US dollars and number of deals. The underlyingPCRI data includes all investments from 30 large PE/VC firms, ThompsonReuters VentureXpert, EMPEA, unquote, Venture Intelligence (India), and
Startup nation (Israel).
9. Pedata.cn: We also obtained data from a leading Chinese purveyor of pri-
vate equity investment data; this contains monthly time series by invest-
ment stage, including investment values in nominal RMB and number ofdeals.
The variables used in analysis are summarized in Table 1 Panels 1-8. Panels 1-5describe data used in the delay analysis (results in Section 6). We divide firms
by their ownership type (majority state owned versus wholly privately owned)
and their venture funding. The hand-collected private equity data from IPOprospectuses sorts VC investors into three type: foreign VC investors (VC firms
not headquartered in China or Hong Kong); state-backed Chinese VC investors
(those that receive funding from central or local Chinese government agencies);
and private Chinese VC investors (VC firms headquartered in mainland Chinaand not known to receive state funding). We also hand-collected data from IPOprospectuses about whether the CEO at the time of listing was one of the firm’s
21Until 2010, this threshold was set at 5 million CNY (730,000 USD), and then raised to 20million CNY (3 million USD) from 2011 onward. The data are also used in Hsieh & Klenow(2009) and Whited & Zhao (2016).
27
founders, as described in his biography. Over half the CEOs in our estimation
sample are described as firm founders. Only 75 firms replaced their CEO in thethree years prior to IPO, of which 38 replaced the CEO in the year prior to IPO.
These variables are described in Panels 1 and 2.
We follow precedent in the literature in constructing variables, where pos-
sible. Return on sales and leverage calculations follow Piotroski & Zhang (2014).For the former, we use the average of firm earnings before interest and taxes
(EBIT) divided by total revenue. EBIT is net profit plus interest expense. For
the latter, we use the ratio of the firm’s total liabilities to total assets at thefiscal year-end. Earnings are net profit in millions of nominal RMB, also used in
Fan et al. (2007). Revenue is total operating sales revenue in millions of nominalRMB.22 We investment variables that are standard in the Chinese financial liter-ature.23 Compensation (manager salaries and overall firm payroll) are in nominal
RMB.24
Table 1 Panels 6-8 describe data used in the aggregate VC investmentanalysis (results in Section 7). Aggregate weekly and monthly time series of VCinvestment by stage in mainland Chinese portfolio companies, provided by PCRI,
is in Panel 6. The PCRI data is in nominal USD. To ensure that exchange ratesand inflation do not confound the analysis, we also present results and graphs
using real 2010 RMB.25 We categorize the PCRI investment types as early (seed,
early stage, VC) or late stage (growth equity). Table 1 Panel 8 shows the list offirms we describe as “elite” U.S. VCs active in China. These 14 firms are all the
firms in Preqin’s top 30 by IRR or Multiple that had at least two investments in22It includes all income except that from interest, commissions, fees, and earned premiums.23The first is property, plant and equipment (PPE) investment, which includes intangible
and other long-term assets. The second is financial investment, or cash flow used to purchaseequity and debt. The third is acquisition investment, or cash flow used to purchase subsidiaries.We scale all three by total assets at the beginning of the year, so the investment variables arepercents. For example, ↵Ú#, ✏∞s, and Y�B. (2008), ’?úrÑ, —WT”Ñ�0π˝ ⌦⇥l¯ïD’, °⌃�L, 37-47.
24The cash flow statement and balance sheet provide different measures of payroll, and bothhave been used in the Chinese financial literature. We use both, but present results usingpayroll from the cash flow statement.
25Inflation data is from the IMF Cross-Country Macroeconomic statistics, and conversiondata is from www.tradingeconomics.com.
28
China during our sample period.
6 Results: Effect of suspension-induced IPO delay
Patenting activity
We find a strong negative effect of listing delay on patent applications in the year
of IPO approval and in the year of IPO itself. This effect endures in the mediumterm. Before explaining this result, however, it is first useful to examine whether
average patenting activity is consistent with Bernstein (2015), who finds that
public firms tend to innovate less. Indeed, Figure 6 shows a decline in successful
(ultimately granted) invention patent applications around the IPO year.This decline is more severe for delayed firms. Figure 7 shows the coefficient
on months of delay (hereafter “delay”) on invention patent applications filed in a
specific year relative to the IPO approval year. The results for negative years are
placebo tests; delay should have no effect on patent applications in years priorto approval. Indeed, the coefficients are near-zero and quite precise. Starting in
the approval year, we see a significant negative effect; a month of delay reducesinvention patent applications by 0.69 of a patent in the approval year (relativeto a sample mean of 4.8), 0.74 of a patent in the year after (relative to a sample
mean of 6), and 1.1 patent in the second year after approval (relative to a samplemean of 7.9). In the fourth and fifth years, the coefficients continue to be strongly
negative, but become noisy.We first focus our analysis on the year of approval.26 Table 3 column 1
shows the baseline estimation of Equation 1 with invention patent applicationsas the dependent variable (the same specification as in Figure 7). While our
preferred specification is OLS (which does not drop groups within fixed effects in
which there are no patent applications), A negative binomial model in column 226A disadvantage of our patenting data is that its frequency is annual. A share of the patents
filed in the approval year may have been filed prior to approval and thus not affected by delay,increasing error in the measured effect. If the delay is truly exogenous, this error should beequal across months of delay, and thus simply add some noise to the analysis.
29
yields a larger estimate; an extra month of delay decreases the count of patent
applications by 11%. We use negative binomial rather than Poisson becausethe patent counts are overdispersed.27 We use indicators for quantiles of delay
in column 3; relative to delay below the 25th percentile (2.5 months), there are
strong negative effects of both medium and high delay (above the 75th percentile,
or 12.8 months). The effect of high delay is 50% larger than the effect of mediumdelay.
When we limit the sample to private firms (non-State Owned Enterprises,
or SOEs) in column 4, we find a similar but slightly smaller effect. In Table 4we change the dependent variable to the number of granted (columns 1-5) and
rejected (columns 6-10) invention patent applications, and find generally similarresults across the whole sample and within private firms. The negative effectof delay on private firms is most robust when we consider rejected invention
patent applications (Table 4 column 7).28 The strong effect on rejected invention
patent applications suggests that rather than affecting underlying innovation,delay affects standardization effort.
A concern with centering the outcome variable around approval and com-
paring firms that listed quickly with those that were delayed is that the effectwe measure may reflect the “treatment” of listing itself relative to staying pri-
vate, rather than a negative effect of delay. Therefore, we also center the analysis
around the IPO year, rather than the approval year. Table 5 repeats the centralspecifications from Tables 3 and 4, and finds almost exactly the same results.
Note that for most firms, the IPO year and the approval year are the same.
We now turn to the interaction of private capital and delay. Within the
sample of private firms, we examine the effect of having had VC investment in
Table 3 column 5. The effect of a month of delay among non-VC backed firmsremains negative and significant at -.33, and effect of VC when delay is zero is
strongly positive (however, this is essentially meaningless as delay is never zero).27The R2 measure is McFadden’s pseudo R2.28Appendix Table 1 considers the lower quality design and utility patent applications, which
are rarely rejected. We find results that are broadly consistent with the main specification,albeit less robust to sample splits.
30
The interaction between the two is -.27, indicating that an additional month of
delay has a stronger negative effect for VC backed firms than for non-VC backedfirms. This suggests that the standardization process is more critical for VC-
backed firms; VC investment may be a proxy for high-growth entrepreneurial
firms.
Column 6 disaggregates the VC investors by their type, and interacts delaywith indicators for VC investment from: foreign, government-backed Chinese, or
private Chinese sources. Some companies may have backing from more than
one type. We include but do not report individual effects. This model showsthat any negative average effect from VC backing does not come from foreign
investors; relative to the effect of delay for companies backed by Chinese VCinvestors, delayed companies with foreign VC investment patent more. companiespatent more. Table 3 Column 7 considers the percent ownership of each type
of VC. The coefficients are consistent with those in the previous specification,
but the interaction between delay and foreign investment loses significance. Weconsider whether there is a differential effect of delay when a company has aprivate equity investor on the board at the time of IPO. The effect seems to
be somewhat positive; using this stringent specification, the coefficient of .17is barely insignificant.29 Together, the results provide suggestive evidence that
(a) VC-backed (entrepreneurial) companies regress in their standardizing efforts
when their IPO is delayed; and (b) the type of VC matters.We consider time frames beyond the approval year in Table 6. Columns 1
and 2 use the number of invention patent applications filed the year following the
approval year; during this period, very delayed firms remain unlisted, while most
most firms have conducted their IPO. Column 1 finds roughly the same effect as in
the main specification (-.74, significant at the 5% level). The negative interactionwith VC backing among private firms (column 2) remains but loses statistical
significance. Columns 3-5 use the number of invention patent applications filed
ever after approval, and show a large negative effect in the main specification29With alternative error assumptions or controls, it becomes significant.
31
(column 3). The coefficients are much larger, as the sample mean of the dependent
variable is 85. The effect of delay loses statistical significance when interactedwith VC (column 4). However, we find in column 5 that having a private sector
VC investor on the board appears to substantially mitigate the negative effect
of delay. Among companies with no VC on the board, the effect of delay is -19.
Relative to this group and to companies with a government VC on the board, theeffect of delay is 31 for companies with a foreign or domestic private VC on the
board. This offers some confirmation for the findings in the approval year from
Table 3.30
Financial and employment outcomes
We turn to financial and employment firm outcomes in Table 7. Panel 1 showsthat there is no effect of delay on investment, leverage, or abnormal returns inthe IPO year or the following year. This is evidence that delay does not act as a
negative capital supply shock, and further suggests that firms in China are not
going public because they are in dire need of capital. Except for abnormal return,we control in all cases for the dependent variable in the year prior to IPO.
Panel 2 examines three additional variables. Columns 1 and 2 use the
change in the firm’s number of employees between the IPO year and the follow-ing year as the dependent variable. (We use the change because this variable
is not available for years prior to IPO.) While there is no significant aggregate
effect, interacting delay with the type of VC investor reveals interesting pat-terns. We find that companies with VC investment from Chinese firms, whethergovernment-backed or private, tend to hire more employees when delayed than
other companies (Table 7 column 1). For example, an extra month of delay leads
a company with government-backed VC funding to hire 41 more employees than
a company without VC funding (relative to a sample mean change between theIPO year and the following year of 389). This result is consistent with relativelypoorer governance and wasteful spending during delay for firms with government
30For the other dependent variables used in this table and in Table 4, the coefficients on VCboard membership are not statistically significant in fully controlled regressions.
32
connections.
We find small negative effects of delay on earnings and returns on salesin the year of IPO. A month of delay reduces earnings in the IPO year by 4.5
million RMB. The sample mean (median) for earnings is 644 (70). A month of
delay reduces return on sales by 0.001, relative to a sample mean of .17. These
effects vanish by the following year. We find no meaningful interaction of thesevariables - or any other financial variables - with VC funding or funding type.
CEO salary and replacement
If delay incentivizes the entrepreneur to entrench himself and regress in corporate
governance, we might expect to see a change in salary. Indeed, Table 8 shows that
between the IPO year and the year after IPO, an extra month of delay increasesthe CEO’s salary change by 8.5 million nominal RMB (relative to a mean changeof -8). In subsequent years, we continue to see a positive relationship, but it loses
statistical significance by the third year after approval. When delay is interacted
with VC funding, there is no robust relationship (column 3). However, foreign VCfunding has a strong mitigating effect, more than compensating for the averagenegative effect of delay (column 3; note that individual effects are included but
not shown). The right part of Table 8 shows that we find no effects of delayon CFO salary, all managers’ salaries (which includes lower-level supervisors), or
overall payroll.
We next turn to CEO replacement as a metric of firm professionalization(specifically, replacing the founder as CEO with a professional manager CEO).The correlations between VC-funding and CEO replacement are much smaller
than the survey evidence from Hellmann & Puri (2002) would suggest; this is
likely explained by the combination of studying all IPOs and the China context,
where a subset of firms are majority state-owned and the VC industry remainsimmature.
Delay is slightly negatively associated with both (1) a change in CEO in
the year prior to IPO (CEO replacement) and with (2) the founder being CEO at
33
the time of IPO (founder-as-CEO). These relationships, shown in Appendix Table
19, are not sustained in controlled regressions (also note from the t-tests in Table3 that high and low delay firms do not appear to have systematically different
rates of founder-as-CEO). All types of VC funding are positively associated with
founder-as-CEO, consistent with VC firms tending to fund young, high-growth
new ventures. However, while Chinese VC sources - both state-backed and pri-vate - are negatively associated with CEO replacement, foreign VC is positively
associated with CEO replacement. Again, these relationships may be consistent
with intuition, but are not robust to controlled regression analysis.We find a strong effect of delay on earnings when the CEO at the time of
IPO is also a firm founder. In Table 9, we interact delay with a founder-as-CEOindicator. While founders-as-CEOs independently have much higher earningsthan their counterparts, delay decreases earnings substantially in the year after
IPO and in the following year. Relative to firms that have replace their founders,
an extra month of delay decreases earnings in the year following IPO by 12million RMB (relative to a mean of 644), and in the second year after IPO by 30million RMB (relative to a mean of 727). We do not find statistically significant
effects in the year of IPO or in the 3rd year after IPO, though the coefficientsremain negative. Columns 2-3 and 5-6 show that there are no apparent effects
of replacing a CEO in the years before IPO. We also do not find evidence of a
systematic relationship between delay, CEO status, and patent applications.
Robustness tests
Robustness tests of the main findings for patenting are in Table 10. Columns
1-5 use the number of invention patent applications in the approval year (as in
Table 3). When we change the sample to companies listed within a year after
a suspension ended (instead of approved within a year prior to a suspension an-nouncement), we find an effect of an additional month of delay of -.18, significantat the 5% level (column 1). When we narrow the main sample to companies
approved in the six months prior to a suspension announcement, we continue to
34
find a large negative effect of -.39, significant at the 1% level (column 2).
Omitting controls increases the main effect somewhat (column 3). Lim-iting the sample to the Shenzhen exchange slightly reduces the effect to -.39
(column 4). Limiting the sample to the final, largest, and arguably most exoge-
nous suspension (2012-14) increases the main effect to -.52, significant at the 5%
level. Finally, columns 6 and 7 conduct placebo tests, examining the effect onother dependent variables not shown in Figure 7 in the year prior to approval.
As for the regressions from Figure 7, there is no effect.
7 Results: Effect of Suspensions on Contemporaneous VC
We find a correlation between the suspension periods and depressed VC invest-
ment in China. While we control for market indices and rest-of-world VC invest-
ment, it should be emphasized that this exercise does not have a causal interpre-tation, as the suspensions themselves were not exogenous to Chinese economic
conditions. (Recall that above, we argued that additional listing delay imposedby the suspensions, among firms that were approved or listed around the same
time, is a source of causal identification.)That said, visual evidence of investment in nominal U.S. dollars at monthly
frequencies is in Figures 8 and 9 for early stage VC, and Figures 10 and 11 forlater stage VC. Figures 8 and 10 show investment in mainland Chinese portfoliocompanies, while Figures 9 and 11 show investment in rest-of-world portfolio
companies. Appendix Figures A.13-A.20 show weekly frequencies and investmentin real 2010 RMB. Particularly for later stage investment (Figure 10, A16, and
A20), the negative correlation between suspension periods and VC investment in
China is obvious. This is especially true for the 2012-14 suspension.Table 11 confirms this visual evidence in regression estimates, using ver-
sions of Equation 4. In Panel 1, the dependent variable is weekly early stage
VC investment in nominal USD. Columns 1-3 use Newey-West standard errors
with an optimal lag. While a naive regression (column 1) has a strong negative
35
coefficient on the indicator for months in which an IPO suspension was in effect,
the coefficient falls and loses significance with controls for market indices and VCinvestment in the rest of the world (columns 2 and 3). With less stringent error
assumptions (columns 4 and 5), these effects are significant at the 10% level,
and imply that the suspensions reduce weekly early stage investment by about
$25 million, relative to a mean of $74 million. Table A2 Panel 1 uses real 2010RMB, and Tables A3 Panel 1 and A4 Panel 1 use monthly investment; both find
analogous albeit less robust effects of the suspensions. We are surprised to find
evidence of any effect at all on early stage VC investment, as these investmentsare illiquid and typically held for 3-8 years (Gompers & Lerner 2004).
As we expect, there is a much stronger effect for later stage investment. Inour more stringent specifications (Table 11 Panel 2 columns 2-3), we find that thesuspensions reduce weekly later stage investment by about $53 million, relative
to a mean of $181 million, significant at the 5% and 1% levels, respectively.
Excluding the 2009 suspension (which was associated with the global financialcrisis) leads the coefficients to increase to -$64 million. Table A2 Panel 1 usesreal 2010 RMB, and Tables A3 Panel 1 and A4 Panel 1 use monthly investment;
both continue to find large and significant negative effects of the suspensions.Table A.2 shows that the suspensions decrease weekly later stage investment by
at least 670 million real 2010 RMB, relative to a mean of 4,812 million. Table
A.4 shows with Newey-West errors that the suspensions decrease monthly laterstage investment by about $200 million, relative to a mean of $726 million.
We turn to investment by the location of the VC firm in Table 12. All
specifications in this table use the stringent Newey-West standard error assump-
tion. Panel 1 considers investment by China-located general partners (GPs) only.
Column 1 shows that the suspensions reduce the monthly number of deals by 1.4,relative to a mean of 70. Columns 2-4 use investment value as the dependent vari-
able. The effect on early stage investment value is large and negative, but noisy
(p-value of .11). The effect on later stage investment is -146 million USD, signif-icant at the 1% level (relative to a mean of 379). Excluding the 2009 suspension
36
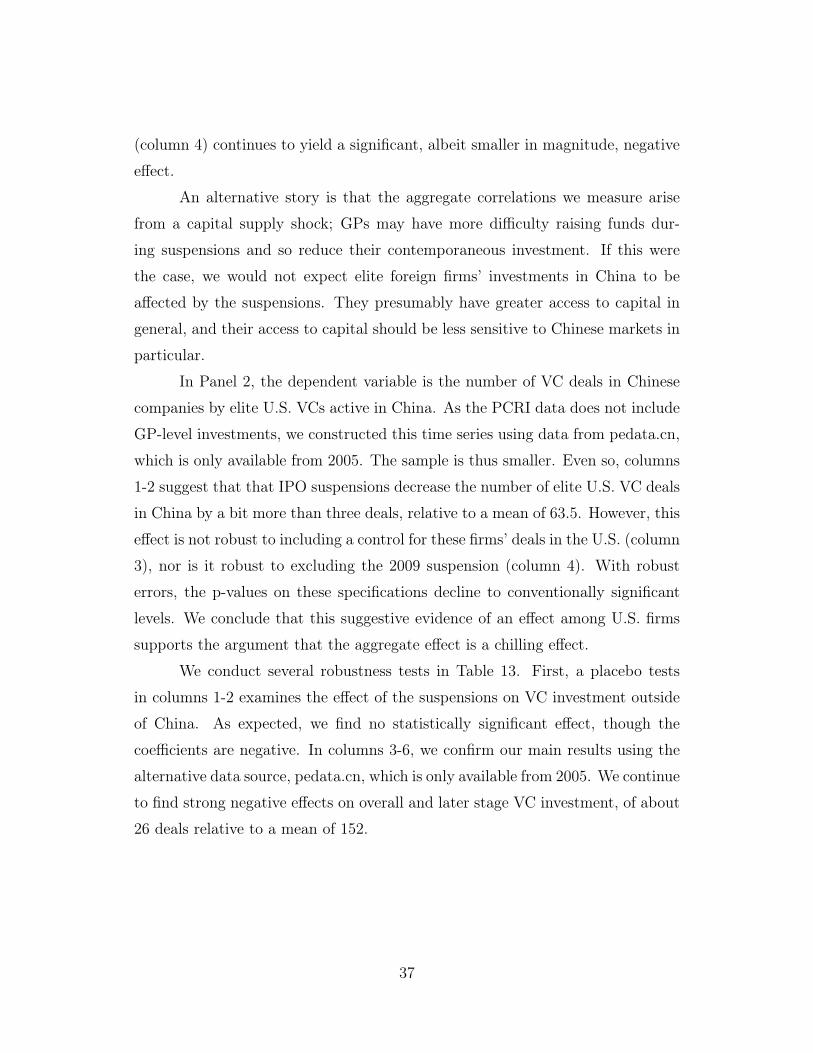
(column 4) continues to yield a significant, albeit smaller in magnitude, negative
effect.An alternative story is that the aggregate correlations we measure arise
from a capital supply shock; GPs may have more difficulty raising funds dur-
ing suspensions and so reduce their contemporaneous investment. If this were
the case, we would not expect elite foreign firms’ investments in China to beaffected by the suspensions. They presumably have greater access to capital in
general, and their access to capital should be less sensitive to Chinese markets in
particular.In Panel 2, the dependent variable is the number of VC deals in Chinese
companies by elite U.S. VCs active in China. As the PCRI data does not includeGP-level investments, we constructed this time series using data from pedata.cn,which is only available from 2005. The sample is thus smaller. Even so, columns
1-2 suggest that that IPO suspensions decrease the number of elite U.S. VC deals
in China by a bit more than three deals, relative to a mean of 63.5. However, thiseffect is not robust to including a control for these firms’ deals in the U.S. (column3), nor is it robust to excluding the 2009 suspension (column 4). With robust
errors, the p-values on these specifications decline to conventionally significantlevels. We conclude that this suggestive evidence of an effect among U.S. firms
supports the argument that the aggregate effect is a chilling effect.
We conduct several robustness tests in Table 13. First, a placebo testsin columns 1-2 examines the effect of the suspensions on VC investment outside
of China. As expected, we find no statistically significant effect, though the
coefficients are negative. In columns 3-6, we confirm our main results using the
alternative data source, pedata.cn, which is only available from 2005. We continue
to find strong negative effects on overall and later stage VC investment, of about26 deals relative to a mean of 152.
37
8 Conclusion
This paper uses plausibly exogenous delay to public listing to explore the relation-ship between the nature of the firm and its financing. China’s IPO suspensions
have all been moratoriums of indeterminate length. They exogenously increase
delay, and thus make the entrepreneur’s exit opportunity more uncertain and
less valuable. For VCs contemplating investments in new portfolio companies,
they also make exit opportunities more uncertain. These questions are especiallyurgent in China. China’s state-dominated banking sector, traditionally the main
source of capital for Chinese firms, is slowly giving way to public and privateequity finance (Allen et al. 2015).
It is challenging to separate a negative effect of delay on managerial stan-dardization incentives from a larger negative effect on firm quality through acapital supply channel. There is reason to expect a negative impact on R&D
investment; as Hall & Lerner (2010) point out, R&D investment is particularly
sensitive to financial constraints. We have some evidence that our results areinconsistent with the latter hypothesis. If the negative effect resulted from ashock to capital supply, we would expect the following: (1) Private firms should
be more affected than partially state-owned firms, as the latter have access tocheaper debt; (2) Smaller firms should be more affected than larger firms; (3)
Leverage should increase and/or investment should decrease. We find none of
these things; if anything, we find some evidence in the opposite direction for (1).Further supporting our argument that the patenting result does not stem from a
larger negative effect on firm quality, we find no average effect of delay on changes
in earnings or on the stock’s abnormal return.
Our finding that delay does not affect investment suggests that most Chi-nese firms IPO to create liquidity for entrepreneurs and early investors. Con-versely, if VC-funded startups depend on public markets for standardization,
we expect that the negative effect of delay on patenting will be stronger for
VC-funded companies. Indeed, we find that among private firms, the effect on
VC-backed startups is much larger than the effect on non-VC-backed companies.
38
As such, this paper also adds to our understanding of the relationship be-
tween public and private financing. On the one hand, firms’ demand for privatefinancing may be greater when the public market is less developed or accessible
(public financing as substitute for private financing at the firm level); on the
other hand, private investors may opt to supply less capital when access to pub-
lic markets is limited, regardless of the firms’ fundamentals. Though there isevidence that the high volatility of the venture capital activity (fundflow, invest-
ment, returns) are tied to valuations in public equity markets ( e.g. Gompers
& Lerner (2004), Kaplan & Schoar (2005), Cochrane (2005)), existing evidencecannot distinguish whether changes in aggregate VC investment in response to
public market conditions is due to learning about the investment opportunities(firms’ or industries’ fundamentals) or the VC’s consideration of liquidity andexit. Because we control for public market valuations and focus on the reduc-
tion in public market access due to policy uncertainty, we provide evidence that
VCs rationally respond to portfolio’s liquidity by scaling back on investments.31
We thus demonstrate the complementarity between public market and privateinvestment in aggregate: by providing the avenue for entrepreneurial and ven-
ture exits, a vibrant public equity market encourages private equity and ventureinvestments, which are crucial for the growth of entrepreneurship and economic
development.31Black & Gilson (1998) also suggest that Germany has less VC investment because of the
dearth of IPO exit opportunities.
39
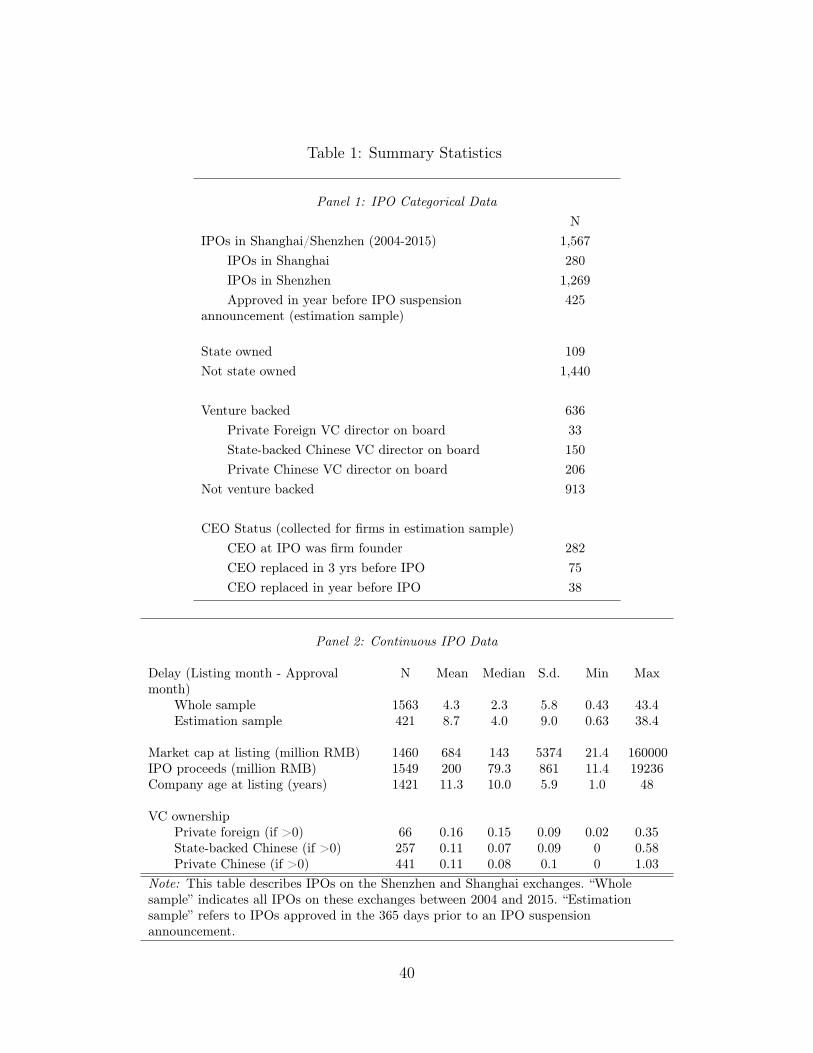
Table 1: Summary Statistics
Panel 1: IPO Categorical DataN
IPOs in Shanghai/Shenzhen (2004-2015) 1,567sssssIPOs in Shanghai 280sssssIPOs in Shenzhen 1,269sssssApproved in year before IPO suspensionannouncement (estimation sample)
425
State owned 109Not state owned 1,440
Venture backed 636sssssPrivate Foreign VC director on board 33sssssState-backed Chinese VC director on board 150sssssPrivate Chinese VC director on board 206Not venture backed 913
CEO Status (collected for firms in estimation sample)sssssCEO at IPO was firm founder 282sssssCEO replaced in 3 yrs before IPO 75sssssCEO replaced in year before IPO 38
Panel 2: Continuous IPO Data
Delay (Listing month - Approvalmonth)
N Mean Median S.d. Min Max
sssssWhole sample 1563 4.3 2.3 5.8 0.43 43.4sssssEstimation sample 421 8.7 4.0 9.0 0.63 38.4
Market cap at listing (million RMB) 1460 684 143 5374 21.4 160000IPO proceeds (million RMB) 1549 200 79.3 861 11.4 19236Company age at listing (years) 1421 11.3 10.0 5.9 1.0 48
VC ownershipsssssPrivate foreign (if >0) 66 0.16 0.15 0.09 0.02 0.35sssssState-backed Chinese (if >0) 257 0.11 0.07 0.09 0 0.58sssssPrivate Chinese (if >0) 441 0.11 0.08 0.1 0 1.03Note: This table describes IPOs on the Shenzhen and Shanghai exchanges. “Wholesample” indicates all IPOs on these exchanges between 2004 and 2015. “Estimationsample” refers to IPOs approved in the 365 days prior to an IPO suspensionannouncement.
40
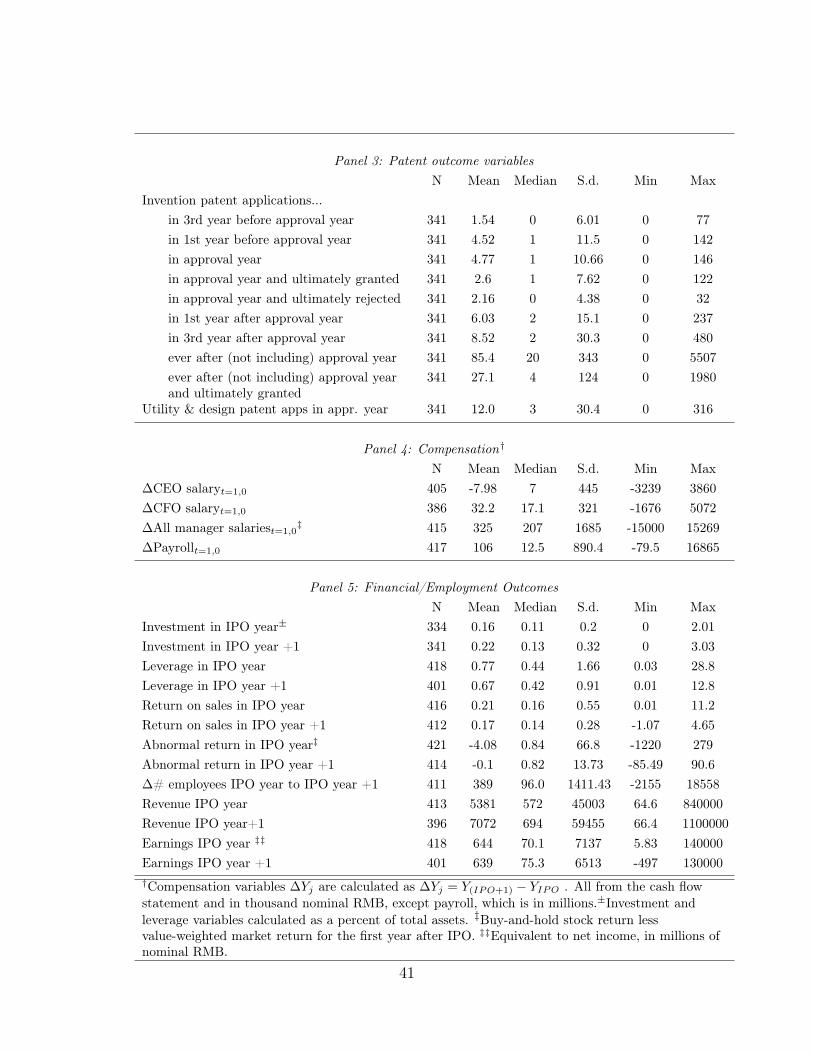
Panel 3: Patent outcome variablesN Mean Median S.d. Min Max
Invention patent applications...sssssin 3rd year before approval year 341 1.54 0 6.01 0 77sssssin 1st year before approval year 341 4.52 1 11.5 0 142sssssin approval year 341 4.77 1 10.66 0 146sssssin approval year and ultimately granted 341 2.6 1 7.62 0 122sssssin approval year and ultimately rejected 341 2.16 0 4.38 0 32sssssin 1st year after approval year 341 6.03 2 15.1 0 237sssssin 3rd year after approval year 341 8.52 2 30.3 0 480sssssever after (not including) approval year 341 85.4 20 343 0 5507sssssever after (not including) approval yearsssssand ultimately granted
341 27.1 4 124 0 1980
Utility & design patent apps in appr. year 341 12.0 3 30.4 0 316
Panel 4: Compensation†
N Mean Median S.d. Min Max�CEO salaryt=1,0 405 -7.98 7 445 -3239 3860�CFO salaryt=1,0 386 32.2 17.1 321 -1676 5072�All manager salariest=1,0
‡ 415 325 207 1685 -15000 15269�Payrollt=1,0 417 106 12.5 890.4 -79.5 16865
Panel 5: Financial/Employment OutcomesN Mean Median S.d. Min Max
Investment in IPO year± 334 0.16 0.11 0.2 0 2.01Investment in IPO year +1 341 0.22 0.13 0.32 0 3.03Leverage in IPO year 418 0.77 0.44 1.66 0.03 28.8Leverage in IPO year +1 401 0.67 0.42 0.91 0.01 12.8Return on sales in IPO year 416 0.21 0.16 0.55 0.01 11.2Return on sales in IPO year +1 412 0.17 0.14 0.28 -1.07 4.65Abnormal return in IPO year‡ 421 -4.08 0.84 66.8 -1220 279Abnormal return in IPO year +1 414 -0.1 0.82 13.73 -85.49 90.6�# employees IPO year to IPO year +1 411 389 96.0 1411.43 -2155 18558Revenue IPO year 413 5381 572 45003 64.6 840000Revenue IPO year+1 396 7072 694 59455 66.4 1100000Earnings IPO year ‡‡ 418 644 70.1 7137 5.83 140000Earnings IPO year +1 401 639 75.3 6513 -497 130000†Compensation variables �Yj are calculated as �Yj = Y(IPO+1) � YIPO . All from the cash flowstatement and in thousand nominal RMB, except payroll, which is in millions.±Investment andleverage variables calculated as a percent of total assets. ‡Buy-and-hold stock return lessvalue-weighted market return for the first year after IPO. ‡‡Equivalent to net income, in millions ofnominal RMB.
41
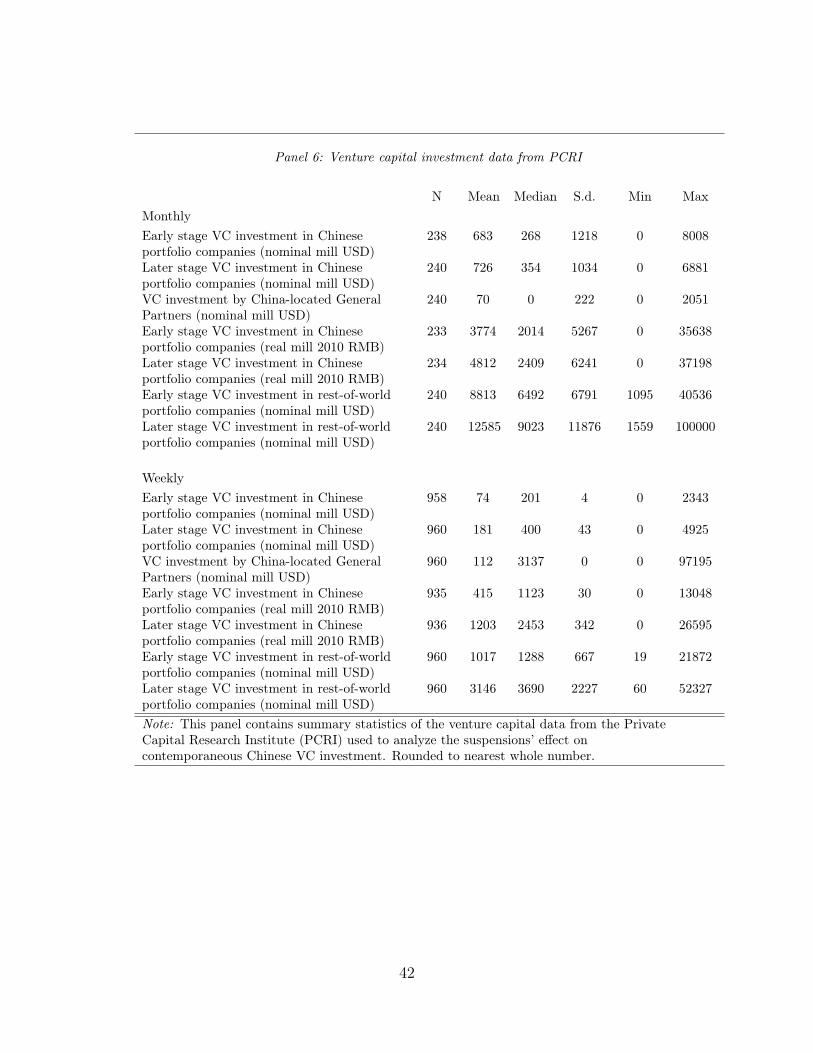
Panel 6: Venture capital investment data from PCRI
N Mean Median S.d. Min MaxMonthlyEarly stage VC investment in Chineseportfolio companies (nominal mill USD)
238 683 268 1218 0 8008
Later stage VC investment in Chineseportfolio companies (nominal mill USD)
240 726 354 1034 0 6881
VC investment by China-located GeneralPartners (nominal mill USD)
240 70 0 222 0 2051
Early stage VC investment in Chineseportfolio companies (real mill 2010 RMB)
233 3774 2014 5267 0 35638
Later stage VC investment in Chineseportfolio companies (real mill 2010 RMB)
234 4812 2409 6241 0 37198
Early stage VC investment in rest-of-worldportfolio companies (nominal mill USD)
240 8813 6492 6791 1095 40536
Later stage VC investment in rest-of-worldportfolio companies (nominal mill USD)
240 12585 9023 11876 1559 100000
WeeklyEarly stage VC investment in Chineseportfolio companies (nominal mill USD)
958 74 201 4 0 2343
Later stage VC investment in Chineseportfolio companies (nominal mill USD)
960 181 400 43 0 4925
VC investment by China-located GeneralPartners (nominal mill USD)
960 112 3137 0 0 97195
Early stage VC investment in Chineseportfolio companies (real mill 2010 RMB)
935 415 1123 30 0 13048
Later stage VC investment in Chineseportfolio companies (real mill 2010 RMB)
936 1203 2453 342 0 26595
Early stage VC investment in rest-of-worldportfolio companies (nominal mill USD)
960 1017 1288 667 19 21872
Later stage VC investment in rest-of-worldportfolio companies (nominal mill USD)
960 3146 3690 2227 60 52327
Note: This panel contains summary statistics of the venture capital data from the PrivateCapital Research Institute (PCRI) used to analyze the suspensions’ effect oncontemporaneous Chinese VC investment. Rounded to nearest whole number.
42
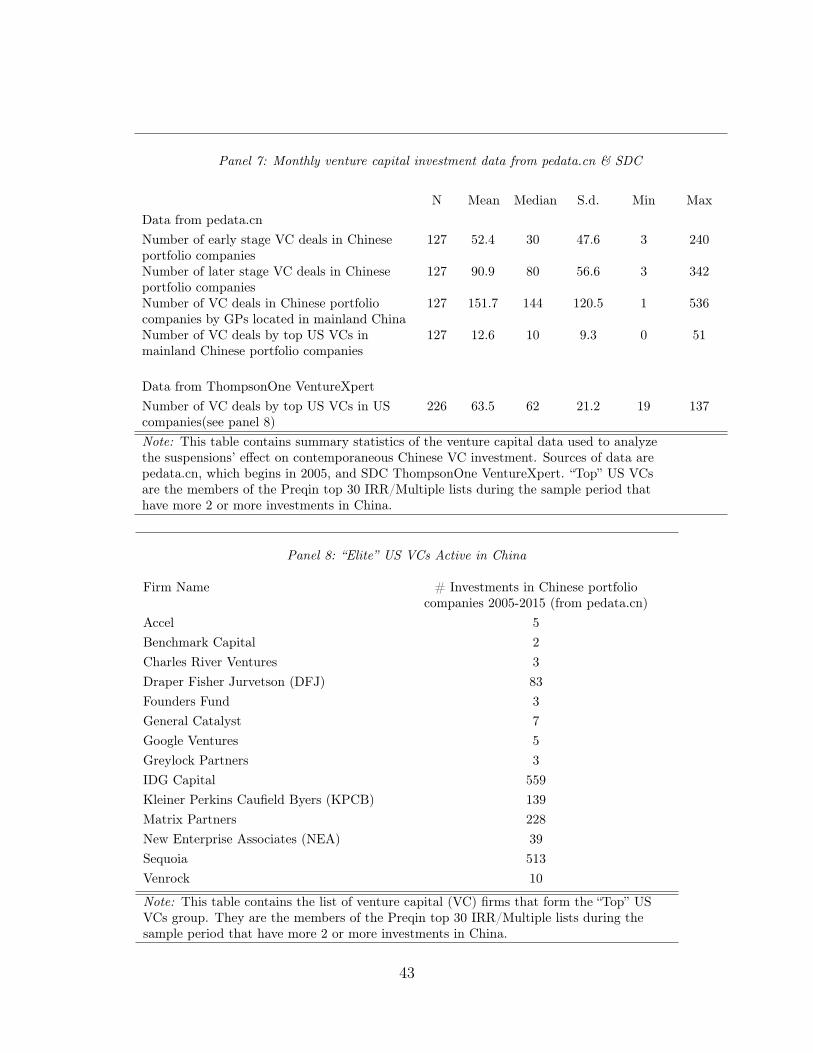
Panel 7: Monthly venture capital investment data from pedata.cn & SDC
N Mean Median S.d. Min MaxData from pedata.cnNumber of early stage VC deals in Chineseportfolio companies
127 52.4 30 47.6 3 240
Number of later stage VC deals in Chineseportfolio companies
127 90.9 80 56.6 3 342
Number of VC deals in Chinese portfoliocompanies by GPs located in mainland China
127 151.7 144 120.5 1 536
Number of VC deals by top US VCs inmainland Chinese portfolio companies
127 12.6 10 9.3 0 51
Data from ThompsonOne VentureXpertNumber of VC deals by top US VCs in UScompanies(see panel 8)
226 63.5 62 21.2 19 137
Note: This table contains summary statistics of the venture capital data used to analyzethe suspensions’ effect on contemporaneous Chinese VC investment. Sources of data arepedata.cn, which begins in 2005, and SDC ThompsonOne VentureXpert. “Top” US VCsare the members of the Preqin top 30 IRR/Multiple lists during the sample period thathave more 2 or more investments in China.
Panel 8: “Elite” US VCs Active in China
Firm Name # Investments in Chinese portfoliocompanies 2005-2015 (from pedata.cn)
Accel 5Benchmark Capital 2Charles River Ventures 3Draper Fisher Jurvetson (DFJ) 83Founders Fund 3General Catalyst 7Google Ventures 5Greylock Partners 3IDG Capital 559Kleiner Perkins Caufield Byers (KPCB) 139Matrix Partners 228New Enterprise Associates (NEA) 39Sequoia 513Venrock 10
Note: This table contains the list of venture capital (VC) firms that form the “Top” USVCs group. They are the members of the Preqin top 30 IRR/Multiple lists during thesample period that have more 2 or more investments in China.
43
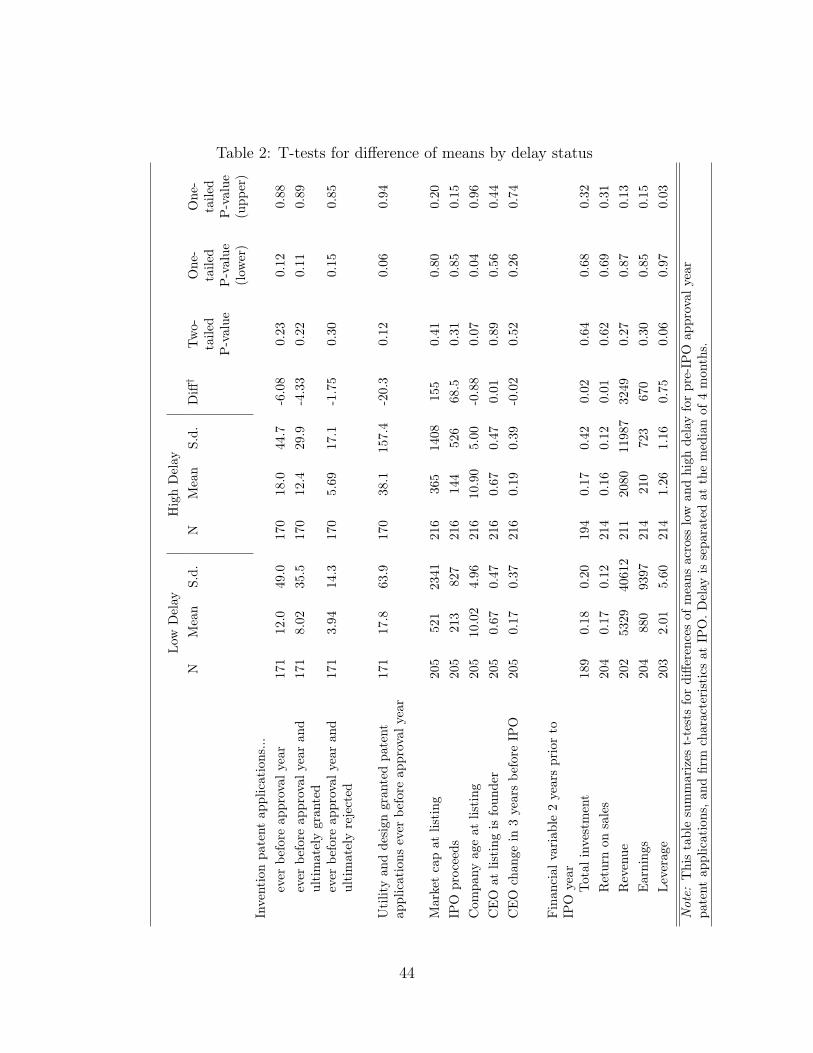
Table 2: T-tests for difference of means by delay statusLo
wD
elay
Hig
hD
elay
NM
ean
S.d.
NM
ean
S.d.
Diff
†Tw
o-ta
iled
P-v
alue
One
-ta
iled
P-v
alue
(low
er)
One
-ta
iled
P-v
alue
(upp
er)
Inve
ntio
npa
tent
appl
icat
ions
...ss
ssse
ver
befo
reap
prov
alye
ar17
112
.049
.017
018
.044
.7-6
.08
0.23
0.12
0.88
ssss
seve
rbe
fore
appr
oval
year
and
ssss
sultim
atel
ygr
ante
d17
18.
0235
.517
012
.429
.9-4
.33
0.22
0.11
0.89
ssss
seve
rbe
fore
appr
oval
year
and
ssss
sultim
atel
yre
ject
ed17
13.
9414
.317
05.
6917
.1-1
.75
0.30
0.15
0.85
Uti
lity
and
desi
gngr
ante
dpa
tent
appl
icat
ions
ever
befo
reap
prov
alye
ar17
117
.863
.917
038
.115
7.4
-20.
30.
120.
060.
94
Mar
ket
cap
atlis
ting
205
521
2341
216
365
1408
155
0.41
0.80
0.20
IPO
proc
eeds
205
213
827
216
144
526
68.5
0.31
0.85
0.15
Com
pany
age
atlis
ting
205
10.0
24.
9621
610
.90
5.00
-0.8
80.
070.
040.
96C
EO
atlis
ting
isfo
unde
r20
50.
670.
4721
60.
670.
470.
010.
890.
560.
44C
EO
chan
gein
3ye
ars
befo
reIP
O20
50.
170.
3721
60.
190.
39-0
.02
0.52
0.26
0.74
Fina
ncia
lvar
iabl
e2
year
spr
ior
toIP
Oye
arss
sssT
otal
inve
stm
ent
189
0.18
0.20
194
0.17
0.42
0.02
0.64
0.68
0.32
ssss
sRet
urn
onsa
les
204
0.17
0.12
214
0.16
0.12
0.01
0.62
0.69
0.31
ssss
sRev
enue
202
5329
4061
221
120
8011
987
3249
0.27
0.87
0.13
ssss
sEar
ning
s20
488
093
9721
421
072
367
00.
300.
850.
15ss
sssL
ever
age
203
2.01
5.60
214
1.26
1.16
0.75
0.06
0.97
0.03
Not
e:T
his
tabl
esu
mm
ariz
est-
test
sfo
rdi
ffere
nces
ofm
eans
acro
sslo
wan
dhi
ghde
lay
for
pre-
IPO
appr
oval
year
pate
ntap
plic
atio
ns,a
ndfir
mch
arac
teri
stic
sat
IPO
.Del
ayis
sepa
rate
dat
the
med
ian
of4
mon
ths.
44
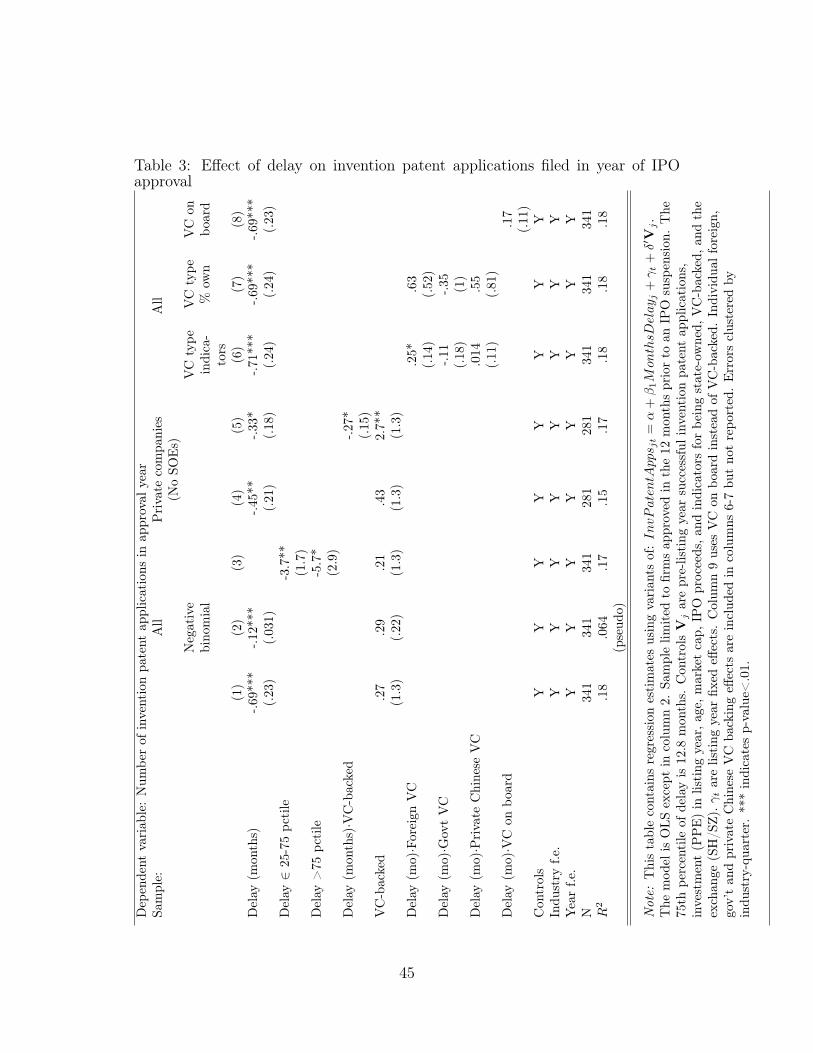
Table 3: Effect of delay on invention patent applications filed in year of IPOapproval
Dep
ende
ntva
riab
le:
Num
ber
ofin
vent
ion
pate
ntap
plic
atio
nsin
appr
oval
year
Sam
ple:
All
Pri
vate
com
pani
es(N
oSO
Es)
All
Neg
ativ
ebi
nom
ial
VC
type
indi
ca-
tors
VC
type
%ow
nV
Con
boar
d
(1)
(2)
(3)
(4)
(5)
(6)
(7)
(8)
Del
ay(m
onth
s)-.6
9***
-.12*
**-.4
5**
-.33*
-.71*
**-.6
9***
-.69*
**(.
23)
(.03
1)(.
21)
(.18
)(.
24)
(.24
)(.
23)
Del
ay2
25-7
5pc
tile
-3.7
**(1
.7)
Del
ay>
75pc
tile
-5.7
*(2
.9)
Del
ay(m
onth
s)·V
C-b
acke
d-.2
7*(.
15)
VC
-bac
ked
.27
.29
.21
.43
2.7*
*(1
.3)
(.22
)(1
.3)
(1.3
)(1
.3)
Del
ay(m
o)·F
orei
gnV
C.2
5*.6
3(.
14)
(.52
)D
elay
(mo)·G
ovt
VC
-.11
-.35
(.18
)(1
)D
elay
(mo)·P
riva
teC
hine
seV
C.0
14.5
5(.
11)
(.81
)D
elay
(mo)·V
Con
boar
d.1
7(.
11)
Con
trol
sY
YY
YY
YY
YIn
dust
ryf.e
.Y
YY
YY
YY
YY
ear
f.e.
YY
YY
YY
YY
N34
134
134
128
128
134
134
134
1R
2.1
8.0
64(p
seud
o).1
7.1
5.1
7.1
8.1
8.1
8
Not
e:T
his
tabl
eco
ntai
nsre
gres
sion
esti
mat
esus
ing
vari
ants
of:In
vPaten
tApp
s jt=
↵+�1M
onthsD
elay
j+� t
+�0V
j.
The
mod
elis
OLS
exce
ptin
colu
mn
2.Sa
mpl
elim
ited
tofir
ms
appr
oved
inth
e12
mon
ths
prio
rto
anIP
Osu
spen
sion
.T
he75
thpe
rcen
tile
ofde
lay
is12
.8m
onth
s.C
ontr
olsV
jar
epr
e-lis
ting
year
succ
essf
ulin
vent
ion
pate
ntap
plic
atio
ns,
inve
stm
ent
(PP
E)
inlis
ting
year
,age
,mar
ket
cap,
IPO
proc
eeds
,and
indi
cato
rsfo
rbe
ing
stat
e-ow
ned,
VC
-bac
ked,
and
the
exch
ange
(SH
/SZ)
.�t
are
listi
ngye
arfix
edeff
ects
.C
olum
n9
uses
VC
onbo
ard
inst
ead
ofV
C-b
acke
d.In
divi
dual
fore
ign,
gov’
tan
dpr
ivat
eC
hine
seV
Cba
ckin
geff
ects
are
incl
uded
inco
lum
ns6-
7bu
tno
tre
port
ed.
Err
ors
clus
tere
dby
indu
stry
-qua
rter
.**
*in
dica
tes
p-va
lue<
.01.
45
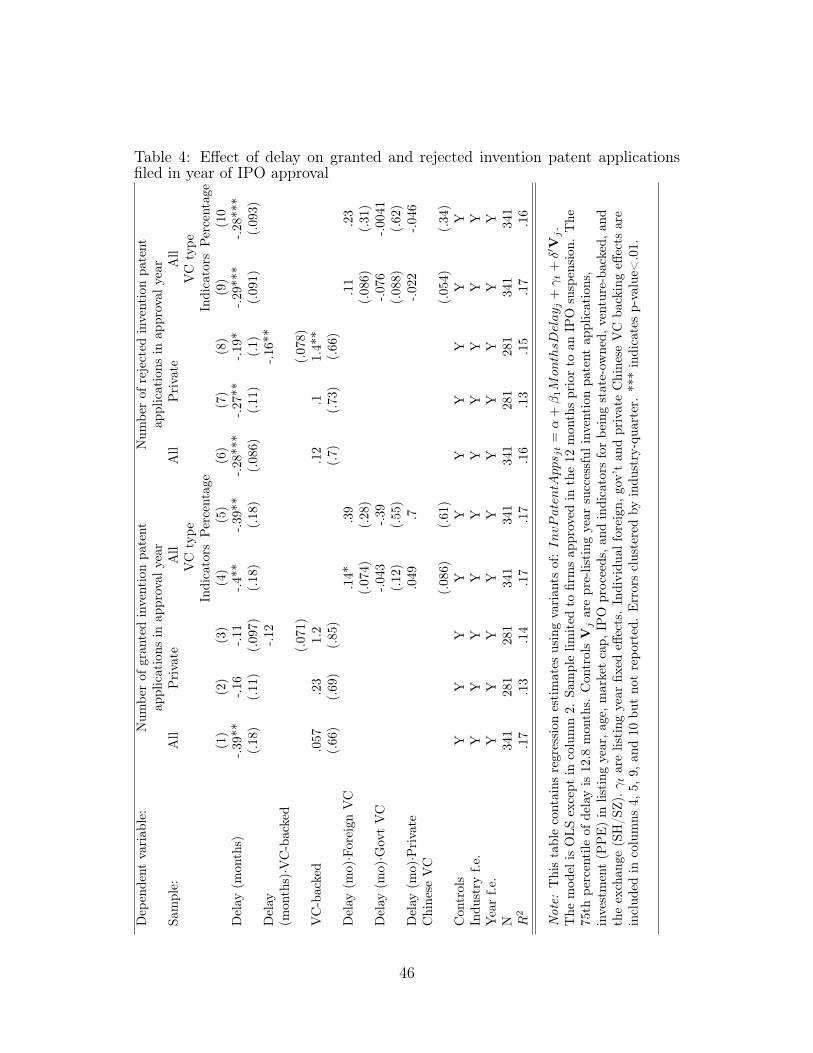
Table 4: Effect of delay on granted and rejected invention patent applicationsfiled in year of IPO approval
Dep
ende
ntva
riab
le:
Num
ber
ofgr
ante
din
vent
ion
pate
ntap
plic
atio
nsin
appr
oval
year
Num
ber
ofre
ject
edin
vent
ion
pate
ntap
plic
atio
nsin
appr
oval
year
Sam
ple:
All
Pri
vate
All
All
Pri
vate
All
VC
type
VC
type
Indi
cato
rsPe
rcen
tage
Indi
cato
rsPe
rcen
tage
(1)
(2)
(3)
(4)
(5)
(6)
(7)
(8)
(9)
(10
Del
ay(m
onth
s)-.3
9**
-.16
-.11
-.4**
-.39*
*-.2
8***
-.27*
*-.1
9*-.2
9***
-.28*
**(.
18)
(.11
)(.
097)
(.18
)(.
18)
(.08
6)(.
11)
(.1)
(.09
1)(.
093)
Del
ay(m
onth
s)·V
C-b
acke
d-.1
2-.1
6**
(.07
1)(.
078)
VC
-bac
ked
.057
.23
1.2
.12
.11.
4**
(.66
)(.
69)
(.85
)(.
7)(.
73)
(.66
)D
elay
(mo)·F
orei
gnV
C.1
4*.3
9.1
1.2
3(.
074)
(.28
)(.
086)
(.31
)D
elay
(mo)·G
ovt
VC
-.043
-.39
-.076
-.004
1(.
12)
(.55
)(.
088)
(.62
)D
elay
(mo)·P
riva
teC
hine
seV
C.0
49.7
-.022
-.046
(.08
6)(.
61)
(.05
4)(.
34)
Con
trol
sY
YY
YY
YY
YY
YIn
dust
ryf.e
.Y
YY
YY
YY
YY
YY
ear
f.e.
YY
YY
YY
YY
YY
N34
128
128
134
134
134
128
128
134
134
1R
2.1
7.1
3.1
4.1
7.1
7.1
6.1
3.1
5.1
7.1
6
Not
e:T
his
tabl
eco
ntai
nsre
gres
sion
esti
mat
esus
ing
vari
ants
of:In
vPaten
tApp
s jt=
↵+�1M
onthsD
elay
j+� t
+�0V
j.
The
mod
elis
OLS
exce
ptin
colu
mn
2.Sa
mpl
elim
ited
tofir
ms
appr
oved
inth
e12
mon
ths
prio
rto
anIP
Osu
spen
sion
.T
he75
thpe
rcen
tile
ofde
lay
is12
.8m
onth
s.C
ontr
olsV
jar
epr
e-lis
ting
year
succ
essf
ulin
vent
ion
pate
ntap
plic
atio
ns,
inve
stm
ent
(PP
E)
inlis
ting
year
,age
,mar
ket
cap,
IPO
proc
eeds
,and
indi
cato
rsfo
rbe
ing
stat
e-ow
ned,
vent
ure-
back
ed,a
ndth
eex
chan
ge(S
H/S
Z).�
tar
elis
ting
year
fixed
effec
ts.
Indi
vidu
alfo
reig
n,go
v’t
and
priv
ate
Chi
nese
VC
back
ing
effec
tsar
ein
clud
edin
colu
mns
4,5,
9,an
d10
but
not
repo
rted
.E
rror
scl
uste
red
byin
dust
ry-q
uart
er.
***
indi
cate
sp-
valu
e<.0
1.
46
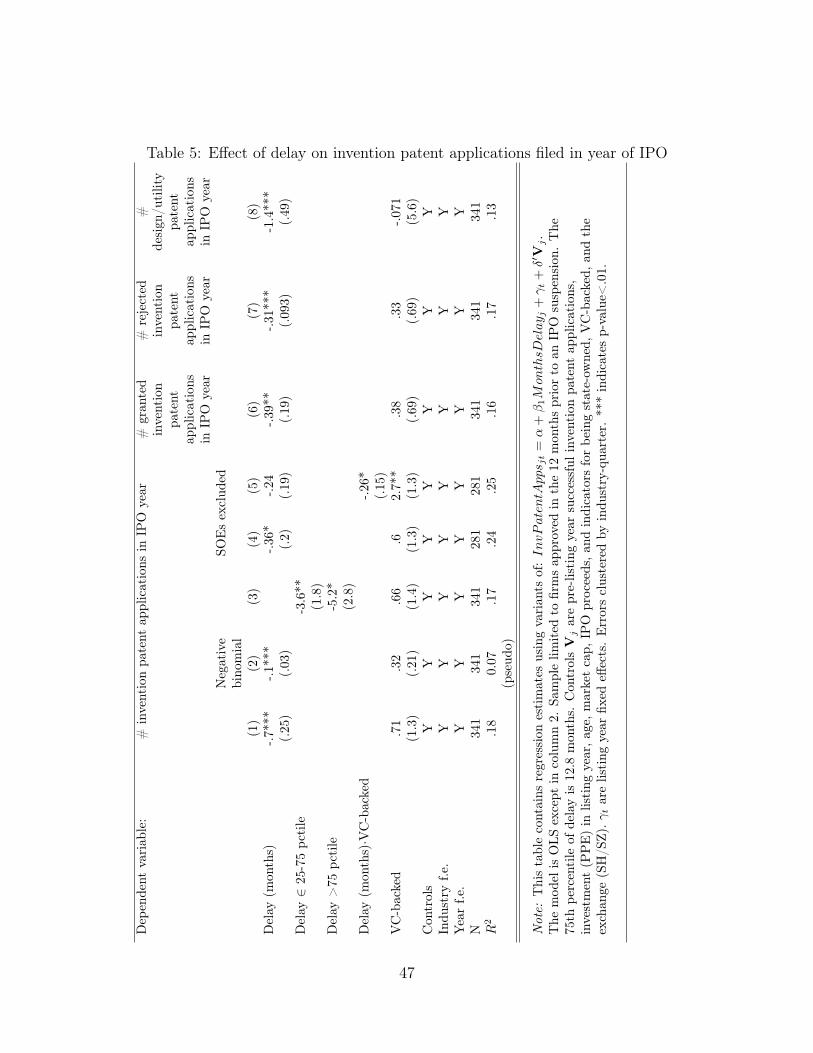
Table 5: Effect of delay on invention patent applications filed in year of IPOD
epen
dent
vari
able
:#
inve
ntio
npa
tent
appl
icat
ions
inIP
Oye
ar#
gran
ted
inve
ntio
npa
tent
appl
icat
ions
inIP
Oye
ar
#re
ject
edin
vent
ion
pate
ntap
plic
atio
nsin
IPO
year
#de
sign
/utilit
ypa
tent
appl
icat
ions
inIP
Oye
arN
egat
ive
bino
mia
lSO
Es
excl
uded
(1)
(2)
(3)
(4)
(5)
(6)
(7)
(8)
Del
ay(m
onth
s)-.7
***
-.1**
*-.3
6*-.2
4-.3
9**
-.31*
**-1
.4**
*(.
25)
(.03
)(.
2)(.
19)
(.19
)(.
093)
(.49
)D
elay
225
-75
pcti
le-3
.6**
(1.8
)D
elay
>75
pcti
le-5
.2*
(2.8
)D
elay
(mon
ths)·V
C-b
acke
d-.2
6*(.
15)
VC
-bac
ked
.71
.32
.66
.62.
7**
.38
.33
-.071
(1.3
)(.
21)
(1.4
)(1
.3)
(1.3
)(.
69)
(.69
)(5
.6)
Con
trol
sY
YY
YY
YY
YIn
dust
ryf.e
.Y
YY
YY
YY
YY
ear
f.e.
YY
YY
YY
YY
N34
134
134
128
128
134
134
134
1R
2.1
80.
07(p
seud
o).1
7.2
4.2
5.1
6.1
7.1
3
Not
e:T
his
tabl
eco
ntai
nsre
gres
sion
esti
mat
esus
ing
vari
ants
of:In
vPaten
tApp
s jt=
↵+
�1M
onthsD
elay
j+
� t+
�0V
j.
The
mod
elis
OLS
exce
ptin
colu
mn
2.Sa
mpl
elim
ited
tofir
ms
appr
oved
inth
e12
mon
ths
prio
rto
anIP
Osu
spen
sion
.T
he75
thpe
rcen
tile
ofde
lay
is12
.8m
onth
s.C
ontr
olsV
jar
epr
e-lis
ting
year
succ
essf
ulin
vent
ion
pate
ntap
plic
atio
ns,
inve
stm
ent
(PP
E)
inlis
ting
year
,age
,mar
ket
cap,
IPO
proc
eeds
,and
indi
cato
rsfo
rbe
ing
stat
e-ow
ned,
VC
-bac
ked,
and
the
exch
ange
(SH
/SZ)
.�t
are
listi
ngye
arfix
edeff
ects
.E
rror
scl
uste
red
byin
dust
ry-q
uart
er.
***
indi
cate
sp-
valu
e<.0
1.
47
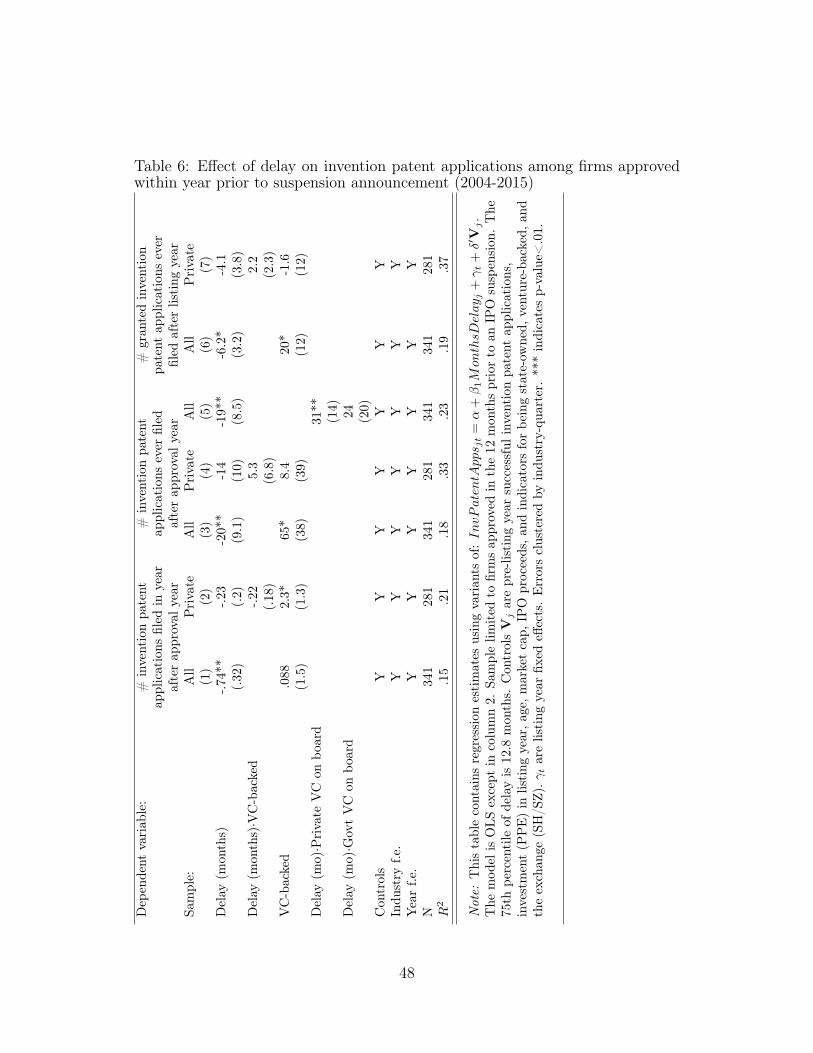
Table 6: Effect of delay on invention patent applications among firms approvedwithin year prior to suspension announcement (2004-2015)
Dep
ende
ntva
riab
le:
#in
vent
ion
pate
ntap
plic
atio
nsfil
edin
year
afte
rap
prov
alye
ar
#in
vent
ion
pate
ntap
plic
atio
nsev
erfil
edaf
ter
appr
oval
year
#gr
ante
din
vent
ion
pate
ntap
plic
atio
nsev
erfil
edaf
ter
listing
year
Sam
ple:
All
Pri
vate
All
Pri
vate
All
All
Pri
vate
(1)
(2)
(3)
(4)
(5)
(6)
(7)
Del
ay(m
onth
s)-.7
4**
-.23
-20*
*-1
4-1
9**
-6.2
*-4
.1(.
32)
(.2)
(9.1
)(1
0)(8
.5)
(3.2
)(3
.8)
Del
ay(m
onth
s)·V
C-b
acke
d-.2
25.
32.
2(.
18)
(6.8
)(2
.3)
VC
-bac
ked
.088
2.3*
65*
8.4
20*
-1.6
(1.5
)(1
.3)
(38)
(39)
(12)
(12)
Del
ay(m
o)·P
riva
teV
Con
boar
d31
**(1
4)D
elay
(mo)·G
ovt
VC
onbo
ard
24 (20)
Con
trol
sY
YY
YY
YY
Indu
stry
f.e.
YY
YY
YY
YY
ear
f.e.
YY
YY
YY
YN
341
281
341
281
341
341
281
R2
.15
.21
.18
.33
.23
.19
.37
Not
e:T
his
tabl
eco
ntai
nsre
gres
sion
esti
mat
esus
ing
vari
ants
of:In
vPaten
tApp
s jt=
↵+
�1M
onthsD
elay
j+� t
+�0V
j.
The
mod
elis
OLS
exce
ptin
colu
mn
2.Sa
mpl
elim
ited
tofir
ms
appr
oved
inth
e12
mon
ths
prio
rto
anIP
Osu
spen
sion
.T
he75
thpe
rcen
tile
ofde
lay
is12
.8m
onth
s.C
ontr
olsV
jar
epr
e-lis
ting
year
succ
essf
ulin
vent
ion
pate
ntap
plic
atio
ns,
inve
stm
ent
(PP
E)
inlis
ting
year
,age
,mar
ket
cap,
IPO
proc
eeds
,and
indi
cato
rsfo
rbe
ing
stat
e-ow
ned,
vent
ure-
back
ed,a
ndth
eex
chan
ge(S
H/S
Z).�
tar
elis
ting
year
fixed
effec
ts.
Err
ors
clus
tere
dby
indu
stry
-qua
rter
.**
*in
dica
tes
p-va
lue<
.01.
48
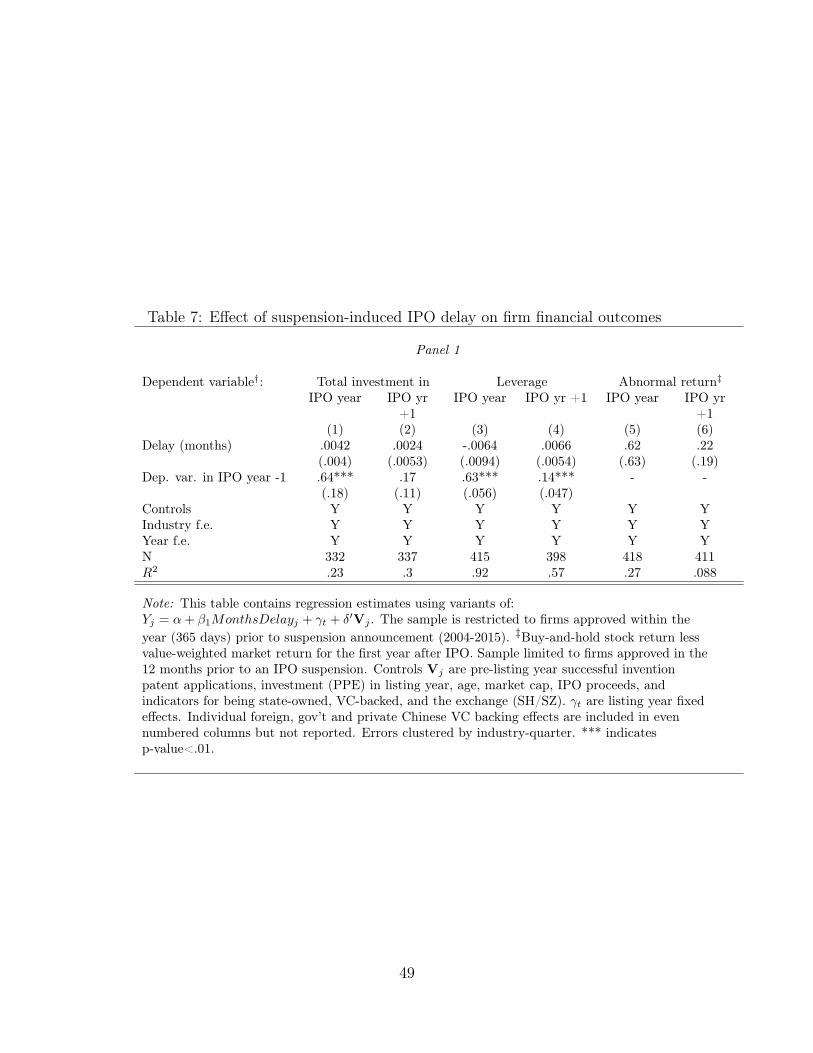
Table 7: Effect of suspension-induced IPO delay on firm financial outcomes
Panel 1
Dependent variable†: Total investment in Leverage Abnormal return‡
IPO year IPO yr+1
IPO year IPO yr +1 IPO year IPO yr+1
(1) (2) (3) (4) (5) (6)Delay (months) .0042 .0024 -.0064 .0066 .62 .22
(.004) (.0053) (.0094) (.0054) (.63) (.19)Dep. var. in IPO year -1 .64*** .17 .63*** .14*** - -
(.18) (.11) (.056) (.047)Controls Y Y Y Y Y YIndustry f.e. Y Y Y Y Y YYear f.e. Y Y Y Y Y YN 332 337 415 398 418 411R2 .23 .3 .92 .57 .27 .088
Note: This table contains regression estimates using variants of:Yj = ↵+ �1MonthsDelayj + �t + �0Vj . The sample is restricted to firms approved within theyear (365 days) prior to suspension announcement (2004-2015). ‡Buy-and-hold stock return lessvalue-weighted market return for the first year after IPO. Sample limited to firms approved in the12 months prior to an IPO suspension. Controls Vj are pre-listing year successful inventionpatent applications, investment (PPE) in listing year, age, market cap, IPO proceeds, andindicators for being state-owned, VC-backed, and the exchange (SH/SZ). �t are listing year fixedeffects. Individual foreign, gov’t and private Chinese VC backing effects are included in evennumbered columns but not reported. Errors clustered by industry-quarter. *** indicatesp-value<.01.
49
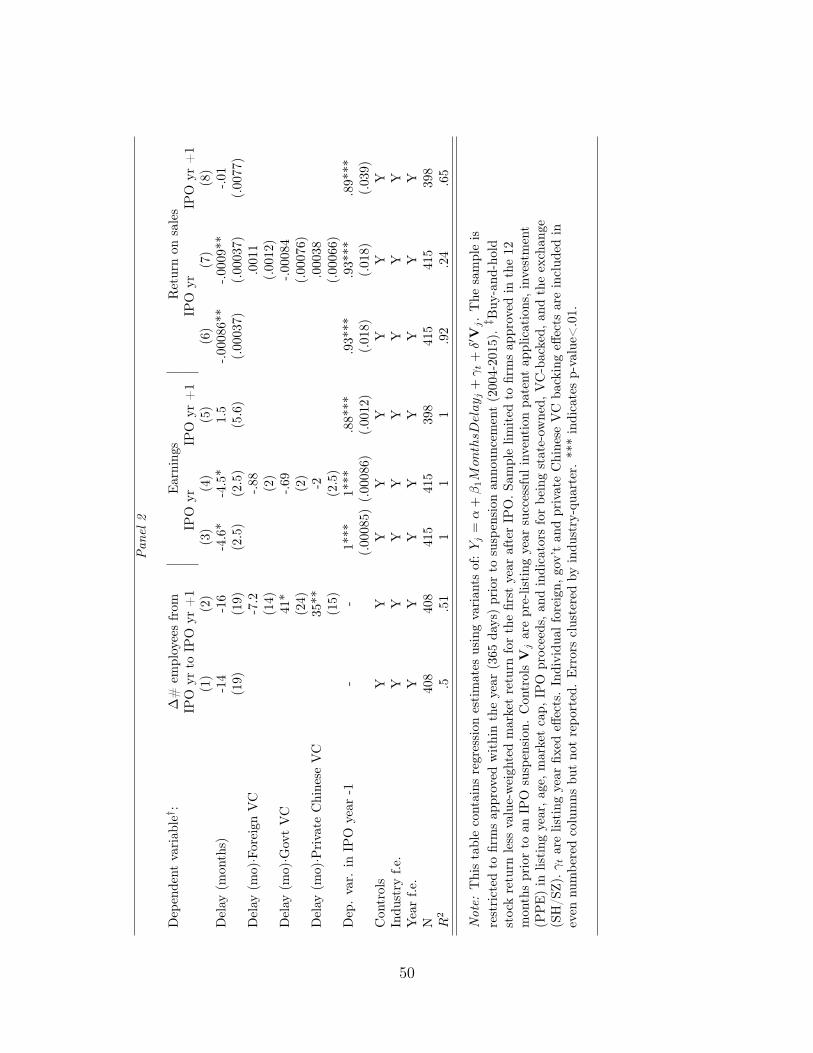
Pan
el2
Dep
ende
ntva
riab
le† :
�#
empl
oyee
sfr
omE
arni
ngs
Ret
urn
onsa
les
IPO
yrto
IPO
yr+
1IP
Oyr
IPO
yr+
1IP
Oyr
IPO
yr+
1(1
)(2
)(3
)(4
)(5
)(6
)(7
)(8
)D
elay
(mon
ths)
-14
-16
-4.6
*-4
.5*
1.5
-.000
86**
-.000
9**
-.01
(19)
(19)
(2.5
)(2
.5)
(5.6
)(.
0003
7)(.
0003
7)(.
0077
)D
elay
(mo)·F
orei
gnV
C-7
.2-.8
8.0
011
(14)
(2)
(.00
12)
Del
ay(m
o)·G
ovt
VC
41*
-.69
-.000
84(2
4)(2
)(.
0007
6)D
elay
(mo)·P
riva
teC
hine
seV
C35
**-2
.000
38(1
5)(2
.5)
(.00
066)
Dep
.va
r.in
IPO
year
-1-
-1*
**1*
**.8
8***
.93*
**.9
3***
.89*
**(.
0008
5)(.
0008
6)(.
0012
)(.
018)
(.01
8)(.
039)
Con
trol
sY
YY
YY
YY
YIn
dust
ryf.e
.Y
YY
YY
YY
YY
ear
f.e.
YY
YY
YY
YY
N40
840
841
541
539
841
541
539
8R
2.5
.51
11
1.9
2.2
4.6
5
Not
e:T
his
tabl
eco
ntai
nsre
gres
sion
esti
mat
esus
ing
vari
ants
of:Yj=
↵+
�1M
onthsD
elay
j+
� t+
�0V
j.
The
sam
ple
isre
stri
cted
tofir
ms
appr
oved
wit
hin
the
year
(365
days
)pr
ior
tosu
spen
sion
anno
unce
men
t(2
004-
2015
).‡ B
uy-a
nd-h
old
stoc
kre
turn
less
valu
e-w
eigh
ted
mar
ket
retu
rnfo
rth
efir
stye
araf
ter
IPO
.Sam
ple
limit
edto
firm
sap
prov
edin
the
12m
onth
spr
ior
toan
IPO
susp
ensi
on.
Con
trol
sV
jar
epr
e-lis
ting
year
succ
essf
ulin
vent
ion
pate
ntap
plic
atio
ns,i
nves
tmen
t(P
PE
)in
listi
ngye
ar,a
ge,m
arke
tca
p,IP
Opr
ocee
ds,a
ndin
dica
tors
for
bein
gst
ate-
owne
d,V
C-b
acke
d,an
dth
eex
chan
ge(S
H/S
Z).�
tar
elis
ting
year
fixed
effec
ts.
Indi
vidu
alfo
reig
n,go
v’t
and
priv
ate
Chi
nese
VC
back
ing
effec
tsar
ein
clud
edin
even
num
bere
dco
lum
nsbu
tno
tre
port
ed.
Err
ors
clus
tere
dby
indu
stry
-qua
rter
.**
*in
dica
tes
p-va
lue<
.01.
50
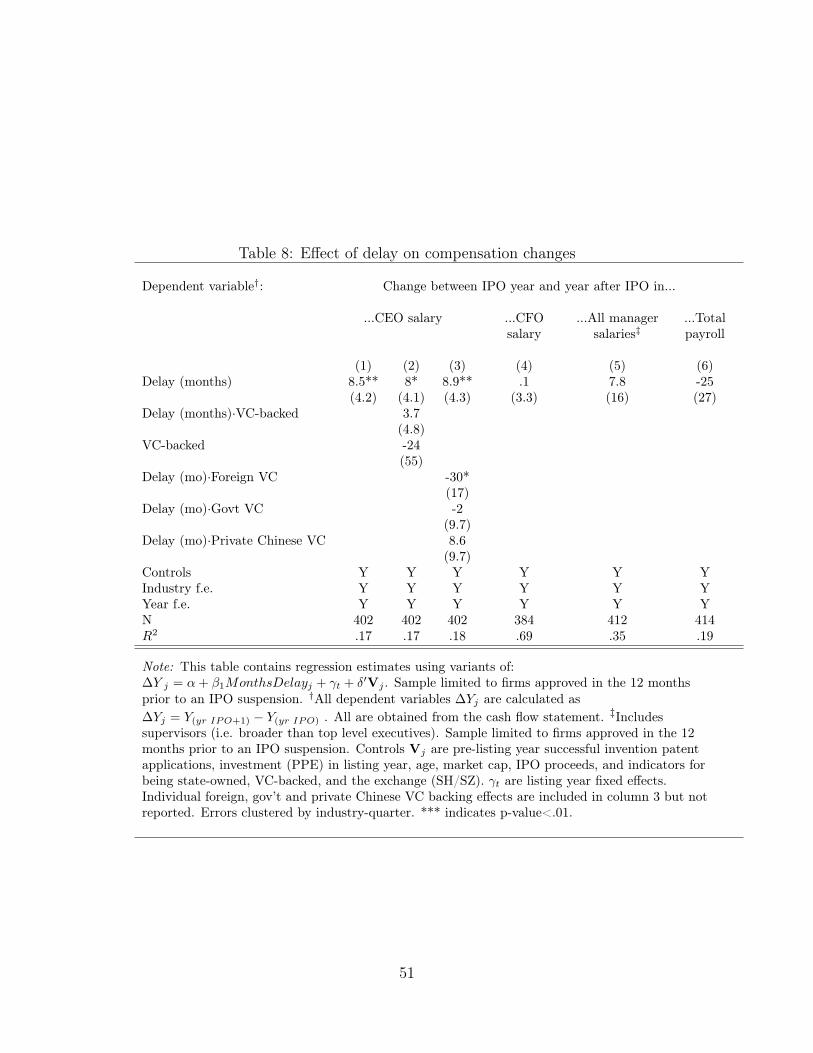
Table 8: Effect of delay on compensation changes
Dependent variable†: Change between IPO year and year after IPO in...
...CEO salary ...CFOsalary
...All managersalaries‡
...Totalpayroll
(1) (2) (3) (4) (5) (6)Delay (months) 8.5** 8* 8.9** .1 7.8 -25
(4.2) (4.1) (4.3) (3.3) (16) (27)Delay (months)·VC-backed 3.7
(4.8)VC-backed -24
(55)Delay (mo)·Foreign VC -30*
(17)Delay (mo)·Govt VC -2
(9.7)Delay (mo)·Private Chinese VC 8.6
(9.7)Controls Y Y Y Y Y YIndustry f.e. Y Y Y Y Y YYear f.e. Y Y Y Y Y YN 402 402 402 384 412 414R2 .17 .17 .18 .69 .35 .19
Note: This table contains regression estimates using variants of:�Y j = ↵+ �1MonthsDelayj + �t + �0Vj . Sample limited to firms approved in the 12 monthsprior to an IPO suspension. †All dependent variables �Yj are calculated as�Yj = Y(yr IPO+1) � Y(yr IPO) . All are obtained from the cash flow statement. ‡Includessupervisors (i.e. broader than top level executives). Sample limited to firms approved in the 12months prior to an IPO suspension. Controls Vj are pre-listing year successful invention patentapplications, investment (PPE) in listing year, age, market cap, IPO proceeds, and indicators forbeing state-owned, VC-backed, and the exchange (SH/SZ). �t are listing year fixed effects.Individual foreign, gov’t and private Chinese VC backing effects are included in column 3 but notreported. Errors clustered by industry-quarter. *** indicates p-value<.01.
51
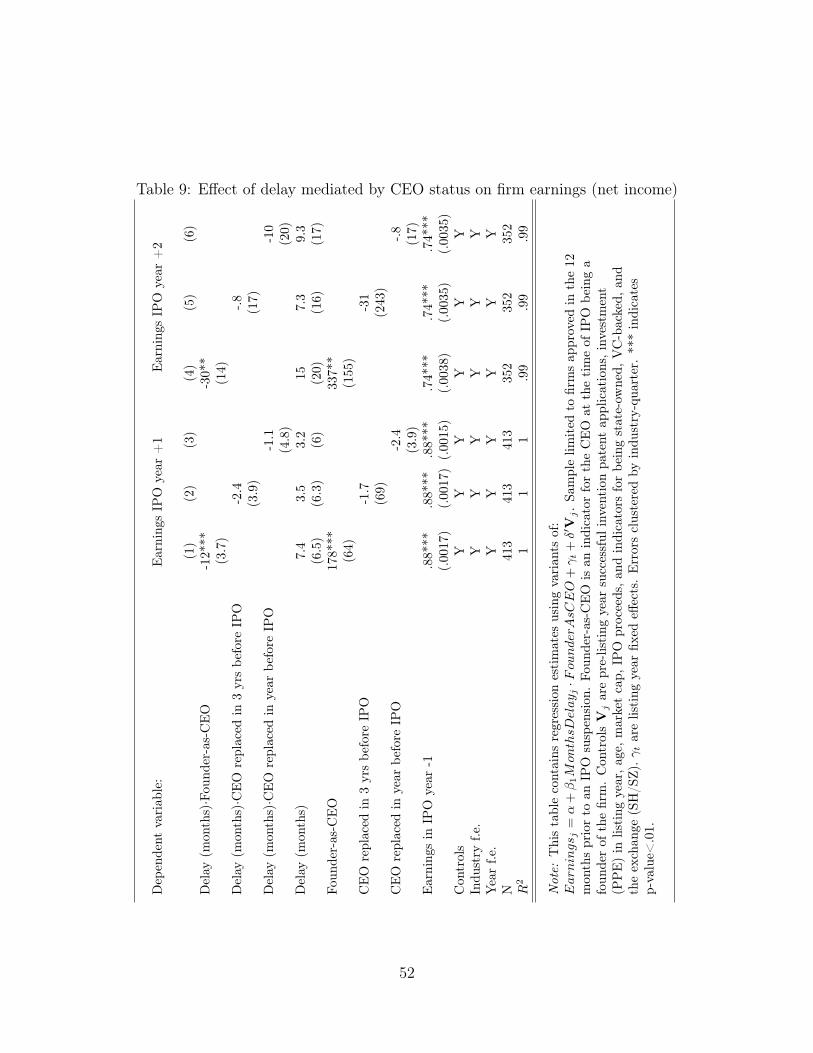
Table 9: Effect of delay mediated by CEO status on firm earnings (net income)
Dep
ende
ntva
riab
le:
Ear
ning
sIP
Oye
ar+
1E
arni
ngs
IPO
year
+2
(1)
(2)
(3)
(4)
(5)
(6)
Del
ay(m
onth
s)·F
ound
er-a
s-C
EO
-12*
**-3
0**
(3.7
)(1
4)D
elay
(mon
ths)·C
EO
repl
aced
in3
yrs
befo
reIP
O-2
.4-.8
(3.9
)(1
7)D
elay
(mon
ths)·C
EO
repl
aced
inye
arbe
fore
IPO
-1.1
-10
(4.8
)(2
0)D
elay
(mon
ths)
7.4
3.5
3.2
157.
39.
3(6
.5)
(6.3
)(6
)(2
0)(1
6)(1
7)Fo
unde
r-as
-CE
O17
8***
337*
*(6
4)(1
55)
CE
Ore
plac
edin
3yr
sbe
fore
IPO
-1.7
-31
(69)
(243
)C
EO
repl
aced
inye
arbe
fore
IPO
-2.4
-.8(3
.9)
(17)
Ear
ning
sin
IPO
year
-1.8
8***
.88*
**.8
8***
.74*
**.7
4***
.74*
**(.
0017
)(.
0017
)(.
0015
)(.
0038
)(.
0035
)(.
0035
)C
ontr
ols
YY
YY
YY
Indu
stry
f.e.
YY
YY
YY
Yea
rf.e
.Y
YY
YY
YN
413
413
413
352
352
352
R2
11
1.9
9.9
9.9
9
Not
e:T
his
tabl
eco
ntai
nsre
gres
sion
esti
mat
esus
ing
vari
ants
of:
Ear
nings
j=
↵+�1M
onthsD
elay
j·F
ounderA
sCEO+� t
+�0V
j.
Sam
ple
limit
edto
firm
sap
prov
edin
the
12m
onth
spr
ior
toan
IPO
susp
ensi
on.
Foun
der-
as-C
EO
isan
indi
cato
rfo
rth
eC
EO
atth
eti
me
ofIP
Obe
ing
afo
unde
rof
the
firm
.C
ontr
olsV
jar
epr
e-lis
ting
year
succ
essf
ulin
vent
ion
pate
ntap
plic
atio
ns,i
nves
tmen
t(P
PE
)in
listi
ngye
ar,a
ge,m
arke
tca
p,IP
Opr
ocee
ds,a
ndin
dica
tors
for
bein
gst
ate-
owne
d,V
C-b
acke
d,an
dth
eex
chan
ge(S
H/S
Z).�
tar
elis
ting
year
fixed
effec
ts.
Err
ors
clus
tere
dby
indu
stry
-qua
rter
.**
*in
dica
tes
p-va
lue<
.01.
52
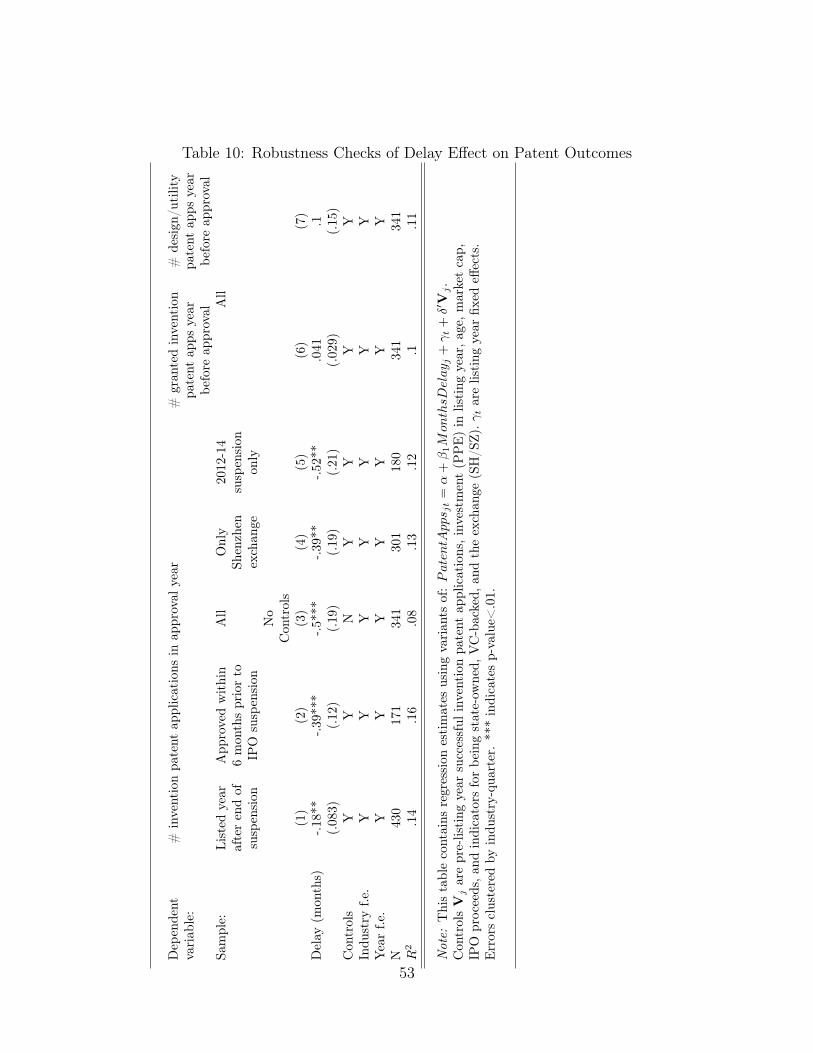
Table 10: Robustness Checks of Delay Effect on Patent OutcomesD
epen
dent
vari
able
:#
inve
ntio
npa
tent
appl
icat
ions
inap
prov
alye
ar#
gran
ted
inve
ntio
npa
tent
apps
year
befo
reap
prov
al
#de
sign
/uti
lity
pate
ntap
psye
arbe
fore
appr
oval
Sam
ple:
List
edye
araf
ter
end
ofsu
spen
sion
App
rove
dw
ithi
n6
mon
ths
prio
rto
IPO
susp
ensi
on
All
Onl
ySh
enzh
enex
chan
ge
2012
-14
susp
ensi
onon
ly
All
No
Con
trol
s(1
)(2
)(3
)(4
)(5
)(6
)(7
)D
elay
(mon
ths)
-.18*
*-.3
9***
-.5**
*-.3
9**
-.52*
*.0
41.1
(.08
3)(.
12)
(.19
)(.
19)
(.21
)(.
029)
(.15
)C
ontr
ols
YY
NY
YY
YIn
dust
ryf.e
.Y
YY
YY
YY
Yea
rf.e
.Y
YY
YY
YY
N43
017
134
130
118
034
134
1R
2.1
4.1
6.0
8.1
3.1
2.1
.11
Not
e:T
his
tabl
eco
ntai
nsre
gres
sion
esti
mat
esus
ing
vari
ants
of:Paten
tApp
s jt=
↵+�1M
onthsD
elay
j+� t
+�0V
j.
Con
trol
sV
jar
epr
e-lis
ting
year
succ
essf
ulin
vent
ion
pate
ntap
plic
atio
ns,i
nves
tmen
t(P
PE
)in
listi
ngye
ar,a
ge,m
arke
tca
p,IP
Opr
ocee
ds,a
ndin
dica
tors
for
bein
gst
ate-
owne
d,V
C-b
acke
d,an
dth
eex
chan
ge(S
H/S
Z).�
tar
elis
ting
year
fixed
effec
ts.
Err
ors
clus
tere
dby
indu
stry
-qua
rter
.**
*in
dica
tes
p-va
lue<
.01.
53
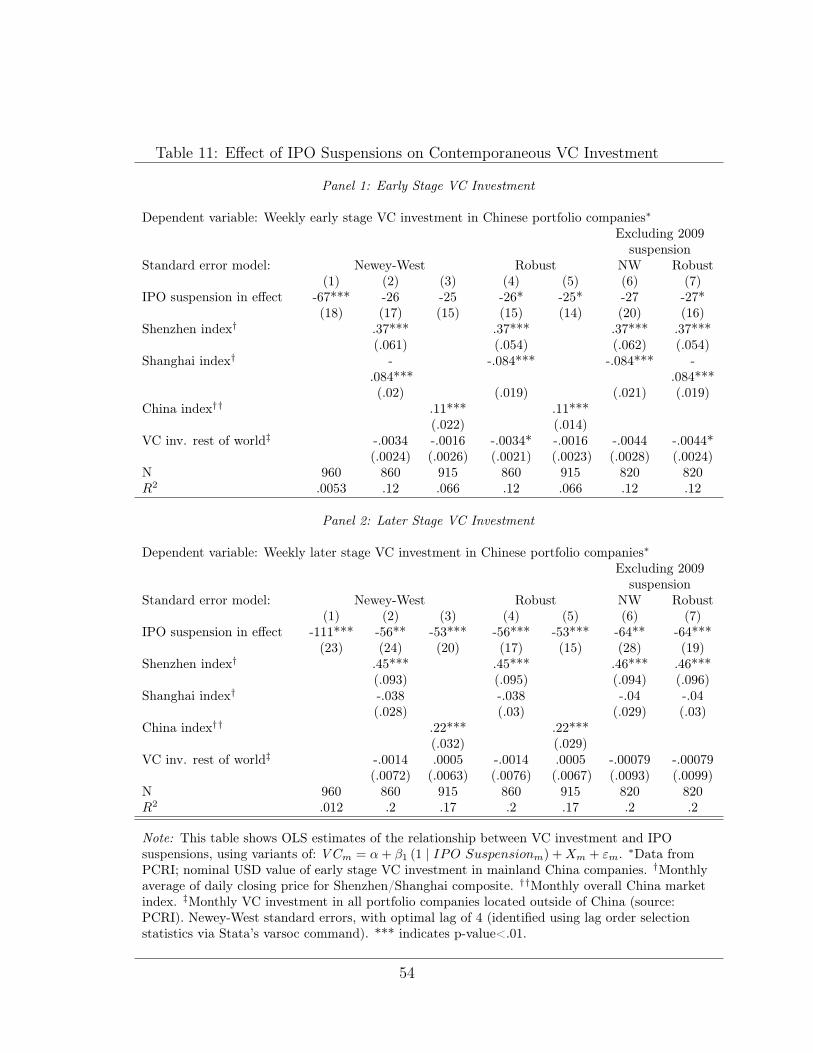
Table 11: Effect of IPO Suspensions on Contemporaneous VC Investment
Panel 1: Early Stage VC Investment
Dependent variable: Weekly early stage VC investment in Chinese portfolio companies⇤Excluding 2009
suspensionStandard error model: Newey-West Robust NW Robust
(1) (2) (3) (4) (5) (6) (7)IPO suspension in effect -67*** -26 -25 -26* -25* -27 -27*
(18) (17) (15) (15) (14) (20) (16)Shenzhen index† .37*** .37*** .37*** .37***
(.061) (.054) (.062) (.054)Shanghai index† -
.084***-.084*** -.084*** -
.084***(.02) (.019) (.021) (.019)
China index†† .11*** .11***(.022) (.014)
VC inv. rest of world‡ -.0034 -.0016 -.0034* -.0016 -.0044 -.0044*(.0024) (.0026) (.0021) (.0023) (.0028) (.0024)
N 960 860 915 860 915 820 820R2 .0053 .12 .066 .12 .066 .12 .12
Panel 2: Later Stage VC Investment
Dependent variable: Weekly later stage VC investment in Chinese portfolio companies⇤Excluding 2009
suspensionStandard error model: Newey-West Robust NW Robust
(1) (2) (3) (4) (5) (6) (7)IPO suspension in effect -111*** -56** -53*** -56*** -53*** -64** -64***
(23) (24) (20) (17) (15) (28) (19)Shenzhen index† .45*** .45*** .46*** .46***
(.093) (.095) (.094) (.096)Shanghai index† -.038 -.038 -.04 -.04
(.028) (.03) (.029) (.03)China index†† .22*** .22***
(.032) (.029)VC inv. rest of world‡ -.0014 .0005 -.0014 .0005 -.00079 -.00079
(.0072) (.0063) (.0076) (.0067) (.0093) (.0099)N 960 860 915 860 915 820 820R2 .012 .2 .17 .2 .17 .2 .2
Note: This table shows OLS estimates of the relationship between VC investment and IPOsuspensions, using variants of: V Cm = ↵+ �1 (1 | IPO Suspensionm) +Xm + "m. ⇤Data fromPCRI; nominal USD value of early stage VC investment in mainland China companies. †Monthlyaverage of daily closing price for Shenzhen/Shanghai composite. ††Monthly overall China marketindex. ‡Monthly VC investment in all portfolio companies located outside of China (source:PCRI). Newey-West standard errors, with optimal lag of 4 (identified using lag order selectionstatistics via Stata’s varsoc command). *** indicates p-value<.01.
54
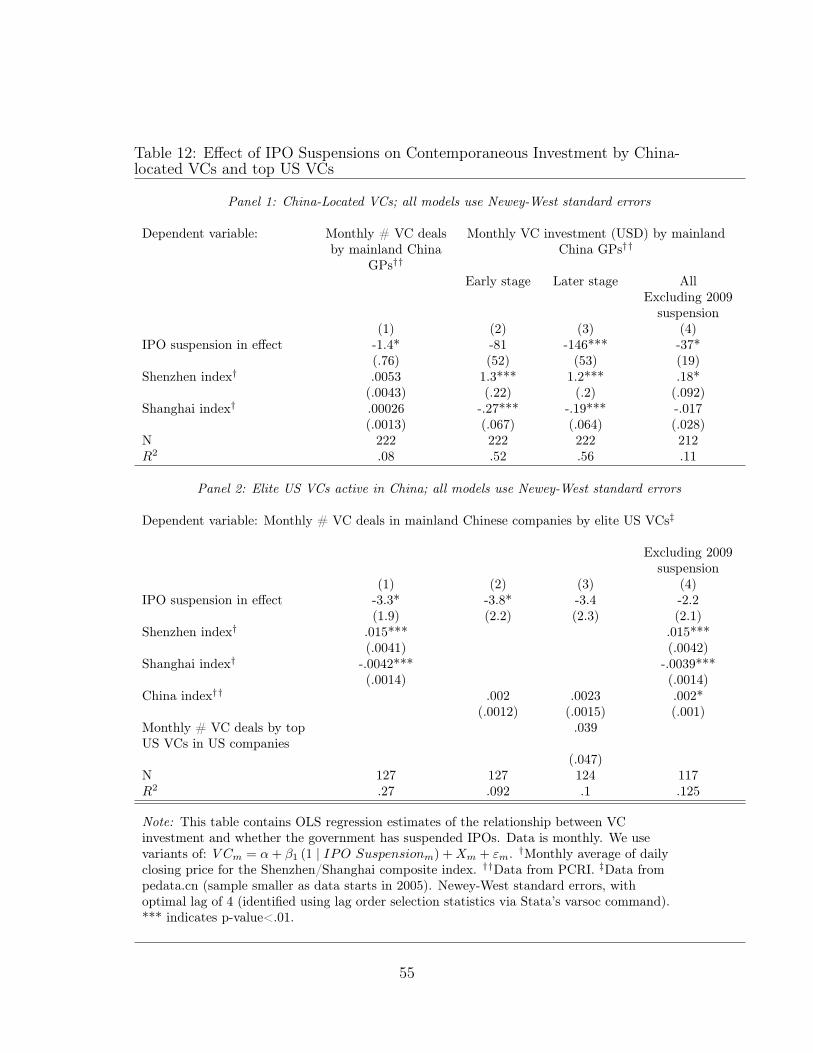
Table 12: Effect of IPO Suspensions on Contemporaneous Investment by China-located VCs and top US VCs
Panel 1: China-Located VCs; all models use Newey-West standard errors
Dependent variable: Monthly # VC dealsby mainland China
GPs††
Monthly VC investment (USD) by mainlandChina GPs††
Early stage Later stage AllExcluding 2009
suspension(1) (2) (3) (4)
IPO suspension in effect -1.4* -81 -146*** -37*(.76) (52) (53) (19)
Shenzhen index† .0053 1.3*** 1.2*** .18*(.0043) (.22) (.2) (.092)
Shanghai index† .00026 -.27*** -.19*** -.017(.0013) (.067) (.064) (.028)
N 222 222 222 212R2 .08 .52 .56 .11
Panel 2: Elite US VCs active in China; all models use Newey-West standard errors
Dependent variable: Monthly # VC deals in mainland Chinese companies by elite US VCs‡
Excluding 2009suspension
(1) (2) (3) (4)IPO suspension in effect -3.3* -3.8* -3.4 -2.2
(1.9) (2.2) (2.3) (2.1)Shenzhen index† .015*** .015***
(.0041) (.0042)Shanghai index† -.0042*** -.0039***
(.0014) (.0014)China index†† .002 .0023 .002*
(.0012) (.0015) (.001)Monthly # VC deals by topUS VCs in US companies
.039
(.047)N 127 127 124 117R2 .27 .092 .1 .125
Note: This table contains OLS regression estimates of the relationship between VCinvestment and whether the government has suspended IPOs. Data is monthly. We usevariants of: V Cm = ↵+ �1 (1 | IPO Suspensionm) +Xm + "m. †Monthly average of dailyclosing price for the Shenzhen/Shanghai composite index. ††Data from PCRI. ‡Data frompedata.cn (sample smaller as data starts in 2005). Newey-West standard errors, withoptimal lag of 4 (identified using lag order selection statistics via Stata’s varsoc command).*** indicates p-value<.01.
55
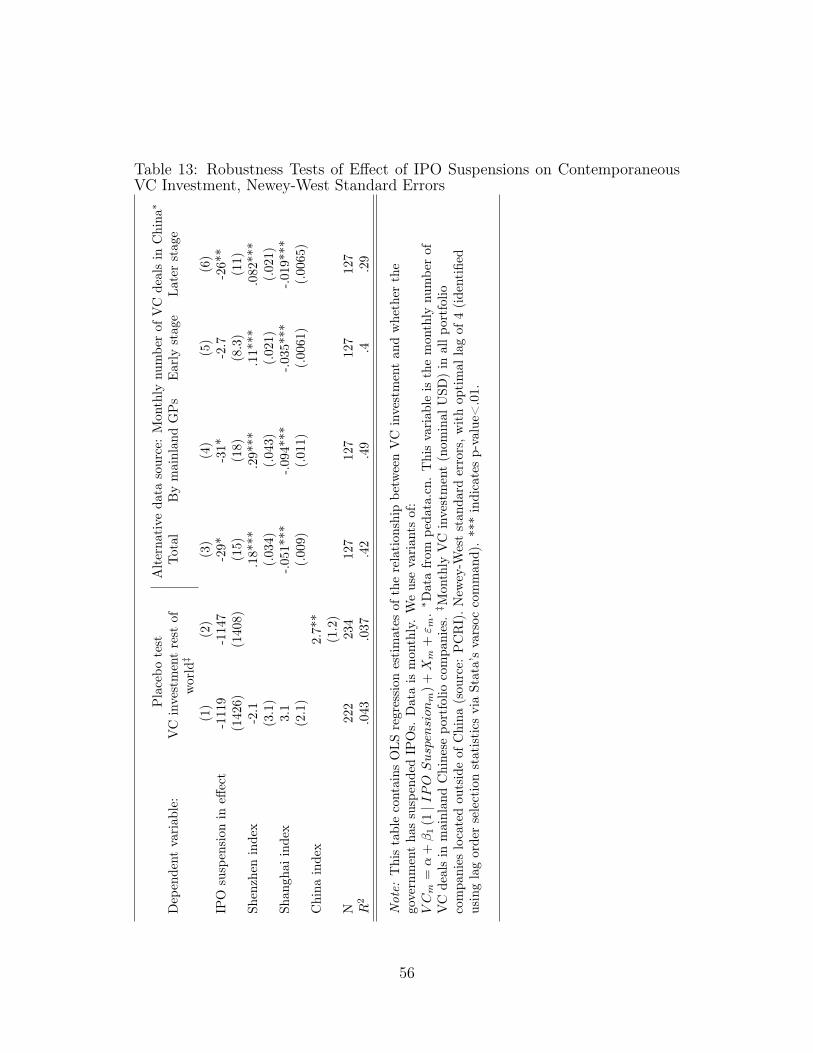
Table 13: Robustness Tests of Effect of IPO Suspensions on ContemporaneousVC Investment, Newey-West Standard Errors
Pla
cebo
test
Alt
erna
tive
data
sour
ce:
Mon
thly
num
ber
ofV
Cde
als
inC
hina
⇤
Dep
ende
ntva
riab
le:
VC
inve
stm
ent
rest
ofw
orld
‡To
tal
By
mai
nlan
dG
Ps
Ear
lyst
age
Late
rst
age
(1)
(2)
(3)
(4)
(5)
(6)
IPO
susp
ensi
onin
effec
t-1
119
-114
7-2
9*-3
1*-2
.7-2
6**
(142
6)(1
408)
(15)
(18)
(8.3
)(1
1)Sh
enzh
enin
dex
-2.1
.18*
**.2
9***
.11*
**.0
82**
*(3
.1)
(.03
4)(.
043)
(.02
1)(.
021)
Shan
ghai
inde
x3.
1-.0
51**
*-.0
94**
*-.0
35**
*-.0
19**
*(2
.1)
(.00
9)(.
011)
(.00
61)
(.00
65)
Chi
nain
dex
2.7*
*(1
.2)
N22
223
412
712
712
712
7R
2.0
43.0
37.4
2.4
9.4
.29
Not
e:T
his
tabl
eco
ntai
nsO
LSre
gres
sion
esti
mat
esof
the
rela
tion
ship
betw
een
VC
inve
stm
ent
and
whe
ther
the
gove
rnm
ent
has
susp
ende
dIP
Os.
Dat
ais
mon
thly
.W
eus
eva
rian
tsof
:VC
m=
↵+�1(1
|IPO
Suspen
sion
m)+
Xm+" m
.⇤ D
ata
from
peda
ta.c
n.T
his
vari
able
isth
em
onth
lynu
mbe
rof
VC
deal
sin
mai
nlan
dC
hine
sepo
rtfo
lioco
mpa
nies
.‡ M
onth
lyV
Cin
vest
men
t(n
omin
alU
SD)
inal
lpor
tfol
ioco
mpa
nies
loca
ted
outs
ide
ofC
hina
(sou
rce:
PC
RI)
.New
ey-W
est
stan
dard
erro
rs,w
ith
opti
mal
lag
of4
(ide
ntifi
edus
ing
lag
orde
rse
lect
ion
stat
istics
via
Stat
a’s
vars
occo
mm
and)
.**
*in
dica
tes
p-va
lue<
.01.
56
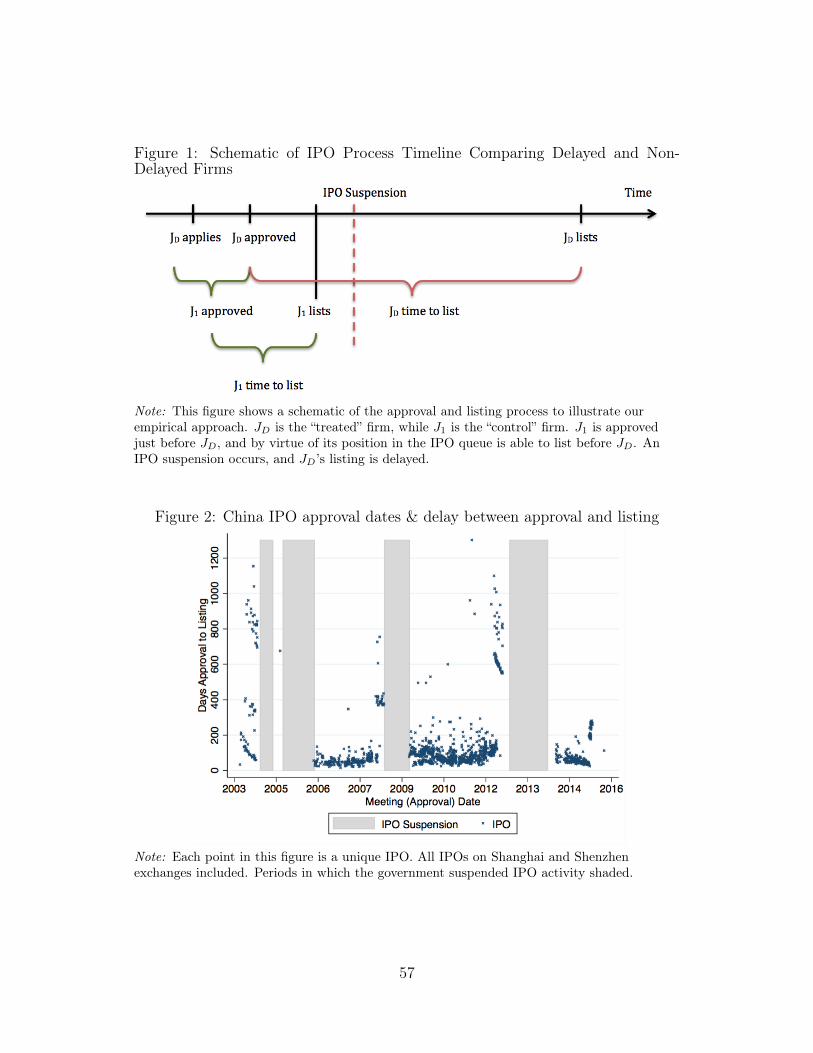
Figure 1: Schematic of IPO Process Timeline Comparing Delayed and Non-Delayed Firms
Note: This figure shows a schematic of the approval and listing process to illustrate ourempirical approach. JD is the “treated” firm, while J1 is the “control” firm. J1 is approvedjust before JD, and by virtue of its position in the IPO queue is able to list before JD. AnIPO suspension occurs, and JD’s listing is delayed.
Figure 2: China IPO approval dates & delay between approval and listing
Note: Each point in this figure is a unique IPO. All IPOs on Shanghai and Shenzhenexchanges included. Periods in which the government suspended IPO activity shaded.
57
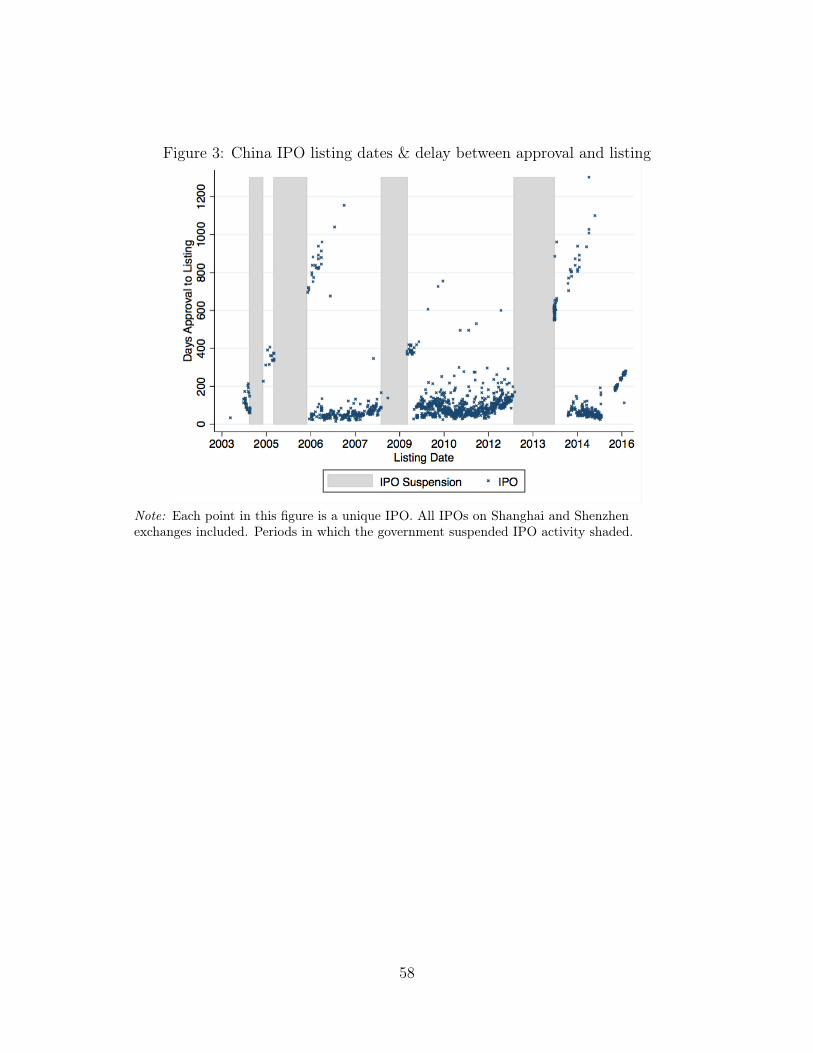
Figure 3: China IPO listing dates & delay between approval and listing
Note: Each point in this figure is a unique IPO. All IPOs on Shanghai and Shenzhenexchanges included. Periods in which the government suspended IPO activity shaded.
58
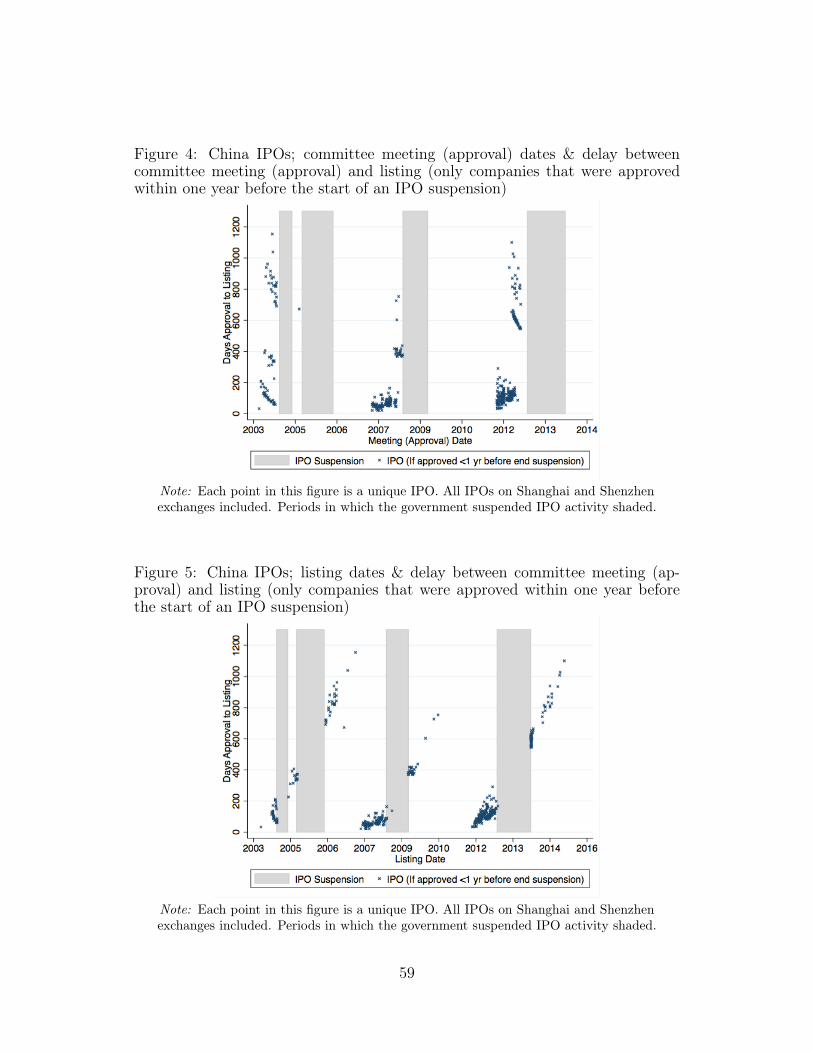
Figure 4: China IPOs; committee meeting (approval) dates & delay betweencommittee meeting (approval) and listing (only companies that were approvedwithin one year before the start of an IPO suspension)
Note: Each point in this figure is a unique IPO. All IPOs on Shanghai and Shenzhenexchanges included. Periods in which the government suspended IPO activity shaded.
Figure 5: China IPOs; listing dates & delay between committee meeting (ap-proval) and listing (only companies that were approved within one year beforethe start of an IPO suspension)
Note: Each point in this figure is a unique IPO. All IPOs on Shanghai and Shenzhenexchanges included. Periods in which the government suspended IPO activity shaded.
59
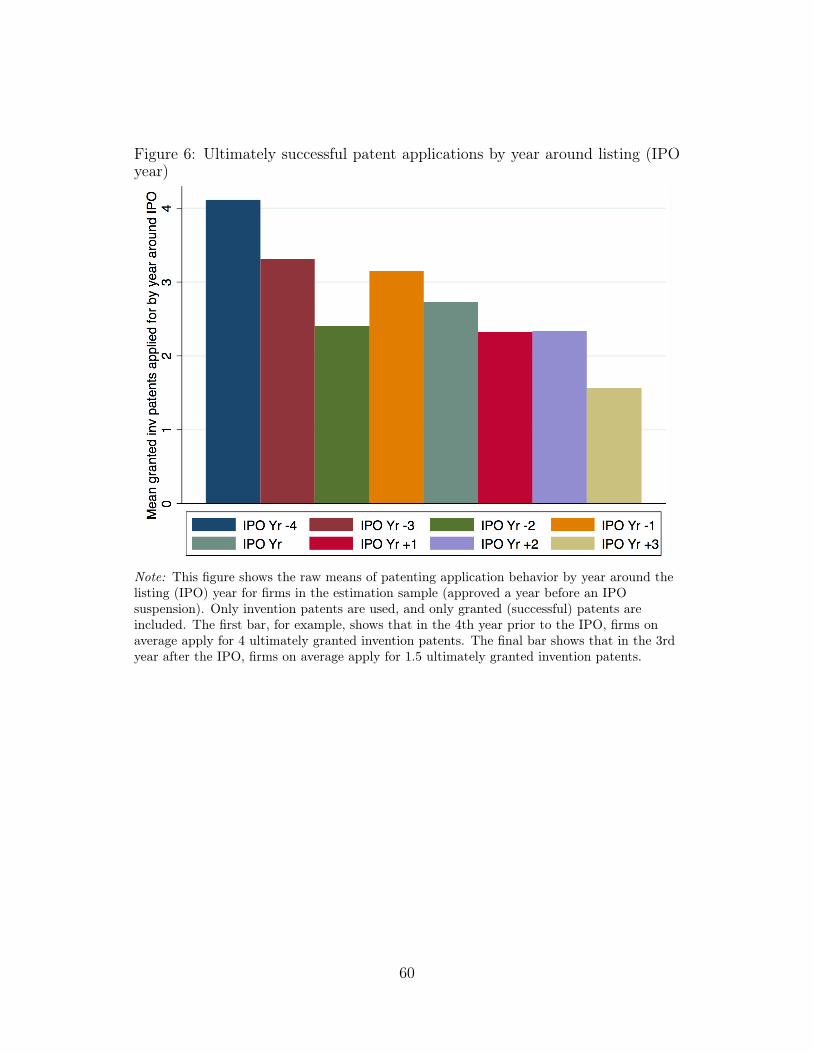
Figure 6: Ultimately successful patent applications by year around listing (IPOyear)
Note: This figure shows the raw means of patenting application behavior by year around thelisting (IPO) year for firms in the estimation sample (approved a year before an IPOsuspension). Only invention patents are used, and only granted (successful) patents areincluded. The first bar, for example, shows that in the 4th year prior to the IPO, firms onaverage apply for 4 ultimately granted invention patents. The final bar shows that in the 3rdyear after the IPO, firms on average apply for 1.5 ultimately granted invention patents.
60
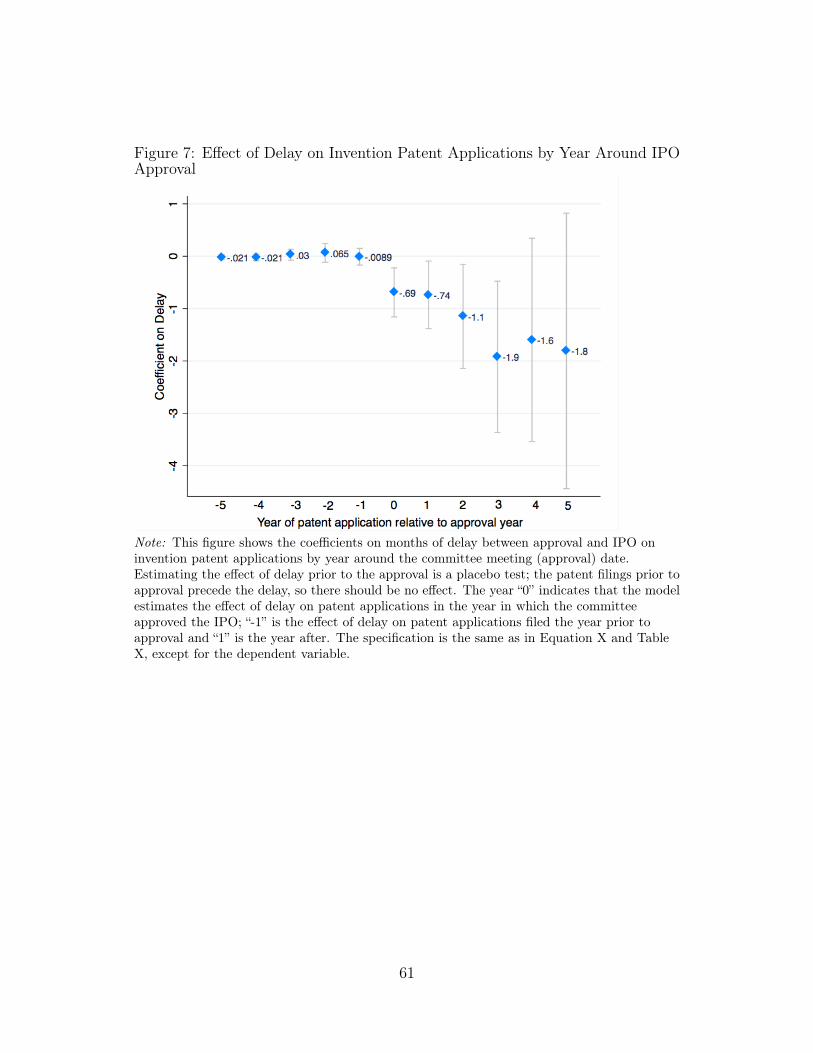
Figure 7: Effect of Delay on Invention Patent Applications by Year Around IPOApproval
Note: This figure shows the coefficients on months of delay between approval and IPO oninvention patent applications by year around the committee meeting (approval) date.Estimating the effect of delay prior to the approval is a placebo test; the patent filings prior toapproval precede the delay, so there should be no effect. The year “0” indicates that the modelestimates the effect of delay on patent applications in the year in which the committeeapproved the IPO; “-1” is the effect of delay on patent applications filed the year prior toapproval and “1” is the year after. The specification is the same as in Equation X and TableX, except for the dependent variable.
61
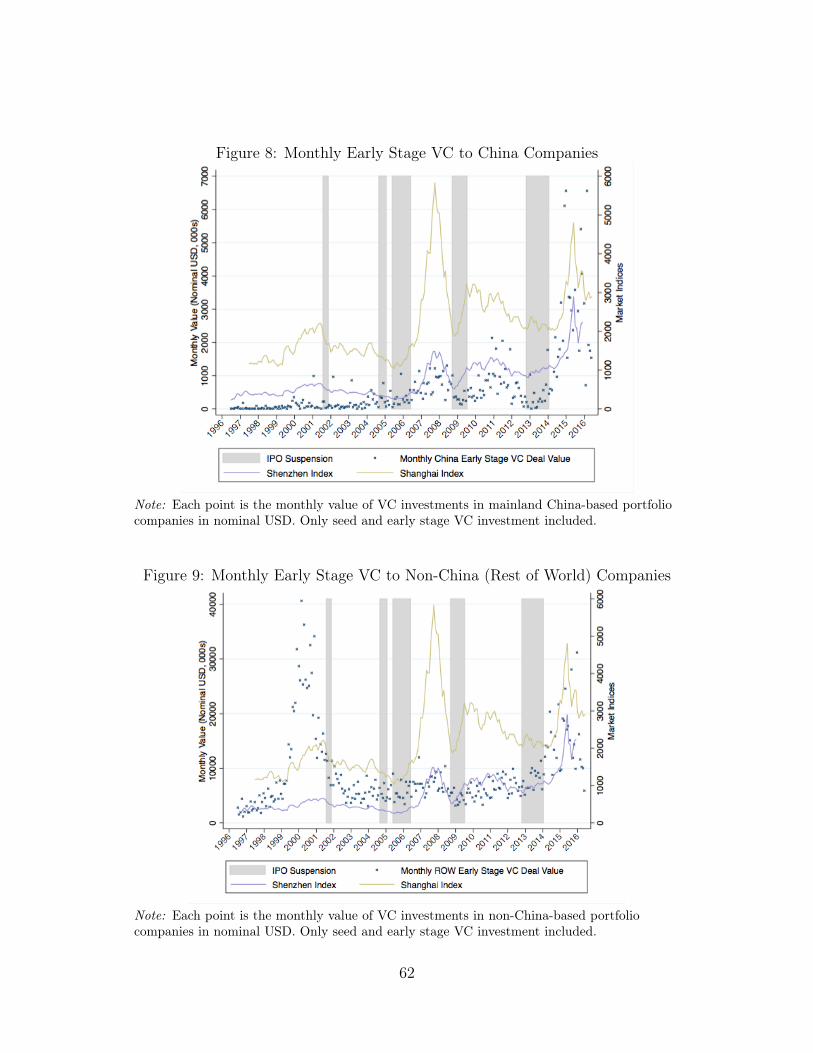
Figure 8: Monthly Early Stage VC to China Companies
Note: Each point is the monthly value of VC investments in mainland China-based portfoliocompanies in nominal USD. Only seed and early stage VC investment included.
Figure 9: Monthly Early Stage VC to Non-China (Rest of World) Companies
Note: Each point is the monthly value of VC investments in non-China-based portfoliocompanies in nominal USD. Only seed and early stage VC investment included.
62
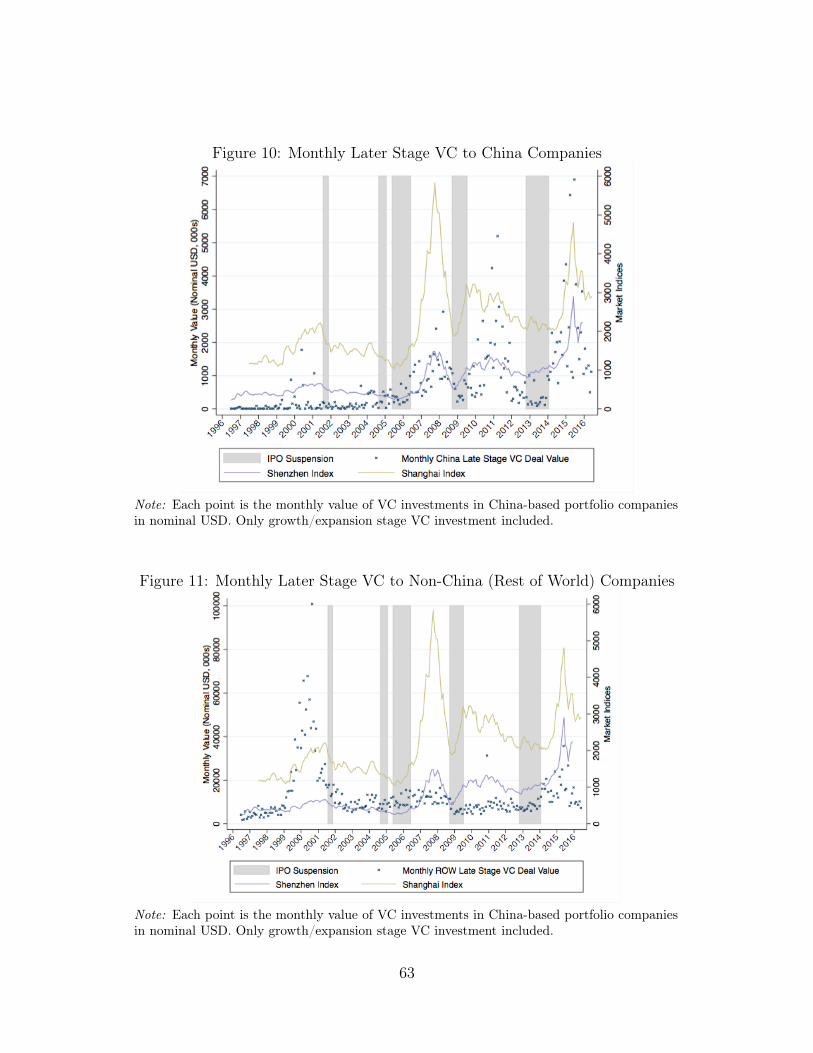
Figure 10: Monthly Later Stage VC to China Companies
Note: Each point is the monthly value of VC investments in China-based portfolio companiesin nominal USD. Only growth/expansion stage VC investment included.
Figure 11: Monthly Later Stage VC to Non-China (Rest of World) Companies
Note: Each point is the monthly value of VC investments in China-based portfolio companiesin nominal USD. Only growth/expansion stage VC investment included.
63
References
Acharya, V. & Xu, Z. (2016), ‘Financial dependence and innovation: The case of publicversus private firms’, Journal of Financial Economics .
Aggarwal, V. A. & Hsu, D. H. (2013), ‘Entrepreneurial exits and innovation’, Manage-ment Science 60(4), 867–887.
Allen, F., Qian, J., Shan, S. C. & Zhu, J. L. (2015), ‘Explaining the disconnectionbetween china’s economic growth and stock market performance’, Shanghai JiaotongUniversity Working Paper .
Asker, J., Farre-Mensa, J. & Ljungqvist, A. (2014), ‘Corporate investment and stockmarket listing: a puzzle?’, Review of Financial Studies p. hhu077.
Athey, S., Milgrom, P. & Roberts, J. (1998), ‘Robust comparative statics’, Manuscript,Department of Economics, Harvard University http://kuznets. fas. harvard. edu/˜athey/draftmonograph98. pdf .
Baker, M. & Gompers, P. A. (2003), ‘The determinants of board structure at the initialpublic offering’, Journal of Law and Economics 46(2), 569–598.
Bernstein, S. (2015), ‘Does going public affect innovation?’, The Journal of Finance70(4), 1365–1403.
Black, B. S. & Gilson, R. J. (1998), ‘Venture capital and the structure of capital markets:banks versus stock markets’, Journal of financial economics 47(3), 243–277.
Black, S. E. & Strahan, P. E. (2002), ‘Entrepreneurship and bank credit availability’,The Journal of Finance 57(6), 2807–2833.
Brown, J. R., Martinsson, G. & Petersen, B. C. (2013), ‘Law, stock markets, andinnovation’, The Journal of Finance 68(4), 1517–1549.
Bygrave, W. D. & Timmons, J. A. (1992), Venture capital at the crossroads, HarvardBusiness Press.
Cao, J. X., Ding, Y. & Zhang, H. (2016), ‘Social capital, informal governance, and post-ipo firm performance: A study of chinese entrepreneurial firms’, Journal of BusinessEthics 134(4), 529–551.
Carpenter, J. N., Lu, F. & Whitelaw, R. F. (2016), ‘The real value of china’s stockmarket’.
Chemmanur, T. J., He, S. & Nandy, D. K. (2009), ‘The going-public decision and theproduct market’, Review of Financial Studies p. hhp098.
Chen, C., Shi, H. & Xu, H. (2014), ‘The ipo underwriting market share in china: Doownership and quality matter?’, Journal of Banking & Finance 46, 177–189.
64
Chen, D., Jiang, D., Ljungqvist, A., Lu, H. & Zhou, M. (2015), ‘State capitalism vs.private enterprise’, NBER Working Paper (w20930).
Cochrane, J. H. (2005), ‘The risk and return of venture capital’, Journal of financialeconomics 75(1), 3–52.
Cong, L. W. & Ponticelli, J. (2016), ‘Credit allocation under economic stimulus: Evi-dence from china’, Working Paper .
Diamond, D. W. & Rajan, R. G. (2000), ‘A theory of bank capital’, The Journal ofFinance 55(6), 2431–2465.
Fan, J. P., Wong, T. J. & Zhang, T. (2007), ‘Politically connected ceos, corporategovernance, and post-ipo performance of china’s newly partially privatized firms’,Journal of financial economics 84(2), 330–357.
Fang, J., He, H. & Li, N. (2016), ‘China’s rising iq (innovation quotient) and growth:Firm-level evidence’, Working Paper .
Fang, L. H., Lerner, J. & Chaopeng, W. (2016), ‘Intellectual property rights protection,ownership, and innovation: Evidence from china’, Working Paper .
Gilje, E. P. & Taillard, J. P. (2016), ‘Do private firms invest differently than public firms?taking cues from the natural gas industry’, The Journal of Finance 71(4), 1733–1778.
Gompers, P. A. & Lerner, J. (2004), The venture capital cycle, MIT press.
Gompers, P., Kovner, A., Lerner, J. & Scharfstein, D. (2008), ‘Venture capital in-vestment cycles: The impact of public markets’, Journal of Financial Economics87(1), 1–23.
Gorman, M. & Sahlman, W. A. (1989), ‘What do venture capitalists do?’, Journal ofbusiness venturing 4(4), 231–248.
Guo, D. & Jiang, K. (2013), ‘Venture capital investment and the performance of en-trepreneurial firms: Evidence from china’, Journal of Corporate Finance 22, 375–395.
Hall, B. H. & Lerner, J. (2010), ‘The financing of r&d and innovation’, Handbook of theEconomics of Innovation 1, 609–639.
Hellmann, T. & Puri, M. (2002), ‘Venture capital and the professionalization of start-upfirms: Empirical evidence’, The journal of finance 57(1), 169–197.
Hochberg, Y. V. (2012), ‘Venture capital and corporate governance in the newly publicfirm’, Review of Finance 16(2), 429–480.
Hsieh, C.-T. & Klenow, P. J. (2009), ‘Misallocation and manufacturing tfp in china andindia’, The Quarterly journal of economics 124(4), 1403–1448.
65
Hsieh, C.-T. & Song, Z. M. (2015), ‘Grasp the large, let go of the small: The transfor-mation of the state sector in china’, Brookings Papers on Economic Activity .
Insights, K. (2016), ‘The pulse of fintech, q2 2016: Global analysis of fintech venturefunding’.
Kaplan, S. N. & Minton, B. A. (1994), ‘Appointments of outsiders to japaneseboards: Determinants and implications for managers’, Journal of Financial Eco-nomics 36(2), 225–258.
Kaplan, S. N. & Schoar, A. (2005), ‘Private equity performance: Returns, persistence,and capital flows’, The Journal of Finance 60(4), 1791–1823.
Kaplan, S. N., Sensoy, B. A. & Strömberg, P. (2009), ‘Should investors bet on the jockeyor the horse? evidence from the evolution of firms from early business plans to publiccompanies’, The Journal of Finance 64(1), 75–115.
Kaplan, S. N. & Strömberg, P. (2003), ‘Financial contracting theory meets the realworld: An empirical analysis of venture capital contracts’, The Review of EconomicStudies 70(2), 281–315.
Kerr, W. R. & Nanda, R. (2009), ‘Democratizing entry: Banking deregulations, financ-ing constraints, and entrepreneurship’, Journal of Financial Economics 94(1), 124–149.
Milgrom, P. & Shannon, C. (1994), ‘Monotone comparative statics’, Econometrica:Journal of the Econometric Society pp. 157–180.
Pagano, M., Panetta, F. & Zingales, L. (1998), ‘Why do companies go public? anempirical analysis’, The Journal of Finance 53(1), 27–64.
Piotroski, J. D. & Zhang, T. (2014), ‘Politicians and the ipo decision: The impactof impending political promotions on ipo activity in china’, Journal of FinancialEconomics 111(1), 111–136.
Rajan, R. G. (2012), ‘Presidential address: The corporation in finance’, The Journal ofFinance 67(4), 1173–1217.
Sahlman, W. A. (1990), ‘The structure and governance of venture-capital organizations’,Journal of financial economics 27(2), 473–521.
Shleifer, A. & Vishny, R. W. (1997), ‘A survey of corporate governance’, The journalof finance 52(2), 737–783.
Sun, Y. (2017), ‘The causal effect of ipo on firms’ investment’.
Wei, S.-J., Xie, Z. & Zhang, X. (2016), From “made in china” to “innovated in china”:Necessity, prospect, and challenges, Technical report, National Bureau of EconomicResearch.
66
Whited, T. M. & Zhao, J. (2016), ‘Capital structure misallocation’, Working Paper .
Wong, T. et al. (2014), ‘Corporate governance research on listed firms in china: In-stitutions, governance and accountability’, Foundations and Trends in Accounting9(4), 259–326.
Xie, Z. & Zhang, X. (2015), ‘The patterns of patents in china’, China Economic Journal8(2), 122–142.
Yang, Z. (2013), ‘Do political connections add value to audit firms? evidence from ipoaudits in china’, Contemporary Accounting Research 30(3), 891–921.
Zhou, Y., Lazonick, W. & Sun, Y. (2016), China as an Innovation Nation, OxfordUniversity Press.
Zingales, L. (2000), ‘In search of new foundations’, The journal of Finance 55(4), 1623–1653.
67
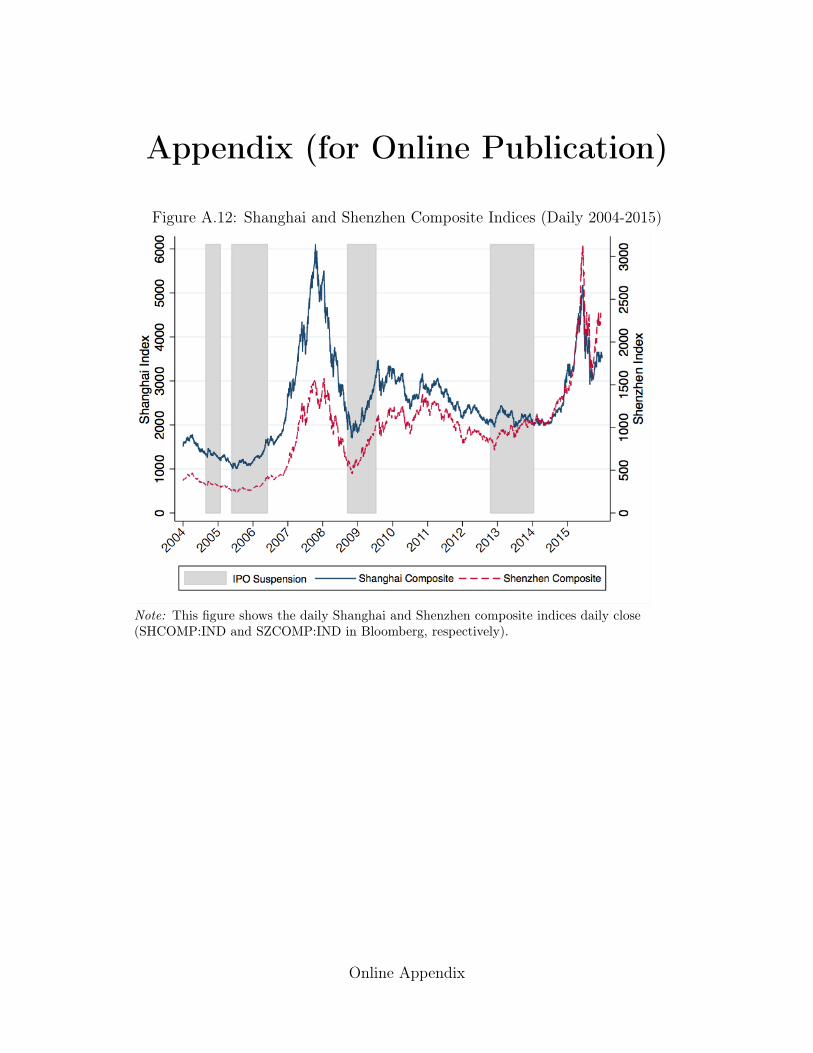
Appendix (for Online Publication)
Figure A.12: Shanghai and Shenzhen Composite Indices (Daily 2004-2015)
Note: This figure shows the daily Shanghai and Shenzhen composite indices daily close(SHCOMP:IND and SZCOMP:IND in Bloomberg, respectively).
Online Appendix
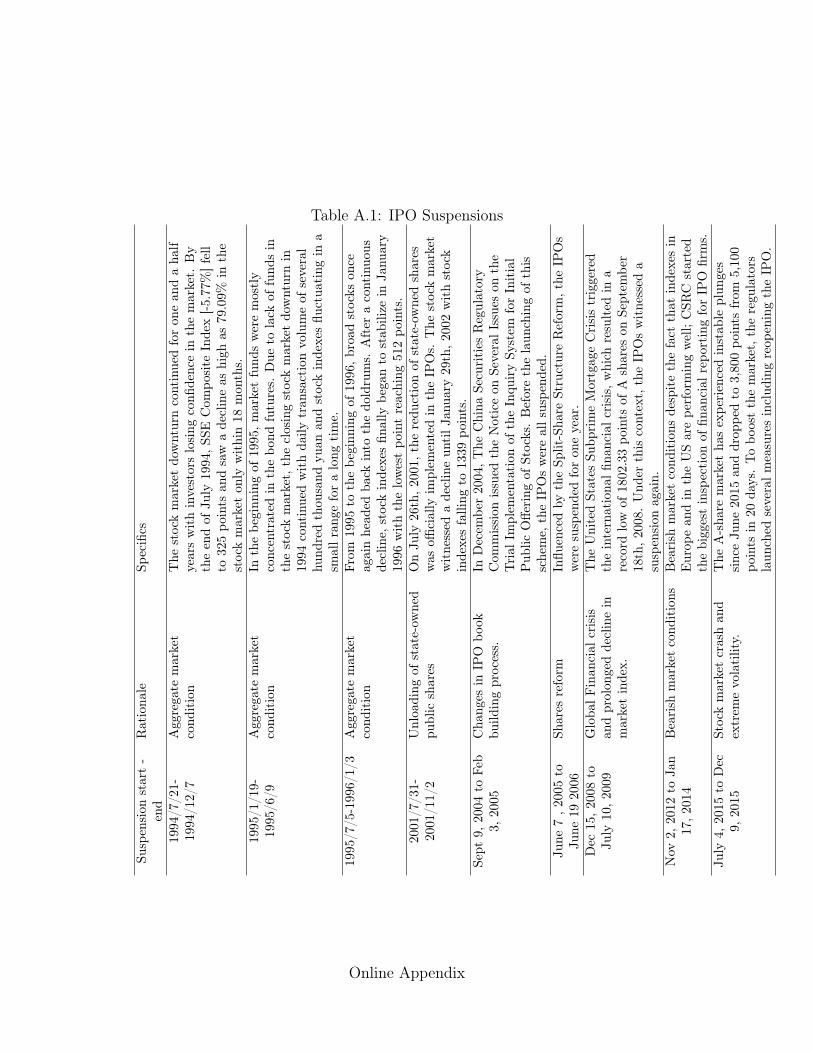
Table A.1: IPO Suspensions
Susp
ensi
onst
art
-en
dR
atio
nale
Spec
ifics
1994
/7/2
1-19
94/1
2/7
Agg
rega
tem
arke
tco
nditio
nT
hest
ock
mar
ket
dow
ntur
nco
ntin
ued
for
one
and
aha
lfye
ars
wit
hin
vest
ors
losi
ngco
nfide
nce
inth
em
arke
t.B
yth
een
dof
July
1994
,SSE
Com
posi
teIn
dex
[-5.7
7%]f
ell
to32
5po
ints
and
saw
ade
clin
eas
high
as79
.09%
inth
est
ock
mar
ket
only
wit
hin
18m
onth
s.19
95/1
/19-
1995
/6/9
Agg
rega
tem
arke
tco
nditio
nIn
the
begi
nnin
gof
1995
,mar
ket
fund
sw
ere
mos
tly
conc
entr
ated
inth
ebo
ndfu
ture
s.D
ueto
lack
offu
nds
inth
est
ock
mar
ket,
the
clos
ing
stoc
km
arke
tdo
wnt
urn
in19
94co
ntin
ued
wit
hda
ilytr
ansa
ctio
nvo
lum
eof
seve
ral
hund
red
thou
sand
yuan
and
stoc
kin
dexe
sflu
ctua
ting
ina
smal
lran
gefo
ra
long
tim
e.19
95/7
/5-1
996/
1/3
Agg
rega
tem
arke
tco
nditio
nFr
om19
95to
the
begi
nnin
gof
1996
,bro
adst
ocks
once
agai
nhe
aded
back
into
the
dold
rum
s.A
fter
aco
ntin
uous
decl
ine,
stoc
kin
dexe
sfin
ally
bega
nto
stab
ilize
inJa
nuar
y19
96w
ith
the
low
est
poin
tre
achi
ng51
2po
ints
.20
01/7
/31-
2001
/11/
2U
nloa
ding
ofst
ate-
owne
dpu
blic
shar
esO
nJu
ly26
th,2
001,
the
redu
ctio
nof
stat
e-ow
ned
shar
esw
asoffi
cial
lyim
plem
ente
din
the
IPO
s.T
hest
ock
mar
ket
wit
ness
eda
decl
ine
unti
lJan
uary
29th
,200
2w
ith
stoc
kin
dexe
sfa
lling
to13
39po
ints
.Se
pt9,
2004
toFe
b3,
2005
Cha
nges
inIP
Obo
okbu
ildin
gpr
oces
s.In
Dec
embe
r20
04,T
heC
hina
Secu
riti
esR
egul
ator
yC
omm
issi
onis
sued
the
Not
ice
onSe
vera
lIss
ues
onth
eTr
ialI
mpl
emen
tati
onof
the
Inqu
iry
Syst
emfo
rIn
itia
lP
ublic
Offe
ring
ofSt
ocks
.B
efor
eth
ela
unch
ing
ofth
issc
hem
e,th
eIP
Os
wer
eal
lsus
pend
ed.
June
7,2
005
toJu
ne19
2006
Shar
esre
form
Influ
ence
dby
the
Split
-Sha
reSt
ruct
ure
Ref
orm
,the
IPO
sw
ere
susp
ende
dfo
ron
eye
ar.
Dec
15,2
008
toJu
ly10
,200
9G
loba
lFin
anci
alcr
isis
and
prol
onge
dde
clin
ein
mar
ket
inde
x.
The
Uni
ted
Stat
esSu
bpri
me
Mor
tgag
eC
risi
str
igge
red
the
inte
rnat
iona
lfina
ncia
lcri
sis,
whi
chre
sult
edin
are
cord
low
of18
02.3
3po
ints
ofA
shar
eson
Sept
embe
r18
th,2
008.
Und
erth
isco
ntex
t,th
eIP
Os
wit
ness
eda
susp
ensi
onag
ain.
Nov
2,20
12to
Jan
17,2
014
Bea
rish
mar
ket
cond
itio
nsB
eari
shm
arke
tco
ndit
ions
desp
ite
the
fact
that
inde
xes
inE
urop
ean
din
the
US
are
perf
orm
ing
wel
l;C
SRC
star
ted
the
bigg
est
insp
ecti
onof
finan
cial
repo
rtin
gfo
rIP
Ofir
ms.
July
4,20
15to
Dec
9,20
15St
ock
mar
ket
cras
han
dex
trem
evo
latilit
y.T
heA
-sha
rem
arke
tha
sex
peri
ence
din
stab
lepl
unge
ssi
nce
June
2015
and
drop
ped
to3,
800
poin
tsfr
om5,
100
poin
tsin
20da
ys.
Tobo
ost
the
mar
ket,
the
regu
lato
rsla
unch
edse
vera
lmea
sure
sin
clud
ing
reop
enin
gth
eIP
O.
Online Appendix
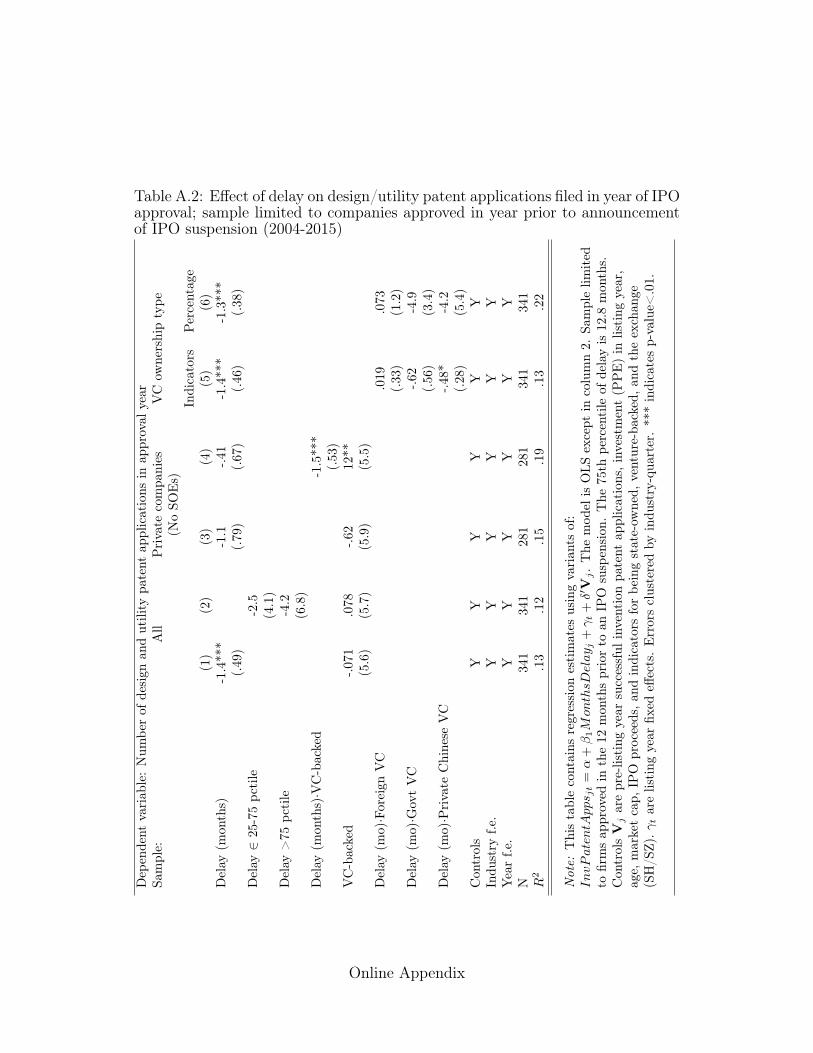
Table A.2: Effect of delay on design/utility patent applications filed in year of IPOapproval; sample limited to companies approved in year prior to announcementof IPO suspension (2004-2015)
Dep
ende
ntva
riab
le:
Num
ber
ofde
sign
and
utili
typa
tent
appl
icat
ions
inap
prov
alye
arSa
mpl
e:A
llP
riva
teco
mpa
nies
(No
SOE
s)V
Cow
ners
hip
type
Indi
cato
rsPe
rcen
tage
(1)
(2)
(3)
(4)
(5)
(6)
Del
ay(m
onth
s)-1
.4**
*-1
.1-.4
1-1
.4**
*-1
.3**
*(.
49)
(.79
)(.
67)
(.46
)(.
38)
Del
ay2
25-7
5pc
tile
-2.5
(4.1
)D
elay
>75
pcti
le-4
.2(6
.8)
Del
ay(m
onth
s)·V
C-b
acke
d-1
.5**
*(.
53)
VC
-bac
ked
-.071
.078
-.62
12**
(5.6
)(5
.7)
(5.9
)(5
.5)
Del
ay(m
o)·F
orei
gnV
C.0
19.0
73(.
33)
(1.2
)D
elay
(mo)·G
ovt
VC
-.62
-4.9
(.56
)(3
.4)
Del
ay(m
o)·P
riva
teC
hine
seV
C-.4
8*-4
.2(.
28)
(5.4
)C
ontr
ols
YY
YY
YY
Indu
stry
f.e.
YY
YY
YY
Yea
rf.e
.Y
YY
YY
YN
341
341
281
281
341
341
R2
.13
.12
.15
.19
.13
.22
Not
e:T
his
tabl
eco
ntai
nsre
gres
sion
esti
mat
esus
ing
vari
ants
of:
InvP
aten
tApp
s jt=
↵+�1M
onthsD
elay
j+� t
+�0V
j.
The
mod
elis
OLS
exce
ptin
colu
mn
2.Sa
mpl
elim
ited
tofir
ms
appr
oved
inth
e12
mon
ths
prio
rto
anIP
Osu
spen
sion
.T
he75
thpe
rcen
tile
ofde
lay
is12
.8m
onth
s.C
ontr
olsV
jar
epr
e-lis
ting
year
succ
essf
ulin
vent
ion
pate
ntap
plic
atio
ns,i
nves
tmen
t(P
PE
)in
listi
ngye
ar,
age,
mar
ket
cap,
IPO
proc
eeds
,and
indi
cato
rsfo
rbe
ing
stat
e-ow
ned,
vent
ure-
back
ed,a
ndth
eex
chan
ge(S
H/S
Z).�
tar
elis
ting
year
fixed
effec
ts.
Err
ors
clus
tere
dby
indu
stry
-qua
rter
.**
*in
dica
tes
p-va
lue<
.01.
Online Appendix
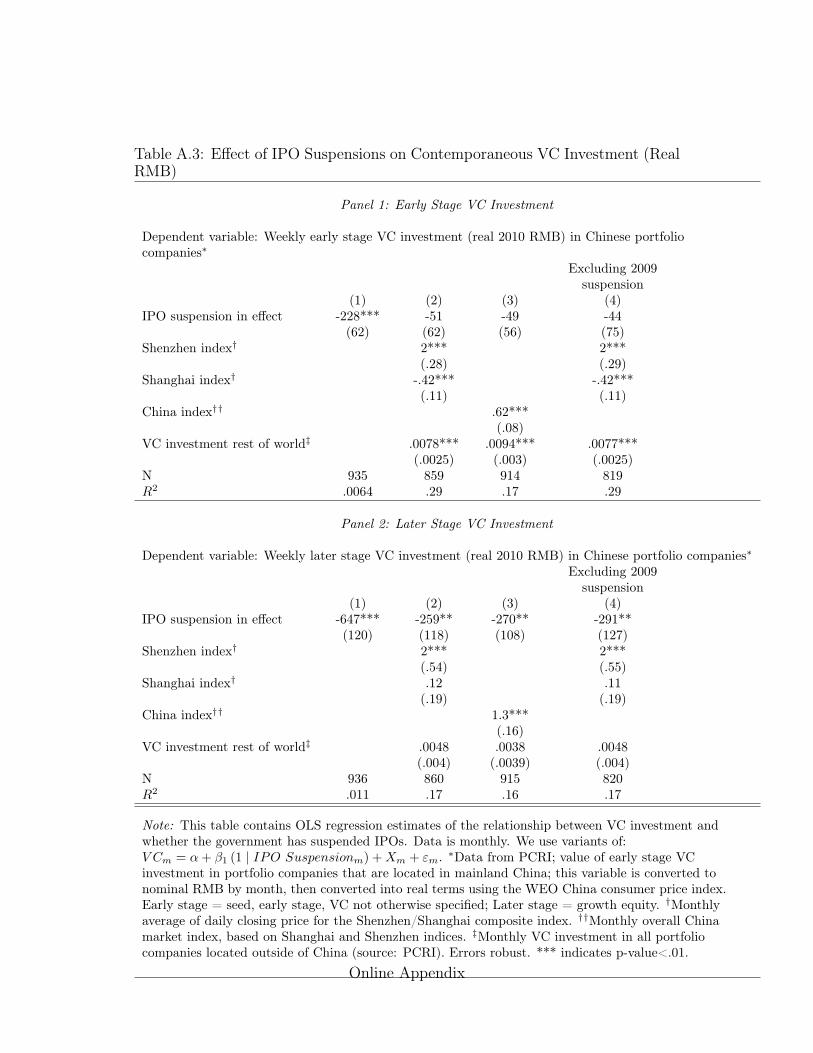
Table A.3: Effect of IPO Suspensions on Contemporaneous VC Investment (RealRMB)
Panel 1: Early Stage VC Investment
Dependent variable: Weekly early stage VC investment (real 2010 RMB) in Chinese portfoliocompanies⇤
Excluding 2009suspension
(1) (2) (3) (4)IPO suspension in effect -228*** -51 -49 -44
(62) (62) (56) (75)Shenzhen index† 2*** 2***
(.28) (.29)Shanghai index† -.42*** -.42***
(.11) (.11)China index†† .62***
(.08)VC investment rest of world‡ .0078*** .0094*** .0077***
(.0025) (.003) (.0025)N 935 859 914 819R2 .0064 .29 .17 .29
Panel 2: Later Stage VC Investment
Dependent variable: Weekly later stage VC investment (real 2010 RMB) in Chinese portfolio companies⇤Excluding 2009
suspension(1) (2) (3) (4)
IPO suspension in effect -647*** -259** -270** -291**(120) (118) (108) (127)
Shenzhen index† 2*** 2***(.54) (.55)
Shanghai index† .12 .11(.19) (.19)
China index†† 1.3***(.16)
VC investment rest of world‡ .0048 .0038 .0048(.004) (.0039) (.004)
N 936 860 915 820R2 .011 .17 .16 .17
Note: This table contains OLS regression estimates of the relationship between VC investment andwhether the government has suspended IPOs. Data is monthly. We use variants of:V Cm = ↵+ �1 (1 | IPO Suspensionm) +Xm + "m. ⇤Data from PCRI; value of early stage VCinvestment in portfolio companies that are located in mainland China; this variable is converted tonominal RMB by month, then converted into real terms using the WEO China consumer price index.Early stage = seed, early stage, VC not otherwise specified; Later stage = growth equity. †Monthlyaverage of daily closing price for the Shenzhen/Shanghai composite index. ††Monthly overall Chinamarket index, based on Shanghai and Shenzhen indices. ‡Monthly VC investment in all portfoliocompanies located outside of China (source: PCRI). Errors robust. *** indicates p-value<.01.
Online Appendix
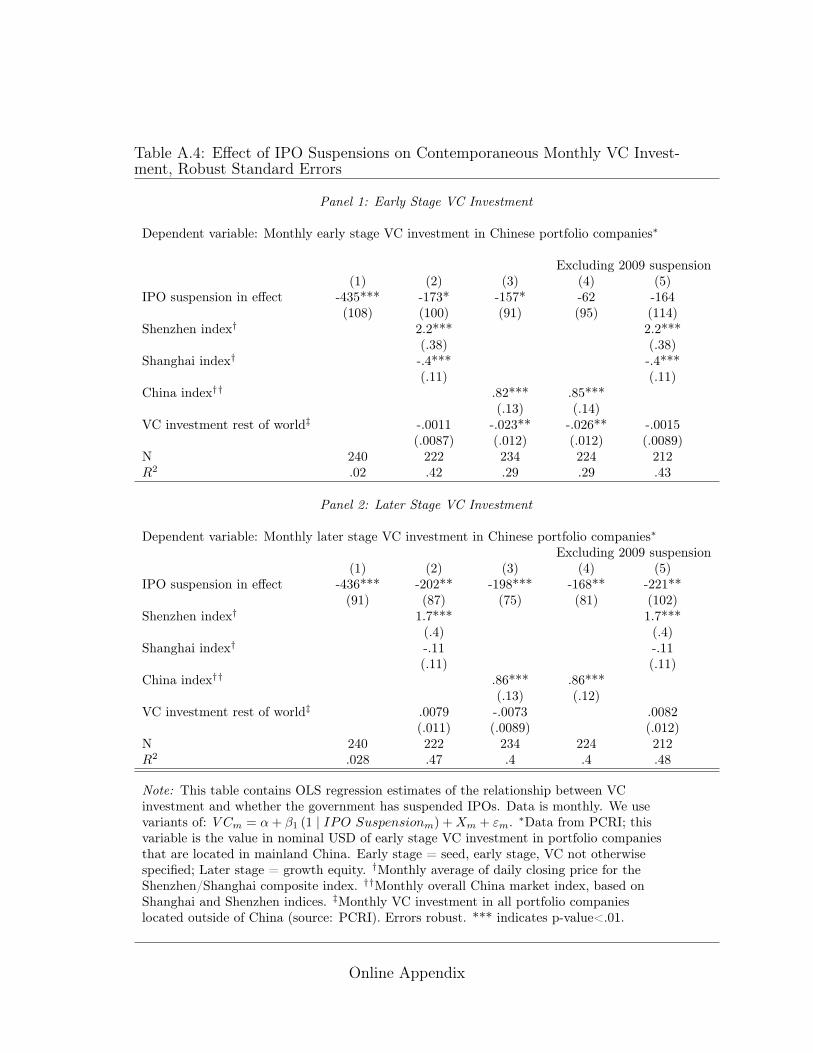
Table A.4: Effect of IPO Suspensions on Contemporaneous Monthly VC Invest-ment, Robust Standard Errors
Panel 1: Early Stage VC Investment
Dependent variable: Monthly early stage VC investment in Chinese portfolio companies⇤
Excluding 2009 suspension(1) (2) (3) (4) (5)
IPO suspension in effect -435*** -173* -157* -62 -164(108) (100) (91) (95) (114)
Shenzhen index† 2.2*** 2.2***(.38) (.38)
Shanghai index† -.4*** -.4***(.11) (.11)
China index†† .82*** .85***(.13) (.14)
VC investment rest of world‡ -.0011 -.023** -.026** -.0015(.0087) (.012) (.012) (.0089)
N 240 222 234 224 212R2 .02 .42 .29 .29 .43
Panel 2: Later Stage VC Investment
Dependent variable: Monthly later stage VC investment in Chinese portfolio companies⇤Excluding 2009 suspension
(1) (2) (3) (4) (5)IPO suspension in effect -436*** -202** -198*** -168** -221**
(91) (87) (75) (81) (102)Shenzhen index† 1.7*** 1.7***
(.4) (.4)Shanghai index† -.11 -.11
(.11) (.11)China index†† .86*** .86***
(.13) (.12)VC investment rest of world‡ .0079 -.0073 .0082
(.011) (.0089) (.012)N 240 222 234 224 212R2 .028 .47 .4 .4 .48
Note: This table contains OLS regression estimates of the relationship between VCinvestment and whether the government has suspended IPOs. Data is monthly. We usevariants of: V Cm = ↵+ �1 (1 | IPO Suspensionm) +Xm + "m. ⇤Data from PCRI; thisvariable is the value in nominal USD of early stage VC investment in portfolio companiesthat are located in mainland China. Early stage = seed, early stage, VC not otherwisespecified; Later stage = growth equity. †Monthly average of daily closing price for theShenzhen/Shanghai composite index. ††Monthly overall China market index, based onShanghai and Shenzhen indices. ‡Monthly VC investment in all portfolio companieslocated outside of China (source: PCRI). Errors robust. *** indicates p-value<.01.
Online Appendix
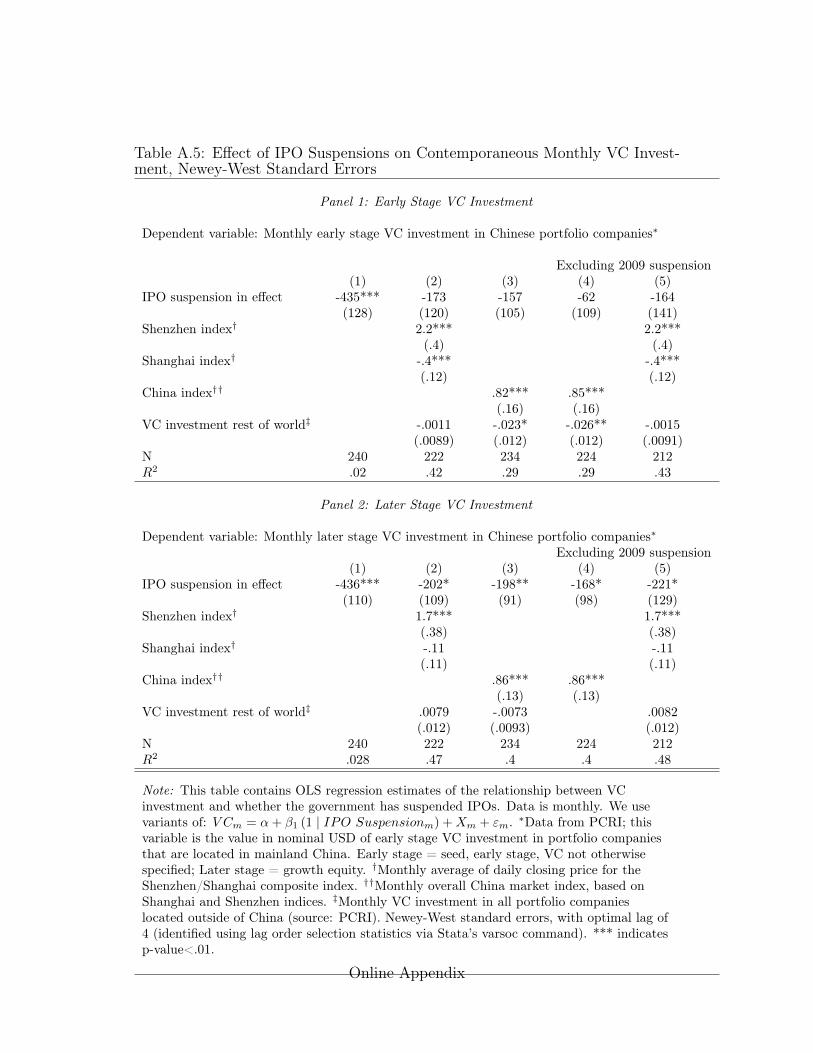
Table A.5: Effect of IPO Suspensions on Contemporaneous Monthly VC Invest-ment, Newey-West Standard Errors
Panel 1: Early Stage VC Investment
Dependent variable: Monthly early stage VC investment in Chinese portfolio companies⇤
Excluding 2009 suspension(1) (2) (3) (4) (5)
IPO suspension in effect -435*** -173 -157 -62 -164(128) (120) (105) (109) (141)
Shenzhen index† 2.2*** 2.2***(.4) (.4)
Shanghai index† -.4*** -.4***(.12) (.12)
China index†† .82*** .85***(.16) (.16)
VC investment rest of world‡ -.0011 -.023* -.026** -.0015(.0089) (.012) (.012) (.0091)
N 240 222 234 224 212R2 .02 .42 .29 .29 .43
Panel 2: Later Stage VC Investment
Dependent variable: Monthly later stage VC investment in Chinese portfolio companies⇤Excluding 2009 suspension
(1) (2) (3) (4) (5)IPO suspension in effect -436*** -202* -198** -168* -221*
(110) (109) (91) (98) (129)Shenzhen index† 1.7*** 1.7***
(.38) (.38)Shanghai index† -.11 -.11
(.11) (.11)China index†† .86*** .86***
(.13) (.13)VC investment rest of world‡ .0079 -.0073 .0082
(.012) (.0093) (.012)N 240 222 234 224 212R2 .028 .47 .4 .4 .48
Note: This table contains OLS regression estimates of the relationship between VCinvestment and whether the government has suspended IPOs. Data is monthly. We usevariants of: V Cm = ↵+ �1 (1 | IPO Suspensionm) +Xm + "m. ⇤Data from PCRI; thisvariable is the value in nominal USD of early stage VC investment in portfolio companiesthat are located in mainland China. Early stage = seed, early stage, VC not otherwisespecified; Later stage = growth equity. †Monthly average of daily closing price for theShenzhen/Shanghai composite index. ††Monthly overall China market index, based onShanghai and Shenzhen indices. ‡Monthly VC investment in all portfolio companieslocated outside of China (source: PCRI). Newey-West standard errors, with optimal lag of4 (identified using lag order selection statistics via Stata’s varsoc command). *** indicatesp-value<.01.
Online Appendix
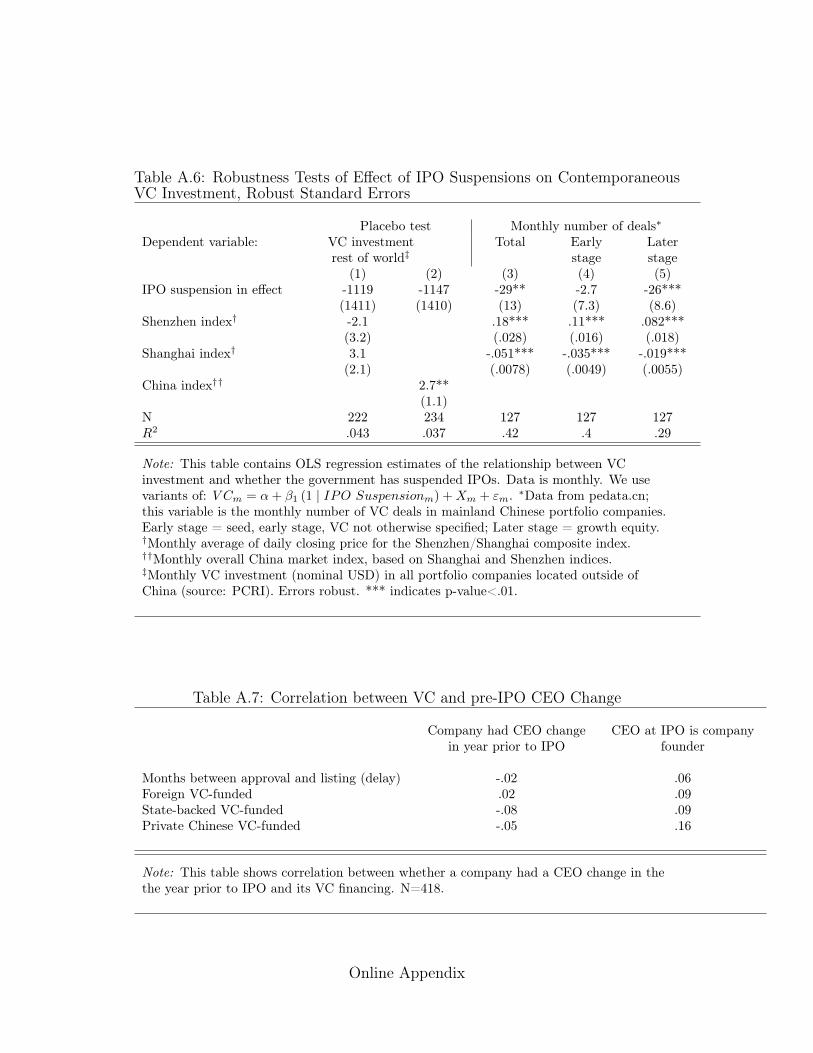
Table A.6: Robustness Tests of Effect of IPO Suspensions on ContemporaneousVC Investment, Robust Standard Errors
Placebo test Monthly number of deals⇤Dependent variable: VC investment
rest of world‡Total Early
stageLaterstage
(1) (2) (3) (4) (5)IPO suspension in effect -1119 -1147 -29** -2.7 -26***
(1411) (1410) (13) (7.3) (8.6)Shenzhen index† -2.1 .18*** .11*** .082***
(3.2) (.028) (.016) (.018)Shanghai index† 3.1 -.051*** -.035*** -.019***
(2.1) (.0078) (.0049) (.0055)China index†† 2.7**
(1.1)N 222 234 127 127 127R2 .043 .037 .42 .4 .29
Note: This table contains OLS regression estimates of the relationship between VCinvestment and whether the government has suspended IPOs. Data is monthly. We usevariants of: V Cm = ↵+ �1 (1 | IPO Suspensionm) +Xm + "m. ⇤Data from pedata.cn;this variable is the monthly number of VC deals in mainland Chinese portfolio companies.Early stage = seed, early stage, VC not otherwise specified; Later stage = growth equity.†Monthly average of daily closing price for the Shenzhen/Shanghai composite index.††Monthly overall China market index, based on Shanghai and Shenzhen indices.‡Monthly VC investment (nominal USD) in all portfolio companies located outside ofChina (source: PCRI). Errors robust. *** indicates p-value<.01.
Table A.7: Correlation between VC and pre-IPO CEO Change
Company had CEO changein year prior to IPO
CEO at IPO is companyfounder
Months between approval and listing (delay) -.02 .06Foreign VC-funded .02 .09State-backed VC-funded -.08 .09Private Chinese VC-funded -.05 .16
Note: This table shows correlation between whether a company had a CEO change in thethe year prior to IPO and its VC financing. N=418.
Online Appendix
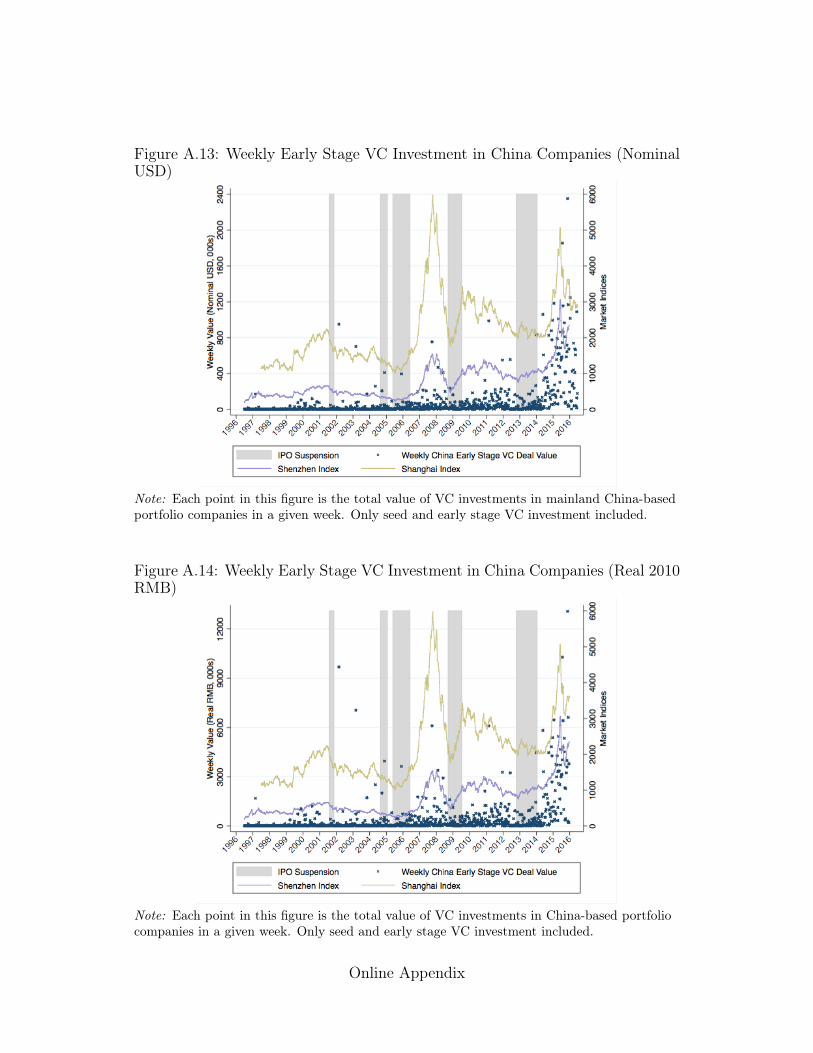
Figure A.13: Weekly Early Stage VC Investment in China Companies (NominalUSD)
Note: Each point in this figure is the total value of VC investments in mainland China-basedportfolio companies in a given week. Only seed and early stage VC investment included.
Figure A.14: Weekly Early Stage VC Investment in China Companies (Real 2010RMB)
Note: Each point in this figure is the total value of VC investments in China-based portfoliocompanies in a given week. Only seed and early stage VC investment included.
Online Appendix
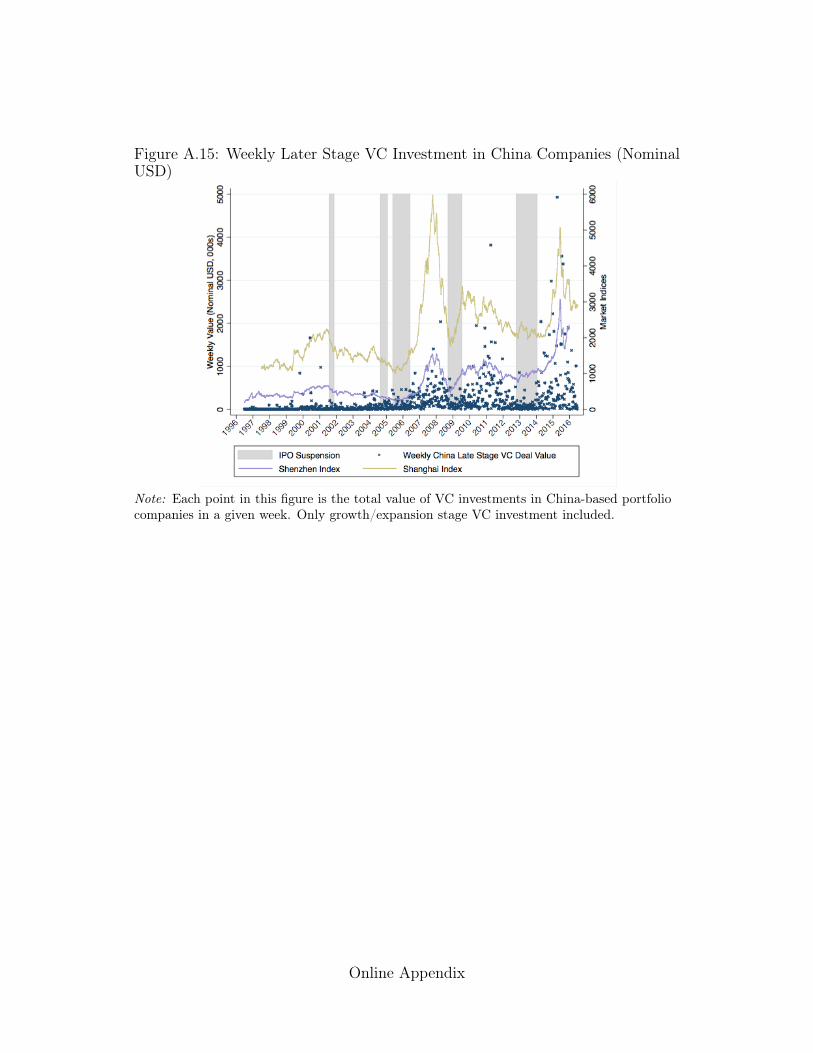
Figure A.15: Weekly Later Stage VC Investment in China Companies (NominalUSD)
Note: Each point in this figure is the total value of VC investments in China-based portfoliocompanies in a given week. Only growth/expansion stage VC investment included.
Online Appendix
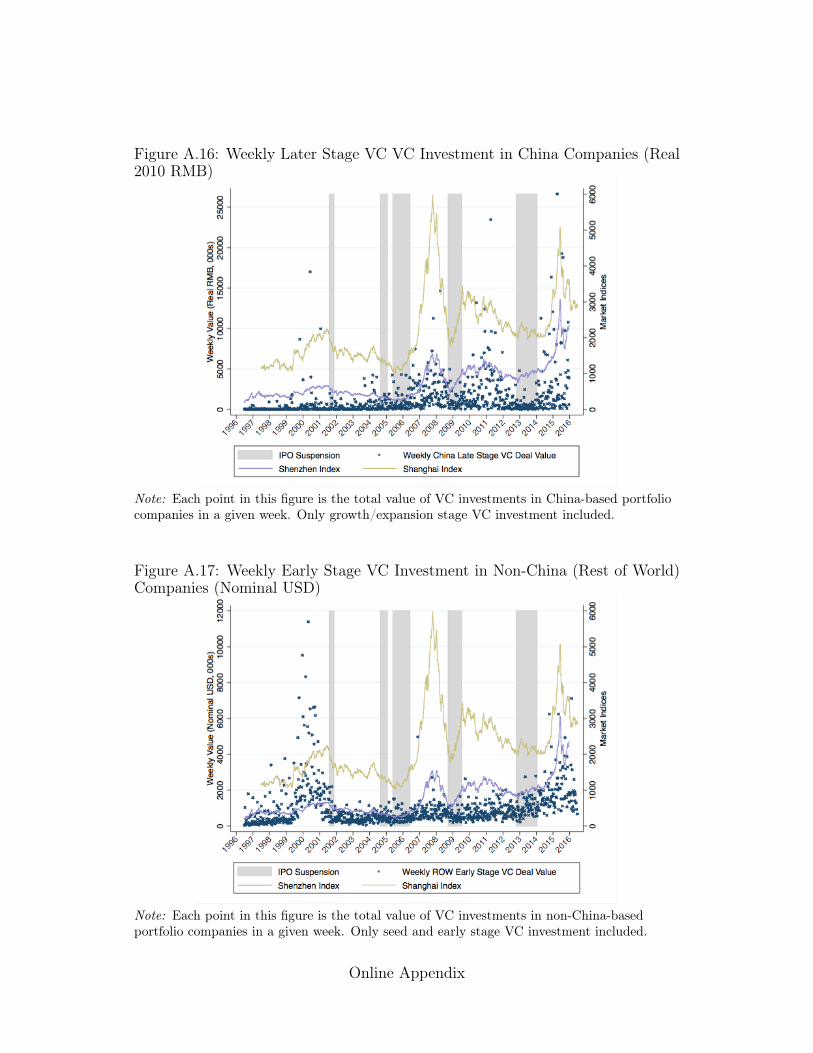
Figure A.16: Weekly Later Stage VC VC Investment in China Companies (Real2010 RMB)
Note: Each point in this figure is the total value of VC investments in China-based portfoliocompanies in a given week. Only growth/expansion stage VC investment included.
Figure A.17: Weekly Early Stage VC Investment in Non-China (Rest of World)Companies (Nominal USD)
Note: Each point in this figure is the total value of VC investments in non-China-basedportfolio companies in a given week. Only seed and early stage VC investment included.
Online Appendix
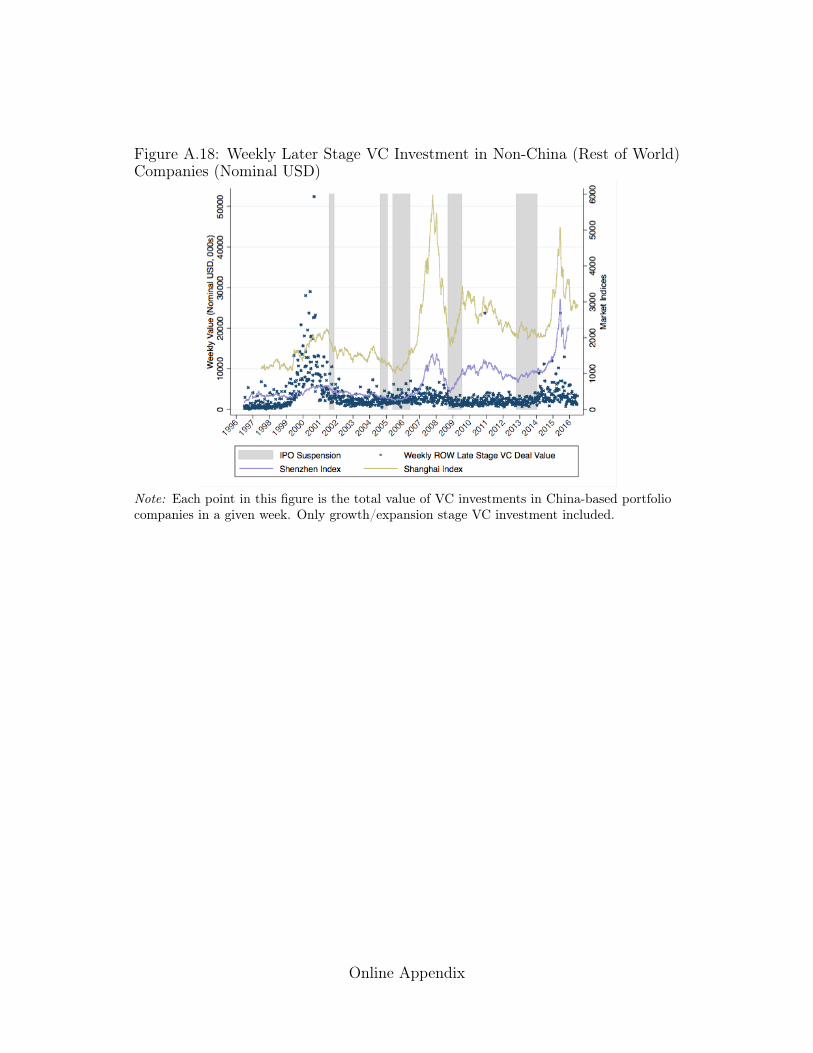
Figure A.18: Weekly Later Stage VC Investment in Non-China (Rest of World)Companies (Nominal USD)
Note: Each point in this figure is the total value of VC investments in China-based portfoliocompanies in a given week. Only growth/expansion stage VC investment included.
Online Appendix
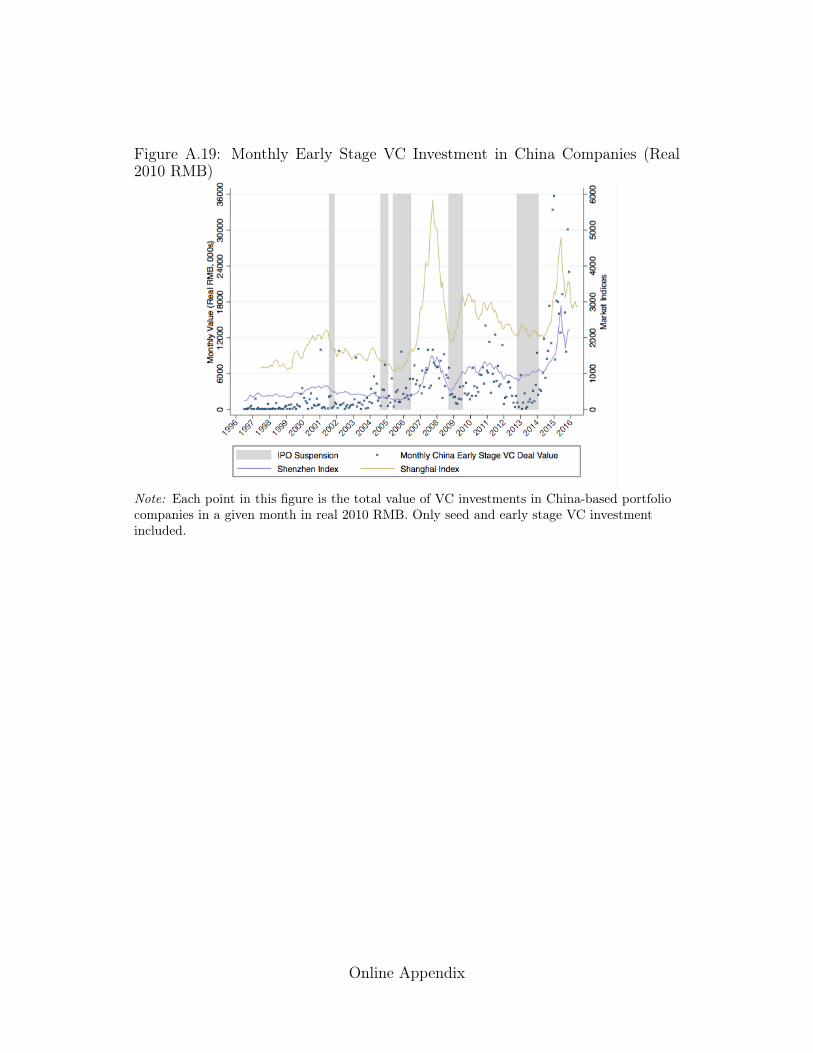
Figure A.19: Monthly Early Stage VC Investment in China Companies (Real2010 RMB)
Note: Each point in this figure is the total value of VC investments in China-based portfoliocompanies in a given month in real 2010 RMB. Only seed and early stage VC investmentincluded.
Online Appendix
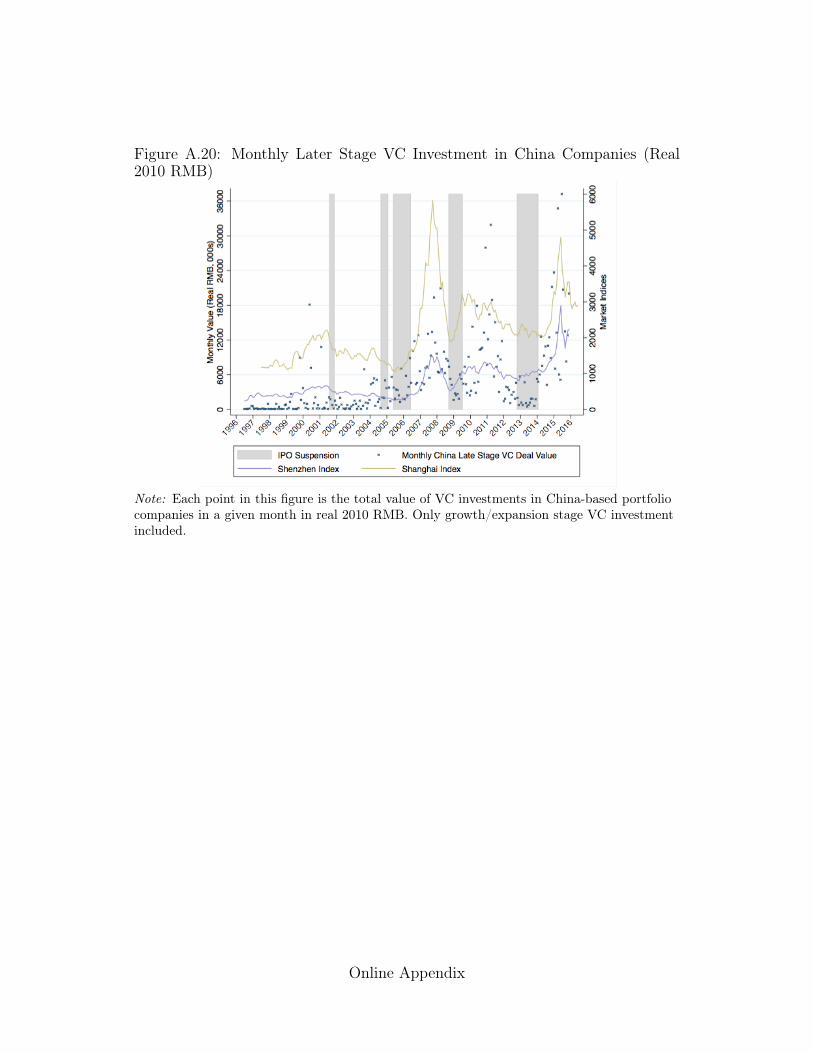
Figure A.20: Monthly Later Stage VC Investment in China Companies (Real2010 RMB)
Note: Each point in this figure is the total value of VC investments in China-based portfoliocompanies in a given month in real 2010 RMB. Only growth/expansion stage VC investmentincluded.
Online Appendix