Embed Size (px)
Citation preview
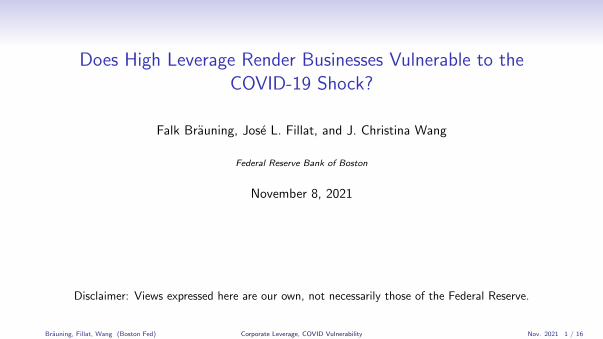
Does High Leverage Render Businesses Vulnerable to theCOVID-19 Shock?
Falk Brauning, Jose L. Fillat, and J. Christina Wang
Federal Reserve Bank of Boston
November 8, 2021
Disclaimer: Views expressed here are our own, not necessarily those of the Federal Reserve.
Brauning, Fillat, Wang (Boston Fed) Corporate Leverage, COVID Vulnerability Nov. 2021 1 / 16
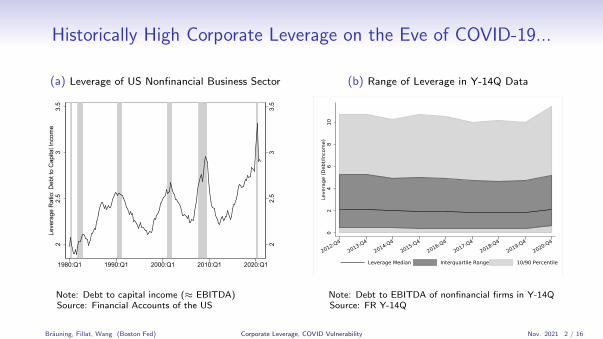
Historically High Corporate Leverage on the Eve of COVID-19...
(a) Leverage of US Nonfinancial Business Sector
22.
53
3.5
22.
53
3.5
Leve
rage
Rat
io: D
ebt t
o C
apita
l Inc
ome
1980:Q1 1990:Q1 2000:Q1 2010:Q1 2020:Q1
Note: Debt to capital income (≈ EBITDA)Source: Financial Accounts of the US
(b) Range of Leverage in Y-14Q Data
02
46
810
Leve
rage
(Deb
t/Inc
ome)
2012:Q4
2013:Q4
2014:Q4
2015:Q4
2016:Q4
2017:Q4
2018:Q4
2019:Q4
2020:Q4
Leverage Median Interquartile Range 10/90 Percentile
Note: Debt to EBITDA of nonfinancial firms in Y-14QSource: FR Y-14Q
Brauning, Fillat, Wang (Boston Fed) Corporate Leverage, COVID Vulnerability Nov. 2021 2 / 16

Overview of Analysis and Findings
• Nonfinancial sector entered the COVID-19 crisis with historically high leverage.
• We use data on nonfinancial firms borrowing from Y-14Q banks to study how pre-COVIDleverage affected firms’ ability to access bank loans and their investment during COVID.
• Focus on disparate experience of large vs. small firms (sales up to $50M) and mid-sizedfirms (sales from $50M up to $250M).
• Leverage constrained SMEs’, especially small firms’, access to bank credit along somemargins after the pandemic hit:
• Reduced size of newly originated loans to SMEs;• Lowered small firms’ probability of borrowing from a bank without prior relationships.
• Banks with more capital cushion appear more willing to lend to higher-leverage customersduring COVID, but only if they already had prior relationships.
• Some evidence of higher leverage deterring investment during COVID among SMEs,especially mid-sized firms.
Brauning, Fillat, Wang (Boston Fed) Corporate Leverage, COVID Vulnerability Nov. 2021 3 / 16
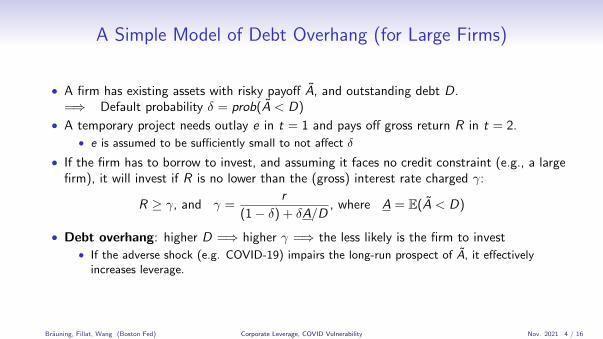
A Simple Model of Debt Overhang (for Large Firms)
• A firm has existing assets with risky payoff A, and outstanding debt D.=⇒ Default probability δ = prob(A < D)
• A temporary project needs outlay e in t = 1 and pays off gross return R in t = 2.• e is assumed to be sufficiently small to not affect δ
• If the firm has to borrow to invest, and assuming it faces no credit constraint (e.g., a largefirm), it will invest if R is no lower than the (gross) interest rate charged γ:
R ≥ γ, and γ =r
(1− δ) + δA/D, where A = E(A < D)
• Debt overhang: higher D =⇒ higher γ =⇒ the less likely is the firm to invest• If the adverse shock (e.g. COVID-19) impairs the long-run prospect of A, it effectively
increases leverage.
Brauning, Fillat, Wang (Boston Fed) Corporate Leverage, COVID Vulnerability Nov. 2021 4 / 16
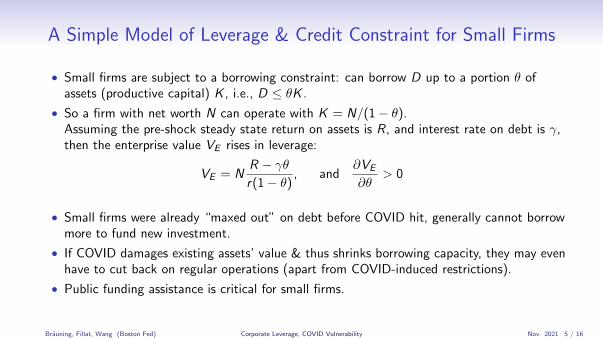
A Simple Model of Leverage & Credit Constraint for Small Firms
• Small firms are subject to a borrowing constraint: can borrow D up to a portion θ ofassets (productive capital) K , i.e., D ≤ θK .
• So a firm with net worth N can operate with K = N/(1− θ).Assuming the pre-shock steady state return on assets is R, and interest rate on debt is γ,then the enterprise value VE rises in leverage:
VE = NR − γθr(1− θ)
, and∂VE
∂θ> 0
• Small firms were already “maxed out” on debt before COVID hit, generally cannot borrowmore to fund new investment.
• If COVID damages existing assets’ value & thus shrinks borrowing capacity, they may evenhave to cut back on regular operations (apart from COVID-induced restrictions).
• Public funding assistance is critical for small firms.
Brauning, Fillat, Wang (Boston Fed) Corporate Leverage, COVID Vulnerability Nov. 2021 5 / 16
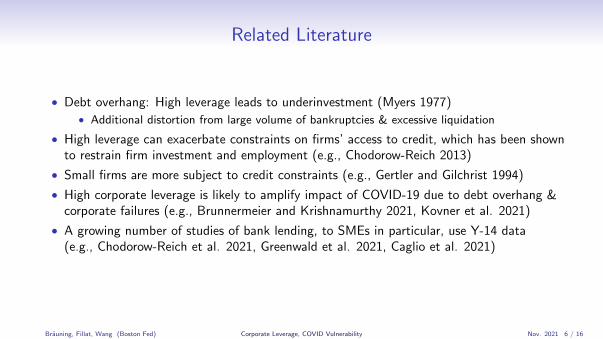
Related Literature
• Debt overhang: High leverage leads to underinvestment (Myers 1977)• Additional distortion from large volume of bankruptcies & excessive liquidation
• High leverage can exacerbate constraints on firms’ access to credit, which has been shownto restrain firm investment and employment (e.g., Chodorow-Reich 2013)
• Small firms are more subject to credit constraints (e.g., Gertler and Gilchrist 1994)
• High corporate leverage is likely to amplify impact of COVID-19 due to debt overhang &corporate failures (e.g., Brunnermeier and Krishnamurthy 2021, Kovner et al. 2021)
• A growing number of studies of bank lending, to SMEs in particular, use Y-14 data(e.g., Chodorow-Reich et al. 2021, Greenwald et al. 2021, Caglio et al. 2021)
Brauning, Fillat, Wang (Boston Fed) Corporate Leverage, COVID Vulnerability Nov. 2021 6 / 16
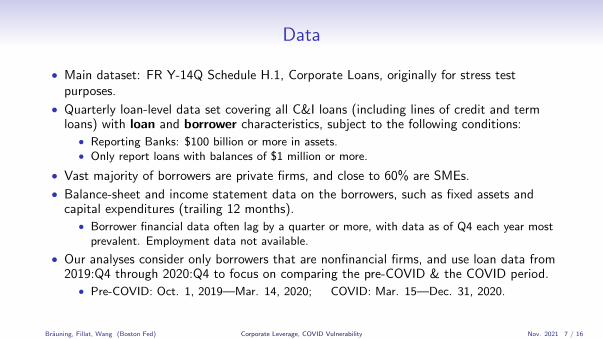
Data
• Main dataset: FR Y-14Q Schedule H.1, Corporate Loans, originally for stress testpurposes.
• Quarterly loan-level data set covering all C&I loans (including lines of credit and termloans) with loan and borrower characteristics, subject to the following conditions:
• Reporting Banks: $100 billion or more in assets.• Only report loans with balances of $1 million or more.
• Vast majority of borrowers are private firms, and close to 60% are SMEs.
• Balance-sheet and income statement data on the borrowers, such as fixed assets andcapital expenditures (trailing 12 months).
• Borrower financial data often lag by a quarter or more, with data as of Q4 each year mostprevalent. Employment data not available.
• Our analyses consider only borrowers that are nonfinancial firms, and use loan data from2019:Q4 through 2020:Q4 to focus on comparing the pre-COVID & the COVID period.
• Pre-COVID: Oct. 1, 2019—Mar. 14, 2020; COVID: Mar. 15—Dec. 31, 2020.
Brauning, Fillat, Wang (Boston Fed) Corporate Leverage, COVID Vulnerability Nov. 2021 7 / 16
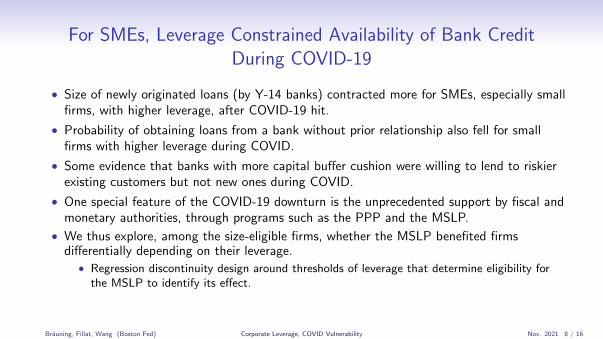
For SMEs, Leverage Constrained Availability of Bank CreditDuring COVID-19
• Size of newly originated loans (by Y-14 banks) contracted more for SMEs, especially smallfirms, with higher leverage, after COVID-19 hit.
• Probability of obtaining loans from a bank without prior relationship also fell for smallfirms with higher leverage during COVID.
• Some evidence that banks with more capital buffer cushion were willing to lend to riskierexisting customers but not new ones during COVID.
• One special feature of the COVID-19 downturn is the unprecedented support by fiscal andmonetary authorities, through programs such as the PPP and the MSLP.
• We thus explore, among the size-eligible firms, whether the MSLP benefited firmsdifferentially depending on their leverage.
• Regression discontinuity design around thresholds of leverage that determine eligibility forthe MSLP to identify its effect.
Brauning, Fillat, Wang (Boston Fed) Corporate Leverage, COVID Vulnerability Nov. 2021 8 / 16
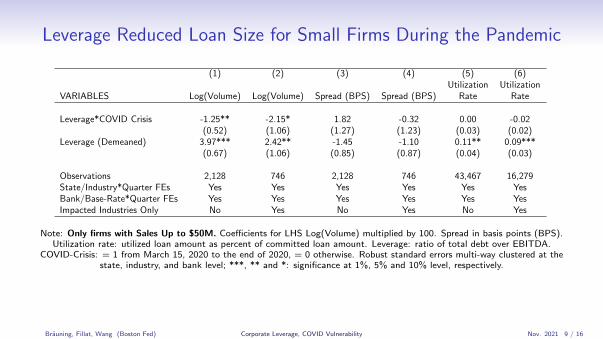
Leverage Reduced Loan Size for Small Firms During the Pandemic
(1) (2) (3) (4) (5) (6)Utilization Utilization
VARIABLES Log(Volume) Log(Volume) Spread (BPS) Spread (BPS) Rate Rate
Leverage*COVID Crisis -1.25** -2.15* 1.82 -0.32 0.00 -0.02(0.52) (1.06) (1.27) (1.23) (0.03) (0.02)
Leverage (Demeaned) 3.97*** 2.42** -1.45 -1.10 0.11** 0.09***(0.67) (1.06) (0.85) (0.87) (0.04) (0.03)
Observations 2,128 746 2,128 746 43,467 16,279State/Industry*Quarter FEs Yes Yes Yes Yes Yes YesBank/Base-Rate*Quarter FEs Yes Yes Yes Yes Yes YesImpacted Industries Only No Yes No Yes No Yes
Note: Only firms with Sales Up to $50M. Coefficients for LHS Log(Volume) multiplied by 100. Spread in basis points (BPS).Utilization rate: utilized loan amount as percent of committed loan amount. Leverage: ratio of total debt over EBITDA.
COVID-Crisis: = 1 from March 15, 2020 to the end of 2020, = 0 otherwise. Robust standard errors multi-way clustered at thestate, industry, and bank level; ***, ** and *: significance at 1%, 5% and 10% level, respectively.
Brauning, Fillat, Wang (Boston Fed) Corporate Leverage, COVID Vulnerability Nov. 2021 9 / 16
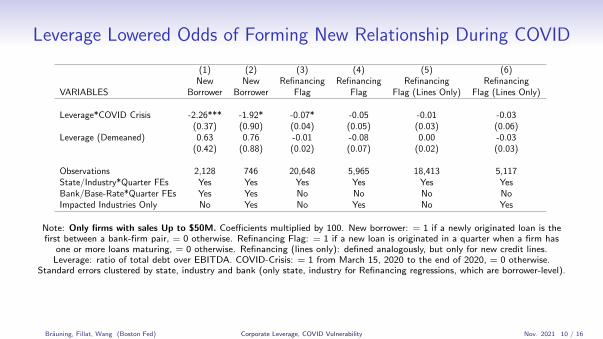
Leverage Lowered Odds of Forming New Relationship During COVID
(1) (2) (3) (4) (5) (6)New New Refinancing Refinancing Refinancing Refinancing
VARIABLES Borrower Borrower Flag Flag Flag (Lines Only) Flag (Lines Only)
Leverage*COVID Crisis -2.26*** -1.92* -0.07* -0.05 -0.01 -0.03(0.37) (0.90) (0.04) (0.05) (0.03) (0.06)
Leverage (Demeaned) 0.63 0.76 -0.01 -0.08 0.00 -0.03(0.42) (0.88) (0.02) (0.07) (0.02) (0.03)
Observations 2,128 746 20,648 5,965 18,413 5,117State/Industry*Quarter FEs Yes Yes Yes Yes Yes YesBank/Base-Rate*Quarter FEs Yes Yes No No No NoImpacted Industries Only No Yes No Yes No Yes
Note: Only firms with sales Up to $50M. Coefficients multiplied by 100. New borrower: = 1 if a newly originated loan is thefirst between a bank-firm pair, = 0 otherwise. Refinancing Flag: = 1 if a new loan is originated in a quarter when a firm has
one or more loans maturing, = 0 otherwise. Refinancing (lines only): defined analogously, but only for new credit lines.Leverage: ratio of total debt over EBITDA. COVID-Crisis: = 1 from March 15, 2020 to the end of 2020, = 0 otherwise.
Standard errors clustered by state, industry and bank (only state, industry for Refinancing regressions, which are borrower-level).
Brauning, Fillat, Wang (Boston Fed) Corporate Leverage, COVID Vulnerability Nov. 2021 10 / 16
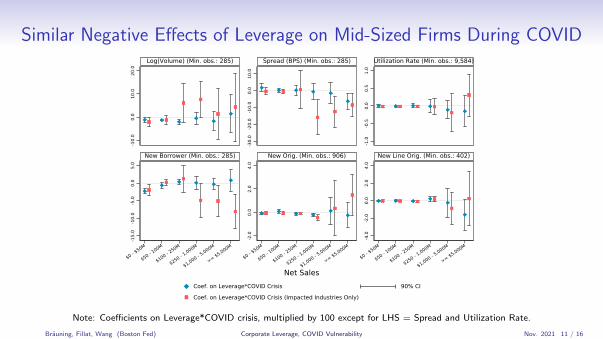
Similar Negative Effects of Leverage on Mid-Sized Firms During COVID
-10.
00.
010
.020
.0
-30.
0-2
0.0
-10.
00.
010
.0
-1.0
-0.5
0.0
0.5
1.0
-15.
0-1
0.0
-5.0
0.0
5.0
-2.0
0.0
2.0
4.0
-4.0
-2.0
0.0
2.0
4.0
$0 - $50M
$50 - 100M
$100 - 250M
$250 - 1,000M
$1,000 - 5,000M
>= $5,000M
$0 - $50M
$50 - 100M
$100 - 250M
$250 - 1,000M
$1,000 - 5,000M
>= $5,000M
$0 - $50M
$50 - 100M
$100 - 250M
$250 - 1,000M
$1,000 - 5,000M
>= $5,000M
Log(Volume) (Min. obs.: 285) Spread (BPS) (Min. obs.: 285) Utilization Rate (Min. obs.: 9,584)
New Borrower (Min. obs.: 285) New Orig. (Min. obs.: 906) New Line Orig. (Min. obs.: 402)
Coef. on Leverage*COVID Crisis 90% CI
Coef. on Leverage*COVID Crisis (Impacted Industries Only)
Net Sales
Note: Coefficients on Leverage*COVID crisis, multiplied by 100 except for LHS = Spread and Utilization Rate.
Brauning, Fillat, Wang (Boston Fed) Corporate Leverage, COVID Vulnerability Nov. 2021 11 / 16
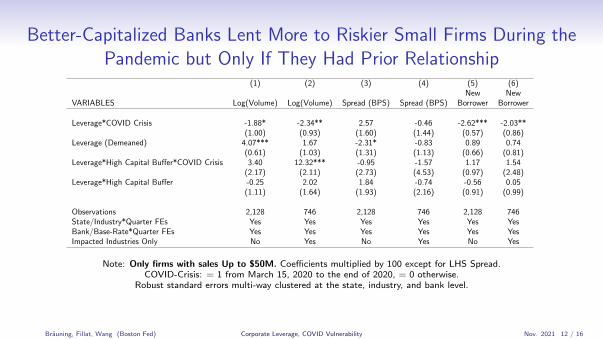
Better-Capitalized Banks Lent More to Riskier Small Firms During thePandemic but Only If They Had Prior Relationship
(1) (2) (3) (4) (5) (6)New New
VARIABLES Log(Volume) Log(Volume) Spread (BPS) Spread (BPS) Borrower Borrower
Leverage*COVID Crisis -1.88* -2.34** 2.57 -0.46 -2.62*** -2.03**(1.00) (0.93) (1.60) (1.44) (0.57) (0.86)
Leverage (Demeaned) 4.07*** 1.67 -2.31* -0.83 0.89 0.74(0.61) (1.03) (1.31) (1.13) (0.66) (0.81)
Leverage*High Capital Buffer*COVID Crisis 3.40 12.32*** -0.95 -1.57 1.17 1.54(2.17) (2.11) (2.73) (4.53) (0.97) (2.48)
Leverage*High Capital Buffer -0.25 2.02 1.84 -0.74 -0.56 0.05(1.11) (1.64) (1.93) (2.16) (0.91) (0.99)
Observations 2,128 746 2,128 746 2,128 746State/Industry*Quarter FEs Yes Yes Yes Yes Yes YesBank/Base-Rate*Quarter FEs Yes Yes Yes Yes Yes YesImpacted Industries Only No Yes No Yes No Yes
Note: Only firms with sales Up to $50M. Coefficients multiplied by 100 except for LHS Spread.COVID-Crisis: = 1 from March 15, 2020 to the end of 2020, = 0 otherwise.
Robust standard errors multi-way clustered at the state, industry, and bank level.
Brauning, Fillat, Wang (Boston Fed) Corporate Leverage, COVID Vulnerability Nov. 2021 12 / 16

Firms with Leverage Higher Than A MSLP Threshold Appear toSubstitute toward Bank Loans During COVID
(1) (2) (3) (4) (5) (6)Pre-COVID Pre-COVID Pre-COVID COVID COVID COVID
VARIABLES Log(Volume) Spread (BPS) New Borrower Log(Volume) Spread (BPS) New Borrower
Leverage (4 to 4.5 Dummy) -34.16 -34.83*** 23.73** 48.77* 19.31* 13.13(30.97) (6.33) (10.46) (23.28) (10.94) (7.95)
Leverage (Demeaned) -6.31 5.86 10.06 -158.95 -138.64** -19.59(5.18) (15.43) (6.38) (114.21) (53.41) (33.94)
Leverage (4 to 4.5 Dummy)*Leverage 96.55 36.47 -76.27** 135.15 122.04** 8.33(92.41) (38.36) (31.48) (113.38) (56.14) (33.47)
Observations 301 301 301 474 474 474Base-Rate/Security/Maturity FEs Yes Yes Yes Yes Yes YesMSLP Size Eligible Only Yes Yes Yes Yes Yes Yes
Note: Only MSLP size-eligible firms with leverage between 3.5 and 4.5. Leverage ∈ [3.5, 4] is omitted category.Coefficients multiplied by 100 except for LHS Spread. Pre-COVID: October 1, 2019 to March 14, 2020;
COVID: March 15, 2020 to end of 2020. Robust standard errors multi-way clustered at the state, industry, and bank level.
Brauning, Fillat, Wang (Boston Fed) Corporate Leverage, COVID Vulnerability Nov. 2021 13 / 16
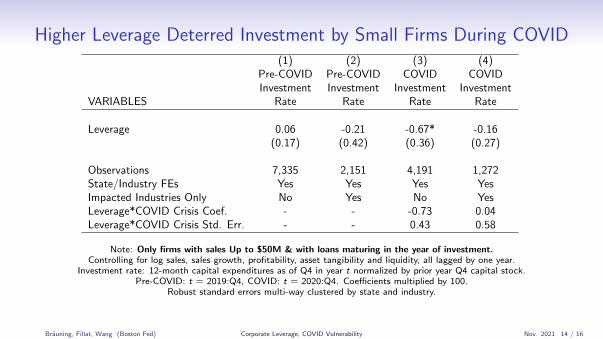
Higher Leverage Deterred Investment by Small Firms During COVID(1) (2) (3) (4)
Pre-COVID Pre-COVID COVID COVIDInvestment Investment Investment Investment
VARIABLES Rate Rate Rate Rate
Leverage 0.06 -0.21 -0.67* -0.16(0.17) (0.42) (0.36) (0.27)
Observations 7,335 2,151 4,191 1,272State/Industry FEs Yes Yes Yes YesImpacted Industries Only No Yes No YesLeverage*COVID Crisis Coef. - - -0.73 0.04Leverage*COVID Crisis Std. Err. - - 0.43 0.58
Note: Only firms with sales Up to $50M & with loans maturing in the year of investment.Controlling for log sales, sales growth, profitability, asset tangibility and liquidity, all lagged by one year.
Investment rate: 12-month capital expenditures as of Q4 in year t normalized by prior year Q4 capital stock.Pre-COVID: t = 2019:Q4, COVID: t = 2020:Q4. Coefficients multiplied by 100.
Robust standard errors multi-way clustered by state and industry.
Brauning, Fillat, Wang (Boston Fed) Corporate Leverage, COVID Vulnerability Nov. 2021 14 / 16
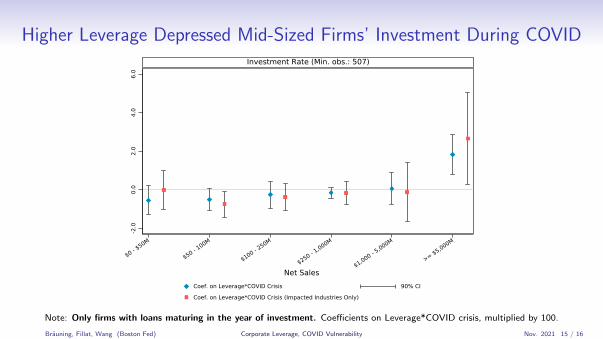
Higher Leverage Depressed Mid-Sized Firms’ Investment During COVID
-2.0
0.0
2.0
4.0
6.0
$0 - $50M
$50 - 100M
$100 - 250M
$250 - 1,000M
$1,000 - 5,000M
>= $5,000M
Investment Rate (Min. obs.: 507)
Coef. on Leverage*COVID Crisis 90% CI
Coef. on Leverage*COVID Crisis (Impacted Industries Only)
Net Sales
Note: Only firms with loans maturing in the year of investment. Coefficients on Leverage*COVID crisis, multiplied by 100.
Brauning, Fillat, Wang (Boston Fed) Corporate Leverage, COVID Vulnerability Nov. 2021 15 / 16

Conclusion & Policy Implication
• We use data on nonfinancial firms borrowing from Y-14Q banks to study how pre-COVIDleverage affected the availability of bank loans to nonfinancial firms, especially SMEs, andtheir investment during the pandemic.
• After COVID-19 hit, higher leverage reduced the size of newly originated loans to SMEs,and lowered small firms’ probability of borrowing from a bank without prior relationships.
• Banks with greater capital cushion appear more willing to lend to higher-leverage smallfirms during the COVID period, but only if they already had prior relationships.
• Some evidence of higher leverage deterring investment during the pandemic, most notablyamong mid-sized firms.
• Public funding likely supported small firms, and bond purchases buoyed large (public)firms, whereas mid-sized firms may have fallen through the policy cracks to some extent.
Brauning, Fillat, Wang (Boston Fed) Corporate Leverage, COVID Vulnerability Nov. 2021 16 / 16