Embed Size (px)
Citation preview
Finance and Economics Discussion SeriesDivisions of Research & Statistics and Monetary Affairs
Federal Reserve Board, Washington, D.C.
Does Knowledge Protection Benefit Shareholders? Evidence fromStock Market Reaction and Firm Investment in Knowledge Assets
Buhui Qiu and Teng Wang
2017-012
Please cite this paper as:Qiu, Buhui and Teng Wang (2017). “Does Knowledge Protection Benefit Shareholders?Evidence from Stock Market Reaction and Firm Investment in Knowledge Assets,” Financeand Economics Discussion Series 2017-012. Washington: Board of Governors of the FederalReserve System, https://doi.org/10.17016/FEDS.2017.012.
NOTE: Staff working papers in the Finance and Economics Discussion Series (FEDS) are preliminarymaterials circulated to stimulate discussion and critical comment. The analysis and conclusions set forthare those of the authors and do not indicate concurrence by other members of the research staff or theBoard of Governors. References in publications to the Finance and Economics Discussion Series (other thanacknowledgement) should be cleared with the author(s) to protect the tentative character of these papers.

Does Knowledge Protection Benefit Shareholders? Evidence from Stock
Market Reaction and Firm Investment in Knowledge Assets*
Buhui Qiu†
Teng Wang‡
* We thank Stijn Claessens, Douglas Foster, Bobae Choi, Janet Gao, Harald Hau, Kathleen Johnson, Doowon Lee,
Amir Licht, Ben Marshall, Ron Masulis, Alexandre Mas, Nick Nguyen, Enrico Perotti, Tong Zhou, seminar
participants at the Federal Reserve Board, Massey University, the University of Newcastle, and the University of
Sydney, and conference participants at the 2017 American Economic Association Meeting, 2016 Northern Finance
Association Meeting, 2016 Financial Management Association Asia Pacific Conference, 2016 Eastern Finance
Association Meeting, and 2015 FIRN Annual Conference for helpful comments and suggestions. We gratefully
acknowledge Financial Management Association for the 2016 FMA Asia Pacific Conference Best Paper Award in
Corporate Finance/Financial Institutions for an earlier version of the paper. All errors are our own. The views
expressed in this paper are solely those of the authors and should not be interpreted as reflecting the views of the
Board of Governors or the staff of the Federal Reserve System.
† Buhui Qiu is affiliated with the University of Sydney, NSW 2006, Australia; Email: [email protected];
Phone: 61-2-9036-6435.
‡ Teng Wang is affiliated with the Board of Governors of the Federal Reserve System, 20th Street and Constitution
Ave NW, Washington, DC 20551, USA; Email: [email protected]; Phone: 1-202-452-6436.

Does Knowledge Protection Benefit Shareholders? Evidence from Stock
Market Reaction and Firm Investment in Knowledge Assets
Abstract
This paper studies whether knowledge protection affects shareholder value and firms’
investment in knowledge assets using the staggered adoptions and rejections of the inevitable
disclosure doctrine (IDD) by U.S. state courts as exogenous changes in the level of knowledge
protection. We find positive (negative) abnormal stock returns around the IDD adoption
(rejection) day for firms headquartered in the state and uncover a positive IDD treatment effect
on firms’ investment in knowledge assets. Moreover, the effects on stock returns and knowledge
assets investment are stronger in more knowledge-oriented industries and firms. Finally,
enhancing knowledge protection does not discourage local entrepreneurial activity.
Keywords: Knowledge Protection; Inevitable Disclosure Doctrine; Shareholder Value;
Investment in Knowledge Assets

1
I. Introduction
The role of knowledge protection is controversial in today’s knowledge economy. There
has been a century-long debate about whether we should allow production-relevant knowledge to
move freely across economic agents; little consensus has been reached thus far. On the one hand,
knowledge protection restrains positive local externalities among industry peers. Studies show
that firms benefit from having access to skilled labor/knowledge created by rivals and other
agents and can improve efficiency and build up research capacity on the findings of others. Local
knowledge externalities, for example, are considered to be a driver for industry clustering and
regional economic growth (see, e.g., Marshall (1920), Romer (1986), Krugman (1991), Porter
(1998), and Ellison, Glaeser, and Kerr (2010)). On the other hand, without knowledge protection,
there is little incentive for firms to invest in training employees and generate firm-specific
knowledge given that they expect proprietary knowledge to be easily leaked to competitors
through employees’ job switching. Literature suggests that investment in employee training and
proprietary knowledge assets is an important engine for productivity improvement and economic
growth (see, e.g., Tomer (1987), Lucas (1988), Becker (1993), Jovanovic and Rousseau (2001),
Atkeson and Kehoe (2005), McGrattan and Prescott (2010), Bloom, Sadun, and Van Reenen
(2012)).
Despite this longstanding controversy, there is a lack of empirical evidence illustrating
the direct effect of knowledge protection on firm shareholder value and investment in knowledge
assets. Does knowledge protection benefit the shareholders of a firm, or does it do more harm
than good? Does it encourage firms to invest in knowledge assets? The lack of empirical
evidence likely reflects the fact that several identification challenges exist in testing the impact of
knowledge protection. For instance, how well a firm protects its proprietary knowledge is

2
typically not directly observable and hence not measurable. Moreover, even if it were, the level
of knowledge protection would likely be correlated with other firm characteristics, which makes
causality difficult to establish.
In this paper, we use the staggered adoptions of the inevitable disclosure doctrine (IDD)
or rejections of the previously adopted IDD by U.S. state courts as natural experiments and study
whether exogenous changes in the level of knowledge protection affect firm shareholder value
and investment in knowledge assets. The extant literature suggests that one primary channel
through which proprietary knowledge of the firm is leaked to competitors is through the mobility
of employees with production-relevant knowledge (e.g., Jaffe, Trajtenberg, and Henderson
(1993), Matusik and Hill (1998), Almeida and Kogut (1999), and Breschi and Lissoni (2001)).
The IDD is specifically designed to protect firm-specific knowledge from being leaked to rival
firms: This legal doctrine prevents a former employee from working for a rival firm if doing so
will inevitably disclose the former employer’s proprietary knowledge or trade secrets to a rival.
As the enforcement of the IDD is not contingent upon the type of a former employee’s contract
or the location of future rival firms or whether a non-compete agreement is in place, it limits
potential outside employment options for knowledgeable employees. The adoption of this legal
doctrine by a state court thus significantly enhances the ability of firms located in a particular
state to protect their production-relevant knowledge.
To understand the impact of the IDD rulings on firm shareholder value, we rely on firm
geographic location information and use the event study methodology to measure firm stock
price reactions around major IDD court ruling events in states where firms are located. Ex-ante,
the effect of IDD adoption on firm shareholder value is ambiguous. IDD adoption should
increase a firm’s incentive to train employees and invest in developing firm-specific knowledge,

3
which will improve the firm’s competitive edge and thus increase shareholder value. At the same
time, however, the adoption of the IDD can also make it more difficult for firms to recruit
valuable employees from peer firms and institutions and obtain new knowledge, which can be
detrimental to shareholder value. Given that the U.S. stock market is, on average, efficient (see,
e.g., Fama, 1998), stock price reactions around major IDD rulings that change the level of state
knowledge protection should reflect the net impact of the IDD on firm shareholder value.
We then investigate how the IDD rulings affect a firm’s investment in knowledge assets
by focusing on changes in the firm’s annual selling, general and administrative (SG&A)
expenses following IDD changes. SG&A expenses include employee training costs, IT
investment, consulting, advertising and marketing expenses, R&D expenses, and information
systems and distribution channel investment, which are expenses aimed at improving the firm’s
body of proprietary knowledge. Many studies (see, e.g., Lev and Radhakrishnan (2005), Lev,
Radhakrishnan, and Zhang (2009), Banker, Huang and Natarajan (2011), Eisfeldt and
Papanikolaou (2013), Zhang (2014), and Li, Qiu, and Shen (2016)) have validated that
capitalized SG&A is a good proxy of a firm’s organization capital, that is, the agglomeration of
proprietary knowledge, including operational processes or know-how, that generates a
competitive edge for the firm and cannot be easily imitated by its competitors (Prescott and
Visscher (1980)).1 We conjecture that firms gain more protection over their proprietary
1 SG&A expenses include R&D expenses (Compustat Manual) and 82% of Compustat firm-year observations have
valid (i.e., non-missing) information on SG&A expenses. By contrast, many firms do not separately report R&D
expenses. For example, Koh and Reeb (2015) find that in their sample of 3000+ NYSE-listed firms, 1,737 of them do
not report any information on R&D while 373 of them report zero R&D. The proprietary knowledge assets the IDD

4
knowledge assets after the adoption of the IDD. Thus, they should have an increased incentive to
invest in organization capital, and their annual SG&A expenses should subsequently increase.
We exploit the staggered adoptions of the IDD and rejections of the previously adopted IDD
across different states and over time and use a difference-in-differences regression approach to
identify the causal relationship between knowledge protection and firms’ investment in
knowledge assets.
The main result from the event study shows that the adoption of the IDD by a state court,
on average, leads to significantly positive abnormal stock returns around the adoption day for
firms headquartered in that state, while the rejection of the previously adopted IDD leads to
significantly negative abnormal returns. The magnitude of abnormal returns is also significant.
The adoption of the IDD leads to an average cumulative abnormal return (CAR) of 1.0% in the (-
2,2) event window, while the rejection of the previously adopted IDD leads to an average CAR
of -2.7% in the (-2,2) window. The asymmetric responses between adoption and rejection
decisions suggest that the rejection of the previously adopted IDD is a greater surprise to the
market than is the initial adoption (i.e., the informational content of a subsequent rejection ruling
given the IDD was adopted in the first place is greater than that of an initial adoption ruling).
Our further investigation into the cross-sectional variation in stock price reactions reveals
that the impact of knowledge protection changes on shareholder value is generally stronger in
industries and firms that are more knowledge oriented. Specifically, we find stronger results in
industries that are high-tech or have more R&D intensity or a higher patent count, and in firms
that spend more on R&D or SG&A or have more patents granted. Interestingly, we find that the
aims to protect are trade secrets of the firm, which are typically not patented and hence not protected by patent law
(see, e.g., Geng, Hau and Lai (2014), for studies on patent protection and patent success).

5
negative effect of IDD rejection on shareholder value is weaker in states with stronger
connections between local research-intensive universities and related industries. This result
suggests that, as local industries in those states depend heavily on research universities as a
source for innovative knowledge and skilled labor (see, e.g., Zucker, Darby, and Brewer (1998)
and Kantor and Whalley (2014)), the rejection of the previously adopted IDD makes it easier for
local industries to recruit employees with valuable knowledge from local research universities,
which helps mitigate the negative impact of IDD rejection on shareholder value.
Using a difference-in-differences regression framework, we uncover a statistically
significant and positive treatment effect of the IDD on annual knowledge assets investment,
which, on average, amounts to 0.7% of annual sales revenue of a firm. The result indicates that
firms increase their investment in organization capital to develop and accumulate firm-specific
knowledge after the stricter legal protection of proprietary knowledge comes into force. This
treatment effect is especially strong in knowledge oriented industries, states, and firms. Various
placebo tests with fictitious IDD events, including neighbouring-state IDD rulings, confirm the
robustness of our finding. We further find that the effect of headquarter state IDD ruling on stock
price and subsequent knowledge assets investment is concentrated on firms that are
geographically non-dispersed.
Finally, as prior literature argues that knowledge spillovers encourage entrepreneurship,
we further examine whether enforcing knowledge protection harms local entrepreneurial activity.
We fail to uncover any negative impact of the IDD on local entrepreneurial activity.
This study contributes to the literature on the role of firm knowledge protection.
Liebeskind (1996) points out the importance of knowledge protection, as it allows a firm to
maintain its competitive advantage and extract economic rents from such private knowledge.

6
Proprietary knowledge assets of the firm can be spilled over to rival firms through the mobility
of employees who disclose production-relevant proprietary knowledge and organizational know-
how of the firm to its rivals (see, e.g., Jaffe et al. (1993)). Prior research disagrees on the
consequences of knowledge protection. Some studies show that the enforcement of knowledge
protection leads to firm innovation (see, e.g., Taylor (1994), Zhao (2006), and Lerner (2009))
and contributes to economic growth (see, e.g., Gould and Gruben (1996), Park and Ginarte
(1997), Falvey, Foster, and Greenaway (2006)). Other studies argue that knowledge spillover
within industry clusters is necessary, as it benefits firms and contributes to regional economic
growth (see, e.g., Romer (1986), Krugman (1991), and Samila and Sorenson (2011)). Theoretical
work by Hellmann and Perotti (2011) argues that boundaries established by firms help generate
new ideas but may prevent further improvement and completion through idea circulation. There
is little evidence in the literature thus far on the effect of knowledge protection on shareholder
value of the firm. In this paper, we empirically show that the exogenous increases in the legal
protection of firms’ proprietary knowledge bring net benefits to firm shareholders.
The study is also related to the literature on firms’ investment in knowledge assets. Many
studies focus on organization capital (i.e., the agglomeration of firm proprietary knowledge) and
have established the positive effect of firms’ investment in knowledge assets on production
output (see, e.g., Marshall (1930), Arrow (1962), Rosen (1972), Jovanovic (1979), Prescott and
Visscher (1980), Tomer (1987), Becker (1993), Ericson and Pakes (1995), Hall (2000),
Jovanovic and Rousseau (2001), Atkeson and Kehoe (2005), and Bloom et al. (2012)). Several
studies have shown positive associations between organization capital and firm value (see, e.g.,
Lev et al. (2009), Banker et al. (2011), and Eisfeldt and Papanikolaou (2013)). In this paper, we
7
use staggered changes in the IDD as natural experiments and establish a positive treatment effect
of knowledge-protection enforcement on the firm’s investment in knowledge assets.
This paper also adds new evidence to the law and finance literature. Previous studies
primarily focus on the role of the enforcement of legal systems in the area of investor protection
and show that strong law enforcement, which provides good legal protection to investors, also
facilitates financial-market development and enhances firm valuation (see, e.g., La Porta, Lopez-
de-Silanes, Shleifer, and Vishny (1998), (2002)). Some recent studies focus on labor regulations
and investigate the impacts on firm behavior (see, e.g., Fallick, Fleischman, and Rebitzer (2006),
Marx, Strumsky, and Fleming (2009), Garmaise (2011), Acharya, Baghai and Subramanian
(2013), Wang (2016), and Younge and Marx (2016)).2 There is a growing literature linking
intellectual property law and firms’ financing choices. For example, Klasa, Ortiz-Molina,
Serfling, and Srinivasan (2014) find that intellectual property protection affects firms’ capital
structure decision, and Leung, Mazouz, and Chen (2015) find that intellectual property
protection benefits small firms by improving the liquidity of equity financing and reducing their
costs of capital. Finally, Flammer, and Kacperczyk (2016) show that intellectual property
protection affects firms’ engagement in corporate social responsibility. Our paper contributes to
the literature by showing that stricter enforcement of knowledge protection leads to positive
2 Note that the state enforcement strength of non-compete agreements is largely time-invariant. There are only a few
state regulatory changes related to the enforcement of non-compete agreements and the timing of these few changes
is unrelated to our IDD count cases. In our cross-sectional and panel regressions, we control for state fixed effects or
firm fixed effects as well as year fixed effects. Thus, heterogeneous state non-compete agreement enforcement is
unlikely to affect the results.

8
abnormal stock returns and encourages the firm to increase its investment in knowledge assets,
and the effects are stronger in states, industries, and firms that are more knowledge oriented.
The rest of the paper proceeds as follows. Section II discusses the legal background on
the IDD and the related data and measurement. Section III reports the empirical strategy and
results. Section IV concludes. The Appendix provides a table that describes the variables used in
the study and their data sources.
II. Institutional Background and Data
A. Knowledge Protection and the Inevitable Disclosure Doctrine
Firms spend time and resources accumulating valuable production processes and
knowledge, designing products, and compiling a client base. The doctrine of inevitable
disclosure is a concept of common law that substantially strengthens the protection of trade
secrets. The legal doctrine effectively prevents a firm’s former employees from working at its
competitors if such employment relationships lead to inevitable disclosures of the firm’s trade
secrets to its competitors (e.g., see Hyde (2003), and Graves and DiBoise (2006)). In the United
States, the enforcement of trade secrecy protection is at the state level. The strength of
enforcement varies across states and time, and the nature of what a firm can claim as a legitimate
protectable interest depends on the decision made at the level of state jurisdiction. With the
adoption of the IDD by a state court, a firm registered in that state can obtain an injunction to
prohibit a former employee from working at a competitor and, hence, effectively prevent its trade
secrets from being spilled over to its competitors. By contrast, the rejection of the previously
adopted IDD makes a firm’s knowledge protection more vulnerable to employee job hopping.
Evidence shows that the adoption of IDD effectively restrains knowledgeable employees’

9
mobility to rival firms and, hence, limits cross-firm knowledge spillover (Png and Samila
(2013)).
The main question asked in this study is how firm shareholder value and knowledge
assets investment respond to significant exogenous changes in the level of knowledge protection
in a state. To this end, we mainly focus on precedent-setting cases in which state courts make
significant changes to the status quo with respect to the level of firm proprietary knowledge
protection. Based on Png and Samila (2013) and the legal studies of Wiesner (2012), Kahnke,
Bundy, and Liebman (2008), Kahnke and Bundy (2013) and Malsberger, Pedowitz, and Brock
(2015),3 as well as a comprehensive review of IDD-related court cases in the LexisNexis
database,4 we identify major precedent-setting cases in which U.S. state courts 1) clearly adopted
the IDD and hence increased firms’ ability to protect proprietary knowledge or 2) clearly rejected
the previously adopted IDD and hence decreased firms’ ability to protect proprietary knowledge
in each state over time.5
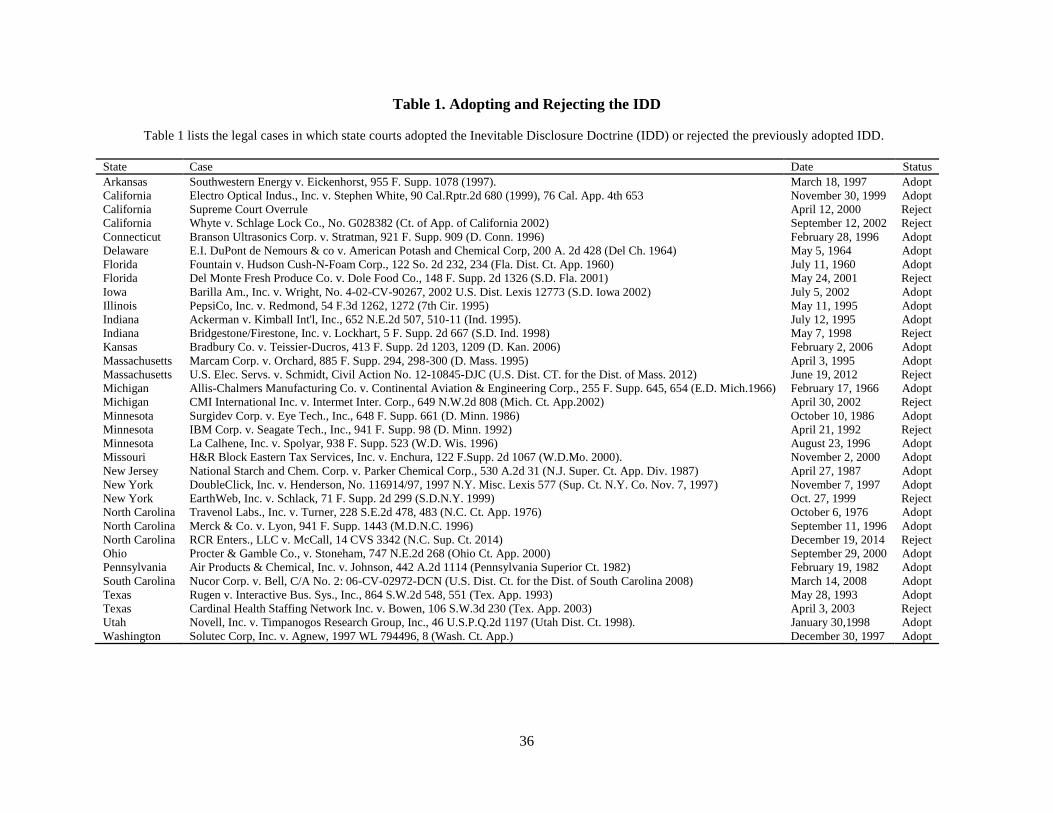
The list of primary U.S. state court rulings that adopted the IDD or rejected the
previously adopted IDD is summarized in Table 1. In total, we identify 34 primary IDD court-
ruling events spanning from 1960 to 2014 in the United States, of which 24 are adoption and 10
are rejection of the previously adopted IDD. The latter (IDD-reversal) events are in the states of
3 We thank Professor I.P.L. Png for sharing these legal studies with us and thank lawyers Randall Kahnke and Kerry
Bundy for generously sharing with us insights into the state-by-state adoption and rejection of the IDD.
4 When searching in the LexisNexis database, we used ‘inevitable disclosure’ and ‘inevitably disclose’ as keywords.
5 IDD-rejection cases in the states that never adopted the IDD before, such as Virginia (e.g., Gov. Tech. Servs., Inc. v.
IntelliSys Tech. Corp. in 1999), Louisiana (e.g., Standard Brands, Inc. v. Zumpe in 1967) and Maryland (e.g., LeJeune
v. Coin Acceptors, Inc. in 2004), are not in our sample since such cases do not change the level of firms’ ability to
protect proprietary knowledge in these states significantly.
10
California, Florida, Indiana, Massachusetts, Michigan, Minnesota, New York, North Carolina,
and Texas.6
An example of an IDD-adoption case is DoubleClick v. Henderson in the state of New
York in 1997. Two executives from DoubleClick, an online-advertising firm headquartered in
NYC, considered launching their own online-advertising business. When discovered, they were
fired and DoubleClick filed a lawsuit at the New York State Supreme Court, seeking a
preliminary injunction to bar the two defendants from engaging in business activities that
compete with DoubleClick. Although neither defendant had signed a non-compete agreement
with DoubleClick, the New York State Supreme Court ruled that the two defendants were
enjoined for a period of six months from launching any company or taking employment with any
company which competes with DoubleClick. The ruling was based on the doctrine that there is a
high probability of “inevitable disclosure” of the former employer’s trade secrets to competitors.
The court states that “Injunctive relief may issue where a former employee’s new job function
will inevitably lead her to rely on trade secrets belonging to a former employer.” The court based
the six-month period on the rapidly evolving changes in the Internet advertising industry and left
6 Minnesota later re-adopted the IDD. California reversed the previously adopted IDD via the Electro Optical Indus.,
Inc. v. Stephen White case on November 30, 1999, through two court rulings: 1) California Supreme Court ordered
the California Court of Appeal’s decision on the Electro Optical Indus., Inc. v. Stephen White case to be depublished
on April 12, 2000, and 2) the California Court of Appeal’s ruling on the Whyte v. Schlage Lock Co. case on September
12, 2002 clearly rejected the IDD. We treat the first ruling as “half rejection”; the Supreme Court left the Appeal
Court’s decision unchanged, but prevented the opinion from being cited by any California court, which dealt
proponents of the inevitable disclosure doctrine a blow since this left them with no California case to cite for support
(Lincicum (2002)).
11
the door open for the plaintiff to apply for an extension after the expiration of the six-month
period “upon a showing of good cause”.
Unlike the passage of state laws, which might be subject to the influence of lobbying and
other political pressure, adoption and rejection of the IDD are based on court rulings on specific
major cases that serve as precedent-setting cases for future follow-up cases. As a court’s ruling
on a precedent-setting major IDD case mainly depends on the nature of the case and the
character of the justices, state courts’ rulings regarding the IDD are arguably exogenous to firms
and shareholders’ decision making processes. We further control for local market conditions and
direct various checks to mitigate remaining concerns.
B. Firm Characteristics and Stock Returns
We identify all firms that were headquartered in the IDD-event states at times when there
were changes in the IDD. We focus on firm headquarters because corporate headquarters are
close to corporate core business activities and employees who have access to key proprietary
knowledge are likely to be concentrated at headquarters (Pirinsky and Wang (2006)). We extract
firms’ daily stock returns data from CRSP and financial data from Compustat. We measure
firms’ stock price reactions around the adoption of the IDD and the rejection of the previously
adopted IDD to capture the impact of IDD-change events on shareholder wealth. We then link
stock price reactions to firms’ characteristics prior to the IDD-change events to study the cross-
sectional variation in stock price reactions to such events. We construct variables that reflect the
degree to which firms are knowledge oriented, such as firm R&D intensity (RND_SALE), firm
SG&A intensity (SGA_SALE), and firm patent count (PATENT_COUNT). These three
variables capture the knowledge intensity of firms, and a firm that is more knowledge oriented

12
should score higher on these variables. We also include standard control variables such as firm
size (FIRM_SIZE), firm market-to-book equity ratio (MARKET_TO_BOOK), and past stock
returns of the firm (PAST_STOCK_RETURN), as it is well known that these firm characteristics
are related to cross-sectional stock returns. The cross-sectional sample consists of 4,535 firm
events in which a firm’s headquarter state adopts the IDD and 3,857 firm events in which a
firm’s headquarter state rejects the previously adopted IDD over the 1960 to 2014 period, with
non-missing data on stock returns and firm characteristics. Following the prior literature on
organization capital, we use annual SG&A expense to capture firms’ investment in firm-specific
knowledge assets (KNOWLEDGE_ASSETS_INVESTMENT).
C. Industry, State, and Economic Conditions
In addition to firm characteristics, we collect data at the industry and state levels to
capture the level of knowledge intensity of the industry to which the firm belongs and the state
where the firm is located. To capture the level of knowledge intensity at the industry level, we
include industry R&D intensity (IND_RND_SALE), industry SG&A intensity
(IND_SGA_SALE), average number of patents granted to firms in the industry
(IND_PAT_COUNT), and an indicator variable for high-tech industries according to the Fama-
French 10-industry classification (HIGH_TECH). We expect that the more knowledge oriented
the industry/firm is, the larger the impact of the IDD changes on shareholder value and firms’
investment in knowledge assets will be. Based on data from the National Science Foundation, we
further construct a state-level knowledge intensity variable reflecting state industry-financed
R&D expenditure at research intensive (doctoral granting) universities
(INDUSTRY_FINANCED_RND). Prior research considers research universities as one

13
important source of innovative knowledge and skilled labor for private enterprises in the area
(e.g., see Zucker et al. (1998), and Kantor and Whalley (2014)). Industry-financed R&D
expenditure at local research intensive universities reflects the reliance of local industries on
research institutes as a source of knowledge creation and innovation. To control for the potential
effect of the state economic environment on shareholder value and firms’ investment in
knowledge assets, we further construct variables that reflect the local economic conditions, such
as the level of local economic development (PER_CAPITA_STATE_INCOME), market size
(TOTAL_STATE_INCOME), and growth perspective (STATE_INCOME_GROWTH), based
on data from sources such as the U.S. Census Bureau and Bureau of Economic Analysis.
Table A1 in the Appendix provides detailed definitions and data sources for each of these
variables and Table 2 provides the summary statistics. The correlation matrix is shown in Table
A2 in the Appendix. All dollar values are in 2014 constant dollars and all continuous variables
are winsorized at the 1st and 99th percentiles to limit the influence of outliers.
III. Empirical Results
A. The Impact of Knowledge Protection on Shareholder Value
We use the event-study methodology to capture the impact of knowledge protection on
shareholder value. We calculate cumulative abnormal returns (CARs) during the 11-day, 5-day,
and 3-day event windows (i.e., CAR(-5,5), CAR(-2,2) and CAR(-1,1), respectively) around the
adoption and rejection of the IDD. We use both the market-adjusted model and the market model
to calculate cumulative abnormal returns, with the CRSP value-weighted stock market returns
(including dividends) as the market portfolio returns. The estimation window for the market
model is (-200, -60) before the event date (Chen, Harford, and Li (2007)). Findings are shown in

14
Table 3. Standard errors are clustered at the state level to account for within-state cross section
correlations.
The results show that the adoption of the IDD (rejection of the previously adopted IDD)
by a state court leads, on average, to statistically significant positive (negative) impact on
shareholder value for firms headquartered in the IDD-change state. Using the market-adjusted
model, we find an average 5-day abnormal return (CAR(-2,2)) of 1.0% during an adoption event
and -2.7% during a rejection event. The result is economically meaningful given that the sample
firms’ average daily abnormal return during this period is only around 0.045%. The results
remain qualitatively similar when we use the market model to calculate CARs. The results are
also qualitatively similar when we use alternative windows of 3 days and 11 days around the
events. The market, on average, reacts positively to IDD adoptions and reacts negatively if the
previously adopted IDD is later revoked or rejected by a state court. If the court ruling outcomes
had largely been expected, we should not have observed such strong average market reactions.
If, given the previous adoption of the IDD, the subsequent reversal of the court’s position on the
doctrine is a greater surprise to the market than is the initial adoption, we should expect smaller
positive abnormal returns for positive rulings and larger (in magnitude) negative returns for
negative rulings, and this is exactly what we see. Thus, the empirical evidence suggests that
enhancing the level of knowledge protection in a firm does materially increase its shareholder
value.
The success of knowledge oriented firms highly depends on the creation of new
knowledge and organizational know-how. Protecting proprietary knowledge from being leaked
to competitors is thus more relevant for firms that are more knowledge oriented; the adoption of
the IDD enables such firms to maintain their competitive edge and thus creates more value for

15
such firms. We conjecture that the effect of knowledge protection changes on shareholder value
should be stronger for firms that are more knowledge oriented or operate in more knowledge
oriented industries or states. Table 4 reports the results of ordinary-least-squares regressions that
investigate the relations between firms’ cumulative abnormal stock returns surrounding the
adoption and rejection of the IDD and various industry/state/firm characteristics reflecting the
level of knowledge intensity. We focus on the regression results with CAR(-2,2) calculated using
the market-adjusted model as the dependent variable. Results using alternative event windows or
the market model are qualitatively similar and are omitted for brevity. Firm size, market-to-book,
past stock returns, per capita state income, total state income, total state income growth, and year
fixed effects are included as controls in all regressions. Robust standard errors are clustered at
the state level to account for within-state cross-sectional correlations in regression residuals.
Panel A of Table 4 reports the influence of industry- and state-level variables of
knowledge intensity on CAR(-2,2). In addition to year fixed effects, we include state fixed
effects in models 1-4 and models 6-9 to control for the cross-sectional heterogeneity in state
characteristics that may drive stock price reactions of firms located in the same state. Consistent
with our conjecture, the regression coefficients of the industry-level knowledge intensity proxies,
such as industry R&D intensity (IND_RND_SALE), industry SG&A intensity
(IND_SGA_SALE), industry patent count (IND_PAT_COUNT) and the high-tech indicator
(HIGH_TECH), are all positive in the IDD-adoption regressions, although none of them is
statistically significant. In contrast, the coefficients of these industry-level knowledge intensity
proxies are all negative in the IDD-rejection regressions, with the coefficients of
IND_RND_SALE, IND_PAT_COUNT, and HIGH_TECH also being statistically significant.
The results indicate that the negative impact of rejecting the previously adopted IDD is more

16
pronounced for firms in more knowledge oriented industries. Firms in knowledge oriented
industries thrive through developing proprietary knowledge and maintaining competitive edge.
The value of these firms is therefore especially susceptible to the rejection of the previously
adopted IDD which weakens their ability to protect proprietary knowledge. The result also
appears to be economically significant. For example, firms in the high-tech industry, on average,
suffer an additional -3.1% abnormal return during the 5-day event window for IDD-rejection
events, which more than doubles the average impact of IDD rejection.
Interestingly, the regression coefficient of INDUSTRY_FINANCED_RND is negative in
the IDD-adoption regression (model 5) and significantly positive in the IDD-rejection regression
(model 10), which suggests that the negative effect of IDD reversal on shareholder value
becomes weaker when there are closer ties in a state between research-intensive universities and
local industries. A greater amount of industry-financed R&D expenditure indicates a larger
number of industry-contracted/funded research projects conducted at local research universities,
and the research outputs tend to be highly valuable to local industries. Prior studies show that
industries located close to research institutes benefit from positive externality and knowledge
spillover from research-intensive universities. Our results likely reflect the fact that the rejection
of the previously adopted IDD makes it easier for firms to recruit valuable employees from local
research universities and receive beneficial knowledge spillovers from universities, which helps
mitigate the negative impact of rejecting the previously adopted IDD on shareholder value.
Panel B reports the influence of firm-level variables of knowledge intensity on CAR(-
2,2). We find that the regression coefficients of firm R&D intensity (RND_SALE), firm SG&A
intensity (SGA_SALE), and firm patent count (PATENT_COUNT) are all positive in the IDD-
adoption regressions, with the coefficients of RND_SALE being statistically significant. In
17
contrast, these variables all have a negative influence on abnormal stock returns during the IDD-
rejection events, and their regression coefficients are all statistically significant. These results are
generally consistent with the findings at the industry levels and, again, support the conjecture
that knowledge protection is especially relevant for knowledge oriented firms. For firms for
which know-how and organizational processes are important production inputs, the ability to
protect such knowledge is crucial to their success and enables them to maintain their competitive
edge, which increases their shareholder value.
In sum, the empirical evidence suggests that the positive (negative) effect of the adoption
of the IDD (rejection of the previously adopted IDD) on abnormal stock returns is generally
stronger for firms that are more knowledge oriented or operate in more knowledge oriented
industries. The results suggest that proprietary knowledge protection brings greater benefits to
shareholders of these firms.
B. The Influence of Knowledge Protection on Firms’ Investment in Knowledge Assets
We next investigate whether changes in knowledge protection affect firms’ investment in
firm-specific knowledge assets. The adoption of the IDD (rejection of the previously adopted
IDD) by a state court exogenously increases (decreases) the ability of knowledge protection for
all firms located in that state. We expect that these affected firms will have a stronger (weaker)
incentive than before to develop and accumulate firm proprietary knowledge. We study changes
in a firm’s investment in knowledge assets following an IDD adoption or rejection by examining
subsequent changes in its annual SG&A expenses. SG&A expenses are regarded as a common
proxy for firms’ investment in organization capital (i.e., the agglomeration of proprietary
knowledge), including firms’ investment in training employees and developing firm-specific

18
production processes and know-how. Enforcing (weakening) a firm’s ability of knowledge
protection via adopting the IDD (rejecting the previously adopted IDD) should result in an
increase (decrease) in the firm’s subsequent SG&A expenses.
We use a difference-in-differences approach to study the potential treatment effect of the
IDD changes on firm’s knowledge assets investment. The analyses are conducted using yearly
CRSP-Compustat data that cover the period from January 1960 to December 2014. The
dependent variable, KNOWLEDGE_ASSETS_INVESTMENT, is the amount of the firm’s
SG&A expenses scaled by sales revenue in a fiscal year. To allow enough time for firms to
adjust their subsequent knowledge assets investment in response to the exogenous IDD shock to
their level of knowledge protection when the IDD was adopted, we set the value of the indicator
variable of interest, IDD, to 1 starting from the second year after state court (in which the firm is
headquartered) adopted the IDD and 0 for all years preceding. When the previously adopted IDD
was subsequently rejected, the variable is reverted back to 0 from 1 starting from the second year
after state court (where the firm is headquartered) rejected the IDD. In the case of California, we
set the IDD indicator from 0 to 0.5 after its IDD adoption and subsequent Supreme Court
overrule, and from 0.5 to 0 after the later IDD rejection.7 In the case of North Carolina, we set
the IDD indicator from 0 to 0.5 when its state court first attempted but did not fully adopt the
IDD, and from 0.5 to 1 after its court later fully adopted the doctrine, and from 1 to 0 when its
court rejected IDD subsequently.8 The model specification is as follows:
7 Our results remain qualitatively unchanged if we set IDD to 0 for California throughout or exclude California from
the analysis.
8 Our results do not change in any qualitative manner if we set the IDD indicator in North Carolina to 0 for all years
before its court fully adopted the doctrine.

19
(1) KNOWLEDGE_ASSETS_INVESTMENTi,t = α + β1IDDs,t−2 + β2CONTROLSs,i,t−1 + ωi + μt + εi,t .
Regression (1) tests the impact of the IDD changes on knowledge assets investment,
where 𝑖 represents firm, s represents state, and t represents year. We control for various firm
characteristics, including lagged firm size, lagged market-to-book, lagged knowledge assets
investment, lagged sales growth, lagged leverage, and lagged return on assets (ROA). We also
include lagged per capita state income, lagged total state income, and lagged total state income
growth to capture the level of development, size, and growth perspective of the local economy,
as local economic conditions could affect firm knowledge assets investment. In addition, we
include firm fixed effect ωi and year fixed effect μt to control for both time-invariant
unobservable firm factors and nationwide shocks that happened during a particular year and
could affect both changes in the IDD and knowledge assets investment patterns. Thus, we
estimate the within-firm differences over time in firms’ investment in knowledge assets
(Wooldridge (2006)). Robust standard errors are clustered at the state level to address the
potential concern of within-state correlations of the regression residuals.
Table 5 presents the difference-in-differences regression results. It is clear that there is a
positive treatment effect of the IDD changes on annual knowledge assets investment. The
coefficient is statistically significant at the 5% level and, on average, amounts to 0.7% of the
annual sales revenue of a firm. This result indicates that knowledge protection enforcement after
the IDD changes stimulates firms to increase their investment in organization capital and
knowledge accumulation. The economic significance is sizable: The average annual sales of
CRSP-Compustat firms is around $786.7 million during the sample period. A 0.7% increase in

20
sales-scaled knowledge assets investment means that, compared with firms located in states that
do not adopt the IDD, an average firm will spend an extra $5.5 million investing in knowledge
assets on an annual basis after its headquarter state court adopts the IDD.
We further conduct various placebo experiments by creating fictitious changes in the IDD
around the actual changes in the law-change states. We re-estimate the difference-in-differences
regression models using these placebo IDD indicator variables. Although the coefficients of IDD
are positive in these placebo regressions, they are statistically insignificant and are decaying in
magnitude when we move further away from the actual change.
We further visualize the treatment effect of the changes in state courts’ enforcement of
the IDD on firm knowledge assets investment. Figure 1A compares the changes in knowledge
assets investment by firms headquartered in states where state courts adopted the IDD with that
of firms headquartered in states where the IDD was not changed. It is clear that the treatment and
control firms have parallel trends in knowledge assets investment before the IDD adoption, and
the treatment firms’ knowledge assets investment significantly increases relative to that of the
control firms after their headquarter state courts adopt the IDD. Similarly, the treatment and
control firms have parallel trends in knowledge assets investment before the IDD rejection, and
only the treatment firms’ knowledge assets investment significantly decreases after their
headquarter state courts reject the previously adopted doctrine (Figure 1B).
Possessing proprietary knowledge assets and organizational know-how is the key
competitive advantage for knowledge oriented firms. Those firms are more likely to invest in
developing and accumulating knowledge assets when their proprietary knowledge is protected
from being leaked to rivals. The treatment effect of the real IDD changes on the firm’s
investment in knowledge assets should be especially strong for knowledge oriented firms or

21
firms operating in knowledge oriented industries or states. To test this conjecture, we create an
indicator variable that equals 1 if a firm belongs to the top quartile of firms based on the
aforementioned different knowledge intensity variables (except the HIGH_TECH indicator)
measured at the industry-, state-, or firm-level in the past year and that equals 0 otherwise. We
construct an interaction term between the top-quartile indicator variable for knowledge intensity
and the IDD indicator and include it in the regression model that investigates the treatment effect
of the IDD changes on knowledge assets investment. Panels A and B of Table 6 report the
influence of the industry-/state-level knowledge intensity indicators and firm-level indicators,
respectively, on the changes in firms’ investment in knowledge assets after the IDD changes. All
control variables and firm and year fixed effects in the regression models of Table 5 are also
controlled for in the models of Table 6, with robust standard errors being clustered at the state
level.
Panel A of Table 6 shows that the regression coefficients of the interaction terms of IDD
with the top-quartile indicators based on different industry-level knowledge intensity proxies
(i.e., IND_RND_SALE, IND_SGA_SALE, IND_PAT_COUNT, and HIGH_TECH) are all
positive and statistically significant, confirming that the treatment effect is particularly strong for
firms in high knowledge intensity industries. Moreover, the regression coefficient of the
interaction term of IDD with the top-quartile indicator based on INDUSTRY_FINANCED_RND
is positive and statistically significant. Thus, the treatment effect of the IDD on subsequent
knowledge assets investment is stronger for firms headquartered in states with greater
connections between local research universities and related industries. This likely reflects that
firms in the states with strong connections between local universities and related industries have
to increase their knowledge assets investment after the adoption of IDD since they can no longer

22
easily rely on universities to obtain valuable knowledge assets. Similarly, Panel B shows that the
IDD treatment effect is especially strong in firms with high R&D or SG&A intensity. The
economic magnitude is substantial, as the coefficients of the interaction terms are mostly much
larger than the coefficient of the IDD indicator from the stand-alone effects of the IDD changes
on knowledge assets investment. The result is consistent with our earlier finding from the event
study, showing that knowledge protection is most relevant for knowledge oriented firms, and that
the types of firms that most heavily increase their investment in knowledge acquisitions tend to
be those that also experience the largest increase in shareholder value.
Our empirical evidence suggests that increasing the level of knowledge protection does
result in an increased incentive for firms to develop and accumulate proprietary knowledge
assets and organizational know-how. This treatment effect of the IDD on subsequent knowledge
assets investment is especially strong for knowledge oriented firms or firms operating in
knowledge oriented industries or states.
C. Geographic Dispersion and the Effect of the IDD
Our analyses focus on the IDD-change events in firm headquarter states because
headquarters are close to corporate core business activities, and employees who have access to
key proprietary knowledge are likely to be concentrated at headquarters (Pirinsky and Wang
(2006)). As changes in a state court’s enforcement of the IDD only affect the level of proprietary
knowledge protection within that state, for those firms whose business operations are
geographically dispersed, we conjecture that the effect of headquarter state IDD-change event on
such firms’ stock price and subsequent knowledge assets investment should be weaker. Garcia
and Norli (2012) develop a measure of firm geographic dispersion based on the number of U.S.
23
states mentioned in the firm’s annual 10-K report. The idea is that firm’s business operations are
likely to be more geographically dispersed if more states are mentioned in its annual report. In
each year, we classify firms in the top quartile of state name count within each 2-digit SIC
industry as geographically dispersed firms.9 We expect weaker effects of headquarter state IDD
changes on such geographically dispersed firms.
Panel A of Table 7 shows that the cumulative abnormal returns on headquarter state IDD-
change events are large in magnitude and highly significant for firms that are geographically
non-dispersed. In contrast, Panel B shows that CARs are much smaller in magnitude and less
significant for geographically dispersed firms. To examine the heterogeneous impact of the IDD
changes on knowledge assets investment across geographically dispersed and non-dispersed
firms, we construct an interaction term of the IDD indicator with the top-quartile geographic
dispersion indicator. Model 4 in Panel B of Table 6 shows that the regression coefficient of this
interaction term is significantly negative and similar in magnitude to the regression coefficient of
IDD, which suggests that the treatment effect of the IDD changes on knowledge assets
investment is mainly concentrated in geographically non-dispersed firms. These results lend
further support to our main findings of state court’s enforcement of the IDD on firms’
shareholder value and knowledge assets investment.
9 Firms in retail, wholesale, and transportation industries have a large percentage of employees that are geographically
dispersed (Agrawal and Matsa (2013)). In an earlier version of the paper, we find that for such firms, abnormal stock
returns on IDD events are almost 0 and there is no IDD treatment effect on knowledge assets investment. Therefore,
we exclude such firms from the sample before partitioning the sample according to the geographic dispersion measure
of Garcia and Norli (2012). Data for geographic dispersion, which covers the sample period of 1992 to 2008, are
downloaded from Diego Garcia’s research website. We thank Diego Garcia for generously sharing the data.

24
D. The Influence of Neighboring-State IDD Adoption and Rejection
A potential concern is that the IDD changes may not be fully exogenous. Specifically,
time-varying local market characteristics might affect both justices’ decisions in the IDD court
rulings and firm stock price reactions/knowledge assets investment, leading to spurious relations.
We run a test to examine whether the timing and decision of the IDD changes might be
influenced by time-varying local economic/political forces. The results in Table A3 of the
Appendix fail to depict a clear relationship between the local economic/political conditions and
the timing and decision of the IDD changes. However, this test cannot rule out the potential
effect of omitted time-varying state characteristics on the IDD court rulings.
To address this concern, we examine the reactions of firms located in states that are
contiguous to the state that changes the level of IDD enforcement. This test can be viewed as a
cross-sectional placebo test and its merit relies on the fact that, as contiguous states are
geographically closely located, they are likely to subject to the same time-varying local market
dynamics, such as trends in economic development and shocks to the local economy (e.g.,
resource discovery, natural hazards, etc.). If unobserved/uncontrolled time-varying local
dynamics drive both the IDD enforcement changes and firm stock price reactions/knowledge
assets investment, we should expect firms’ stock price and knowledge assets investment to move
in a similar fashion as that observed in Table 3 and 5 when the level of IDD enforcement
changes in neighboring state. In contrast, if it is the actual state-specific changes in IDD
enforcement that drive firm stock price reactions and knowledge assets investment in the law-
change state, we should not expect any reaction for firms located in neighboring state where no
change happened to the level of knowledge protection.

25
The results in Panel A of Table 8 show that firm stock price reactions to neighboring-
state IDD rulings are much smaller in magnitude as compared to the results from Table 3 and are
largely statistically insignificant. The results in Panel B further show that neighboring-state IDD
changes have no effect on firm subsequent knowledge assets investment in the focal state. This
finding of little impact of neighboring-state court rulings on focal-state firm stock price and
knowledge assets investment further confirms that our main findings are most likely driven by
the state-specific changes in knowledge protection enforcement rather than by uncontrolled time-
varying local market factors.
E. The Influence of Knowledge Protection on Local Entrepreneurship Activity
Prior literature (see, e.g., Acs, Braunerhjelm, Audretsch, and Carlsson (2009)) argues that
knowledge spillovers encourage entrepreneurship. Thus, a potential “dark side” of enforcing
knowledge protection is that it may deter entrepreneurial activity, which is a key contributor for
economic development. As firms can better protect their proprietary knowledge, it might become
more difficult for entrepreneurs, who often start small businesses providing goods and services
similar to those of existing players, to benefit from knowledge spillovers. Does knowledge
protection harm local entrepreneurial activity while contributing to existing firms’ shareholder
value? This section provides evidence on the effect of the IDD changes on local entrepreneurial
activity.
We collect data on the number of new firms and job creation related to new firms from
the Census Business Dynamics Statistics (BDS) database. We run a difference-in-differences
regression following a structure similar to equation (1) to study the potential treatment effect of
the IDD changes on local entrepreneurial activity. The analyses are conducted using yearly state-

26
level panel data that cover the period from January 1960 to December 2014. Results are reported
in Table 9. In Panel A, the dependent variable is the number of firms started up in a state scaled
by state population in a year; in Panel B, the dependent variable is the number of new jobs
created by new startups scaled by state population in a year. We control for various state
characteristics, year and state fixed effects, and cluster the standard errors at the state level.
We find that enhancing knowledge protection via the IDD does not seem to pose a threat
to local entrepreneurial activity or to the new jobs created by startups; the average impact of the
IDD on firm creation and that of the IDD on job creation by new startups are both positive albeit
statistically insignificant. We hence conclude that enhancing local knowledge protection through
the IDD does not discourage local entrepreneurial activity.
IV. Conclusion
There has been a century-long debate on how a society should allow for knowledge
protection (see, e.g., Mercurio (2010) for a summary of the debate). Knowledge protection
stimulates innovation, as it restricts knowledge sharing by granting intellectual property rights
(e.g., copyright, patent, and industrial design rights) only to the knowledge generator. At the
same time, there is a strong public voice against the protection of intellectual property as it
restrains positive knowledge externalities among industry peers. This debate exists in many
fields, and questions such as whether we should have open-source software have yet to be
answered. Little empirical evidence has been documented thus far on the impact of knowledge
protection on shareholder value and knowledge assets investment, as it is difficult to capture real
changes in firms’ levels of knowledge protection. In this paper, we employ the staggered
adoption of the IDD (rejection of the previously adopted IDD) by the U.S. state courts as
27
exogenous changes in the level of knowledge protection. We examine firms’ stock price
reactions and changes in knowledge assets investment following the changes in the IDD. Our
findings help illuminate the role of knowledge protection in today’s knowledge-based economy.
One important channel for proprietary knowledge leaks is through employee job changes.
The IDD is designed to prevent such knowledge spillovers. It enhances the protection of a firm’s
proprietary knowledge but also makes it more difficult for the firm to obtain new knowledge
from other firms or institutions. Thus, the impact of IDD adoption/rejection by a state court on
shareholder value is an empirical issue. We find that the adoption of the IDD on average leads to
significantly positive abnormal stock returns around the adoption day for firms headquartered in
that state, while the rejection of the previously adopted IDD on average leads to significantly
negative abnormal returns. Using a difference-in-differences regression framework, we further
uncover a positive causal relationship between the adoption of the IDD by a state court and
firms’ subsequent investment in knowledge assets. Moreover, we find that the effect of the IDD-
change events on shareholder value and firms’ subsequent knowledge assets investment is
stronger for firms and industries that are more knowledge oriented. Finally, we find that
enhancing knowledge protection via the IDD does not discourage local entrepreneurial activity.
Our paper highlights the positive impact of knowledge protection for firms. Firms, on
average, experience positive abnormal stock returns and increase their investment in knowledge
assets after the law enforcement of knowledge protection is strengthened. The effect is
economically significant: For an average firm in the United States, the strengthening of law
enforcement of knowledge protection will lead to an increase in its knowledge-assets spending
by 0.7% of its annual sales, which is equivalent to an additional $5.5 million invested annually in
knowledge assets for an average firm. This result means that after knowledge protection is

28
enhanced, an average U.S. state will experience a significant surge in knowledge assets
investment from the private sector, equivalent to $453.5 million averaged at the state-aggregate
level on an annual basis. Our analyses further show that enhancing knowledge protection neither
harms local entrepreneurial activity nor depresses job creations at new startups. The study adds
new evidence to the longstanding debate on whether production-related knowledge should be
allowed to move freely among firms.

29
References
Acharya, V., R. Baghai, and K. Subramanian. “Wrongful Discharge Laws and Innovation.”
Review of Financial Studies, 27 (2013), 301-346.
Acs, Z., P. Braunerhjelm, D. Audretsch, and B. Carlsson. “The Knowledge Spillover Theory of
Entrepreneurship.” Small Business Economics, 32 (2009), 15-30.
Agrawal, A., and D. Matsa. “Labor Unemployment Risk and Corporate Financing Decisions.”
Journal of Financial Economics, 108 (2013), 449-470.
Almeida, P., and B. Kogut. “Localization of Knowledge and the Mobility of Engineers in
Regional Networks, Management Science, 45 (1999), 905–917.
Atkeson, A., and P. Kehoe. “Modeling and Measuring Organization Capital.” Journal of
Political Economy, 113 (2005), 1026-1053.
Arrow, K. “The Economic Implications of Learning by Doing.” Review of Economic Studies, 29
(1962), 155-173.
Banker, R., R. Huang, and R. Natarajan. “Equity Incentives and Long-Term Value Created by
SG&A Expenditure.” Contemporary Accounting Research, 28 (2011), 794-830.
Becker, G. “Human Capital: A Theoretical and Empirical Analysis, with Special Reference to
Education.” 3rd ed., Chicago: University of Chicago Press (1993).
Bloom, N., R. Sadun, and J. Van Reenen. “Americans Do IT Better: US Multinationals and the
Productivity Miracle.” American Economic Review, 102 (2012), 167-201.
Breschi, S., and F. Lissoni. “Knowledge Spillovers and Local Innovation Systems: A Critical
Survey.” Industrial and Corporate Change, 10 (2001), 975-1005.
Chen, X., J. Harford, and K. Li. “Monitoring: Which Institutions Matter?” Journal of Financial
Economics, 86 (2007), 279-305.

30
Eisfeldt, A., and D. Papanikolaou. “Organization Capital and the Cross-Section of Expected
Returns.” Journal of Finance, 68 (2013), 1365-1406.
Ellison, G., E. Glaeser, and W. Kerr. “What Causes Industry Agglomeration? Evidence from
Coagglomeration Patterns.” American Economic Review, 100 (2010), 1195-1213.
Ericson, R., and A. Pakes. “Markov-Perfect Industry Dynamics: A Framework for Empirical
Work.” Review of Economic Studies, 61 (1995), 53-82.
Fallick, B., C. Fleischman, and J. Rebitzer. “Job-Hopping in Silicon Valley: Some Evidence
Concerning the Microfoundations of a High-Technology Cluster.” Review of Economics
and Statistics, 88 (2006), 472-481.
Falvey, R., N. Foster, and D. Greenaway. “Intellectual Property Rights and Economic Growth.”
Review of Development Economics, 10 (2006), 700-719.
Fama, E. “Market Efficiency, Long-Term Returns, and Behavioral Finance.” Journal of
Financial Economics, 49 (1998), 283-306.
Flammer, C., and A. Kacperczyk. “The Risk of Knowledge Spillovers and Corporate Social
Responsibility: Evidence from the Inevitable Disclosure Doctrine.” Working Paper,
Massachusetts Institute of Technology (2016).
Garcia, D., and O. Norli. “Geographic Dispersion and Stock Returns.” Journal of Financial
Economics, 106 (2012), 547-565.
Garmaise, M. “Ties that Truly Bind: Noncompetition Agreements, Executive Compensation, and
Firm Investment.” Journal of Law, Economics, and Organization, 27 (2011), 376-425.
Geng, H., H. Hau, and S. Lai. “Technological Progress and Ownership Structure.” Working
Paper, University of Hong Kong (2014).

31
Gould, D., and W. Gruben. “The Role of Intellectual Property Rights in Economic Growth.”
Journal of Development Economics, 48 (1996), 323-350.
Graves, C., and J. DiBoise. “Do Strict Trade Secret and Non-Competition Laws Obstruct
Innovation?” Entrepreneurial Business Law Journal, 1 (2006), 323-344.
Hall, R. “E-Capital: The Link between the Stock Market and the Labor Market in the 1990s.”
Brookings Papers on Economic Activity (2000).
Hellmann, T., and E. Perotti. “The Circulation of Ideas in Firms and Markets.” Management
Science, 57 (2011), 1813-1826.
Hyde, A. “Working in Silicon Valley: Economic and Legal Analysis of a High-Velocity Labor
Market.” New York, NY: M.E. Sharpe (2003).
Jaffe, A. B., M. Trajtenberg, and R. Henderson. “Geographic Localization of Knowledge
Spillovers as Evidenced by Patent Citations.” Quarterly Journal of Economics, 108
(1993), 577-98.
Jovanovic, B. “Job Matching and the Theory of Turnover.” Journal of Political Economy, 87
(1979), 972-990.
Jovanovic, B., and P. Rousseau. “Vintage Organization Capital.” NBER Working Papers 8166
(2001).
Kahnke, R., and K. Bundy. “The Secrets to Winning Trade Secret Cases.” New York, NY:
Thomson Reuters Westlaw (2013).
Kahnke, R., K. Bundy, and K. Liebman. “Doctrine of Inevitable Disclosure.” Faegre & Benson
LLP (2008).
Kantor, S., and A. Whalley. “Knowledge Spillovers from Research Universities: Evidence from
Endowment Value Shocks.” Review of Economics and Statistics, 96 (2014), 171-188.

32
Klasa, S., H. Ortiz-Molina, M.A. Serfling, and S. Srinivasan. “Protection of Trade Secrets and
Capital Structure Decisions.” Working Paper, University of Arizona (2014).
Koh, P.-S., and D. Reeb. “Missing R&D.” Journal of Accounting and Economics, 60 (2015), 73-
94.
Krugman, P. “Geography and Trade.” Cambridge, MA: MIT Press (1991).
La Porta, R., F. Lopez-de-Silanes, A. Shleifer, and R. Vishny. “Law and Finance.” Journal of
Political Economy, 106 (1998), 1113-1155.
La Porta, R., F. Lopez-de-Silanes, A. Shleifer, and R. Vishny. “Investor Protection and
Corporate Valuation.” Journal of Finance, 57 (2002), 1147-1170.
Li, K., B. Qiu, and R. Shen. “Organization Capital and Mergers and Acquisitions.” Working
Paper, University of British Columbia (2016).
Liebeskind, J.P.. “Knowledge, Strategy and the Theory of the Firm.” Strategic Management
Journal, 17 (1996), 93-107.
Lincicum, D. “Inevitable Conflict?: California's Policy of Worker Mobility and the Doctrine of
‘Inevitable Disclosure’.” Southern California Law Review, 75 (2002), 1257-1280.
Lev, B., and S. Radhakrishnan. “The Valuation of Organization Capital.” In: Corrado, C., J.
Haltiwanger, and D. Sichel (Eds.), Measuring Capital in the New Economy, Chicago:
University of Chicago Press (2005), 73-110.
Lev, B., S. Radhakrishnan, and W. Zhang. “Organizational Capital.” Abacus, 45 (2009), 275-
298.
Leung, W.S., K. Mazouz, and J. Chen. “Organization Capital, Labor Market Flexibility and
Stock Returns around the World.” Working Paper, Cardiff University (2015).

33
Lerner, J. “The Empirical Impact of Intellectual Property Rights on Innovation: Puzzles and
Clues.” American Economic Review, 99 (2009), 343-348.
Lucas, R. “On the Mechanics of Economic Development.” Journal of Monetary Economics, 22
(1988), 3–42.
Malsberger, B., A. Pedowitz, and S. Brock. “Trade Secrets: A State-by-State Survey.” Arlington,
VA: Bloomberg BNA (2015), Fifth edition.
Marshall, A. “Principles of Economics.” London: MacMillan (1920).
Marshall, A. “Principles of Economics: An Introductory Volume.” 8th ed., London: Macmillan
(1930).
Marx, M., D. Strumsky, and L. Fleming. “Mobility, Skills, and the Michigan Non-Compete
Experiment.” Management Science, 55 (2009), 875-889.
Matusik, S., and C. Hill. “The Utilization of Contingent Work, Knowledge Creation, and
Competitive Advantage.” Academy of Management Review, 23 (1998), 680-697.
Mercurio, B. “Reconceptualising the Debate on Intellectual Property Rights and Economic
Development.” The Law and Development Review, 3 (2010), 65-107.
McGrattan, E.R., and E.C. Prescott. “Unmeasured Investment and the Puzzling US Boom in the
1990s.” American Economic Journal: Macroeconomics, 2 (2010), 88-123.
Park, W., and J. Ginarte. “Intellectual Property Rights and Economic Growth.” Contemporary
Economic Policy, 15 (1997), 51-61.
Pirinsky, C., and Q. Wang. “Does Corporate Headquarters Location Matter for Stock Returns?”
Journal of Finance, 61 (2006), 1991-2015.
Png, I.P.L., and S. Samila. “Trade Secrets Law and Engineer/Scientist Mobility: Evidence from
‘Inevitable Disclosure’.” Working Paper, National University of Singapore (2013).

34
Porter, M. “On Competition.” Boston, MA: Harvard Business School Press (1998).
Prescott, E., and M. Visscher. “Organization Capital.” Journal of Political Economy, 88 (1980),
446-461.
Romer, P. “Increasing Returns and Long-Run Growth.” Journal of Political Economy, 94
(1986), 1002-1037.
Rosen, S. “Learning by Experience as Joint Production.” Quarterly Journal of Economics, 86
(1972), 366-382.
Samila, S., and O. Sorenson. “Venture Capital, Entrepreneurship, and Economic Growth.”
Review of Economics and Statistics, 93 (2011), 338-349.
Taylor, M. “Trips, Trade, and Growth.” International Economic Review, 35 (1994), 361-381.
Tomer, J. “Organizational Capital: The Path to Higher Productivity and Wellbeing.” New York:
Praeger (1987).
Wang, T. “To Build or to Buy? The Role of Local Information in Credit Market Development.”
Working Paper, Federal Reserve Board (2016).
Wiesner, R. “A State-by-State Analysis of Inevitable Disclosure: A Need for Uniformity and a
Workable Standard.” Marquette Intellectual Property Law Review, 16 (2012), 211-231.
Wooldridge, J. “Introductory Econometrics: A Modern Approach.” 3rd Edition, South-Western,
Cincinnati, OH (2006).
Younge, K., and M. Marx. “The Value of Employee Retention: Evidence from a Natural
Experiment.” Journal of Economics & Management Strategy, 25 (2016), 652-677.
Zhang, R. “Competition and SG&A spending.” Working Paper, University of Alberta (2014).
Zhao, M. Conducting R&D in Countries with Weak Intellectual Property Rights Protection,
Management Science, 52 (2006), 1185-1199.

35
Zucker, L., M. Darby, and M. Brewer. “Intellectual Human Capital and the Birth of U.S.
Biotechnology Enterprises.” American Economic Review, 88 (1998), 290-306.
36
Table 1. Adopting and Rejecting the IDD
Table 1 lists the legal cases in which state courts adopted the Inevitable Disclosure Doctrine (IDD) or rejected the previously adopted IDD.
State Case Date Status
Arkansas Southwestern Energy v. Eickenhorst, 955 F. Supp. 1078 (1997). March 18, 1997 Adopt
California Electro Optical Indus., Inc. v. Stephen White, 90 Cal.Rptr.2d 680 (1999), 76 Cal. App. 4th 653 November 30, 1999 Adopt
California Supreme Court Overrule April 12, 2000 Reject
California Whyte v. Schlage Lock Co., No. G028382 (Ct. of App. of California 2002) September 12, 2002 Reject
Connecticut Branson Ultrasonics Corp. v. Stratman, 921 F. Supp. 909 (D. Conn. 1996) February 28, 1996 Adopt
Delaware E.I. DuPont de Nemours & co v. American Potash and Chemical Corp, 200 A. 2d 428 (Del Ch. 1964) May 5, 1964 Adopt
Florida Fountain v. Hudson Cush-N-Foam Corp., 122 So. 2d 232, 234 (Fla. Dist. Ct. App. 1960) July 11, 1960 Adopt
Florida Del Monte Fresh Produce Co. v. Dole Food Co., 148 F. Supp. 2d 1326 (S.D. Fla. 2001) May 24, 2001 Reject
Iowa Barilla Am., Inc. v. Wright, No. 4-02-CV-90267, 2002 U.S. Dist. Lexis 12773 (S.D. Iowa 2002) July 5, 2002 Adopt
Illinois PepsiCo, Inc. v. Redmond, 54 F.3d 1262, 1272 (7th Cir. 1995) May 11, 1995 Adopt
Indiana Ackerman v. Kimball Int'l, Inc., 652 N.E.2d 507, 510-11 (Ind. 1995). July 12, 1995 Adopt
Indiana Bridgestone/Firestone, Inc. v. Lockhart, 5 F. Supp. 2d 667 (S.D. Ind. 1998) May 7, 1998 Reject
Kansas Bradbury Co. v. Teissier-Ducros, 413 F. Supp. 2d 1203, 1209 (D. Kan. 2006) February 2, 2006 Adopt
Massachusetts Marcam Corp. v. Orchard, 885 F. Supp. 294, 298-300 (D. Mass. 1995) April 3, 1995 Adopt
Massachusetts U.S. Elec. Servs. v. Schmidt, Civil Action No. 12-10845-DJC (U.S. Dist. CT. for the Dist. of Mass. 2012) June 19, 2012 Reject
Michigan Allis-Chalmers Manufacturing Co. v. Continental Aviation & Engineering Corp., 255 F. Supp. 645, 654 (E.D. Mich.1966) February 17, 1966 Adopt
Michigan CMI International Inc. v. Intermet Inter. Corp., 649 N.W.2d 808 (Mich. Ct. App.2002) April 30, 2002 Reject
Minnesota Surgidev Corp. v. Eye Tech., Inc., 648 F. Supp. 661 (D. Minn. 1986) October 10, 1986 Adopt
Minnesota IBM Corp. v. Seagate Tech., Inc., 941 F. Supp. 98 (D. Minn. 1992) April 21, 1992 Reject
Minnesota La Calhene, Inc. v. Spolyar, 938 F. Supp. 523 (W.D. Wis. 1996) August 23, 1996 Adopt
Missouri H&R Block Eastern Tax Services, Inc. v. Enchura, 122 F.Supp. 2d 1067 (W.D.Mo. 2000). November 2, 2000 Adopt
New Jersey National Starch and Chem. Corp. v. Parker Chemical Corp., 530 A.2d 31 (N.J. Super. Ct. App. Div. 1987) April 27, 1987 Adopt
New York DoubleClick, Inc. v. Henderson, No. 116914/97, 1997 N.Y. Misc. Lexis 577 (Sup. Ct. N.Y. Co. Nov. 7, 1997) November 7, 1997 Adopt
New York EarthWeb, Inc. v. Schlack, 71 F. Supp. 2d 299 (S.D.N.Y. 1999) Oct. 27, 1999 Reject
North Carolina Travenol Labs., Inc. v. Turner, 228 S.E.2d 478, 483 (N.C. Ct. App. 1976) October 6, 1976 Adopt
North Carolina Merck & Co. v. Lyon, 941 F. Supp. 1443 (M.D.N.C. 1996) September 11, 1996 Adopt
North Carolina RCR Enters., LLC v. McCall, 14 CVS 3342 (N.C. Sup. Ct. 2014) December 19, 2014 Reject
Ohio Procter & Gamble Co., v. Stoneham, 747 N.E.2d 268 (Ohio Ct. App. 2000) September 29, 2000 Adopt
Pennsylvania Air Products & Chemical, Inc. v. Johnson, 442 A.2d 1114 (Pennsylvania Superior Ct. 1982) February 19, 1982 Adopt
South Carolina Nucor Corp. v. Bell, C/A No. 2: 06-CV-02972-DCN (U.S. Dist. Ct. for the Dist. of South Carolina 2008) March 14, 2008 Adopt
Texas Rugen v. Interactive Bus. Sys., Inc., 864 S.W.2d 548, 551 (Tex. App. 1993) May 28, 1993 Adopt
Texas Cardinal Health Staffing Network Inc. v. Bowen, 106 S.W.3d 230 (Tex. App. 2003) April 3, 2003 Reject
Utah Novell, Inc. v. Timpanogos Research Group, Inc., 46 U.S.P.Q.2d 1197 (Utah Dist. Ct. 1998). January 30,1998 Adopt
Washington Solutec Corp, Inc. v. Agnew, 1997 WL 794496, 8 (Wash. Ct. App.) December 30, 1997 Adopt

37
Table 2. Sample Description
Table 2 reports descriptive statistics of our sample. The sample consists of 4,535 firm events in which
firms’ headquarter state adopted the IDD and 3,857 firm events in which firms’ headquarter state rejected the
previously adopted IDD and covers the period from January 1960 to December 2014. A detailed description of the
variables is presented in Table A1 of the Appendix. All dollar values are in 2014 constant dollars. All continuous
variables are winsorized at the 1st and 99th percentiles. We report the means, medians, standard deviations, 25th
percentiles, 75th percentiles, and numbers of observations for the variables used in our study.
Variable Mean Median Std. Dev. P25 P75 Obs.
CAR (-5,5) 0.470 -0.038 13.492 -5.923 6.098 8392
CAR (-2,2) -0.719 -0.221 10.924 -4.437 3.877 8392
CAR (-1,1) -0.276 0.021 7.666 -3.284 3.042 8392
State-level variables
PER_CAPITA_STATE_INCOME 10.582 10.620 0.142 10.528 10.654 8386
TOTAL_STATE_INCOME 20.208 20.485 0.826 19.533 21.024 8386
STATE_INCOME_GROWTH 0.060 0.058 0.023 0.049 0.076 8386
INDUSTRY_FINANCED_RND 2.836 2.853 0.101 2.778 2.884 7556
Industry-level variables
IND_RND_SALE 2.956 1.637 3.030 0.082 5.739 8391
IND_SGA_SALE 18.727 19.605 8.733 12.630 25.655 8391
IND_PAT_COUNT 4.959 5.338 3.013 2.079 7.980 8392
HIGH_TECH 0.346 0.000 0.476 0.000 1.000 8392
Firm Characteristics
RND_SALE 0.217 0.000 0.788 0.000 0.089 8392
SGA_SALE 0.384 0.233 0.619 0.098 0.401 8392
PATENT_COUNT 0.370 0.000 0.874 0.000 0.000 8392
FIRM_SIZE 5.324 5.130 2.066 3.811 6.665 8392
MARKET-TO-BOOK 3.328 1.826 5.742 1.057 3.556 8392
PAST_STOCK_RETURN 18.272 4.000 72.273 -18.750 30.557 8392
GEOGRAPHIC_DISPERSION 6.955 5 6.940 3 9 5502

38
Table 3. Adoption and Rejection of the IDD and Firm Stock Price Reactions
Table 3 reports the event study results of the impact of states’ adoptions of the IDD and rejections of the
previously adopted IDD on stock returns of firms headquartered in the event states. The sample consists of 4,535
firm events in which firms’ headquarter state adopts IDD and 3,857 firm events in which firms’ headquarter state
rejects IDD and covers the period from January 1960 to December 2014. We report the mean of the 11-day, 5-day,
and 3-day cumulative abnormal returns (CARs) during an event window of (−5, +5), (−2, +2), (−1, +1) surrounding
the adoptions and rejections of the IDD. We calculate CARs using both the market-adjusted model and the market
model. We use the CRSP value-weighted stock market returns (including dividends) as the market portfolio. Robust
standard errors shown in parentheses are clustered at the state level to account for within-state cross-sectional
correlations. ***, **, and * correspond to statistical significance at the 1%, 5%, and 10% levels, respectively.
Market-Adjusted Model Market Model
CAR
(-5,5)
CAR
(-2,2)
CAR
(-1,1)
CAR
(-5,5)
CAR
(-2,2)
CAR
(-1,1)
Obs.
IDD Adoptions 1.483*** 0.978*** 0.538*** 0.758* 0.528** 0.034
4,535 (0.518) (0.273) (0.184) (0.411) (0.233) (0.145)
IDD Rejections -0.720 -2.714** -1.233** -2.160* -4.147*** -1.870*** 3,857
(1.025) (1.143) (0.536) (1.261) (1.613) (0.695)

39
Table 4. Knowledge Intensity and Firms’ Abnormal Stock Returns during Events of IDD
Adoption and Rejection
Table 4 reports the results of OLS regressions that investigate the influence of different variables of
knowledge intensity at industry-, state- and firm-level on firms’ 5-day cumulative abnormal returns (CAR (-2,2))
during an event window surrounding the adoption of the IDD or rejection of the previously adopted IDD in states
where firms’ headquarters are located. Detailed description of the variables is presented in Table A1 of the
Appendix. The dependent variable is CAR (-2,2) estimated using market-adjusted model. Panel A and B report the
results of OLS regressions of the influence of industry-/state-level and firm-level variables on CAR (-2,2) during
events of IDD adoptions and rejections, respectively. Robust standard errors are clustered at the state level to
account for within-state cross-sectional correlations in regression residuals and are shown in parentheses. ***, **,
and * correspond to statistical significance at the 1%, 5%, and 10% levels, respectively.
Panel A. The Influence of Industry- and State-Level Knowledge Intensity Variables on CAR (-2,2) during IDD Adoption and Rejection
Dep. Var.: CAR (-2,2) IDD Adoptions IDD Rejections
Model 1 Model 2 Model 3 Model 4 Model 5 Model 6 Model 7 Model 8 Model 9 Model 10
Industry-/state-level variables
IND_RND_SALE t-1 11.376 -24.203*
(9.548) (14.370)
IND_SGA_SALE t-1 2.973 -7.627
(2.504) (4.912)
IND_PAT_COUNT t-1 0.124 -0.534* (0.105) (0.283)
HIGH_TECH t-1 0.654 -3.131**
(0.806) (1.531)
INDUSTRY_FINANCED_RND t-1 -4.715 31.074*
(4.548) (16.454)
Controls
FIRM_SIZE t-1 -0.284*** -0.275*** -0.290*** -0.283*** -0.320*** -0.167 -0.182 -0.148 -0.156 -0.135
(0.103) (0.098) (0.107) (0.101) (0.114) (0.222) (0.240) (0.211) (0.199) (0.262)
MARKET-TO-BOOK t-1 -0.050** -0.049* -0.045 -0.047* -0.026 -0.287*** -0.284*** -0.289*** -0.288*** -0.305***
(0.025) (0.026) (0.028) (0.026) (0.030) (0.046) (0.039) (0.052) (0.052) (0.063)
PAST_STOCK_RETURN t-1 0.013** 0.013** 0.013** 0.013** 0.015** -0.061*** -0.062*** -0.060*** -0.060*** -0.065***
(0.006) (0.006) (0.006) (0.006) (0.007) (0.006) (0.006) (0.005) (0.005) (0.007)
PER_CAPITA_STATE_INCOME t-1 -0.422 0.476 -0.744 0.064 4.815*** 1.641 -0.586 1.092 0.936 -9.699
(3.649) (3.599) (3.752) (3.585) (1.776) (4.308) (5.193) (4.550) (4.797) (7.749)
TOTAL_STATE_INCOME t-1 -0.256 -0.317 -0.250 -0.248 0.283 -0.086 -0.006 0.008 -0.047 -4.299**
(1.023) (1.071) (1.029) (1.025) (0.381) (0.684) (0.514) (0.568) (0.678) (1.915)
STATE_INCOME_GROWTH t-1 21.636 23.685* 22.539* 23.458** 14.661 -9.183 -5.850 -8.992 -5.578 -16.462
(13.394) (12.352) (12.354) (11.671) (15.622) (9.026) (12.368) (9.636) (10.949) (15.547)
Year Fixed Effects Yes Yes Yes Yes Yes Yes Yes Yes Yes Yes
State Fixed Effects Yes Yes Yes Yes No Yes Yes Yes Yes No
Intercept Yes Yes Yes Yes Yes Yes Yes Yes Yes Yes
Obs. 4,531 4,531 4,532 4,532 4,050 3,854 3,854 3,854 3,854 3,506
Adj. R2 0.029 0.028 0.028 0.028 0.028 0.316 0.314 0.319 0.318 0.317

40
Panel B. The Influence of Firm-Level Knowledge Intensity Variables on CAR (-2,2) during IDD Adoption and
Rejection
Dep. Var.: CAR (-2,2) IDD Adoptions IDD Rejections
Model 1 Model 2 Model 3 Model 4 Model 5 Model 6
Firm-level variables
RND_SALE t-1 0.625*** -0.823*
(0.235) (0.428)
SGA_SALE t-1 0.027 -2.372*** (0.249) (0.784)
PATENT_COUNT t-1 0.200 -0.325* (0.220) (0.167)
Controls
FIRM_SIZE t-1 -0.278*** -0.294*** -0.328** -0.171 -0.270 -0.089
(0.105) (0.108) (0.141) (0.238) (0.278) (0.238)
MARKET_TO_BOOK t-1 -0.048 -0.038 -0.037 -0.304*** -0.268*** -0.319***
(0.030) (0.033) (0.032) (0.059) (0.043) (0.063)
PAST_STOCK_RETURN t-1 0.014** 0.014** 0.014** -0.062*** -0.062*** -0.063***
(0.007) (0.007) (0.007) (0.007) (0.007) (0.007)
PER_CAPITA_STATE_INOME t-1 -0.342 0.079 -0.110 1.258 0.588 0.322
(3.490) (3.711) (3.676) (4.728) (5.172) (4.907)
TOTAL_STATE_INCOME t-1 -0.234 -0.226 -0.221 -0.094 0.124 -0.024
(1.005) (1.012) (1.010) (0.622) (0.471) (0.547)
STATE_INCOME_GROWTH t-1 20.668 21.841* 22.039* -14.085* -10.488 -11.926
(13.202) (12.762) (12.730) (7.812) (9.724) (8.695)
Year Fixed Effects Yes Yes Yes Yes Yes Yes
State Fixed Effects Yes Yes Yes Yes Yes Yes
Intercept Yes Yes Yes Yes Yes Yes
Obs. 4,532 4,532 4,532 3,854 3,854 3,854
Adj. R2 0.029 0.027 0.027 0.310 0.321 0.307

41
Table 5. Difference-in-Differences Analysis of Knowledge Protection on Firms’ Investment in
Knowledge Assets
Table 5 presents estimated coefficients from difference-in-differences (DD) analyses of the impact of actual
and fictitious changes in the IDD on firms’ investment in knowledge assets using OLS regressions. We test the
impact of the actual adoption of the IDD and rejection of the previously adopted IDD as well as the placebo
experiments on knowledge assets investment. For the placebo experiments, we create fictitious changes in the IDD
that take place one and three years before, as well as one and three years after, the real changes in the IDD in each
law-change state. The dependent variable is the amount of annual SG&A expenses scaled by sales revenue, which
reflects the firm’s investment in knowledge assets. The coefficient on IDD captures the difference-in-differences
estimate of the impact of the actual and fictitious IDD adoptions/rejections on firms’ investment on knowledge
assets. We control for lagged firm and state characteristics, firm fixed effects, and year fixed effects in all
regressions. The analyses are conducted using yearly panel data that cover the period from January 1960 to
December 2014. Detailed description of the variables is presented in Table A1 of the Appendix. All dollar values are
in 2014 constant dollars. All continuous variables are winsorized at the 1st and 99th percentiles. Robust standard
errors are clustered at the state level to account for within-state correlations in regression residuals and are shown in
parentheses. ***, **, and * correspond to statistical significance at the 1%, 5%, and 10% levels, respectively.

42
Dep. Var.:
KNOWLEDGE_ASSETS_INV’T
Placebo change 3
years before the
actual change
Placebo change 1
year before the
actual change
Actual IDD
change
Placebo change 1
year after the
actual change
Placebo change 3
years after the
actual change
IDD/Placebo IDD 0.002 0.005 0.007** 0.004 0.003
(0.004) (0.004) (0.003) (0.003) (0.004)
Controls
FIRM_SIZE t-1 -0.004** -0.004** -0.003 -0.004** -0.002
(0.002) (0.002) (0.002) (0.002) (0.002)
MARKET-TO-BOOK t-1 0.001 0.000 0.000 0.000 0.000
(0.001) (0.000) (0.001) (0.001) (0.001)
KNOWLEDGE_ASSETS_INV’T t-1 0.486*** 0.458*** 0.435*** 0.434*** 0.444***
(0.026) (0.019) (0.016) (0.015) (0.018)
SALES_GROWTH t-1 -0.007* -0.007* -0.003 -0.003 -0.002
(0.004) (0.004) (0.003) (0.003) (0.003)
LEVERAGE t-1 -0.043*** -0.048*** -0.049*** -0.051*** -0.047***
(0.010) (0.009) (0.010) (0.011) (0.011)
ROA t-1 -0.037** -0.042*** -0.048*** -0.051*** -0.032*
(0.018) (0.014) (0.014) (0.015) (0.018)
PER_CAPITA_STATE_INCOME t-1 0.055** 0.051** 0.049** 0.051** 0.054*
(0.027) (0.024) (0.024) (0.025) (0.030)
TOTAL_STATE_INCOME t-1 -0.006 -0.006 -0.009 -0.006 -0.005
(0.006) (0.008) (0.008) (0.008) (0.008)
STATE_INCOME_GROWTH t-1 0.050 0.037 0.040 0.045 0.040
(0.050) (0.048) (0.053) (0.059) (0.051)
Year Fixed Effects Yes Yes Yes Yes Yes
Firm Fixed Effects Yes Yes Yes Yes Yes
Intercept Yes Yes Yes Yes Yes
Obs. 143,416 169,711 183,633 187,606 170,593
Adj. R2 0.710 0.705 0.702 0.704 0.700

43
Table 6. Knowledge Intensity and the Effect of Knowledge Protection on Firms’ Investment in
Knowledge Assets
Table 6 presents estimated coefficients of the impact of the interactions between the IDD indicator and
various industry-, state- and firm-level variables of knowledge intensity on firms’ investment in knowledge assets
using OLS regressions. The dependent variable is the amount of annual SG&A expenses scaled by sales revenue,
which reflects the firm’s investment in knowledge assets. We control for lagged firm and state characteristics, firm
fixed effects, and year fixed effects in all regressions. The analyses are conducted using yearly panel data that cover
the period from January 1960 to December 2014. Panels A and B report the results of OLS regressions of the impact
of the interactions between the IDD indicator and various knowledge intensity variables at the industry-/state-level
and firm-level variables, respectively. Detailed description of the variables is presented in Table A1 of the
Appendix. All dollar values are in 2014 constant dollars. All continuous variables are winsorized at the 1st and 99th
percentiles. Robust standard errors are clustered at the state level to account for within-state correlations in
regression residuals and are shown in parentheses. ***, **, and * correspond to statistical significance at the 1%,
5%, and 10% levels, respectively.

44
Panel A. The Influence of Industry- and State-Level Knowledge Intensity Variables on the Treatment Effect of the IDD
on Knowledge Assets Investment
Dep. Var.: KNOWLEDGE_ASSETS_INV’T Model 1 Model 2 Model 3 Model 4 Model 5
IDD t-2 0.003 0.001 0.001 0.001 0.006**
(0.003) (0.004) (0.003) (0.003) (0.003)
Industry-/state-level variables
IDD t-2 × Top 25 IND_RND_SALE t-1 0.015**
(0.007)
Top 25 IND_RND_SALE t-1 0.002
(0.004)
IDD t-2 × Top 25 IND_SGA_SALE t-1 0.024***
(0.007)
top 25 IND_SGA_SALE t-1 0.004
(0.003)
IDD t-2 × Top 25 IND_PAT_COUNT t-1 0.013*** (0.005)
top 25 IND_PAT_COUNT t-1 0.006
(0.005)
IDD t-2 × HIGH_TECH t-1 0.026***
(0.007)
HIGH_TECH t-1 0.016**
(0.007)
IDD t-2 × Top 25 INDUSTRY_FINANCED_RND t-1 0.016***
(0.005)
Top 25 INDUSTRY_FINANCED_RND t-1 -0.013*
(0.007)
Controls
FIRM_SIZE t-1 -0.003 -0.003 -0.003 -0.003 -0.003
(0.002) (0.002) (0.002) (0.002) (0.003)
MARKET_TO_BOOK t-1 0.000 0.000 0.000 0.000 0.000
(0.001) (0.001) (0.001) (0.001) (0.001)
KNOWLEDGE_ASSETS_INV’T t-1 0.435*** 0.435*** 0.435*** 0.435*** 0.434***
(0.016) (0.016) (0.016) (0.016) (0.012)
SALES_GROWTH t-1 -0.003 -0.003 -0.003 -0.003 -0.002
(0.003) (0.003) (0.003) (0.003) (0.004)
LEVERAGE t-1 -0.049*** -0.049*** -0.051*** -0.049*** -0.060***
(0.010) (0.010) (0.011) (0.010) (0.014)
ROA t-1 -0.047*** -0.047*** -0.052*** -0.047*** -0.052***
(0.014) (0.014) (0.014) (0.014) (0.015)
PER_CAPITA_STATE_INCOME t-1 0.047** 0.047** 0.060*** 0.044** 0.059
(0.022) (0.023) (0.022) (0.022) (0.043)
TOTAL_STATE_INCOME t-1 -0.008 -0.009 -0.010 -0.009 -0.017**
(0.008) (0.008) (0.008) (0.008) (0.007)
STATE_INCOME_GROWTH t-1 0.042 0.042 0.046 0.042 0.131**
(0.053) (0.053) (0.052) (0.052) (0.054)
Year Fixed Effects Yes Yes Yes Yes Yes
Firm Fixed Effects Yes Yes Yes Yes Yes
Intercept Yes Yes Yes Yes Yes
Obs. 183,633 183,633 180,650 183,633 123,713
Adj. R2 0.702 0.702 0.702 0.702 0.698
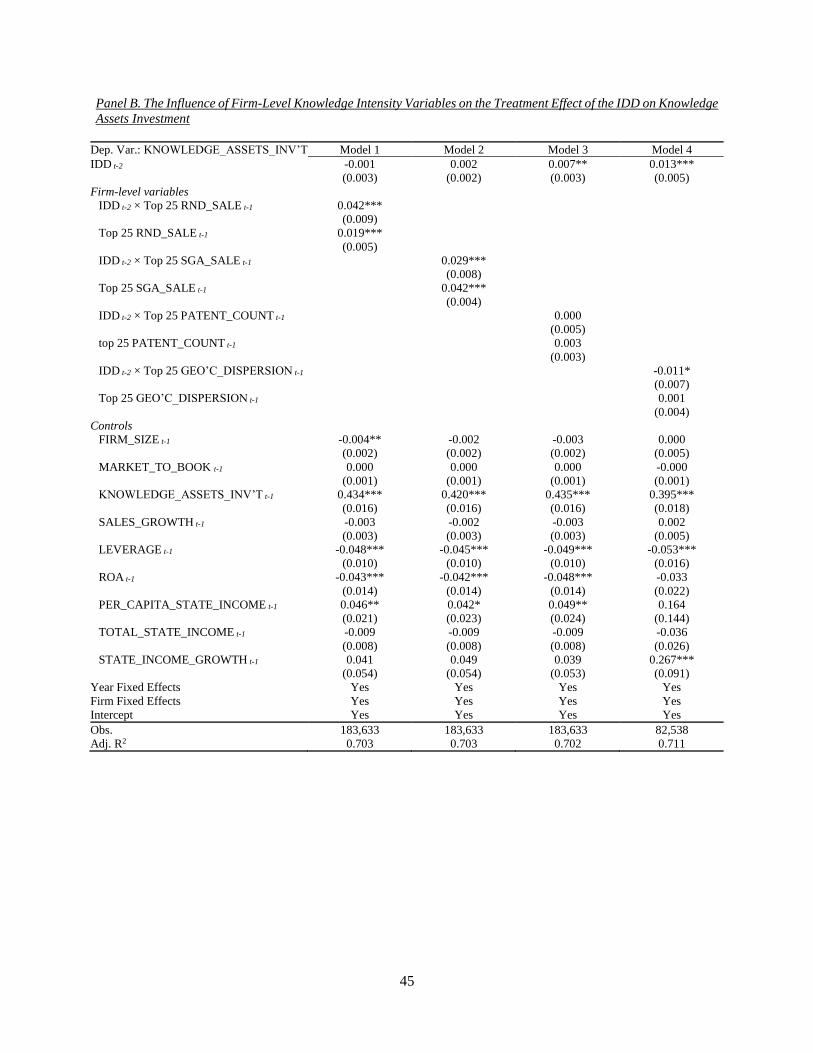
45
Panel B. The Influence of Firm-Level Knowledge Intensity Variables on the Treatment Effect of the IDD on Knowledge
Assets Investment
Dep. Var.: KNOWLEDGE_ASSETS_INV’T Model 1 Model 2 Model 3 Model 4
IDD t-2 -0.001 0.002 0.007** 0.013***
(0.003) (0.002) (0.003) (0.005)
Firm-level variables
IDD t-2 × Top 25 RND_SALE t-1 0.042***
(0.009)
Top 25 RND_SALE t-1 0.019***
(0.005)
IDD t-2 × Top 25 SGA_SALE t-1 0.029*** (0.008)
Top 25 SGA_SALE t-1 0.042***
(0.004)
IDD t-2 × Top 25 PATENT_COUNT t-1 0.000 (0.005)
top 25 PATENT_COUNT t-1 0.003
(0.003)
IDD t-2 × Top 25 GEO’C_DISPERSION t-1 -0.011*
(0.007)
Top 25 GEO’C_DISPERSION t-1 0.001
(0.004)
Controls
FIRM_SIZE t-1 -0.004** -0.002 -0.003 0.000
(0.002) (0.002) (0.002) (0.005)
MARKET_TO_BOOK t-1 0.000 0.000 0.000 -0.000
(0.001) (0.001) (0.001) (0.001)
KNOWLEDGE_ASSETS_INV’T t-1 0.434*** 0.420*** 0.435*** 0.395***
(0.016) (0.016) (0.016) (0.018)
SALES_GROWTH t-1 -0.003 -0.002 -0.003 0.002
(0.003) (0.003) (0.003) (0.005)
LEVERAGE t-1 -0.048*** -0.045*** -0.049*** -0.053***
(0.010) (0.010) (0.010) (0.016)
ROA t-1 -0.043*** -0.042*** -0.048*** -0.033
(0.014) (0.014) (0.014) (0.022)
PER_CAPITA_STATE_INCOME t-1 0.046** 0.042* 0.049** 0.164
(0.021) (0.023) (0.024) (0.144)
TOTAL_STATE_INCOME t-1 -0.009 -0.009 -0.009 -0.036
(0.008) (0.008) (0.008) (0.026)
STATE_INCOME_GROWTH t-1 0.041 0.049 0.039 0.267***
(0.054) (0.054) (0.053) (0.091)
Year Fixed Effects Yes Yes Yes Yes
Firm Fixed Effects Yes Yes Yes Yes
Intercept Yes Yes Yes Yes
Obs. 183,633 183,633 183,633 82,538
Adj. R2 0.703 0.703 0.702 0.711

46
Table 7. Geographic Dispersion and the Effect of the IDD
Table 7 presents the results of the effect of the IDD ruling on stock price of firms with operations that are
less geographically dispersed vs. firms with operations that are more geographically dispersed. We classify a firm as
geographically dispersed if it is in the top quartile of its 2-digit SIC industry in terms of the number of states
mentioned in its annual report each year. Panel A reports the mean of the 11-day, 5-day, and 3-day cumulative
abnormal returns (CARs) during an event window of (−5, +5), (−2, +2), (−1, +1) surrounding the adoptions of the
IDD and rejections of the previously adopted IDD for firms that are geographically non-dispersed; Panel B reports
the CARs for firms that are geographically dispersed. We calculate CARs using both the market-adjusted model and
the market model. We use the CRSP value-weighted stock market returns (including dividends) as the market
portfolio. Robust standard errors are clustered at the state level to account for within-state cross-sectional
correlations and are shown in parentheses. ***, **, and * correspond to statistical significance at the 1%, 5%, and
10% levels, respectively.
Panel A. Impact of IDD Adoptions and Rejections on Stock Returns of Geographically Non-Dispersed Firms
Market-Adjusted Model Market Model
CAR
(-5,5)
CAR
(-2,2)
CAR
(-1,1)
CAR
(-5,5)
CAR
(-2,2)
CAR
(-1,1)
Obs.
IDD Adoptions 1.904*** 1.163*** 0.586*** 0.924* 0.646** 0.003
2,930
(0.583) (0.331) (0.217) (0.476) (0.281) (0.180)
IDD Rejections -1.223 -3.518*** -1.597*** -3.063** -5.262*** -2.390***
2,584 (1.057) (1.216) (0.571) (1.376) (1.798) (0.843)
Panel B. Impact of IDD Adoptions and Rejections on Stock Returns of Geographically Dispersed Firms
Market-Adjusted Model Market Model
CAR
(-5,5)
CAR
(-2,2)
CAR
(-1,1)
CAR
(-5,5)
CAR
(-2,2)
CAR
(-1,1)
Obs.
IDD Adoptions 0.941 0.700 0.345 0.373 0.300 -0.001
(0.807) (0.428) (0.365) (0.718) (0.393) (0.321) 449
IDD Rejections -0.682 -2.711** -0.950 -1.218 -3.338** -1.129**
642 (1.169) (1.258) (0.680) (1.096) (1.371) (0.576)
47
Table 8. The Effect of Neighboring-State IDD Adoption and Rejection
Table 8 presents the results of the effect on firm stock price and subsequent knowledge assets investment
when there is an IDD event in a neighboring state. Panel A reports the mean of the 11-day, 5-day, and 3-day
cumulative abnormal returns (CARs) during an event window of (−5, +5), (−2, +2), (−1, +1) surrounding the
adoptions and rejections of the IDD. We calculate CARs using both the market-adjusted model and the market
model. We use the CRSP value-weighted stock market returns (including dividends) as the market portfolio. Panel B
reports estimated coefficients from difference-in-differences (DD) analyses of the impact of actual and fictitious
changes in the IDD in neighboring states on firms’ investment in knowledge assets using OLS regressions. We test
the impact of the actual adoption/rejection of IDD in neighboring states as well as the placebo experiments on
knowledge assets investment. For the placebo experiment, we create fictitious changes in the IDD that have taken
place one and three years before, as well as one and three years after, the first-time real changes in the IDD in
neighboring states. The dependent variable is the amount of annual SG&A expense scaled by sales revenue, which
reflects the firm’s investment in knowledge assets. We control for lagged firm and state characteristics, firm fixed
effects, and year fixed effects in all regressions as in previous tables. The analyses are conducted using yearly panel
data that cover the period from January 1960 to December 2014. Detailed description of the variables is presented in
Table A1 of the Appendix. All dollar values are in 2014 constant dollars. All continuous variables are winsorized at
the 1st and 99th percentiles. Robust standard errors are clustered at the state level and are shown in parentheses. ***,
**, and * correspond to statistical significance at the 1%, 5%, and 10% levels, respectively.

48
Panel A. The Effect of Neighboring-State IDD Events on Firm Stock Price
Market-adjusted model Market model
CAR
(-5,5)
CAR
(-2,2)
CAR
(-1,1)
CAR
(-5,5)
CAR
(-2,2)
CAR
(-1,1)
Obs.
IDD Adoptions 0.431** 0.135 0.033 -0.097 0.147 -0.006 4,386
(0.180) (0.169) (0.172) (0.308) (0.174) (0.182)
IDD Rejections -0.567 -0.381 -0.538 -0.171 -0.639 -0.479 3,255
(0.798) (0.572) (0.469) (0.402) (0.607) (0.306)
Panel B. The Effect of Neighboring-State IDD Events on Firms’ Subsequent Knowledge Assets Investment
Dep. Var.:
Knowledge assets investment
Placebo change 3
years before the
actual change
Placebo change 1
year before the
actual change
Actual IDD change Placebo change 1
year after the
actual change
Placebo change 3
years after the
actual change
IDD neighboring / -0.004 0.001 -0.002 -0.004 -0.001
Placebo IDD neighboring (0.003) (0.002) (0.003) (0.003) (0.003)
Control Variables Yes Yes Yes Yes Yes
Year Fixed Effects Yes Yes Yes Yes Yes
Firm Fixed Effects Yes Yes Yes Yes Yes
Intercept Yes Yes Yes Yes Yes
Obs. 143,416 169,711 183,633 187,606 170,593
R2 0.710 0.705 0.702 0.704 0.700
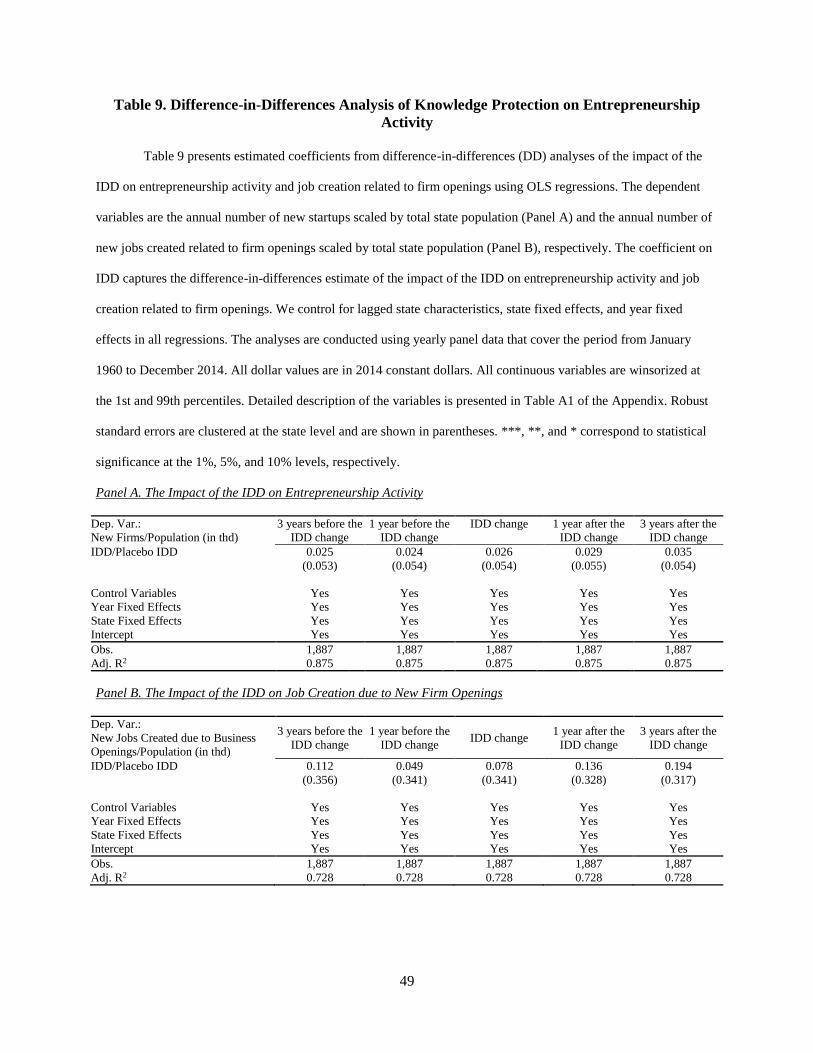
49
Table 9. Difference-in-Differences Analysis of Knowledge Protection on Entrepreneurship
Activity
Table 9 presents estimated coefficients from difference-in-differences (DD) analyses of the impact of the
IDD on entrepreneurship activity and job creation related to firm openings using OLS regressions. The dependent
variables are the annual number of new startups scaled by total state population (Panel A) and the annual number of
new jobs created related to firm openings scaled by total state population (Panel B), respectively. The coefficient on
IDD captures the difference-in-differences estimate of the impact of the IDD on entrepreneurship activity and job
creation related to firm openings. We control for lagged state characteristics, state fixed effects, and year fixed
effects in all regressions. The analyses are conducted using yearly panel data that cover the period from January
1960 to December 2014. All dollar values are in 2014 constant dollars. All continuous variables are winsorized at
the 1st and 99th percentiles. Detailed description of the variables is presented in Table A1 of the Appendix. Robust
standard errors are clustered at the state level and are shown in parentheses. ***, **, and * correspond to statistical
significance at the 1%, 5%, and 10% levels, respectively.
Panel A. The Impact of the IDD on Entrepreneurship Activity
Dep. Var.:
New Firms/Population (in thd)
3 years before the
IDD change
1 year before the
IDD change
IDD change 1 year after the
IDD change
3 years after the
IDD change
IDD/Placebo IDD 0.025 0.024 0.026 0.029 0.035
(0.053) (0.054) (0.054) (0.055) (0.054)
Control Variables Yes Yes Yes Yes Yes
Year Fixed Effects Yes Yes Yes Yes Yes
State Fixed Effects Yes Yes Yes Yes Yes
Intercept Yes Yes Yes Yes Yes
Obs. 1,887 1,887 1,887 1,887 1,887
Adj. R2 0.875 0.875 0.875 0.875 0.875
Panel B. The Impact of the IDD on Job Creation due to New Firm Openings
Dep. Var.:
New Jobs Created due to Business
Openings/Population (in thd)
3 years before the
IDD change
1 year before the
IDD change IDD change
1 year after the
IDD change
3 years after the
IDD change
IDD/Placebo IDD 0.112 0.049 0.078 0.136 0.194
(0.356) (0.341) (0.341) (0.328) (0.317)
Control Variables Yes Yes Yes Yes Yes
Year Fixed Effects Yes Yes Yes Yes Yes
State Fixed Effects Yes Yes Yes Yes Yes
Intercept Yes Yes Yes Yes Yes
Obs. 1,887 1,887 1,887 1,887 1,887
Adj. R2 0.728 0.728 0.728 0.728 0.728

50
Figure 1. Knowledge Assets Investment around the IDD Events
Figure 1 compares the changes in knowledge assets investment by firms headquartered in states where state
courts adopted the IDD with those of firms headquartered in states where the IDD was not changed, around the IDD
adoption and rejection years in the treatment states. In figure 1A, the treatment group (black dotted line) includes
firms whose headquarter state courts adopted the IDD in court rulings while the control group (grey solid line)
includes firms whose headquarter state courts do not have any IDD rulings around the adoption years. In figure 1B,
the treatment group (black dotted line) includes firms whose headquarter state courts rejected the previously adopted
IDD in court rulings while the control group (grey solid line) includes firms whose headquarter state courts do not
have any IDD rulings around the rejection years. Year 0 is the second year after a treatment group state court
adopted the IDD (or rejected the previously adopted IDD). The level of knowledge assets investment in year -3 is
rescaled to 100 for both groups.

51
95
97
99
101
103
105
107
109
111
113
115
-3 -2 -1 0 1 2 3
Figure 1A: Knowledge Assets Investment around the Adoptions of the IDD
firms in treatment states firms in control states
80
85
90
95
100
105
110
115
-3 -2 -1 0 1 2 3
Fugure 1B: Knowledge Assets Investment around the Rejections of the Previously Adopted IDD
firms in treatment states firms in control states

52
Appendix Table A1. Variable Description
Variable Definition Source
CAR (-5,5) Cumulative abnormal return (in percentage) of the firm in the (-5,5) window, where day 0 is the date when the IDD is adopted or rejected in
the state where firm’s headquarters locate; daily abnormal stock returns are calculated using the market/market-adjusted model and the CRSP
value-weighted index with the estimation window being days (-200, -60) before the event date
CRSP
CAR (-2,2) Cumulative abnormal return (in percentage) of the firm in the (-2,2) window, where day 0 is the date when the IDD is adopted or rejected in
the state where firm’s headquarters locate; daily abnormal stock returns are calculated using the market/market-adjusted model and the CRSP
value-weighted index with the estimation window being days (-200, -60) before the event date
CRSP
CAR (-1,1) Cumulative abnormal return (in percentage) of the firm in the (-1,1) window, where day 0 is the date when the IDD is adopted or rejected in
the state where firm’s headquarters locate; daily abnormal stock returns are calculated using the market/market-adjusted model and the CRSP
value-weighted index with the estimation window being days (-200, -60) before the event date
CRSP
KNOWLEDGE_ASSETS_INV’T Annual SG&A expense as a ratio of sales revenue Compustat
State-level variables
PER_CAPITA_STATE_INCOME Logarithm of per capita income of the state where firms’ headquarters is located in Bureau of Economic Analysis
TOTAL_STATE_INCOME Logarithm of total income of the state where firms’ headquarters is located in Bureau of Economic Analysis
STATE_INCOME_GROWTH Percentage change in the total income of the target state from year t-1 to year t Bureau of Economic Analysis
POLITICAL_BALANCE Share of U.S. House of Representatives that are members of Democratic Party for a state and in a given year House of Representatives
INDUSTRY_FINANCED_RND Logarithm of industry-financed R&D expenditure at doctoral-granting institutions per state National Science Foundation
Industry-level variables
IND_RND_SALE Median percentage of R&D spending of total sales for firms in an industry defined by the first 2-digit SIC code Compustat
IND_SGA_SALE Median percentage of SG&A spending of total sales for firms in an industry defined by the first 2-digit SIC code Compustat
IND_PAT_COUNT Logarithm of 1 plus the industry-average number of patent granted to a firm within in a year NBER Patent Database
HIGH_TECH Dummy variable equals to 1 when firm is in one of the high-tech industries and 0 otherwise Kenneth French’s website
Firm Characteristics
RND_SALE The percentage of firm’s R&D spending of total sales Compustat
SGA_SALE The percentage of firm’s SG&A spending of total sales Compustat
PATENT_COUNT Logarithm of 1 plus the number of patent granted to a firm within a certain year NBER Patent Database
FIRM_SIZE Logarithm of Firm Market Cap Compustat
MARKET-TO-BOOK Market value of assets/book value of total assets Compustat
SALES_GROWTH Percentage change in firm’s total sales from year t-1 to year t Compustat
LEVERAGE Book value of debt / book value of assets Compustat
ROA The firm’s earnings before extraordinary items scaled by book value of assets Compustat
PAST_STOCK_RETURN The firm’s buy-and-hold abnormal stock return in the (-210,-30) window, where day 0 is the date when IDD is adopted
or rejected in state where firm’s headquarters is located; buy-and hold abnormal stock return is calculated by subtracting
the buy-and-hold CRSP value-weighted index return from the buy-and-hold stock return of the firm
CRSP
GEOGRAPHIC_DISPERSION Garcia and Norli’s (2012) measure of firm geographic dispersion based on the number of U.S. states mentioned in the
firm’s annual 10-K report
Diego Garcia’s website

53
Appendix Table A2. Correlation Matrix
Table A2 reports correlations between different variables in our sample. The sample consists of 4,535 events in which firms’ headquarter state adopted
IDD and 3,857 events in which firms’ headquarter state rejected IDD and covers the period from January 1960 to December 2014. Detailed description of the
variables is presented in Table A1 of the Appendix.
CAR (-5,5) CAR (-2,2) CAR (-1,1) PER_CAPITA_STATE
_IN’E
TOTAL_STATE_INCO
ME
STATE_INCOME_GR
OWTH
INDUSTRY_FINANCE
D_RND
IND_RND_
SALE
IND_SGA_
SALE
IND_PAT_
COUNT
CAR (-2,2) 0.534
CAR (-1,1) 0.428 0.736
PER_CAPITA_STATE_IN’E -0.052 -0.052 -0.033 TOTAL_STATE_INCOME -0.010 -0.092 -0.052 0.477
STATE_INCOME_GROWTH 0.038 -0.002 0.015 -0.241 0.074
INDUSTRY_FINANCED_RND -0.008 -0.016 -0.005 -0.321 0.161 0.321 IND_RND_SALE -0.005 -0.108 -0.086 0.234 0.219 0.014 -0.018
IND_SGA_SALE -0.008 -0.045 -0.030 0.189 0.125 -0.014 -0.027 0.609
IND_PAT_COUNT -0.012 -0.119 -0.097 0.067 0.197 0.053 0.171 0.759 0.402 HIGH_TECH -0.007 -0.128 -0.090 0.170 0.186 0.086 0.053 0.726 0.406 0.564
RND_SALE -0.005 -0.062 -0.046 0.129 0.114 0.005 -0.011 0.307 0.212 0.180
SGA_SALE -0.041 -0.130 -0.100 0.112 0.159 0.048 0.039 0.249 0.231 0.207 PATENT_COUNT -0.008 -0.044 -0.034 0.047 0.096 0.004 0.025 0.311 0.146 0.362
FIRM_SIZE -0.036 -0.138 -0.096 0.059 0.080 -0.003 -0.067 -0.002 -0.060 0.003 MARKET_TO_BOOK -0.037 -0.216 -0.157 0.078 0.104 0.085 0.061 0.183 0.128 0.162
PAST_STOCK_RETURN -0.001 -0.352 -0.264 0.041 0.103 0.116 0.103 0.099 0.026 0.130
GEOGRAPHIC_DISPERSION -0.007 0.045 0.043 -0.088 -0.087 -0.085 -0.111 -0.241 -0.175 -0.235
HIGH_TECH RND_SALE SGA_SALE PATENT_COU
NT FIRM_SIZE
MARKET_TO_
BOOK
PAST_STOCK_
RETURN
RND_SALE 0.240 SGA_SALE 0.241 0.260 PATENT_COUNT 0.205 0.084 0.023 FIRM_SIZE 0.004 -0.038 -0.101 0.348
MARKET_TO_BOOK 0.198 0.124 0.199 0.051 0.230
PAST_STOCK_RETURN 0.151 0.062 0.056 0.037 0.224 0.232
GEOGRAPHIC_DISPERSION -0.217 -0.109 -0.115 -0.054 0.204 -0.057 -0.087

54
Appendix Table A3. Court Ruling of the IDD and State Characteristics
Table A3 presents the relationship between the court decision on the IDD and time-varying state
characteristics using OLS regressions. The dependent variables are the timing of IDD decision in general and IDD
adoption and rejection separately. We control for lagged state characteristics, state fixed effects, and year fixed
effects in all regressions. The analyses are conducted using yearly state panel data that cover the period from
January 1960 to December 2014, and the analyses using political balance data cover a period from January 1992 to
December 2014. Detailed description of the variables is presented in Table A1 of the Appendix. All dollar values are
in 2014 constant dollars. All continuous variables are winsorized at the 1st and 99th percentiles. Robust standard
errors are clustered at the state level and are shown in parentheses. ***, **, and * correspond to statistical
significance at the 1%, 5%, and 10% levels, respectively.
Dep. Var.: IDD Decision Dummy IDD Adoption Dummy IDD Rejection Dummy
PER_CAPITA_STATE_INCOME t-1 -0.003 0.010 -0.004 0.015 0.001 -0.005
(0.009) (0.062) (0.008) (0.055) (0.006) (0.025)
TOTAL_STATE_INCOME t-1 0.038 0.043 0.025 -0.063 0.013 0.106
(0.025) (0.093) (0.020) (0.072) (0.012) (0.067)
STATE_INCOME_GROWTH t-1 -0.028 -0.226 0.054 0.105 -0.082** -0.331*
(0.044) (0.208) (0.041) (0.103) (0.036) (0.179)
POLITCAL_BALANCE t-1 -0.009 -0.018 0.009
(0.015) (0.016) (0.005)
Year Fixed Effects Yes Yes Yes Yes Yes Yes
State Fixed Effects Yes Yes Yes Yes Yes Yes
Intercept Yes Yes Yes Yes Yes Yes
Obs. 2,805 1,122 2,805 1,122 2,805 1,122
Adj. R2 0.005 -0.001 0.004 -0.006 -0.005 -0.010