Embed Size (px)
Citation preview
1
CAMRI Global Perspectives Monthly digest of market research & views Issue 41, February 2017
Does Macro Policy Diverge or Converge?
By Brian Fabbri
Visiting Senior Research Fellow, CAMRI & President, FABBRI Global Economics
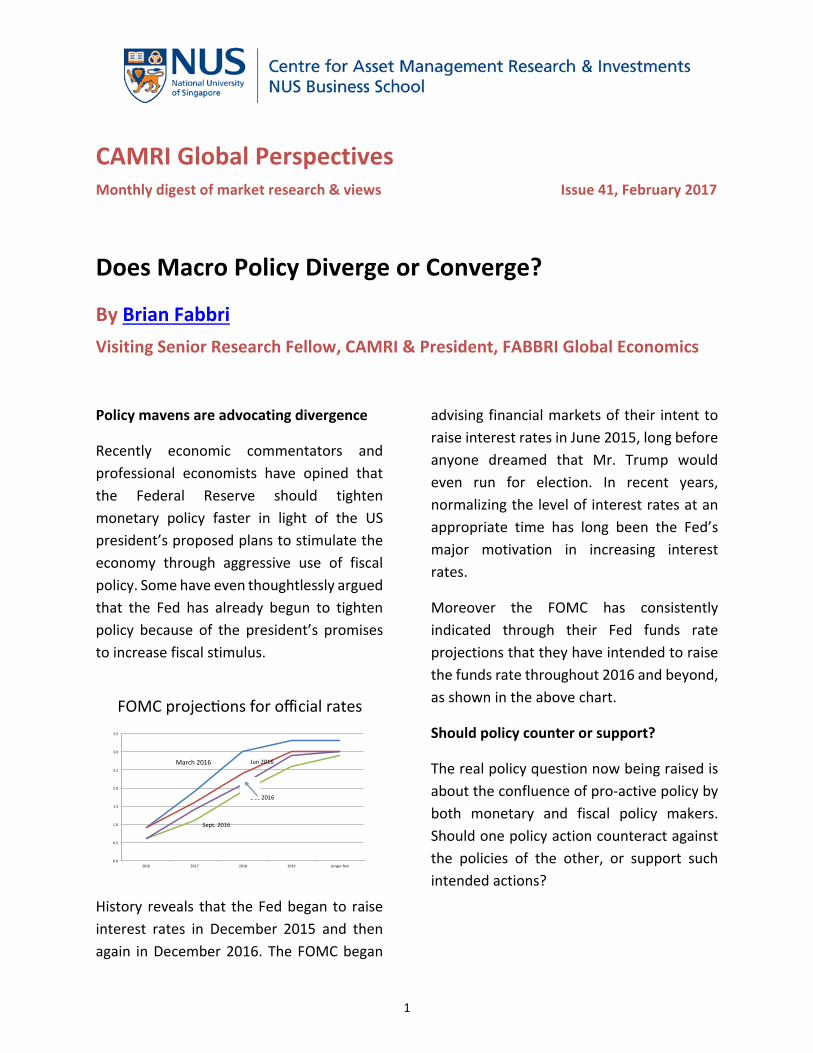
Policy mavens are advocating divergence
Recently economic commentators and
professional economists have opined that
the Federal Reserve should tighten
monetary policy faster in light of the US
president’s proposed plans to stimulate the
economy through aggressive use of fiscal
policy. Some have even thoughtlessly argued
that the Fed has already begun to tighten
policy because of the president’s promises
to increase fiscal stimulus.
History reveals that the Fed began to raise
interest rates in December 2015 and then
again in December 2016. The FOMC began
advising financial markets of their intent to
raise interest rates in June 2015, long before
anyone dreamed that Mr. Trump would
even run for election. In recent years,
normalizing the level of interest rates at an
appropriate time has long been the Fed’s
major motivation in increasing interest
rates.
Moreover the FOMC has consistently
indicated through their Fed funds rate
projections that they have intended to raise
the funds rate throughout 2016 and beyond,
as shown in the above chart.
Should policy counter or support?
The real policy question now being raised is
about the confluence of pro‐active policy by
both monetary and fiscal policy makers.
Should one policy action counteract against
the policies of the other, or support such
intended actions?
FOMC projec ons for official rates
0.0
0.5
1.0
1.5
2.0
2.5
3.0
3.5
2016 2017 2018 2019 Longer Run
Sept. 2016
Jun 2016
Dec 2016
March 2016
2
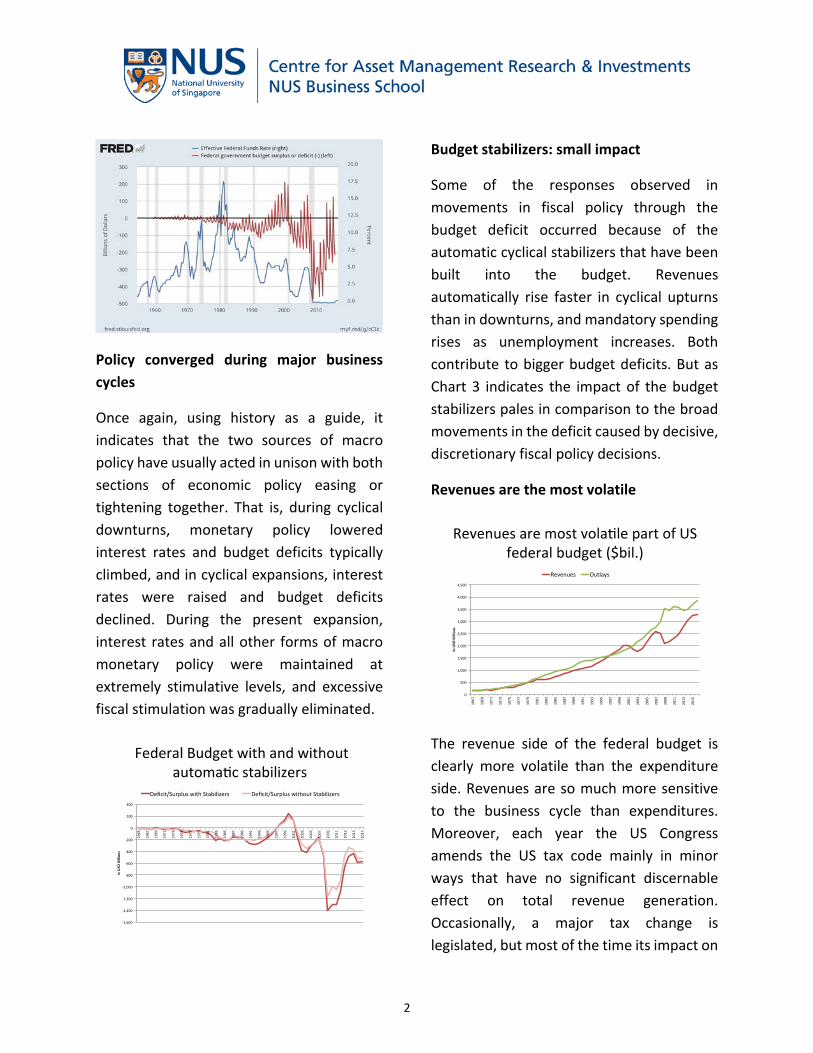
Policy converged during major business
cycles
Once again, using history as a guide, it
indicates that the two sources of macro
policy have usually acted in unison with both
sections of economic policy easing or
tightening together. That is, during cyclical
downturns, monetary policy lowered
interest rates and budget deficits typically
climbed, and in cyclical expansions, interest
rates were raised and budget deficits
declined. During the present expansion,
interest rates and all other forms of macro
monetary policy were maintained at
extremely stimulative levels, and excessive
fiscal stimulation was gradually eliminated.
Budget stabilizers: small impact
Some of the responses observed in
movements in fiscal policy through the
budget deficit occurred because of the
automatic cyclical stabilizers that have been
built into the budget. Revenues
automatically rise faster in cyclical upturns
than in downturns, and mandatory spending
rises as unemployment increases. Both
contribute to bigger budget deficits. But as
Chart 3 indicates the impact of the budget
stabilizers pales in comparison to the broad
movements in the deficit caused by decisive,
discretionary fiscal policy decisions.
Revenues are the most volatile
The revenue side of the federal budget is
clearly more volatile than the expenditure
side. Revenues are so much more sensitive
to the business cycle than expenditures.
Moreover, each year the US Congress
amends the US tax code mainly in minor
ways that have no significant discernable
effect on total revenue generation.
Occasionally, a major tax change is
legislated, but most of the time its impact on

3
total revenue is not intuitively obvious. For
instance, a major tax cut reduces revenue,
but stimulates more economic growth,
which pushes tax revenues upward,
although not necessarily exactly by the same
amounts, nor in the same annual time
periods. However, the divergent effects on
total revenue are muted over time.
Non‐mandatory spending has recently
declined.
Following the years during and immediately
after the great recession discretionary fiscal
policy was extensively used to bail out the
failing parts of the US economy and to
provide financial supports to other sagging
sectors in concert with the Federal Reserve’s
aggressive policies to shore up the weakest
financial institutions. Thus, the two branches
of the government charged with economic
development acted together to support the
economy.
Once the economy regained its footing, fiscal
policy went into retreat and massive budget
deficits contracted, while monetary policy
maintained its highly stimulative policy for
years thereafter, providing the impression
that policy was divergent.
During this period the federal government
chose to reduce spending on all non‐
mandatory items from 2011 onwards.
Spending for defense and non‐defense, non‐
mandatory spending was cutback in order to
help shrink the budget deficit to an
acceptable level. It succeeded in reducing
the deficit to around 3% of GDP for the past
three fiscal years. It had touched 10% at the
height of the ‘great recession’ crisis. As Chart
7 reveals, spending for defense and non‐
defense, non‐mandatory spending has
usually moved in synchronization together.
Budget deficit as % of GDP
‐12.0
‐10.0
‐8.0
‐6.0
‐4.0
‐2.0
0.0
2.0
1967
1969
1971
1973
1975
1977
1979
1981
1983
1985
1987
1989
1991
1993
1995
1997
1999
2001
2003
2005
2007
2009
2011
2013
2015
(%) o
f GDP
Budget Deficit % of GDP
‐10.0
‐5.0
0.0
5.0
10.0
15.0
20.0
1967
1969
1971
1973
1975
1977
1979
1981
1983
1985
1987
1989
1991
1993
1995
1997
1999
2001
2003
2005
2007
2009
2011
2013
2015
(%)
Non‐Mandatory Spending YoY Non‐Mandatory Spending % of GDP
Federal Non Mandatory spending has declined in recent years
Non Mandatory spending
0
200
400
600
800
1,000
1,200
1,400
1,600
1967
1969
1971
1973
1975
1977
1979
1981
1983
1985
1987
1989
1991
1993
1995
1997
1999
2001
2003
2005
2007
2009
2011
2013
2015
In USD
Billio
ns
Nondefense Total nonmandatory

4
Looking into the future
It seems that the President and his new
economic team are intent on stimulating the
economy through fiscal policy. They have
repeatedly stated that they will propose
measures to speed up economic growth. For
example, they plan to reduce federal taxes,
to increase federal spending on
infrastructure, to streamline federal
regulations, and to restrict foreign trade.
Assuming these proposals are sent to
Congress for debate and eventually turn into
congressional acts, economic growth will be
boosted in the next year or two and inflation
will accelerate.
The ball is in the Fed’s court
Since the administration is committed to
stimulate economic growth and suffer
through higher inflation, the critical policy
decision on whether to converge, or diverge
will be made by the Federal Reserve. The
decision will be partially influenced by
politics, but mostly influenced by the state of
the business cycle.
The administration’s economic stimulus will
give the present relatively long expansion
another thrust, however, it will come at a
time when the economy is already at full
employment. More growth in final demand
and higher demands for labor will push
wages higher and propel inflation above the
Fed’s tolerance limits. Consequently, the Fed
will be compelled to tighten monetary
policy.
Higher interest rates are inevitable
Higher inflation, tighter monetary policy,
rising market expectations for future
increases in official policy rates, and larger
demands by the federal government and the
Recently Defense and non defense non mandatory spending moved in tandem
0
100
200
300
400
500
600
700
800
1967
1969
1971
1973
1975
1977
1979
1981
1983
1985
1987
1989
1991
1993
1995
1997
1999
2001
2003
2005
2007
2009
2011
2013
2015
In USD
Billio
ns
Defense Nondefense
GDP output gap and Unemployment gap closing
‐6.0
‐4.0
‐2.0
0.0
2.0
4.0
6.0
‐1,000
‐800
‐600
‐400
‐200
0
200
400
600
800
1,000
65
67
69
71
73
75
77
79
81
83
85
87
89
91
93
95
97
99
01
03
05
07
09
11
13
15
17
(%)
In USD
Billio
ns
Unemployment Gap (Right) (%) GDP Gap (Le )
Market expecta ons for future policy rates have soared recently
0
0.5
1
1.5
2
2.5
0 1 2 3 4 5 6
Fed Funds Rate (%
)
Fed Funds Market implied rate
Mar 2016
Jun 2016
Dec 2016
Sep 2016

5
private sector for capital will drive longer
term borrowing rates significantly higher.
Eventually the competition for capital by the
public and private sectors will push some
private sector borrowers out of the market
and this will ultimately lead to the beginning
of the end of this very long business cycle
expansion.
Conclusion: Divergence isn’t inevitable
History reveals that the relationship
between fiscal and monetary macro policies
is very inconsistent. It is theorized that one
should offset the effects of the other to
prevent excessive stimulation, or
contraction. This would be consistent with
the checks and balances form of
government, such as the political structure
organized in the United States.
However, it is also posited by many policy
experts that macro and fiscal policy should
be supportive of one another’s intents
rather than to undermine them. This would
be especially true, if it is the government’s
public pledge to stimulate the economy.
Then, monetary policy should act to
complement that policy. Since the elected
government has the option to choose the
Federal Reserve’s chairman, the two
branches of macro policy making should
eventually be of similar views.
Of course, as we have seen, macro policies
have followed both dictums. The pursuit of
complementary macro policy has always
occurred during economic crisis. For
example, during the ‘great recession’ both
policies adopted similar overwhelmingly
stimulative policies. In contrast, during the
early 1980’s monetary policy was intent on
crushing inflation, and the Fed thus raised
interest rates to punishingly high levels while
fiscal policy adopted a very aggressive
stimulative supply side orientation.
The time to act is now
The new administration has promised to
pursue a complex set of economic policies
that are designed to bolster economic
growth over the next several years. One
countervailing consequence, intended or
otherwise, of their promised policies would
be to increase inflation above acceptable
levels. Since the present status of the
economy is on the cusp of full employment
any new added stimulus would most likely
raise the level of inflation. This should cause
the Federal Reserve to act in a countervailing
manner to respond to the increase in
inflation.
Fortuitously, the state of monetary policy is
considered extremely loose by any historic
standard. Therefore, some tightening is
necessary to return monetary policy back to
neutral. Moreover, it will take some time for
the administration’s new economic pledges
to become effective, and it will be time for
economic participants to react to these new
policies. During this interval the Fed would
be wise to act slowly and purposefully to
shore up its relaxed monetary policy before

6
time makes this tightening action appear
divergent to the administration’s policies.
For more information, please contact

7
KEY INDICATORS TABLE (AS OF 31 JANUARY 2017)
INDEX LEVEL (LC) %1MO (LC)
%1MO (USD)
%1YR (LC)
%1YR (USD)
INDEX LEVEL %1YR
S&P500 2278.87 1.90% 1.90% 20.03% 20.03% 3MO LIBOR 1.03 68.79
FTSE 7099.15 ‐0.57% 1.24% 21.49% 7.37% 10YR UST 2.45 27.71
NIKKEI 19041.34 ‐0.37% 2.83% 10.78% 18.57% 10YR BUND 0.44 34.06
HANG SENG 23360.78 6.18% 6.12% 23.28% 23.69% 10YR SPG 1.60 5.69
STI 3046.80 5.85% 8.57% 20.38% 21.54% 10YR SGS 2.30 1.85
EUR 1.08 2.67% ‐0.30% US ISM 54.50 12.14
YEN 112.80 ‐3.56% ‐6.88% EU PMI 55.10 5.35
CMCI 1186.06 2.32% 29.07% JP TANKAN 7.00 ‐22.22
Oil 52.81 ‐1.69% 57.08% CHINA IP 6.00 1.69
Source: Bloomberg
APPENDIX
GLOSSARY OF KEY TERMS (Source: Bloomberg, with tickers in parenthesis. In US$ where applicable) S&P500: capitalization‐weighted index of the prices of 500 US large‐cap stocks (SPX) FTSE: capitalization‐weighted index of the prices of the 100 largest LSE‐listed stocks (UKX) NIKKEI: capitalization‐weighted index of the largest 225 stocks of the Tokyo Stock Exchange (NKY) HANG SENG: capitalization‐weighted index of companies from the Hong Kong Stock Exchange (HSI) STI:cap‐weighted index of the top 30 companies listed on the Singapore Exchange (FSSTI) EUR: USD/EUR exchange rate: 1 EUR = xx USD (EUR) YEN: YEN/USD exchange rate: 1 USD = xx YEN (JPY) CMCI: Constant Maturity Commodity Index (CMCIPI) Oil: West Texas Intermediate prices, $ per barrel (CLK1) 3MO LIBOR: interbank lending rate for 3‐month US dollar loans (US0003M) 10YR UST: 10‐year US Treasury yield (IYC8 – Sovereigns) 10YR BUND: 10‐year German government bond yield (IYC8 – Sovereigns) 10YR SPG: 10‐year Spanish government bond yield, proxy for EU funding problems (IYC8 – Sovereigns) 10YR SGS: 10‐year Singapore government bond yield (IYC8 – Sovereigns) US ISM: US business survey of more than 300 manufacturing firms by the Institute of Supply Management that monitors employment, production inventories, new orders, etc. (NAPMPMI) EU PMI: Purchasing Managers’ index for the 17 country EU region (PMITMEZ) JP TANKAN: Bank of Japan business survey on the outlook of Japanese capital expenditures, employment and the overall economy, quarterly index (JNTGALLI) CHINA IP: China’s Industrial Production index, with 1‐month lag (CHVAIOY) LC: Local Currency Disclaimer:Allresearchdigests,reports,opinions,models,appendicesand/orpresentationslidesintheCAMRIResearchDigestSeriesisproducedstrictlyforacademicpurposes.Anysuchdocumentisnottobeconstruedasanofferorasolicitationofanoffertobuyorsellanysecurities,norisitmeanttoprovideinvestmentadvice.NationalUniversityofSingapore(NUS),NUSBusinessSchool,CAMRI,theparticipatingstudents,facultymembers,researchfellowsandstaffacceptnoliabilitywhatsoeverforanydirectorconsequentiallossarisingfromanyuseofthisdocument,oranycommunicationgiveninrelationtothisdocument.