Embed Size (px)
Citation preview
Does Movie Violence Increase Violent Crime?∗
Gordon Dahl
UC San Diego and NBER
Stefano DellaVigna
UC Berkeley and NBER
This version: July 31, 2006.
Abstract
What is the short-run impact of media violence on crime? Laboratory experiments in
psychology find that exposure to media violence increases aggression. In this paper, we
provide field evidence on this question. We exploit variation in violence of blockbuster
movies between 1995 and 2002, and study the effect on same-day assaults. We find that
violent crime decreases on days with higher theater audiences for violent movies. The effect
is mostly driven by incapacitation: between 6PM and 12AM, an increase of one million
in the audience for violent movies reduces violent crime by 1.5 to 2 percent. After the
exposure to the movie, between 12AM and 6AM, crime is still reduced but the effect is
smaller and less robust. We obtain similar, but noisier, results using data on DVD and
VHS rentals. Overall, we find no evidence of a temporary surge in violent crime due to
exposure to movie violence. Rather, our estimates suggest that in the short-run violent
movies deter over 200 assaults daily. We discuss the endogeneity of releases. Potential
interpretations for our results include a cathartic effect of movies, displacement of crime,
and decrease in alcohol consumption. The differences with the experimental results may
be due to experimental procedures, or to sorting into violent movies. Our design does not
allow us to estimate long-run effects.
∗Preliminary and incomplete, please do not cite without permission. Saurabh Bhargava, Christopher Car-
penter, Ing-Haw Cheng, Liran Einav, Matthew Gentzkow, Ulrike Malmendier, Anne Piehl, Mikael Priks, and
audiences at the Munich 2006 Conference on Economics and Psychology, at the NBER 2006 Summer Institute
(Labor Studies), and at the Trento 2006 Summer School in Behavioral Economics provided useful comments.
We would like to thank kids-in-mind.com for providing their movie violence rating. Scott Baker and Thomas
Barrios provided excellent research assistance.
1 Introduction
Does violence in the media trigger violent crime? This question is important for policy and
scientific research alike. In 2000, the Federal Trade Commission issued a report at the request
of the President and of Congress, surveying the scientific evidence and warning of risks. In the
same year, the American Medical Association, together with five other public-health organi-
zations, issued a joint statement on the risks of exposure to media violence (Joint Statement,
2000).
Warnings about media violence are largely based on the psychological research. As Ander-
son and Buschman (2001) summarize it, “Five decades of research into the effects of exposure
to violent television and movies have produced thoroughly documented [...] research findings.
It is now known that even brief exposure to violent TV or movie scenes causes significant in-
creases in aggression, [...] and that media violence is a significant risk factor in youth violence.
[...] The consistency of findings within and between the three types of TV- and movie-violence
studies makes this one of the strongest research platforms in all of psychology.” Other surveys
reach similar conclusions (Anderson et al., 2003).
The research in psychology, however, stops short of establishing a causal impact of media
violence on crime. The evidence from psychology, summarized in Table 1, is of two types.
A first set of experiments, starting with Lovaas (1961) and Bandura, Ross, and Ross (1963),
expose subjects (typically kids) to short, violent video clips. These experiments find a sharp
increase in aggressive behavior immediately after the media exposure, compared to a control
group. This literature provides causal evidence on the short-run impact of media violence on
aggressiveness, but not on crime.
A second literature (including Johnson et al., 2002) shows that survey respondents who
watched more violent media are substantially more likely to be involved in self-reported violence
and crime. This second type of evidence, while indeed linking media violence and crime, is
plagued by problems of endogeneity and reverse causation. In sum, the research in psychology
does not answer the question on media violence and crime.1
In this paper, we attempt to provide causal evidence on the short-run effect of media
violence on violent crime. We exploit the natural experiment induced by time-series variation
in the violence of movies shown at the theater. As in the psychology experiments, we estimate
the impact of exposure to violence in the short-run. Unlike in the experiments, our outcome
variable is violent crime, rather than aggressiveness in the laboratory.
We measure the violence content of movies using a 0-10 rating developed by kids-in-
mind.com, a non-profit organization. (Appendix Table A lists some examples of ratings.)
1In sociology there is a smaller literature that uses natural experiments in media programming. The most
important studies consider the impact of television boxing prizefights on homicides and the effect of suicide
episodes in soap operas on suicides (Phillips, 1982 and 1983).
1
A movie is strongly violent if it has a rating of 8 or above (“Hannibal”), and mildly violent
if it has a rating of 5 to 7 (“Spider-Man”). Combining the rating of movies with their daily
revenue, we generate a daily measure of box office audience for strongly violent, mildly violent,
and non-violent movies. Since blockbuster movies differ significantly in violence rating, and
movie sales are concentrated in the initial weekends since release of a movie, there is substan-
tial variation in exposure to movie violence over time. The box office audience for strongly
violent movies is as high as 10 million people on some weekends, and is close to zero on others.
(Figures 1a-1b) We also exploit the variation across weekdays within a week (Figure 2).
Using this variation, we estimate the same-day2 impact of exposure to violent movies on
violent crime, holding constant the total movie audience. We use data from the National
Incidence Based Reporting System (NIBRS) for the years 1995-2002 in 264 cities to measure
physical and sexual assaults. We use a Poisson specification to account for the discrete nature
of crime.
Our findings offer little support for the theory that exposure to violence increases violent
behavior in the short-run. On days with a high audience for violent movies, violent crime is
significantly lower. To interpret this puzzling result, we separately estimate the effect on crime
in four 6-hour blocks. We find that exposure to violent movies has no impact on crime in the
morning hours (6AM-12PM) or in the afternoon (12PM-6PM), as expected: movie attendance
in these hours is minimal. In the evening hours (6PM-12AM), instead, we detect a strong
negative effect on crime. For each million people watching a strongly violent movie, violent
crimes decrease by 1.94 percent. We find a smaller, but still large, impact for exposure to
mildly violent movies. We interpret these results as incapacitation. On evenings with high
attendance of violent movies, potential criminals are in the movie theater, and hence incapaci-
tated from committing crimes. We show that the magnitudes of the effects are consistent with
incapacitation, once we allow for sorting of potential criminals into more violent movies.
Finally, we present evidence for the morning hours following the movie showing (12AM-
6AM), which allow us to test the short-run effect of movie exposure on violent crime. Over this
time period, we detect a negative, though smaller, effect on violent crime of exposure to movie
violence. While this effect is not always significant, it is sufficiently precise that we can always
reject sizeable positive effects on crime. Unlike in the psychology experiments, therefore, media
violence does not appear to induce more violent crime in the short-run. One note of caution is
that we also find a positive effect of exposure to all movies on violence in the morning hours,
an effect that is hard to interpret.
We present disaggregate effects by two-hour time block, and by individual violence level
from 0 to 10. The results are consistent with the pattern of the baseline results. We also
replicate the results using an alternative measure of movie violence that uses the MPAA ratings,
2We define day t to run from 6AM of day t to 6AM of day t + 1. This allows us to include in the analysis
the hours right after the movie exposure.
2
and using weekend data rather than daily data. In both cases, the results are less precisely
estimated, but are consistent with the main results. We also show that, while the effects
appear to be there for all demographics groups, they are strongest in percentage terms for the
group aged 15-24. Finally, we introduce a placebo treatment by reassigning the weekend movie
violence measure to the corresponding weekend in the previous year, or the previous two years.
We do not find any effect in these placebo treatments.
Our final set of results exploits the variation in movie violence from rentals of DVDs and
VHSs. As in theater showings, a large share of rentals involves newly-released films. Since the
release of movies in DVDs and VHSs is staggered relative to the release in the theaters, this
variation provides a second, independent test of the effect in the paper. Using weekly data
on rentals from July 1999 to December 2002, we obtain similar, though noisier results as with
theater data: evidence of incapacitation and (some) evidence of a negative impact on crime
following the movie exposure.
In Section 4 we evaluate the magnitudes of the findings and provide interpretations. A
simple calibration of the results indicates that strongly violent movies in the evening hours
prevent, on average, about 55 assaults daily across the US, out of 6,010 assaults. Mildly
violent movies, which are more common, appear to prevent 132 assaults. The incapacitation
effect that we document, and which the previous literature had overlooked, is substantial.
The estimates of the short-run impact on violence after the movies (12AM-6AM) are smaller.
The point estimates suggest that violent movies decrease the number of assaults by 12 assaults
daily. The largest increase in assaults due to movie violence that we cannot reject is an increase
of 8 assaults. These effects are substantially different from the large positive effects of media
violence on crime that the experimental literature finds in Psychology.
We discuss two limitations of the analysis. A first limit of our research design is that we
cannot answer the question on the long-run impact of media violence. Second, in the current
draft we have not yet addressed the potential endogeneity of movie releases, that may be
correlated with factors that themselves affect crime. Even in the presence of such correlation,
the results should not be affected to the extent that the correlation of violent movies with
these factors is the same as the correlation of non-violent movies.
We discuss three main interpretations for our results. (i) Catharsis. The consumption of
movie violence may have a cathartic effect, freeing tensions away from violent acts, as first
proposed in Aristotle’s Poetics. (ii) Displacement. The showing of movies may displace crimes
temporarily: once a criminal exits the movie theater, it is too late to engage in crime. (iii)
Sobriety. Theater attendance may reduce the consumption of alcohol, which in turn reduces
the incidence of violent crime. This does not explain, however, the results for DVD and VHS
rentals, which can be consumed with alcohol.
These explanations also suggest two reasons why the results in the field and in the laboratory
are different. First, the design of the exposure to violence is very different in the laboratory
3
studies and in the field. In the laboratory exposure to violence neither displaces logistically
possibilities of aggression, nor reduces alcohol consumption. Further, the violent clips used in
the experiments typically consist of 5-10 minutes of sequences of extreme violence. In the field,
instead, actual media violence also includes meaningful acts of reconciliation, apprehension of
criminals, and non-violent sequences. Second, the laboratory experiments do not take into
account sorting into violent media (Lazear, Malmendier, and Weber, 2005; Levitt and List,
2006). The experimental subjects are exposed to extreme violence that they had neither
demanded nor anticipated. Individuals watching violent movies at the movie theater, instead,
pay for such exposure, possibly because they are looking for a way to channel tensions.
The paper is related to a growing literature in economics on the effect of the media on
economic outcomes. Among others, Besley and Burgess (2002), Green and Gerber (2004),
Stromberg (2004), Gentzkow (2006), and DellaVigna and Kaplan (2006) provide evidence that
media exposure affects political outcomes. More relatedly, Gentzkow and Shapiro (2006) show
that the introduction of television did not have adverse effects on educational outcomes. As
in this paper, media exposure did not have a negative impact, though Gentzkow and Shapiro
estimate long-term, rather than short-run, elasticities. Finally, Card and Dahl (2006) show
that on days of baseball matches, domestic violence spikes, and specially so for upset losses of
the local team. Disappointing outcomes, therefore, appear to induce frustration and impact
certain crimes.
The paper also complements the previous evidence on incapacitation. The evidence ranges
from the effect of school attendance (Jacob and Lefgren, 2003) to the effect of imprisonment
(DiIulio and Piehl, 1991; Levitt, 1996; Spelman, 1993).
The remainder of the paper is structured as follows. In Section 2 we describe the data. In
Section 3 we present the empirical results. In Section 4 we present calibrations of the results
and interpretations and in Section 5 we conclude.
2 Data
Movie data. We obtain the data on box-office revenue from www.the-numbers.com, which
use the studios and Exhibitor Relations as data source. Data on weekend box-office sales is
available for the top 50 movies consistently from January 1995 until the present3. Daily data
is available for the top 10 movies from October 1997 to the present. In most of the analysis,
we focus on the finer, daily time intervals. We deflate both the weekend and the daily box
office sales by the average price of a ticket to obtain an estimate of the number of people in
the movie theater audience.
For the period January 1995-August 1997 and for all movies that do not make the daily top
3In the more recent years, the data covers all movies. We keep only the data for the top 50 movies to ensure
consistency with the older data.
4
10 list, we impute the daily box office revenues, whenever missing, using the weekend sale for
the same movie in the same week. The imputation procedure, described in Appendix A, takes
advantage of the regularity in the within-week pattern of sales. Ticket sales peak on Saturday,
Friday, and Sunday (in decreasing order) and are lowest on Tuesday-Thursday (Figure 2). The
accuracy of the imputation is high. In the sub-sample for which both the daily and the weekend
data are available, a regression of predicted daily revenue on actual daily revenue yields a slope
coefficient of .9842 with an R2 of .9190.
We match the box office data to violence ratings from www.kids-in-mind.com. Since 1992,
this non-profit organization has assigned a 10-point violence rating to (almost) all movies with
substantial sales. The ratings are performed by volunteer-trained members who, after watching
the movie, follow guidelines to assign the rating. In Appendix Table 1, we illustrate the rating
system by listing the three movies with the highest weekend audiences within each rating
category. As Column 2 shows, ratings 3-6 account for most of the audience data. Within
each violence category, we list the top-3 blockbuster movies (Column 3), the weekend date
(Column 4), and the weekend audience (Column 5). Movies with ratings between 0 and 4
have very little violence such as “Runaway Bride” and “Toy Story”; their rating ranges from
G to R (in the latter case, for sexual content or profanity). Movies with ratings between 5
and 7 contain a fair amount of violence, with some variability across titles (“Spider Man” vs.
“Mummy Returns”). These movies are typically rated PG-13 or R. Movies with a rating of 8
and above are violent and almost uniformly rated R. Examples are “Hannibal” and “Saving
Private Ryan”. Compared to other movies, violent movies are disproportionately more likely to
be in the “Action/Adventure” and “Horror” genre and are very unlikely to be in the “Comedy”
genre. For a very small number of movies (such as “Perfect Murder”) the rating is not available.
These movies have almost always smaller audiences.4
After cleaning the title of the movie, we match the ratings data to the box office data.
The match quality is very high for movies in the top-20 list. Overall, we can assign a violence
rating to 95.64 percent of the box office revenue.
Movie violence measures. We define the number of people (in millions) exposed to
movies of violence level v on day t as Avt =
Pj∈J d
vjaj,t, where aj,t is the audience of movie j
on day t, dvj is an indicator for film j belonging to violence level v, and J is the set of all movies.
The violence level varies between 0 and 11, where 11 indicates that the violence measure is
missing. The measure of overall exposure to movies on day t is the audience for all movies on
day t, At =P11
v=0Avt . To deal with missing violence rating, we define the share of movies on
day t with non-missing violence measure as st =P10
v=0Avt /P11
v=0Avt . The average of this share
across days is 95.89 percent.
We define two measures of exposure to violent movies on day t. The measure of exposure
4The re-releases of Star Wars V and VI in 1997 were also not rated because the original movie pre-dates
kids-in-mind. We assigned them the violence rating 5, the same rating as for the other rated Star Wars movies.
5
to strong violence on day t is the audience for movies of violence levels between 8 and 10,
A[8,10]t =
P10v=8A
vt /st. The measure of exposure to mild violence on day t is the audience for
movies of violence level between 5 and 7, A[5,7]t =
P7v=5A
vt /st. Both measures are adjusted by
the share st, to compensate for missing data on movie violence.
Figure 1a plots the measure of strong movie violence, A[8,10]t , over the sample period 1995
to 2002. To improve the readability, we use the weekend measure of audience instead of the
daily measure. We identify the top-10 weekends with the name of the movie responsible for
the spike. The series exhibits sharp fluctuations. Several weekends have close to zero violent
movie audience. On other weekends, up to 12 million people watch violent movies. The spikes
in the movie violence series are distributed fairly uniformly across the years, and decay within
2-3 weeks of the release of a violent blockbuster. There is some seasonality in the release of
violent movies, with lower exposure to movie violence between February and May.
Figure 1b plots the corresponding information for the measure of mild movie violence,
A[5,7]t . Since more movies are included in this category, the average weekend audience for
mildly violent movies is higher than for violent movies, with peaks of up to 25 million people.
Violence data. The source of violence data is the National Incident-Based Reporting Sys-
tem (NIBRS), which contains all reports of crime from 1995 to 2002 for the agencies reporting.
Since reporting agencies enter and exit the sample, we keep in the sample in each year only
agencies that report crimes at least 300 days in that year. For these agencies and years, we
set the crime rate to zero on days when no crime is reported. We also drop agencies with a
population of less than 25,000 people.
Our main measure of violence is the number of assaults on day t in town k, Vt,k. In most
specifications, we separate the assaults into 4 time periods, assaults occurring between 6AM
and 12PM of day t, V mort,k , assaults occurring between 12PM and 6PM of day t, V aft
t,k , assaults
occurring between 6PM and 12AM of day t, V evet,k , and assaults occurring between 12AM and
6AM of day t+ 1, V nigt,k . (We index the assaults occurring in the night between day t and day
t+1 with day t to match them to movies played on day t). In some specifications, we present
separate series by age and gender of the offender, and by type of offense. These series are
constructed in a similar way.
Figure 1c plots the average number of weekend assaults Vt,k across cities (per 100,000
people). The series is seasonal, with troughs in assaults in the winter months, and higher
assault rates in 1996 and 2002 than in the other years. The series reports also the top-10
weekends for assaults, the top-10 weekends for strongly violent movies, and those for mildly
violent movies. As the figure makes apparent, there is no obvious relationship between the
assaults series and the violent movies series. For example, the top-10 weekends for strongly
violent movies are equally distributed on days with above- and below-average assault rates.
While this does not rule out a relationship between violent movies and crime, such a relationship
is not apparent from a simple plot.
6
Summary Statistics. After matching the panel of assaults with the time series of movie
violence, the resulting data set includes 425,559 city-day observations, covering the time period
from January 1995 to December 2002. Table 2 reports the summary statistics. The average
number of assaults on any given day across the cities in our sample is 3.66, translating into
an assault rate of 5.57 assaults per 100,000 inhabitants. The assaults occur mostly in the
evening (6PM-12AM), but are also common in the afternoon (12PM-6PM) and in the night
(12M-6AM). Across weekdays, assault rates are highest on Friday and Saturday (Figure 2).
Across demographic features, assaults rates are decreasing in the age of the offender, and are
three times larger for males than for females.
Table 2 also reports the summary statistics of the daily movie audience data. The average
daily movie audience is 3.73 million people, while the audience for strongly and mildly violent
movies is respectively 0.47 million and 1.62 million. The Table also presents information on
an alternative system of classification of violent movies and on rentals, which we discuss below
in Section 3.
3 Empirical Results
3.1 Theater Audience — Main Results
Baseline effect. In the first empirical specification we test whether there are short-run effects
of exposure to violent movies on violent crime. We focus on the effect of same-day5 exposure,
an horizon similar to the one considered in the psychology experiments.
Since the number of assaults is a count variable, we use a Poisson process. We model the
distribution of agency k’s crime count on day t as
Vt,k ∼ Poisson(μt,k = λt,k) k = 1, ...,K; t = 1, ..., T
with λt,k = exp(xt,kβ). Since λt,k has an exponential form
E[vt,k|xt,k] = μt,k = exp(xt,kβ)
Notice that consistency of the maximum likelihood estimate for this model only requires the
correct specification of the conditional mean. Consistency does not require the distribution to
be correctly specified. However, miss-specifying the variance will lead to inconsistent standard
errors. The Poisson model restricts the mean to be equal to the variance, which can be an issue
in count models as often there is overdispersion. To assess whether overdispersion is likely to
be an issue for our regressions, we also report negative binomial regression results below.
5As we stated above, we define day t to run from 6AM of day t to 6AM of day t+ 1.
7
The coefficient βj can be interpreted as the proportionate change in the conditional mean
if the jth regressor changes by one unit, i.e.,
βj =δE[v|x]δxj
1
E[v|x]
That is, the conditional mean of the dependent variable is 1 + βj units larger for a one unit
change in the j-th regressor. For indicator variables, the effect of variable j is exp(βj), which
for small values of βj is approximately equal to 1 + βj .
The determinants of the probability of an assault include the following covariates
xt,k = β[8,10]A[8,10]t + β[5,7]A
[5,7]t + βAt + ΓXt. (1)
The number of assaults depends on the exposure to strongly violent movies (A[8,10]t ) and
mildly violent movies (A[5,7]t ), controlling for total audience for all movies (At). The coefficient
β[8,10] can be interpreted as the percent increase in assaults for each million people watching
movies of violence level between 8 and 10 on day t, controlling for the total movie audience.
The interpretation of the coefficient β[5,7] is similar. The variables Xt are a set of control
variables: indicators for year, month, day of week, and for holidays6. (The full set of holiday
indicators is described in Appendix A.) The standard errors are robust and clustered by date,
to allow for arbitrary correlation of errors across agencies k on the same day.
Notice that, given the nature of our data, the variables of interest do not vary at the city
level. Thus, the estimates of the effects of exposure to violent movies are unaffected by the
inclusion of city fixed effects, and we will not include them. While cities do enter and exit
the sample at the yearly level, within a given year, the set of cities is constant. As described
above, our sample includes cities with populations of 25,000 or more that report any crime for
at least 300 days a year. For any remaining missing days in the year, we assign a value of zero
crime for that day. A set of year dummies in the Poisson regressions accounts for the variation
in the sample of cities across years.
In Column 1 of Table 3 we estimate (1) including only year controls. (The year controls are
necessary since the number of towns in the sample varies year-by-year) This is the equivalent of
running a simple time-series regression of assaults on exposure to movie violence. The results
indicate that exposure to media violence appears to increases crime, consistently with the
evidence from the psychology experiments. For each additional one million people exposed to
a violent movie, the probability of assault increases by 1.4-1.6 percent, depending on whether
we consider the mild violence measure (A[5,7]t ) or the strong violence measure (A
[8,10]t ). In
addition, we obtain the (puzzling) result that exposure to any movie (as captured by At)
increases crime significantly.
6The results are similar, though less precisely estimated, if we introduce controls alternatively for day-of-
week*month, day-of-week*year, month*year.
8
In Columns 2 through 4 we include additional controls: indicators for day-of-week (Column
2), for month in the year (Column 3), and for holidays (Column 4). These indicators are
significant determinants of assault rates, since violent crime varies by weekday (Figure 2) and
has important seasonal patterns (Figure 1c). As we add these control variables, the coefficients
β[5,7] and β[8,10]on the violence measures flip sign and become significantly negative, with the
coefficient on strong violence becoming larger in absolute value. With the full set of controls,
an increase in one million in the audience for violent movies decreases violent crime by .64
percent (mildly violent movies) or .96 percent (strongly violent movies), substantial effects
on violence. In addition, exposure to non-violent movies, as captured by At, is no longer a
significant determinant of assaults, once all the controls are added.
In Columns 5 through 8 of Table 3 we present robustness results for the benchmark specifi-
cation with all controls (Column 4). The results are similar, though the estimates are somewhat
less precise if we do not use the imputation procedure for the daily data. This limits the sam-
ple period to September 1997-December 2002 (Column 5, see Appendix A for details on the
imputation) The results do not change if we estimate a negative binomial regression, allowing
for overdispersion of the dependent variable (Column 6). We obtain similar estimates also us-
ing an OLS model with assaults per capita as the dependent variable (Column 7), though the
magnitudes are not directly comparable to the other specifications. Finally, we obtain direc-
tionally similar, but less precise results for an OLS specification with log(assaults per capita)
as dependent variable (Column 8). The loss in power is not surprising since observations with
no assaults are dropped. Since these specifications do not affect substantially the results, we
do not repeat them below.
The initial result that exposure to violent media increases violent crime appears to be due
to the within-week and within-year timing of movie releases and of assaults. Once we control
for seasonal patterns, exposure to violent movies appears to diminish crime in the short-run,
and more so the more violent the crimes, a result in contrast to the finding of the psychology
experiments.
Time of day. To clarify this puzzling result, we examine separately the effect of violent
movies on violent crime by time of day. We include the full set of controls Xt. In Table
4, we present the results of specification (1) for assaults committed between 6AM and 12PM,
(V mort,k , Column 1), between 12PM and 6PM (V aft
t,k , Column 2), between 6PM and 12AM (V evet,k ,
Column 3), and between 12AM and 6AM of the next day (V nigt,k , Column 4).
Since movie audiences are unlikely to watch movies in the morning and in the afternoon,
and especially so for violent movies, we expect to find no effect of exposure to violent movies
in the first two time blocks. Indeed, exposure to violent movies has no differential impact on
assaults in the morning (Column 1), or in the afternoon (Column 2). Since we consistently
find similar effects for these two time periods, we pool them in the next Tables to save space.
Over the evening hours (Column 3), we find, instead, a strong negative effect of exposure
9
to violent movies. An increase in the audience of mildly violent movies of one million de-
creases violent crimes by exp(−.0132)− 1, that is, 1.31 percent. Exposure to strongly violentmovies has an even larger effect. Exposure of one million additional people reduces assaults
by exp(−.0194) − 1, that is, 1.92 percent. Exposure to violent movies incapacitates peoplewho may otherwise be committing crimes. The larger effect for more violent crimes reflects
the fact that the audiences of the more violent crimes are more likely to be selected among the
potential criminals. Below, we argue that the magnitude of the coefficients β[5,7] and β[8,10] is
consistent with a pure incapacitation effect.
Over the night hours following the exposure to the movie, violent movies appear to have
a negative impact on crime, but the results are smaller and less precisely estimated. Expo-
sure to mildly violent movies for one million people decreases violent crimes (significantly) by
exp(−.0095)− 1, that is, .95 percent; the effect for strongly violent movies is exp(−.0073)− 1,that is, -.73 percent, but is not significant. These mild negative effects imply that we can re-
ject a positive short-run impact of violent movies on crime implied by the psychology evidence.
These results lend some support to the catharsis hypothesis, that violent movies dissipate the
negative feelings. Alternatively, they may be interpreted as mild evidence that an evening at
the movies displaces violent crime, since the latter takes a whole evening.
While the results on the effect of violent movies are interpretable, we also find a puzzling
effect of non-violent movies. Over the morning hours and in the afternoon, a higher exposure
to non-violent movies lowers crime significantly. While there is no impact on evening assaults,
non-violent movies significantly increase assaults in the night following the movie exposure.
These results appear to reflect the effect of an unobservable variable that affects both crime
and movie attendance, such as weather or TV programming. Consistently with this interpre-
tation, these effects are 2 to 3 times larger in regressions without controls (results not shown).
While these results suggest caution in the interpretation of the findings on violent movies, the
potential presence of an unobservable variable does not bias the findings on the effect of violent
movies to the extent that this variable affects all movie audiences in the same way, which seems
plausible.
In Columns 5-7 we replicate the results of Columns 1-4 allowing for a non-linear effect of
total movie sales At in (1). We pool the time periods in Columns 1 and 2 to save space. The
estimates of the impact of violent movies are very similar to the benchmark estimates within
each time period.
To provide more evidence on the timing of the effect of violent movies, we re-run spec-
ification (1) separately by two-hour time blocks. In Figure 3 we plot the coefficients, with
confidence intervals, for the measure of strong violence A[8,10]t and mild violence A
[5,7]t (in addi-
tion, the total audience variable At is included in the regressions). To interpret the coefficients,
one should regard the time stamp as indicating either the time of the assault, or the time of
the police report. As such, the crime is likely to have occurred in the indicated time block, or
10
in the previous one. Over the same-day morning hours and over the afternoon, no coefficient
is significantly different from zero, and no pattern is apparent, consistent with the results of
Columns 1 and 2 of Table 4. In the time block 6PM-8PM, exposure to strong violence has a
negative significant effect, and over the time blocks 8PM—10PM and 10PM-12AM, both mea-
sures of violence have a significant and sizeable negative effect. The timing of this effect is
exactly consistent with incapacitation from movie attendance: since most movie showing take
place between 6PM and 10PM, and incapacitation may affect also the two hours surrounding
the movie showing, the decrease in crime should start from around 4PM and taper off around
midnight. Over the time periods 12AM-2AM, 2AM-4AM, and 4AM-6AM, exposure to violent
movies has mostly a negative impact on assaults, but the coefficients are smaller and mostly
not significant. This is again consistent with the results in Table 4 indicating no short-run
positive impact of violent movies on violent crime.
3.2 Theater Audience — Robustness
Disaggregate effects. To complement the findings in Table 4, we present evidence on the
effect of the broadcast of movies of different violence categories on street crimes. We run the
regression
xt,k =10Xv=0
βvAvt + ΓXt,
that is, we estimate separately the effect on assaults of exposure to movies of violence level
v, with v = 0, 1, ..., 10. In Figure 4, we plot the coefficients βv for evening assaults Aevet and
for night assaults Anigt . Over the evening hours (6PM-12AM), the effect of movies on assaults
is fairly monotonic in the violence level of the movie. As we found in Table 4, the more
violent the movie, the lower the frequency of assaults, consistent with incapacitation. Over the
night hours (12AM-6AM), the pattern is not so clear-cut. Exposure to low-violence movies
appear to increase assaults, probably capturing a time-series component that is not included
in the controls. Compared to low-violence movies, movies with higher violence level lead to
reductions of violence. The effect is fairly monotonic till violence level 8, while violence levels
9 and especially 10 are associated with a higher violence level. The only evidence, therefore,
of a positive impact of violent movies on crime is for the rare movies that attain the highest
violence level.
Alternative Movie Violence Measure. We cross-validate the results using the MPAA
ratings of each movies. In addition to the rating of a movie (”R”, ”PG”, etc.), the MPAA
summarizes in one sentence the sex, violence, and gore features of each movie. We characterize
as mildly violent movies for which the MPAARating contains the word “Violence” or “Violent”,
with two exceptions: (i) If the reference to violence is qualified by “Brief”, “Mild”, or “Some”,
we classify the movie as non-violent. (ii) If the word violence is qualified as either “Bloody”,
11
“Brutal”, “Disturbing”, “Graphic”, “Grisly”, “Gruesome”, or “Strong”, we classify the movie
as strongly violent. We then construct a daily measure of mild and strong movie violence
along similar lines to the procedure described in Section 2 for the benchmark measures.7 The
average MPAA-based mild violence measure averages 1.26 million in audience, compared to
1.62 million for the kids-in-mind-based mild violence measure (Table 2). The two measures
have a correlation of .80 across the 2847 days in the sample when they are both non-missing.
The MPAA-based measure of strong violence is substantially more restrictive than the kids-
in-mind-based-measure, averaging an audience of .27 millions, compared to .47 million for the
kids-in-mind measure. The correlation between these two measures is .63.
In Columns (1) through (3) of Table 5 we replicate the results of Table 4 using the MPAA-
based measure of movie violence. Over the morning and afternoon period (Column 1), we
find no significant effect of exposure to mild violence, but, surprisingly, we find a significant
negative effect of exposure to violent movies on assaults. Over the evening period (6PM-12PM,
Column 2), we find a significant incapacitation effect for exposure to mildly violent movies,
and a larger, also significant incapacitation effect for exposure to strongly violent movies. The
estimates are quite similar to the benchmark estimates in Table 4. Over the night following
the exposure (12AM-6AM, Column 3), we find a significant negative effect of mild violence
and a similarly negative but insignificant effect of strong movie violence. When we replicate
these results using both the MPAA-based measures of violence and the kids-in-mind-based
measures of violence (Column 4-6), we find that the effects on assaults depend mostly on the
kids-in-mind measures.
Overall, the alternative MPAA measure of movie violence produces similar, but somewhat
less precise, results. (The one surprising difference is the finding of a negative effect on violence
in the 6AM-6PM period, according to one measure.) Overall, the kids-in-mindmeasure appears
to be a more detailed measure of movie violence, which is not surprising given that the kids-
in-mind raters refine the MPAA rating with an extensive review and transform it into a 0-10
scale. We therefore use the kids-in-mind ratings in the rest of the paper.
Demographics. So far, we have presented the impact of movie violence on assaults regard-
less of demographics. We now present separate effects by age groups and gender. According
to the Motion Picture Association (2005), the age group 16-24 is responsible for 27 percent
of theater admission in 2004, while constituting only 15 percent of the population. Males
and females are equally represented. While we do not know which demographic groups are
more likely to attend violent movies, the over-representation of young people at the movie
theater leads us to expect that the results should be larger for the younger cohorts. (Since the
Poisson coefficients capture proportional changes, differences in average assault rates across
7In the first weeks of 1995, the NPAA rating is missing for a number of movies; we set the NPAA violence
measure missing for the 10 weeks in which the rating is available for less than 70 percent of the movie audience
for that week.
12
demographics do not matter to a first approximation.)
In Table 6 we replicate the specifications of Columns (3) and (4) of Table 4 for different
age and gender groups. We do not report the results for the morning and afternoon hours, for
which we consistently find no impact. Across age groups, we find the strongest incapacitation
results for the youngest age group (15-24, Column 1), even though the results are large and
significant also for the older age groups (25-34 and 34-44, Columns 3 and 5). In the night hours
following the movie exposure, we find broadly a negative impact of exposure to violent movies,
though the result is significant only for one measure for the younger age group (Column 2).
As for the gender split, the incapacitation effect is strong and significant both for males and
females (Columns 7 and 9). In the night following the movie exposure (Columns 8 and 10),
we find a negative impact of violent movies on crime that is stronger for women.
Weekend Results. The results above rely on two forms of variation in exposure to
violent movies, week-to-week variation and within-week variation. The week-to-week variation
is captured by Figures 1a-1b, which show the sharp changes in the audience of violent movies
from one week to the next. In addition, within any given week there is also substantial variation
in exposure to movies, captured by Figure 2. Saturday has the highest audience, followed by
Friday and Sunday; the other days of the week have only one fourth as much audience for
violent movies as the other days.
We now present results using the week-to-week variation by estimating expression (1) using
weekend sales only, that is, the sales from Friday to Sunday. The advantage of using weekend
data, as opposed to daily data, is that weekend revenue data is readily available, while daily
revenue data is partly imputed. The cost is the loss of precision due to the aggregation across
Friday, Saturday, and Sunday, as well as the neglect of data for the other weekdays. The
dependent variable for the Poisson regressions is the total number of assaults in weekend t,
and the independent variables are the measures of audience over weekend t. The set of controls
includes year indicators and 52 indicators for week-of-the-year. These last indicators subsume
the holiday controls, since holidays usually fall on the same week across years.
As Table 7 shows, there is no significant impact of audience of violent movies on the number
of assaults in the morning and afternoon period (Column 1), as expected. Over the evening
period (6PM-12PM), when people are expected to be watching movies, we find a significant
incapacitation effect for exposure to strongly violent movies. An increase of one million in
the weekend audience significantly decreases the total weekend assaults by exp(−.0051), thatis, by -.51 percent. We find a smaller, not significant impact for exposure to mildly violent
movies, exp(−.0014), that is, -.14 percent. Finally, over the late night hours (12AM-6AM) wefind essentially no effect of exposure to violent movies.
These estimates appear, at first, substantially smaller than the corresponding estimates for
daily data (Table 4). The two magnitudes, however, are easy to reconcile. Each person exposed
to a violent movie in weekend t watches a movie on only one of the three days composing
13
the weekend. Any incapacitation effect, therefore, applies to only one of three days, and
therefore should be approximately only a third as large as the corresponding effect from the
daily regressions in Table 4. Multiplying the magnitudes of the effect by three, the estimates
in Column 2 of Table 7 imply incapacitation effects of .51 ∗ 3 = 1.53 percent for violent moviesand of .14∗3 = .42 percent for mildly violent movies. The first point estimate is in line with the
finding of a 1.92 percent decrease in daily assaults per one million audience of violent movies
(Column 3 in Table 4). The point estimate for the mildly violent movies from the weekend
data is smaller than the corresponding point estimate from the daily data (Column 4 in Table
4), but the result is sufficiently noisy that similar results cannot be rejected.
The results using weekend data confirm the presence of an incapacitation effect, though
the effect is less precisely estimated than in the daily data. We find no effect of exposure to
movies in the night. The lower point estimates and lower precision in this sample are not
surprising, given that this sample does not use the within-week variation and it considers the
average exposure over the weekend, as opposed to the exact daily exposure.
Placebo Results. As a test of whether the results are driven by seasonal patterns in
movie releases, we construct a placebo treatment by running a regression as in (1) with the
assault data lagged by one or two years. In particular, in Columns (4) through (6) of Table
7 we replicate the results of Columns (1) through (3) but replace the outcome variable with
assaults in the corresponding weekend the year before. For movie exposure in 1995, we use the
assaults in the corresponding week in 2002 as outcome variable. In Columns (7) through (9)
of Table 7 we present the results of similar specifications in which we take the assault data for
the corresponding weekend two years before. For movie exposure in 1996 (1995), we use the
assaults for the corresponding weekend in 2002 (2001).
To the extent that the apparent incapacitation effect is explained by seasonal patterns
or special releases corresponding to holidays, we should find a similar effect in the placebo
treatments. If the effect is a causal effect due to release of violent movies, we should not find
an effect in the placebo treatment. In both placebo treatments, we do not find any significant
effect of movie exposure in these placebo regression in any time interval.
3.3 DVD and VHS Rentals
While most of the paper focuses on the effect of violent movies released in theaters, a similar
design exploits the release of violent movies in VHS/DVD. This release typically occurs a few
months after the theatrical release, and has similar features to the release in theaters. The
rental of newly released DVD/VHSs peaks in the first week of release and decays quickly in
the following weeks. Moreover, the top 1-2 movies capture a large share of the rental revenue.
We use data on weekly DVD/VHS rentals from www.boxofficemojo.com over the period July
1999-December 2002. The data for the top 25 DVD weekly rentals is available from July 2000
14
to December 2002. The data on VHS weekly rentals covers the top 10 rentals over the period
July 1999-October 2000, and the top 40 rentals over the period June 2001-July 2002. Since
over part of this sample either the DVD series or the VHS series is not available, we impute
the rentals for the missing series (if any) using the rentals for the other series, and compute
the sum of the two series. We present details on the imputation procedure in Appendix A.
Combining this data with the violence ratings from kids-in-mind, we compute a weekly
measure of audience for mildly violent and violent movies. Unlike the theater measures, this
measure captures week-long rentals. Since most of the rentals take place on the weekend, we
match it to weekend assaults. The average number of weekly rentals of any movie is 21.44
millions (Table 2). The weekly rentals of violent (mildly violent) movies are 3.71 (10.40)
millions. The weekly audience reached by DVD and VHS rentals, therefore, is comparable to
the audience reached in a week at the theater. In addition, one should take into account that
multiple people may view a rental, which boosts the DVD/VHS numbers. As we stated above,
the audience measures of violence for DVD and VHS rentals are only mildly correlated to the
box office measure in the corresponding week. The correlation between the two measures of
strong violence is -.01, while the correlation between the two measures of mild violence is .35.
In Table 8, we replicate the specifications of Columns (1)-(3) in Table 7 with weekend
assault as dependent variable and with DVD/VHS rentals of violent movies as independent
variables. While, as expected, there is no effect in the morning and afternoon (Column 1),
we identify a significant incapacitation effect for the exposure to mildly violent movies, and
an insignificant effect for the strongly violent movies for the evening hours (Column 2). The
effect on the night hours (Column 3) is less clear: the mild violence measure is associated with
a significant decrease in violent crimes, but the strong violence measure is associated with an
(insignificant) increase.
Importantly, these results hold when the measures of theater audience are also introduced
in the regressions (Columns 4 through 5). This is not surprising since the theater measures
of movie violence and the DVD/VHS measures are essentially uncorrelated. The results on
DVD/VHS releases, therefore, provide independent evidence supporting the finding of an inca-
pacitation effect; in addition, they provide additional evidence that violent movies are unlikely
to induce a short-run burst in violence.
4 Magnitudes and Interpretations
Magnitudes. We first interpret the magnitudes of the benchmark findings by time of day
(Table 4). The first main finding is that, in the evening hours (6PM-12AM, Column 3), one
million additional audience for strongly violent movies reduces violent crime by 1.92 percent.
Extrapolating this effect out of sample, this implies that on a day with 52 million people in the
audience for strongly violent movies, violent crimes would be zero. This may at first seem an
15
implausibly large effect since the American population near 300 million, but it is likely not. In
the midpoint of our sample, in 1998, the US Population was about 276 million; excluding people
aged below 14 and above 65 which are very unlikely to be attending violent movies (almost
always rated “R”) yields 180 million people. Among the 180 million people aged 15-64, the at-
risk population of potential criminals is likely to be highly over-represented in the audience for
violent movies. For example, in a laboratory setting, Bushman (1995) offers subjects the choice
whether to watch a violent or non-violent movie, and observes that subjects that rank high in
self-reported aggressiveness are more likely to choose a violent movie. The point estimates in
Column 3 of Table 4 are compatible with an incapacitation effect if the potential criminals are
approximately four times more likely to watch a violent movie. Although we do not have an
estimate for this form of sorting, we find it quite possible in light of the fact that the 15-24
age group is both highly represented among movie goers and among criminals.
The second main finding is that, in the night hours following the movie exposure (12AM-
6AM), one million additional audience for strongly violent movies reduces violent crime (in-
significantly) by .75 percent, with a confidence interval (-1.98,+.45). We can therefore reject
increases in crime larger than .5 percent for increase of one million people in the audience. For
mildly violent movies, the effect is significantly negative (-1.01 percent decrease in crime per
one-million people in the audience), and we can therefore reject any positive effect. In order to
evaluate this effect further, we compare it to the short-run impact of movie violence estimated
in the Psychology experiments.
The top part of Table 1 summarizes the results of representative experiments. Columns (1)
and (2) present the features of the treatment and of the control group. Columns (3) thorough
(5) summarize the age group of the subjects, the location of the experiment, and the sample
size. Finally, Column (6) defines the measure of violence, and Columns (7) and (8) present
the average measure of violence for the treatment and control group. The first experiments
(Lovaas, 1961; Bandura, Ross, and Ross, 1963), dating to the 1960s, were run mostly on small
samples of children, while the more recent studies (Bushman, 1995; Josephson, 1997; Leyens
et al., 1975) are run with larger samples and on more varied populations. Across the different
experiments, the treatment usually consist in exposure to a 5- to 15-minute video of violent
scenes from a violent movie. The scenes are often explicitly chosen to induce violence, depicting
violence in a positive light. The control group usually watches a video of comparable length
with non-violent scenes. Finally, the measures of violence vary from aggressive play with dolls
for the children (Lovaas, 1961; Bandura, Ross, and Ross, 1963) to the imposition of electric
shocks or noxious noises on other subjects (Geen and O’Neill, 1969; Bushman, 1995), and to
aggressive play during a hockey game (Josephson, 1987). In all cases, the violence proxies are
measured within an hour of the treatment. The effect of the exposure to movie violence is
large. In four out of first five experiments of Table 1, exposure to the violent movie doubles
the incidence of violence. The large size of this effect, though, masks some heterogeneity. In
16
the Geen and O’Neal (1969) study, for example, the effect of the violent movie is significant
only for the group that was exposed to a frustration manipulation (2 minutes of loud white
noise). (In fact, most of the experiments embed a frustration manipulation)
Leyens et al. (1975) stands out from the other experiments because it studies aggression and
violence in a more realistic context. Young people in a juvenile detention facility in Belgium are
exposed to 5 consecutive days of commercial violent movies (the treatment) or commercial non-
violent movies (the control). Therefore, unlike in the other experiments, subjects are exposed
to full-length movies. The violence measure is a record of the percent of subjects that engage
in acts of physical aggression in a monitoring period of 1.5 minutes. Interestingly, exposure
to violent movies significantly increases aggression in the evening, right after the movies are
shown, but not at noon, after a night’s sleep. These results suggest that the effects of media
violence, when present, are likely to be short-lived.
A second set of evidence in Psychology comes from cross-section or longitudinal surveys.
In these studies, self-reported measures of media exposure are correlated with measures of
aggressiveness and violence. An example is Johnson et al. (2002), who find that the share of
people committing assaults that can cause injury at age 16-22 is four times larger for people
that (at age 14) watched at least 3 hours of television a day, as opposed to less than an hour.
These studies, which generally imply very large effects of the media, are plagued by problems
of endogeneity and reverse causation.
Overall, the studies from psychology suggest a large impact of media violence on violent
behavior in the time period immediately following the exposure to the media violence. While
it is hard to quantify this effect, most papers in Table 1 find that violent behavior doubles.
In our findings, instead, we find a negative effect of media violence on violent crime, and can
reject sizeable positive effects. We discuss how to reconcile the two findings below.
Predicted Impact on Assaults. We now take as given the magnitudes of the effects in
the paper and estimate the impact of movie violence on the average number of assaults in the
US. More precisely, we estimate the change in assaults that would occur if all violent movies
were substituted by non-violent movies with the same audience numbers. These predictions
rely on a number of restrictive assumptions: (i) no impact of media violence on assaults beyond
the night of the media exposure; (ii) replacement by non-violent movies with the same audience;
(iii) the effects for the whole population is the same as for the set of cities in the sample.
We present these results in Table 9. For each relevant time period (6PM-12AM and 12AM-
6AM), given the average daily assault rate (Column 2) and the US population (Column 3),
we compute the average number of assaults occurring daily in the time interval (Column (4)):
6,010 in the evening hours and 3,468 during the night. To this number, we compare the
predicted change in number of assaults that would occur if violent movies were replaced by
non-violent movies. To do so, we multiply the effect of violent movies estimated in Table 4 by
the average daily audience of violent movies (Column 5 in Table 9); since this number affects
17
proportionally the number of assaults, we multiply it by the number of assaults (Column 5).
The predicted change in assaults due to the presence of violent movies is in Column (6).
The results are as follows. On average, strongly violent movies in the evening hours (6PM-
12AM) prevent about 55 assaults daily across the US, out of 6,010 assaults. Mildly violent
movies (that are more common) are predicted to prevent 132 assaults. The estimates for the
short-run impact on violence in the night hours (12AM-6AM) are smaller. Strongly violent
movies are predicted to decrease the number of night assaults by 12, and mildly violent movies
by 57. In addition to the point estimates, we compute 95 percent confidence intervals taking
into account the uncertainty in the estimates of the effect of violent movies in Table 4.8 Even
taking into account the uncertainty, the largest increase in assaults due to movie violence that
we cannot reject is an increase of 7 assaults in the night due to strongly violent movies. This is
clearly a much smaller effect than what the psychology literature could have led one to predict.
To summarize, we have derived predictions on the impact of violent movies on assaults
based on the estimates. As we discussed, these predictions should be taken with caution, since
they rely on a number of restrictive assumptions. This being said, these predictions indicate
that media violence has a sizeable impact on violent crime in the short-run. In particular,
the incapacitation effect, which had been overlooked by the previous literature, is substantial,
accounting for a potential decrease by 187 assaults of the total number of daily assaults.
Interpretations. The main results in the paper are that exposure to violent movies (i)
decreases significantly same-day violent crime in the evening; (ii) it decreases to a smaller extent
violent crime in the morning after. While the first result in the paper is easy to interpret as
an incapacitation effect, the interpretation of the second result is less clear, specially in light
of the opposite experimental results summarized above. We provide these interpretations for
this result: catharsis, displacement, and sobriety.
1. Catharsis. The consumption of movie violence may have a cathartic effect, freeing ten-
sions that could have been expressed otherwise in violent acts. This was a leading theory
among psychologists in the 1950s and 1960s before the experiments on media violence
and aggressiveness (leading to the opposite result) were run.
2. Disruption. If violent crime requires a whole evening to plan and/or execute, the visit
to the movie theater may have disrupted criminal plans: once a criminal exits the movie
theater, it is too late to engage in crime.
3. Sobriety. Theater attendance is likely to reduces the consumption of alcohol, which in
turn reduces the incidence of violent crime. This may explain the results on theater
8The confidence intervals in Column 6 of Table 9 do not take into account uncertainty in either the average
number of assaults, or the average movie audience.
18
releases, but it does not explain as well the results for DVD and VHS rentals, since
rentals may be associated with high alcohol consumption at home.
While these explanations address the findings in this paper, they do not explain the dif-
ference in findings with the experimental evidence. Reconciling the differences is important
not only to better understand the effect of media violence on violence, but also more gener-
ally to understand the relationship between experimental and field evidence. We believe that
there are two sets of reasons for the differences, the first having to do with the design of the
experiments, and the second with sorting.
The first reason is differences in the logistics of the treatment. In the experiments, subjects
typically watch a 5-10 minute video clip consisting of sequences of extreme violence taken out
of context from a movie. In the field, people sit at a movie theater and watch two hours of a
movie in which acts of violence are mixed with meaningful acts of reconciliation, apprehension
of criminals, and non-violent sequences. This implies three substantial differences: (i) the movie
experience in the field lasts much longer and, as such, can incapacitate an act of violence, and
can disrupt plans for violence; (ii) in most violent movies, the acts of violence often follow a
logic, inducing potentially a different reaction compared to exposure to random acts or violence;
(iii) the limited availability of alcoholic beverages in theaters reduces the alcoholic consumption
moviegoers, who may otherwise have spent the evening drinking. These differences underscore
the need for more realistic settings for experiments which approximate more closely the field
settings to increase external validity.
The second reason is sorting into movie violence. The experimental subjects are exposed
to extreme violence that they had neither demanded nor anticipated. Individuals watching
violent movies at the movie theater, instead, pay for such exposure, possibly because they are
looking for a way to channel tensions. Sorting into media violence, therefore, could explain
the different results in the experiments and in the field. This reflects a more general difference
between laboratory and field evidence that is a source of debate (Lazear, Malmendier, and
Weber, 2006; Levitt and List, 2006).
In the current context, field evidence and laboratory experiments help to evaluate different
treatments. The laboratory experiments evaluate the treatment for people that are (coercedly)
exposed to an unusually elevated level of violence. The setting may approximate the reaction
of audiences to the first instances of media violence. The field evidence in this paper evaluates
the treatment to elevated violence of people that choose to expose themselves to violence,
and have seen violence before. This experiment evaluates the effect of a marginal increase in
violence over an habituation level.
19
5 Conclusions
We have attempted to provide causal evidence on the short-run effect of exposure to media
violence on violent crime. We exploit the natural experiment induced by the time-series vari-
ation in the violence of movies at the box office. We show that exposure to violent movies has
two effects on violent crimes: (i) It reduces significantly violent crime in the evening of the day
of exposure. (ii) To a lesser extent, it reduces violent crime during the night hours following
the exposure.
We interpret the first finding as incapacitation: potential criminals cannot commit crimes
while at the movie theater. As simple as this finding is, it had been neglected in the literature,
despite its quantitative importance. Based on our estimates, we compute that incapacitation
due to violent movies deters about 60 assaults per evening in the US. We interpret the second
finding as suggesting that exposure to violent movies does not cause a temporary surge in
violence. We attribute the difference in results from the psychology experiments to differences
in the details of exposure to media violence, and to sorting in the field.
This paper cannot, unfortunately, address the important question on the long-run effect
of exposure to movie violence. As such, it should not be used to inform policy on the effects
of limiting the level of violence allowed in the media. Instead, it provides evidence on the
effect of broadcasting an additional violent movie to consumers that are already exposed to
violence–the additional exposure appears, if anything, to reduce violent crime.
In ongoing work, we plan to explore further impacts of movie content, such as the impact
of sexual content on sexual assaults. This allows us to test in the field the laboratory findings
that indicate a strong effect of sexual arousal on willingness to engage in behavior that may
lead to a date rape. (Ariely and Loewenstein, forthcoming).
20
A Appendix A - Data
Imputation of daily box-office audience. The daily box-office movies data is availablestarting from September 1997, and it covers the 10 highest-selling movies on that day. Toexpand the coverage to the period January 1995-August 1997 and to the movies that do notmake the daily top 10 list, we impute the daily data, whenever missing, using the weekendbox-office data for the same movie in the same week. Fortunately, the weekend data is availablethroughout the whole sample for the 50 highest-selling movies. For the imputation, we exploitthe regularity in the within-week pattern of sales (Figure 2). Ticket sales peak on Saturday,Friday, and Sunday (in decreasing order) and are lowest on Tuesday (Figure 2).
For the imputation, we use the following model. Denote by aj,t the daily audience of movie jon date t, and by awj,w(t) the weekend audience of movie j on weekend w(t) corresponding to date
t. (Since most movies are released on Friday, the function w (t) assigns the days from Mondaythrough Thursday to the previous weekend.) We assume that the daily audience is a share s ofthe weekend audience, where the share allowed to depend on a set of controls Y , s (Y ): aj,t =s (X) awj,w(t). After taking logs, the model can be written as ln (aj,t) = ln(s (Y ))+ln(a
wj,w(t)). The
most important control for the share ln (s (Y )) is the set of day-of-week indicators ddt : differentweekdays capture a different share of the overall revenue (Figure 2). We allow the weekdayshare to differ by month (in the summer the Monday-Thursday audience is larger), rating type(G/PG/PG-13/R/NC-17/Unrated/Missing Rating) and in the first week of release. This setof controls X (month indicators, rating indicators, and indicator for first week) therefore, isinteracted with the day-of-week dummies, as well as present in levels. Finally, we control fora set of holidays Ht, described below. We estimate
ln (aj,t)− ln(awj,w(t)) =Xd∈D
βdddt +Xd∈DΓd,Xddt ∗Xj,t + ΓXj,t +ΦHt + εj,t
over the set of movie-day observations (j, t) for which we observe both the daily audienceaj,t and the weekend audience awj,w(t). We use the predicted values from the regressions,dln (aj,t)− ln(awj,w(t)), to obtain the predicted daily audience aj,t, as follows: aj,t = exp[ln(awj,w(t))+dln (aj,t)− ln(awj,w(t))]. The final daily box-office audience data is defined as the actual box-officedata aj,t whenever available, and the predicted value otherwise.
The accuracy of the imputation is high. Over the sample on which both the daily and theweekend data are available, a regression of predicted daily revenue aj,t on actual daily revenueaj,t yields a slope coefficient of .9842 with an R2 of .9190.
Holidays. We define a fairly exhaustive set of holiday indicators to take into accountthat (i) holidays generally increase movie attendance; (ii) the effect of different holidays onattendance is quite different (attendance on Labor Day is much higher than on MemorialDay); (iii) attendance increases also the day before a Holiday, and for major holidays in theweek surrounding. Taking into account these facts, we include separate indicators for MartinLuther King Day, President Day, Memorial Day, Labor Day, and Columbus Day, and separateindicators for the Sunday preceding each of these holidays. We also include an indicator forIndependence Day, three Easter indicators (Friday, Saturday, and Sunday), three Thanksgiv-ing indicators (Wednesday, Thursday, and Thanksgiving weekend), four Christmas indicators(December 20-23, December 24, December 25, and December 26-30), and three New Yearindicators (December 31, January 1, and January 2-3). In addition, we include an indicatorfor holidays observed on a Monday or a Friday if they fall on a weekend (Independence Day,
21
Christmas, New Year, Veteran’s Day), and an indicator for Sunday before these holidays, ifthey are observed on Monday. Finally, we include an indicator for St. Patrick Day, ValentineDay, Halloween, Cinco de Mayo, Mother’s Day, and Superbowl.
Imputation of DVD/VHS data. The data on weekly DVD and VHS rentals is lesscomplete than the data on theater attendance. The data for the top 25 DVD weekly rentalsis available from July 2000 to December 20029. The data on VHS weekly rentals covers thetop 10 rentals over the period July 1999-October 2000, and the top 40 rentals over the periodJune 2001-July 2002. In order to construct a continuous series, we exploit the fact that thehigh-rental VHSs in a given week are highly correlated with the high-rental DVDs in the sameweek. We denote by aDVD
j,t the number of rentals of DVDs of movie j in week t, and by aV HSj,t
the corresponding number of VHSs rentals. We then impute the number of DVD rentals,
whenever missing, using the model log³aDVDj,t
´= α + β log
³aV HSj,t
´+ ηy + t + εj,t, where ηy
is a set of year indicators, and t is a linear time trend that captures the fact that over timeDVD rentals replaced VHS rentals. Similarly, whenever the number of VHS rentals is missing,
we impute it using the model log³aV HSj,t
´= α+ β log
³aDVDj,t
´+ ηy + t+ εj,t. A regression of
the predicted rental series on the actual series yields an R2 of .9031 for DVDs and .8603 forVHSs. The final measure of DVD and VHS rentals is the sum of the DVD and the VHS series,including the imputed values.
9In some weeks in the year 2000, the data covers only the top-20 rentals.
22
References
[1] Anderson, Craig A., and Brad J. Bushman. “Effects of Violent Video Games on AggressiveBehavior, Aggressive Cognition, Aggressive Affect, Physiological Arousal, and ProsocialBehavior: A Meta-analytic Review of the Scientific Literature.” Psychological Science,Vol. 12, pp. 353—359, 2001.
[2] Anderson, Craig, Leonard Berkowitz, Edward Donnerstein, L. Rowell Huesmann, JamesD. Johnson, Daniele Linz, Neil M. Malamut, and Ellen Wartella. “The Influence of MediaViolence on Youth”, Psychological Science in The Public Interest, Vol. 4, pp. 81-110, 2003.
[3] Dan Ariely and George Loewenstein. “The Heat of the Moment: The Effect of SexualArousal on Sexual Decision Making”, Journal of Behavioral Decision Making, forthcom-ing.
[4] Bandura, Albert, Dorothea Ross, and Sheila A. Ross. “Imitation of Film-mediated Ag-gressive Models,” Journal of Abnormal and Social Psychology, Vol. 66, pp. 3—11, 1963.
[5] Besley, Timothy, and Robin Burgess. “The Political Economy Of Government Respon-siveness: Theory And Evidence From India”, Quarterly Journal of Economics, 117, 2002.
[6] Bushman, Brad J. “Moderating Role of Trait Aggressiveness in the Effects of ViolentMedia on Aggression,” Journal of Personality and Social Psychology, Vol, 69, pp. 950—960, 1995.
[7] Card, David and Gordon Dahl. “Professional Sports and Domestic Violence”, workingpaper, 2006.
[8] DellaVigna, Stefano and Ethan Kaplan, “The Fox News Effect: Media Bias and Voting,”2006.
[9] DiIulio, John and Anne Piehl. “Does Prison Pay? The Stormy National Debate over theCost-Effectiveness of Imprisonment.” Brookings Review. Fall, pp. 28—35, 1991.
[10] Federal Trade Commission, Marketing Violent Entertainment To Children:A Review OfSelf-Regulation And Industry Practices In The Motion Picture, Music Recording, AndElectronic Game Industries., 2000.
[11] Gentzkow, Matthew. “Television and Voter Turnout”, Quarterly Journal of Economics,August 2006.
[12] Gentzkow, Matthew and Jesse Shapiro. “Does Television Rot Your Brain? New Evidencefrom the Coleman Study”, 2006.
[13] Green, Donald P. and Alan S. Gerber, Get Out The Vote!, Washington, D.C.: BrookingsInstitution Press, 2004.
[14] Jacob, Brian and Lars Lefgren, “Are Idle Hands The Devil’s Workshop? Incapacitation,Concentration And Juvenile Crime”, American Economic Review, Vol. 93, 2003.
[15] Johnson, Jeffrey G., Patricia Cohen, Elizabeth M. Smailes, Stephanie Kasen, Judith S.Brook. “Television Viewing and Aggressive Behavior During Adolescence and Adulthood”,Science, Vol. 295, pp. 2468-2471, 2002.
23
[16] Joint Statement, Joint Statement on The Impact of Entertainment Violence on Children,by American Academy of Pediatrics, American Academy of Child and Adolescent Psy-chiatry, American Medical Association, American Psychological Association, AmericanAcademy of Family Physicians, and American Psychiatric Association, 2000.
[17] Josephson, Wendy L. “Television Violence and Children’s Aggression: Testing the Prim-ing, Social Script, and Disinhibition Predictions.” Journal of Personality and Social Psy-chology, Vol. 53, pp. 882—890, 1987.
[18] Kessler, Daniel and Steven Levitt. “Using Sentence Enhancements to Distinguish betweenDeterrence and Incapacitation,” Journal of Law and Economics, Vol. 42, pp. 343-63, 1999.
[19] Lazear, Edward, Ulrike Malmendier, and Roberto Weber, “Sorting in Experiments withApplication to Social Preferences”, Working paper, 2005.
[20] Leyens, Jacques-Philippe, Leoncio Camino, Ross D. Parke, and Leonard Berkowitz. “Ef-fects of Movie Violence on Aggression in a Field Setting as a Function of Group Dominanceand Cohesion,” Journal of Personality and Social Psychology, Vol. 32, 346—360, 1975.
[21] Levitt, Steven. “The Effect of Prison Population Size on Crime Rates: Evidence fromPrison Overcrowding Litigation.” Quarterly Journal of Economics. Vol. 111, pp. 319—52,1996.
[22] Levitt, Steven, and John List, “What Do Laboratory Experiments Tell Us About the RealWorld?”, Working paper, 2006.
[23] Lovaas, O. Ivar, “Effect of exposure To Symbolic Aggression on Aggressive Behavior,”Child Development, Vol. 32, pp. 37—44, 1961.
[24] Motion Picture Association, “2004 US Movie Attendance Study”, 2005.
[25] Phillips, David P. “The Impact of Fictional Television Stories on U.S. Adult Fatalities:New Evidence on the Effect of the Mass Media on Violence.” American Journal of Soci-ology, Vol. 87, pp. 1340—1359, 1982.
[26] Phillips, David P. “The Impact of Mass Media Violence on U.S. Homicides,” AmericanSociological Review, Vol. 48, pp. 560—568, 1983.
[27] Spelman, William. Criminal Incapacitation, Springer Eds., 1993.
[28] Stromberg, David. “Radio Impact on Public Spending”, Quarterly Journal of Economics,Vol. 119, pp. 189-221, 2004.
24
Figure 1a. Weekend Theater Audience of Strongly Violent Movies
0
2.5
5
7.5
10
12.5
15
12/3
0/19
94
3/30
/199
5
6/30
/199
5
9/30
/199
5
12/3
0/19
95
3/30
/199
6
6/30
/199
6
9/30
/199
6
12/3
0/19
96
3/30
/199
7
6/30
/199
7
9/30
/199
7
12/3
0/19
97
3/30
/199
8
6/30
/199
8
9/30
/199
8
12/3
0/19
98
3/30
/199
9
6/30
/199
9
9/30
/199
9
12/3
0/19
99
3/30
/200
0
6/30
/200
0
9/30
/200
0
12/3
0/20
00
3/30
/200
1
6/30
/200
1
9/30
/200
1
12/3
0/20
01
3/30
/200
2
6/30
/200
2
9/30
/200
2
Weekend
Wee
kend
aud
ienc
e fo
r vio
lent
mov
ies
(in m
illio
ns o
f peo
ple)
May 26 1995Die Hard
Nov 8 1996Ransom
July 25 1997Air Force One July 24 1998
Saving Private Ryan
July 7 2000Scary Movie Feb 9 2001
Hannibal
Dec 12 1997Scream 2
July 20 2001Jurassic Park 3
Nov 26 1999End Of Days
Nov 19 1999Sleepy Hollow
Notes: Plot of weekend box-office audience (in millions of people) for movies rated as strongly violent. The 10 weekends with the highest audience for strongly violent movies are labeled in the Figure. Movies are rated as strongly violent if they have a kids-in-mind.com rating 8-10. The audience data is obtained from box-office sales (from the-numbers.com) deflated by the average price of a ticket.
25
Figure 1b. Weekend Theater Audience of Mildly Violent Movies
0
5
10
15
20
25
12/3
0/19
94
3/30
/199
5
6/30
/199
5
9/30
/199
5
12/3
0/19
95
3/30
/199
6
6/30
/199
6
9/30
/199
6
12/3
0/19
96
3/30
/199
7
6/30
/199
7
9/30
/199
7
12/3
0/19
97
3/30
/199
8
6/30
/199
8
9/30
/199
8
12/3
0/19
98
3/30
/199
9
6/30
/199
9
9/30
/199
9
12/3
0/19
99
3/30
/200
0
6/30
/200
0
9/30
/200
0
12/3
0/20
00
3/30
/200
1
6/30
/200
1
9/30
/200
1
12/3
0/20
01
3/30
/200
2
6/30
/200
2
9/30
/200
2
Weekend
Wee
kend
aud
ienc
e fo
r vio
lent
mov
ies
(in m
illio
ns o
f peo
ple) May 24 1996
TwisterMay 23 1997Lost World
Dec 26 1997Titanic
Jan 16 1998Titanic
June 11 1999Austin Powers 2
Aug 3 2001Rush Hour 2
May 3 2002Spider-Man
May 10 2002Spider-Man
May 17 2002Star Wars 2
May 24 2002Star Wars 2
Notes: Plot of weekend box-office audience (in millions of people) for movies rated as mildly violent. The 10 weekends with the highest audience for mildly violent movies are labeled in the Figure. Movies are rated as mildly violent if they have a kids-in-mind.com rating 5-7. The audience data is obtained from box-office sales (from the-numbers.com) deflated by the average price of a ticket.
26
Figure 1c. Weekend Assault Rate
14
16
18
20
22
24
26
281/
6/19
95
4/6/
1995
7/6/
1995
10/6
/199
5
1/6/
1996
4/6/
1996
7/6/
1996
10/6
/199
6
1/6/
1997
4/6/
1997
7/6/
1997
10/6
/199
7
1/6/
1998
4/6/
1998
7/6/
1998
10/6
/199
8
1/6/
1999
4/6/
1999
7/6/
1999
10/6
/199
9
1/6/
2000
4/6/
2000
7/6/
2000
10/6
/200
0
1/6/
2001
4/6/
2001
7/6/
2001
10/6
/200
1
1/6/
2002
4/6/
2002
7/6/
2002
10/6
/200
2
Weekend
Wee
kend
Ass
aults
(per
100
,000
Peo
ple)
Assaults per CapitaTop 10 Movie Viol. 5-7Top 10 Movie Viol. 8-10
May 18 2001June 14 1996
Oct 18 1996
Oct 25 1996 May 4 2001
May 10 1996
Sep 14 2001July 6 2001Aug 16 1996
Oct 4 2002
Notes: Plot of weekend assault rates per 100,000 people. The assault data is from NIBRS. The 10 weekends with the highest assault rates are listed in the Figure, together with the 10 weekends with the highest strong movie violence audience (Figure 1a) and the 10 weekends with the highest mild movie violence audience (Figure 1b).
27
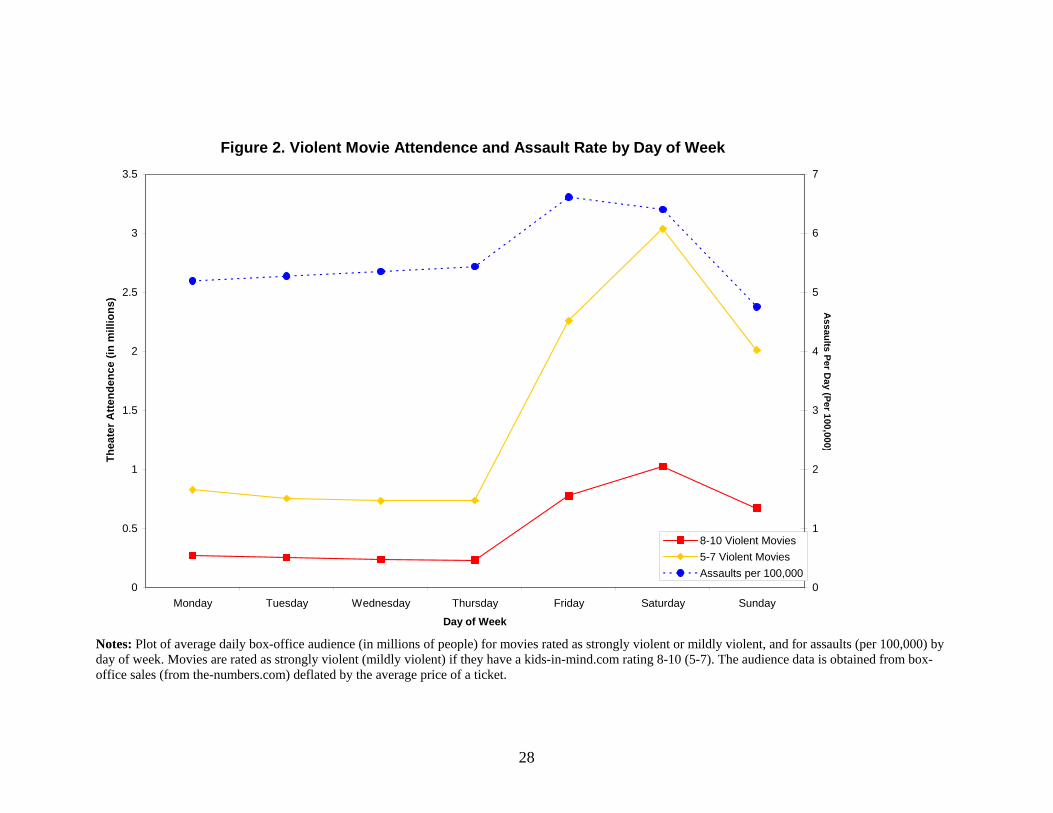
Figure 2. Violent Movie Attendence and Assault Rate by Day of Week
0
0.5
1
1.5
2
2.5
3
3.5
Monday Tuesday Wednesday Thursday Friday Saturday Sunday
Day of Week
Thea
ter A
ttend
ence
(in
mill
ions
)
0
1
2
3
4
5
6
7
Assaults Per D
ay (Per 100,000)
8-10 Violent Movies5-7 Violent MoviesAssaults per 100,000
Notes: Plot of average daily box-office audience (in millions of people) for movies rated as strongly violent or mildly violent, and for assaults (per 100,000) by day of week. Movies are rated as strongly violent (mildly violent) if they have a kids-in-mind.com rating 8-10 (5-7). The audience data is obtained from box-office sales (from the-numbers.com) deflated by the average price of a ticket.
28
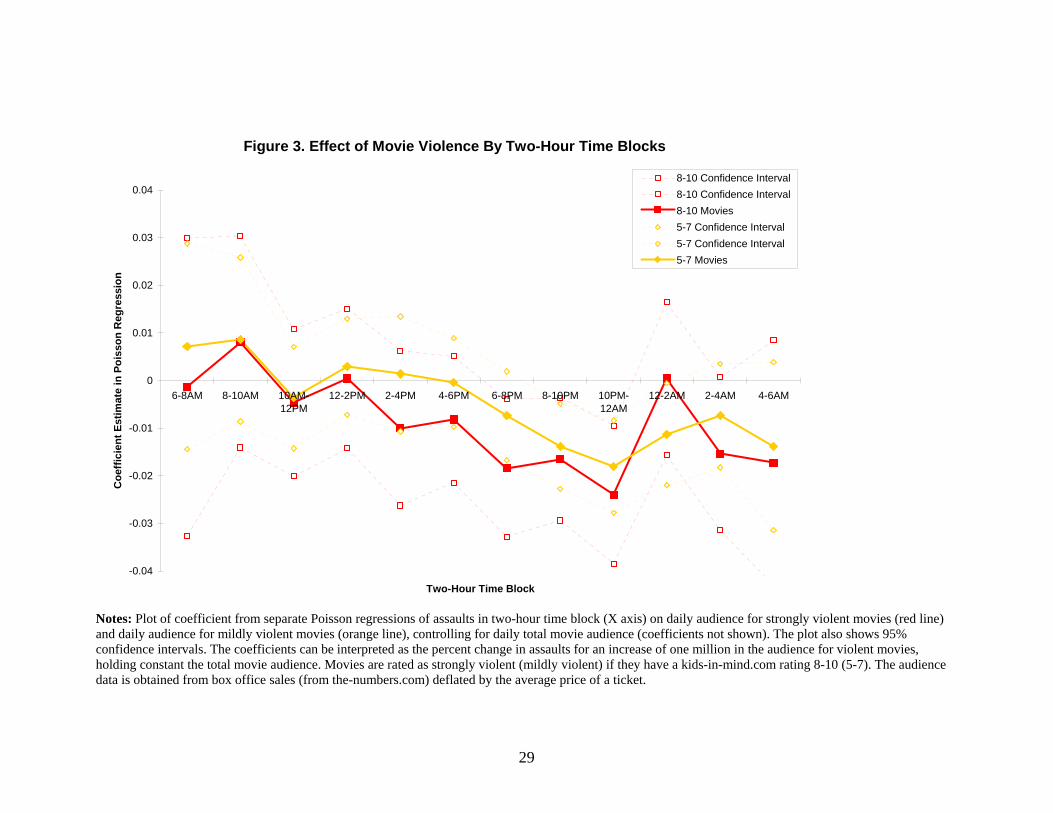
Figure 3. Effect of Movie Violence By Two-Hour Time Blocks
-0.04
-0.03
-0.02
-0.01
0
0.01
0.02
0.03
0.04
6-8AM 8-10AM 10AM-12PM
12-2PM 2-4PM 4-6PM 6-8PM 8-10PM 10PM-12AM
12-2AM 2-4AM 4-6AM
Two-Hour Time Block
Coe
ffici
ent E
stim
ate
in P
oiss
on R
egre
ssio
n
8-10 Confidence Interval8-10 Confidence Interval8-10 Movies5-7 Confidence Interval5-7 Confidence Interval5-7 Movies
Notes: Plot of coefficient from separate Poisson regressions of assaults in two-hour time block (X axis) on daily audience for strongly violent movies (red line) and daily audience for mildly violent movies (orange line), controlling for daily total movie audience (coefficients not shown). The plot also shows 95% confidence intervals. The coefficients can be interpreted as the percent change in assaults for an increase of one million in the audience for violent movies, holding constant the total movie audience. Movies are rated as strongly violent (mildly violent) if they have a kids-in-mind.com rating 8-10 (5-7). The audience data is obtained from box office sales (from the-numbers.com) deflated by the average price of a ticket.
29
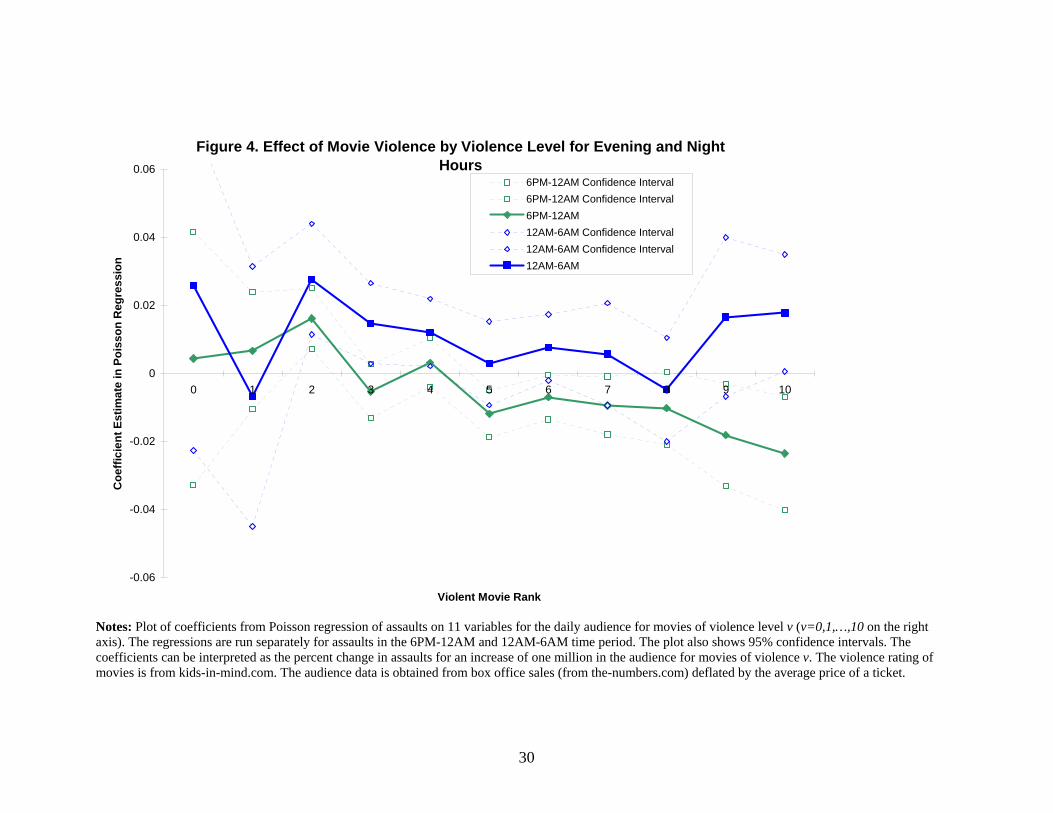
Figure 4. Effect of Movie Violence by Violence Level for Evening and Night Hours
-0.06
-0.04
-0.02
0
0.02
0.04
0.06
0 1 2 3 4 5 6 7 8 9 10
Violent Movie Rank
Coe
ffici
ent E
stim
ate
in P
oiss
on R
egre
ssio
n
6PM-12AM Confidence Interval6PM-12AM Confidence Interval6PM-12AM12AM-6AM Confidence Interval12AM-6AM Confidence Interval12AM-6AM
Notes: Plot of coefficients from Poisson regression of assaults on 11 variables for the daily audience for movies of violence level v (v=0,1,…,10 on the right axis). The regressions are run separately for assaults in the 6PM-12AM and 12AM-6AM time period. The plot also shows 95% confidence intervals. The coefficients can be interpreted as the percent change in assaults for an increase of one million in the audience for movies of violence v. The violence rating of movies is from kids-in-mind.com. The audience data is obtained from box office sales (from the-numbers.com) deflated by the average price of a ticket.
30
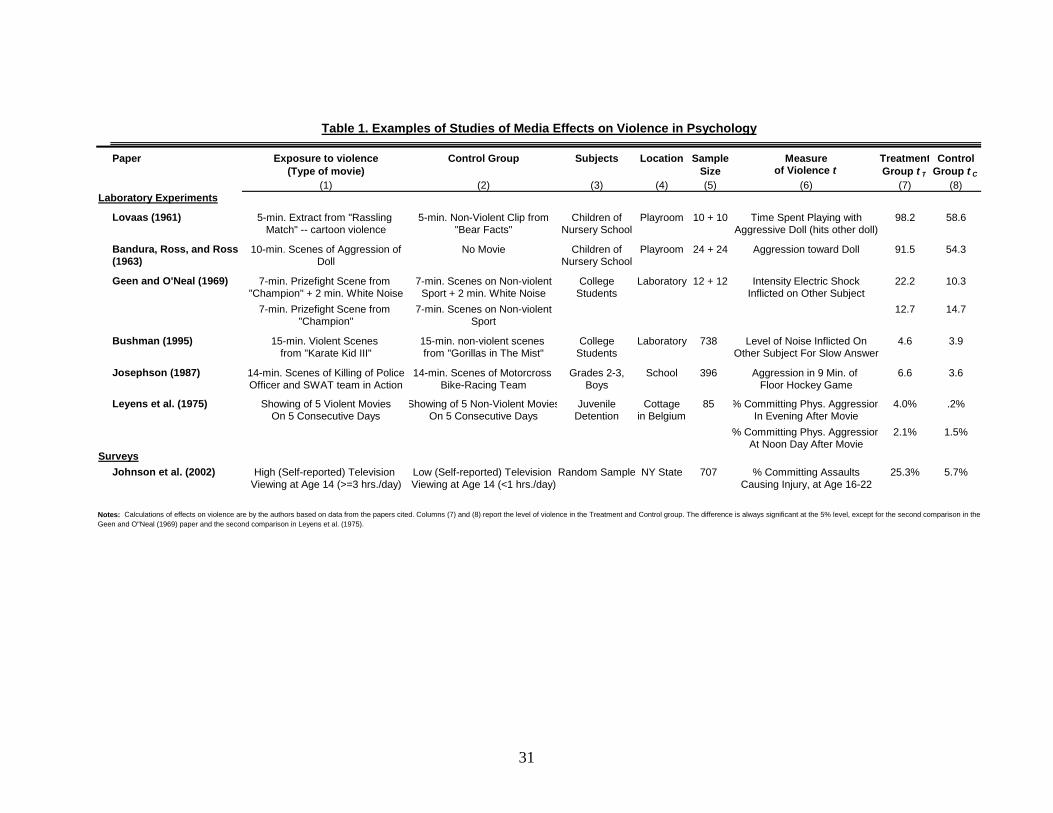
Paper Exposure to violence Control Group Subjects Location Sample Measure Treatment Control(Type of movie) Size of Violence t Group t T Group t C
(1) (2) (3) (4) (5) (6) (7) (8)Laboratory Experiments
Lovaas (1961) 5-min. Extract from "Rassling 5-min. Non-Violent Clip from Children of Playroom 10 + 10 Time Spent Playing with 98.2 58.6Match" -- cartoon violence "Bear Facts" Nursery School Aggressive Doll (hits other doll)
Bandura, Ross, and Ross 10-min. Scenes of Aggression of No Movie Children of Playroom 24 + 24 Aggression toward Doll 91.5 54.3(1963) Doll Nursery School
Geen and O'Neal (1969) 7-min. Prizefight Scene from 7-min. Scenes on Non-violent College Laboratory 12 + 12 Intensity Electric Shock 22.2 10.3"Champion" + 2 min. White Noise Sport + 2 min. White Noise Students Inflicted on Other Subject
7-min. Prizefight Scene from 7-min. Scenes on Non-violent 12.7 14.7"Champion" Sport
Bushman (1995) 15-min. Violent Scenes 15-min. non-violent scenes College Laboratory 738 Level of Noise Inflicted On 4.6 3.9from "Karate Kid III" from "Gorillas in The Mist" Students Other Subject For Slow Answer
Josephson (1987) 14-min. Scenes of Killing of Police 14-min. Scenes of Motorcross Grades 2-3, School 396 Aggression in 9 Min. of 6.6 3.6Officer and SWAT team in Action Bike-Racing Team Boys Floor Hockey Game
Leyens et al. (1975) Showing of 5 Violent Movies Showing of 5 Non-Violent Movies Juvenile Cottage 85 % Committing Phys. Aggression 4.0% .2%On 5 Consecutive Days On 5 Consecutive Days Detention in Belgium In Evening After Movie
% Committing Phys. Aggression 2.1% 1.5%At Noon Day After Movie
SurveysJohnson et al. (2002) High (Self-reported) Television Low (Self-reported) Television Random Sample NY State 707 % Committing Assaults 25.3% 5.7%
Viewing at Age 14 (>=3 hrs./day) Viewing at Age 14 (<1 hrs./day) Causing Injury, at Age 16-22
Notes: Calculations of effects on violence are by the authors based on data from the papers cited. Columns (7) and (8) report the level of violence in the Treatment and Control group. The difference is always significant at the 5% level, except for the second comparison in theGeen and O"Neal (1969) paper and the second comparison in Leyens et al. (1975).
Table 1. Examples of Studies of Media Effects on Violence in Psychology
31
Assaults Assault Rate (per day) (per 100,000 pop)
mean std dev mean std dev(1) (2) (3) (4)
Overall 3.66 6.42 5.57 6.15By time of day 6:00 am to 11:59 am 0.52 1.24 0.74 1.67 12:00 pm to 5:59 pm 1.11 2.20 1.59 2.65 6:00 pm to 11:59pm 1.45 2.73 2.01 3.14 12:00 am to 5:59 am 1.25 2.45 1.16 2.42 not known 0.05 0.33 0.08 0.65By day of week Monday 3.41 6.00 5.19 5.87 Tuesday 3.47 6.07 5.27 5.87 Wednesday 3.51 6.11 5.35 5.93 Thursday 3.56 6.22 5.43 5.97 Friday 4.32 7.26 6.61 6.83 Saturday 4.20 7.25 6.40 6.85 Sunday 3.16 5.75 4.75 5.37
By age (of offender) 15 to 24 1.16 2.37 1.76 2.90 25 to 34 0.89 1.92 1.32 2.27 35 to 44 0.64 1.36 0.97 1.83 other age or age not known 0.97 1.91 1.52 2.56By gender (of offender) male 2.74 4.94 4.17 4.86 female 0.92 1.87 1.41 2.46
Overall movie audience (daily data) Movie audience by Kids-in-Mind rating Strongly violent (12.6%) Mildly violent (43%) Movie audience by alternative MPAA rating Strongly violent (5%) Mildly violent (36%)DVD and VHS rentals (weekly data) Rentals by Kids-in-Mind rating Strongly violent (17%) Moderately violent (49%)NAverage City Population
10.40 4.82
Notes: An observation is an agency-day observation over the years 1995-2002. The sample includes all agencies with population of at least 25,000 and reporting crimes in at least 300 days in the year. The movie audience numbers are obtained from daily box-office revenue divided by the average price per ticket. The DVD and VHS rental numbers are obtained from weekly rental revenue divided by the average price of a rental, and are only available for July 1999 - December 2002. The ratings of violent movies are from www.kids-in-mind.com. The audience of mildly violent movies is the audience of all movies with a violence rating 5-7. The audience of strongly violent movies is the audience of all movies with a violence rating 8-10. The alternative MPAA rating is based on the presence of key words used to describe why a movie received a certain rating by the MPAA.
21.44 7.14
3.71 2.86
425559, 264 cities59155
1.26 1.250.28 0.43
0.47 0.631.62 1.49
(5) (6)3.73 2.77
Table 2. Summary Statistics
Movie / Rental Audience(in millions of tickets / rentals)
mean std dev
32
NegativeSpecification: Binomial
Assaults Log (AssaultsDep. Var.: per Capita per Capita)
(1) (2) (3) (4) (5) (6) (7) (8)0.0158 0.0034 -0.0095 -0.0096 -0.0101 -0.0087 -0.5429 -0.0049
(in millions of people in Day t) (0.0066)** (0.0050) (0.0033)*** (0.0032)*** (0.0037)*** (0.0032)*** (0.2017)*** (0.0027)*0.0145 0.0142 -0.0061 -0.0064 -0.0046 -0.0056 -0.4194 -0.0041
(in millions of people in Day t) (0.0045)*** (0.0032)*** (0.0026)** (0.0023)*** (0.0027)* (0.0023)** (0.1395)*** (0.0018)**0.0102 -0.0127 -0.0026 -0.003 -0.0031 -0.0023 -0.2254 -0.0025
(in millions of people in Day t) (0.0027)*** (0.0027)*** (0.0023) (0.0021) (0.0024) (0.0021) (0.1288)* (0.0017)
Year Indicators X X X X X X X XDay-of-Week Indicators X X X X X X XMonth Indicators X X X X X XHoliday Indicators X X X X XUse Only Non-ImputedDaily Audience Data X
N = 425559 N = 425559 N = 425559 N = 425559 N = 353215 N = 425559 N = 425559 N = 308987N
Notes: An observation is an agency-day observation over the years 1995-2002. The sample includes all agencies with population of at least 25,000 and reporting crimes in at least 300 days in the year. Theaudience numbers are obtained from daily box-office revenue divided by the average price per ticket. The ratings of violent movies are from www.kids-in-mind.com. The audience of strongly violent movies is theaudience of all movies with a violence rating 8-10. The audience of mildly violent movies is the audience of all movies with a violence rating 5-7. The specifications in Columns (1) through (5) are Poisson regressionswith the number of assault occurring in day t in an agency as dependent variable. The specification in Column (5) does not use the imputation of daily audience data from the weekend data. The specification inColumn (6) is a Negative Binomial regression. The specifications in Columns (7) and (8) are OLS regressions with assaults per capita (Column (7)) and log (assaults per capita) (Column (8)) as dependent variables.Robust standard errors clustered by date in parentheses. * significant at 10%; ** significant at 5%; *** significant at 1%
Control Variables:
Audience Of Strongly Violent Movies
Audience Of Mildly Violent Movies
Audience Of All Movies
Table 3. The Effect of Movie Violence on Same-Day Assaults
OLS Regression
Number of Assaults in Town k in Day t
Poisson Regression
33
Specification:Dep. Var.:
(1) (2) (3) (4) (5) (6) (7)0.0002 -0.0064 -0.0196 -0.0075 -0.0023 -0.0207 -0.0104
(in millions of people in Day t) (0.0069) (0.0046) (0.0044)*** (0.0061) (0.0042) (0.0044)*** (0.0059)*0.0025 0.0013 -0.0136 -0.0101 0.0014 -0.0131 -0.0102
(in millions of people in Day t) (0.0051) (0.0035) (0.0031)*** (0.0042)** (0.0033) (0.0030)*** (0.0043)**-0.0216 -0.0179 0.0039 0.015 -0.0695 0.0409 0.1144
(in millions of people in Day t) (0.0049)*** (0.0032)*** (0.0027) (0.0044)*** (0.0076)*** (0.0063)*** (0.0127)***0.0058 -0.0043 -0.0101
(in millions of people in Day t) (0.0010)*** (0.0007)*** (0.0013)***-0.0002 0.0001 0.0003
(in millions of people in Day t) (0.0001)*** (0.0000)*** (0.0000)***
6AM-12PM 12PM-6PM 6PM-12AM 12AM-6AM 6AM-6PM 6PM-12AM 12AM-6AMnext day next day
Year Indicators X X X X X X XDay-of-Week Indicators X X X X X X XMonth Indicators X X X X X X XHoliday Indicators X X X X X X X
N = 425559 N = 425559 N = 425559 N = 425559 N = 425559 N = 425559 N = 425559
Notes: An observation is an agency-day observation over the years 1995-2002. The sample includes all agencies with population of at least 25,000 and reporting crimes in at least 300 days in theyear. The audience numbers are obtained from daily box-office revenue divided by the average price per ticket. The ratings of violent movies are from www.kids-in-mind.com. The audience ofstrongly violent movies is the audience of all movies with a violence rating 8-10. The audience of mildly violent movies is the audience of all movies with a violence rating 5-7. The specifications inColumns (1) through (7) are Poisson regressions with the number of assault occurring in day t in an agency as dependent variable. Robust standard errors clustered by date in parentheses.
Poisson RegressionNumber of Assaults in Town k in Day t in Time Window
(Audience Of All Movies)^2
(Audience Of All Movies)^3
* significant at 10%; ** significant at 5%; *** significant at 1%
Time of Day
Audience Of All Movies
Control Variables:
N
Audience Of Strongly Violent Movies
Audience Of Mildly Violent Movies
Table 4. The Effect of Movie Violence on Same-Day Assaults by Time of Day
34
Specification:Dep. Var.:
(1) (2) (3) (4) (5) (6)-0.0146 -0.0174 -0.0069 -0.0158 -0.0063 -0.0051
(in millions of people in day t) (0.0055)*** (0.0060)*** (0.0082) (0.0071)** (0.0073) (0.0103)0.0035 -0.0116 -0.0079 0.0028 -0.0062 -0.0046
(in millions of people in day t) (0.0030) (0.0026)*** (0.0040)** (0.0037) (0.0033)* (0.0052)
0.0017 -0.0149 -0.0035(in millions of people in day t) (0.0059) (0.0057)*** (0.0081)
0.0013 -0.0093 -0.0067(in millions of people in day t) (0.0040) (0.0038)** (0.0055)
-0.0202 0.001 0.0131 -0.0207 0.0042 0.015(in millions of people in day t) (0.0027)*** (0.0025) (0.0044)*** (0.0032)*** (0.0027) (0.0045)***
6AM-6PM 6PM-12AM 12AM-6AM 6AM-6PM 6PM-12AM 12AM-6AMnext day next day
Year Indicators X X X X X XDay-of-week Indicators X X X X X XMonth Indicators X X X X X XHoliday Indicators X X X X X X
N = 420799 N = 420799 N = 420799 N = 420799 N = 420799 N = 420799N
Notes: An observation is an agency-day observation over the years 1995-2002. The sample includes all agencies with population of at least 25,000 and reporting crimes in at least 300 days inthe year. The audience numbers are obtained from daily box-office revenue divided by the average price per ticket. The NPAA ratings are obtained using the one-line NPAA summary of the movie. We characterize as mildly violent movies for which the NPAA Rating contains the word "Violence" of "Violent", with two exceptions: (i) If the reference to reference is qualified by "Brief", "Mild", or"Some", we classify the movie as non-violent; (ii) If the word violence is qualified by either "Bloody", "Brutal", "Disturbing", "Graphic", "Grisly", "Gruesome", or "Strong", we classify the movie asstrongly violent. The standard ratings of violent movies are from www.kids-in-mind.com. The audience of strongly violent movies is the audience of all movies with a violence rating 8-10. Theaudience of mildly violent movies is the audience of all movies with a violence rating 5-7. The specifications are Poisson regressions with the number of assault occurring in day t in an agency asdependent variable. Robust standard errors clustered by date in parentheses. * significant at 10%; ** significant at 5%; *** significant at 1%
Theater Audience Of All Movies
Time of Day
Control Variables:
Audience Of Mildly Violent Movies - NPAA Meas.
Audience Of Strongly Violent Movies - Stand. Meas.
Audience Of Mildly Violent Movies - Stand. Meas.
Table 5. The Effect of Movie Violence on Same-Day Assaults -- Alternative Movie Violence Measure
Poisson RegressionsNumber of Assaults in Town k in Day t in Time Window
Audience Of Strongly Violent Movies - NPAA Meas.
35
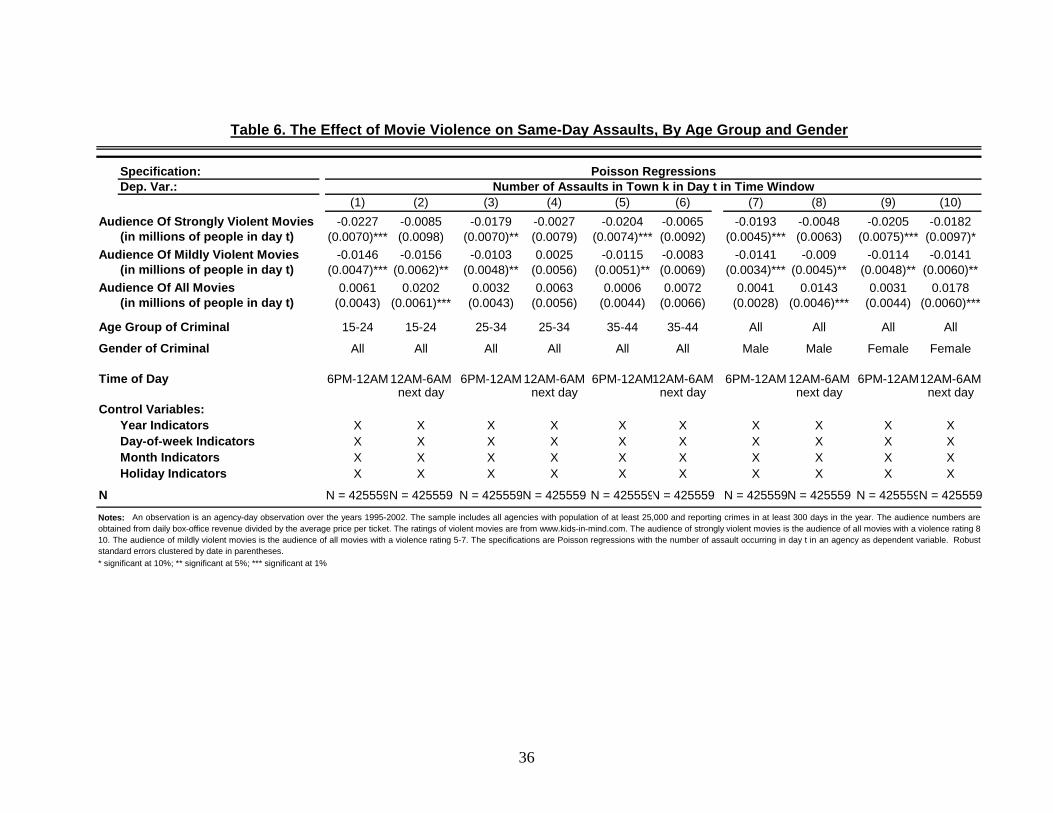
Specification:Dep. Var.:
(1) (2) (3) (4) (5) (6) (7) (8) (9) (10)-0.0227 -0.0085 -0.0179 -0.0027 -0.0204 -0.0065 -0.0193 -0.0048 -0.0205 -0.0182
(in millions of people in day t) (0.0070)*** (0.0098) (0.0070)** (0.0079) (0.0074)*** (0.0092) (0.0045)*** (0.0063) (0.0075)*** (0.0097)*-0.0146 -0.0156 -0.0103 0.0025 -0.0115 -0.0083 -0.0141 -0.009 -0.0114 -0.0141
(in millions of people in day t) (0.0047)*** (0.0062)** (0.0048)** (0.0056) (0.0051)** (0.0069) (0.0034)*** (0.0045)** (0.0048)** (0.0060)**0.0061 0.0202 0.0032 0.0063 0.0006 0.0072 0.0041 0.0143 0.0031 0.0178
(in millions of people in day t) (0.0043) (0.0061)*** (0.0043) (0.0056) (0.0044) (0.0066) (0.0028) (0.0046)*** (0.0044) (0.0060)***
15-24 15-24 25-34 25-34 35-44 35-44 All All All All
All All All All All All Male Male Female Female
6PM-12AM 12AM-6AM 6PM-12AM 12AM-6AM 6PM-12AM12AM-6AM 6PM-12AM 12AM-6AM 6PM-12AM12AM-6AMnext day next day next day next day next day
Year Indicators X X X X X X X X X XDay-of-week Indicators X X X X X X X X X XMonth Indicators X X X X X X X X X XHoliday Indicators X X X X X X X X X X
N = 425559N = 425559 N = 425559N = 425559 N = 425559N = 425559 N = 425559N = 425559 N = 425559N = 425559
Notes: An observation is an agency-day observation over the years 1995-2002. The sample includes all agencies with population of at least 25,000 and reporting crimes in at least 300 days in the year. The audience numbers areobtained from daily box-office revenue divided by the average price per ticket. The ratings of violent movies are from www.kids-in-mind.com. The audience of strongly violent movies is the audience of all movies with a violence rating 8-10. The audience of mildly violent movies is the audience of all movies with a violence rating 5-7. The specifications are Poisson regressions with the number of assault occurring in day t in an agency as dependent variable. Robuststandard errors clustered by date in parentheses. * significant at 10%; ** significant at 5%; *** significant at 1%
Age Group of Criminal
Gender of Criminal
Time of Day
Control Variables:
N
Audience Of Mildly Violent Movies
Audience Of All Movies
Table 6. The Effect of Movie Violence on Same-Day Assaults, By Age Group and Gender
Poisson RegressionsNumber of Assaults in Town k in Day t in Time Window
Audience Of Strongly Violent Movies
36
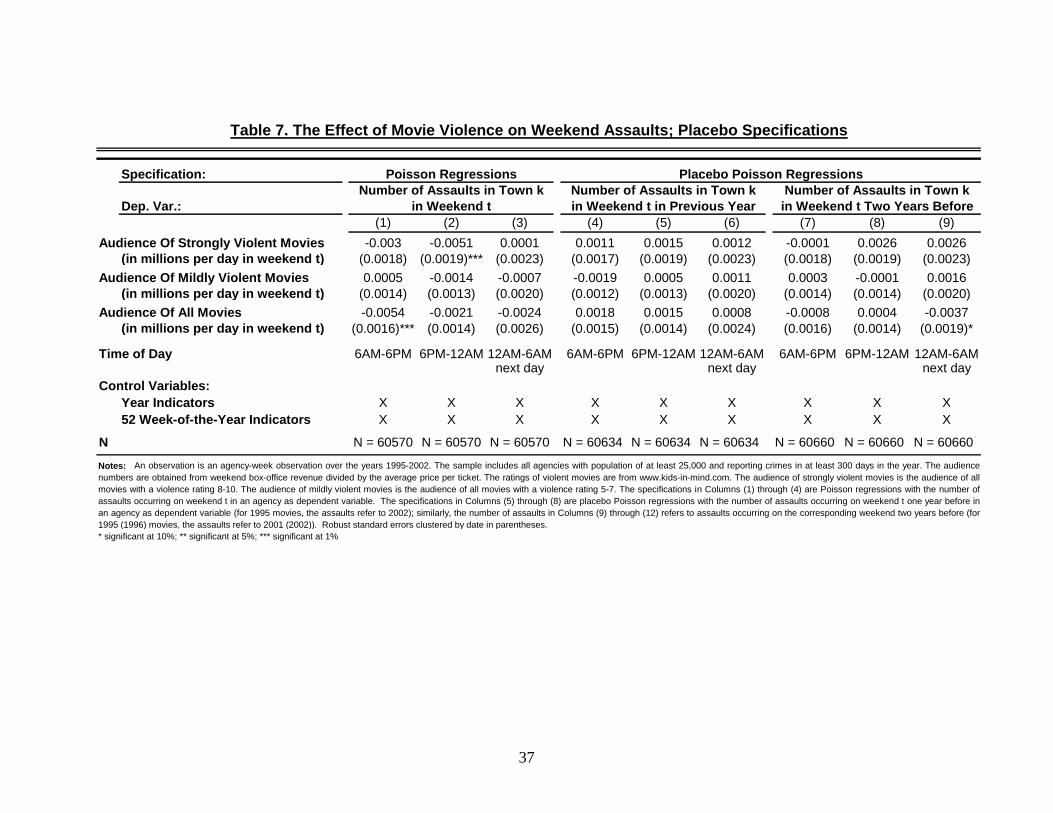
Specification:
Dep. Var.:(1) (2) (3) (4) (5) (6) (7) (8) (9)
-0.003 -0.0051 0.0001 0.0011 0.0015 0.0012 -0.0001 0.0026 0.0026(in millions per day in weekend t) (0.0018) (0.0019)*** (0.0023) (0.0017) (0.0019) (0.0023) (0.0018) (0.0019) (0.0023)
0.0005 -0.0014 -0.0007 -0.0019 0.0005 0.0011 0.0003 -0.0001 0.0016(in millions per day in weekend t) (0.0014) (0.0013) (0.0020) (0.0012) (0.0013) (0.0020) (0.0014) (0.0014) (0.0020)
-0.0054 -0.0021 -0.0024 0.0018 0.0015 0.0008 -0.0008 0.0004 -0.0037(in millions per day in weekend t) (0.0016)*** (0.0014) (0.0026) (0.0015) (0.0014) (0.0024) (0.0016) (0.0014) (0.0019)*
6AM-6PM 6PM-12AM 12AM-6AM 6AM-6PM 6PM-12AM 12AM-6AM 6AM-6PM 6PM-12AM 12AM-6AMnext day next day next day
Year Indicators X X X X X X X X X52 Week-of-the-Year Indicators X X X X X X X X X
N = 60570 N = 60570 N = 60570 N = 60634 N = 60634 N = 60634 N = 60660 N = 60660 N = 60660
Control Variables:
NNotes: An observation is an agency-week observation over the years 1995-2002. The sample includes all agencies with population of at least 25,000 and reporting crimes in at least 300 days in the year. The audiencenumbers are obtained from weekend box-office revenue divided by the average price per ticket. The ratings of violent movies are from www.kids-in-mind.com. The audience of strongly violent movies is the audience of allmovies with a violence rating 8-10. The audience of mildly violent movies is the audience of all movies with a violence rating 5-7. The specifications in Columns (1) through (4) are Poisson regressions with the number ofassaults occurring on weekend t in an agency as dependent variable. The specifications in Columns (5) through (8) are placebo Poisson regressions with the number of assaults occurring on weekend t one year before inan agency as dependent variable (for 1995 movies, the assaults refer to 2002); similarly, the number of assaults in Columns (9) through (12) refers to assaults occurring on the corresponding weekend two years before (for1995 (1996) movies, the assaults refer to 2001 (2002)). Robust standard errors clustered by date in parentheses. * significant at 10%; ** significant at 5%; *** significant at 1%
Audience Of Mildly Violent Movies
Audience Of All Movies
Time of Day
in Weekend t in Weekend t in Previous Year in Weekend t Two Years Before
Audience Of Strongly Violent Movies
Table 7. The Effect of Movie Violence on Weekend Assaults; Placebo Specifications
Poisson Regressions Placebo Poisson RegressionsNumber of Assaults in Town k Number of Assaults in Town k Number of Assaults in Town k
37
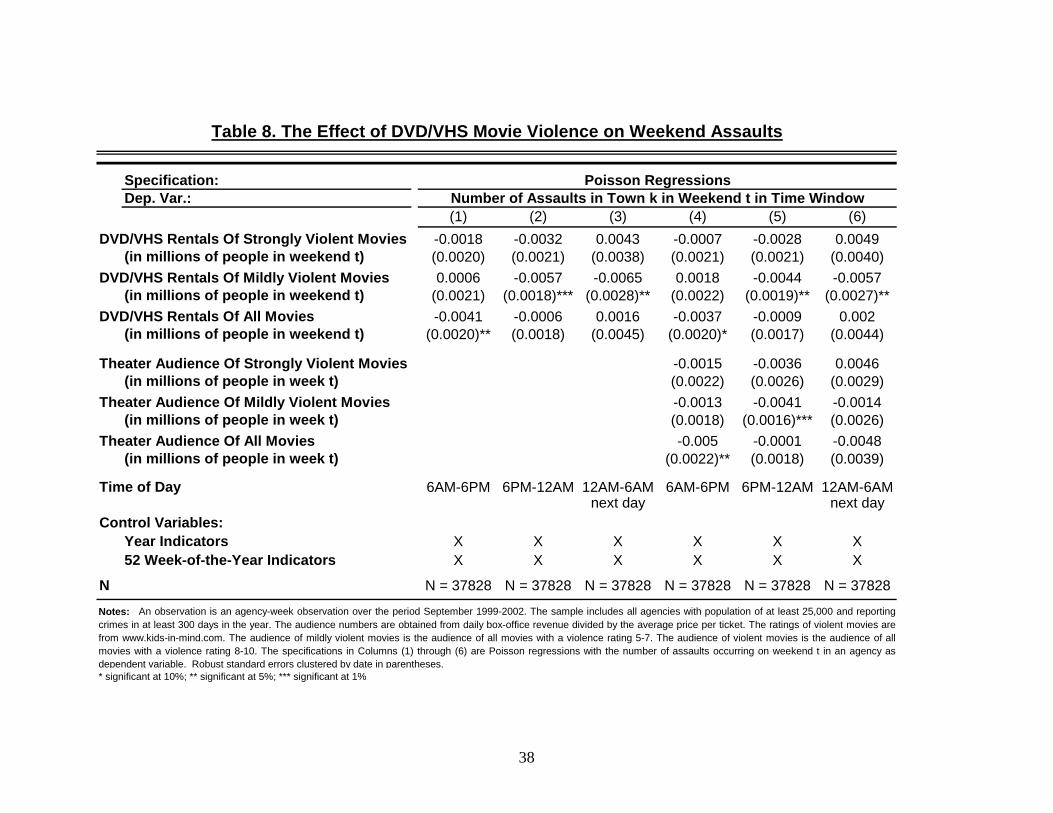
Specification:Dep. Var.:
(1) (2) (3) (4) (5) (6)-0.0018 -0.0032 0.0043 -0.0007 -0.0028 0.0049
(in millions of people in weekend t) (0.0020) (0.0021) (0.0038) (0.0021) (0.0021) (0.0040)0.0006 -0.0057 -0.0065 0.0018 -0.0044 -0.0057
(in millions of people in weekend t) (0.0021) (0.0018)*** (0.0028)** (0.0022) (0.0019)** (0.0027)**-0.0041 -0.0006 0.0016 -0.0037 -0.0009 0.002
(in millions of people in weekend t) (0.0020)** (0.0018) (0.0045) (0.0020)* (0.0017) (0.0044)
-0.0015 -0.0036 0.0046(in millions of people in week t) (0.0022) (0.0026) (0.0029)
-0.0013 -0.0041 -0.0014(in millions of people in week t) (0.0018) (0.0016)*** (0.0026)
-0.005 -0.0001 -0.0048(in millions of people in week t) (0.0022)** (0.0018) (0.0039)
6AM-6PM 6PM-12AM 12AM-6AM 6AM-6PM 6PM-12AM 12AM-6AMnext day next day
Year Indicators X X X X X X52 Week-of-the-Year Indicators X X X X X X
N = 37828 N = 37828 N = 37828 N = 37828 N = 37828 N = 37828NNotes: An observation is an agency-week observation over the period September 1999-2002. The sample includes all agencies with population of at least 25,000 and reportingcrimes in at least 300 days in the year. The audience numbers are obtained from daily box-office revenue divided by the average price per ticket. The ratings of violent movies arefrom www.kids-in-mind.com. The audience of mildly violent movies is the audience of all movies with a violence rating 5-7. The audience of violent movies is the audience of allmovies with a violence rating 8-10. The specifications in Columns (1) through (6) are Poisson regressions with the number of assaults occurring on weekend t in an agency asdependent variable. Robust standard errors clustered by date in parentheses. * significant at 10%; ** significant at 5%; *** significant at 1%
Theater Audience Of All Movies
Time of Day
Control Variables:
DVD/VHS Rentals Of Mildly Violent Movies
DVD/VHS Rentals Of All Movies
Theater Audience Of Strongly Violent Movies
Theater Audience Of Mildly Violent Movies
Table 8. The Effect of DVD/VHS Movie Violence on Weekend Assaults
Poisson RegressionsNumber of Assaults in Town k in Weekend t in Time Window
DVD/VHS Rentals Of Strongly Violent Movies
38
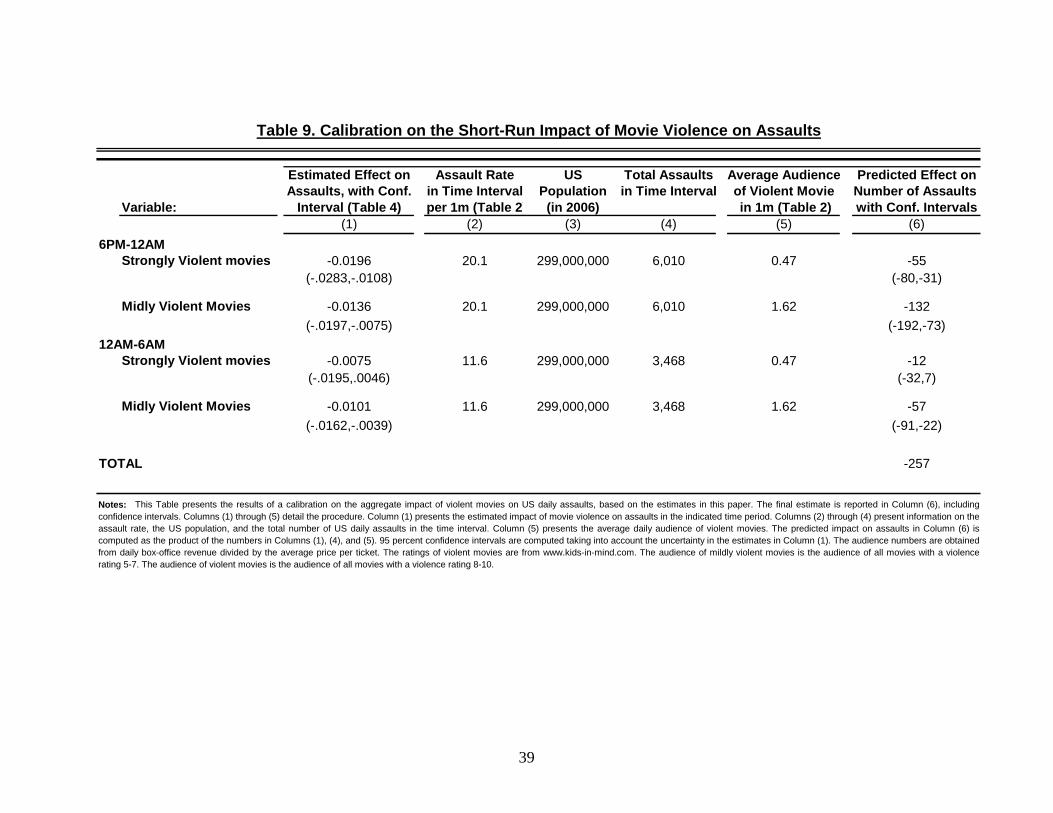
Estimated Effect on Assault Rate US Total Assaults Average Audience Predicted Effect onAssaults, with Conf. in Time Interval Population in Time Interval of Violent Movie Number of Assaults
Variable: Interval (Table 4) per 1m (Table 2) (in 2006) in 1m (Table 2) with Conf. Intervals(1) (2) (3) (4) (5) (6)
Strongly Violent movies -0.0196 20.1 299,000,000 6,010 0.47 -55(-.0283,-.0108) (-80,-31)
Midly Violent Movies -0.0136 20.1 299,000,000 6,010 1.62 -132(-.0197,-.0075) (-192,-73)
Strongly Violent movies -0.0075 11.6 299,000,000 3,468 0.47 -12(-.0195,.0046) (-32,7)
Midly Violent Movies -0.0101 11.6 299,000,000 3,468 1.62 -57(-.0162,-.0039) (-91,-22)
-257
Notes: This Table presents the results of a calibration on the aggregate impact of violent movies on US daily assaults, based on the estimates in this paper. The final estimate is reported in Column (6), includingconfidence intervals. Columns (1) through (5) detail the procedure. Column (1) presents the estimated impact of movie violence on assaults in the indicated time period. Columns (2) through (4) present information on theassault rate, the US population, and the total number of US daily assaults in the time interval. Column (5) presents the average daily audience of violent movies. The predicted impact on assaults in Column (6) iscomputed as the product of the numbers in Columns (1), (4), and (5). 95 percent confidence intervals are computed taking into account the uncertainty in the estimates in Column (1). The audience numbers are obtainedfrom daily box-office revenue divided by the average price per ticket. The ratings of violent movies are from www.kids-in-mind.com. The audience of mildly violent movies is the audience of all movies with a violencerating 5-7. The audience of violent movies is the audience of all movies with a violence rating 8-10.
12AM-6AM
TOTAL
Table 9. Calibration on the Short-Run Impact of Movie Violence on Assaults
6PM-12AM
39
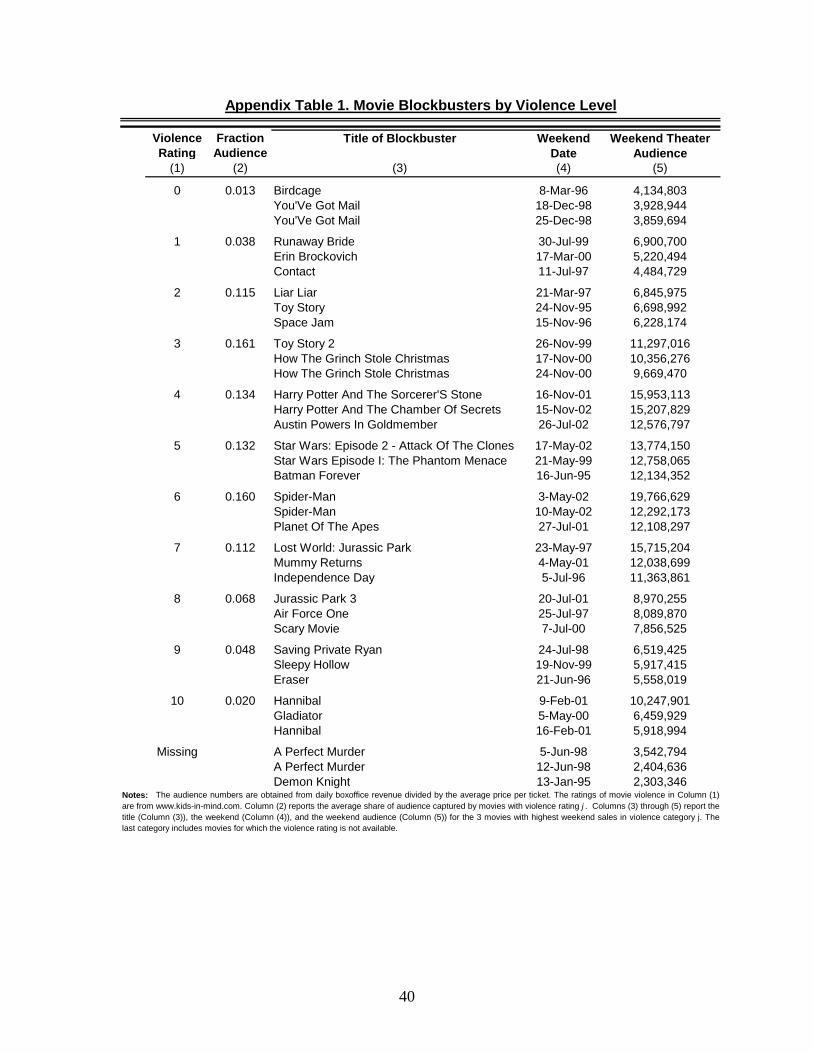
Violence Fraction Title of Blockbuster Weekend Weekend TheaterRating Audience Date Audience
(1) (2) (3) (4) (5)
0 0.013 Birdcage 8-Mar-96 4,134,803You'Ve Got Mail 18-Dec-98 3,928,944You'Ve Got Mail 25-Dec-98 3,859,694
1 0.038 Runaway Bride 30-Jul-99 6,900,700Erin Brockovich 17-Mar-00 5,220,494Contact 11-Jul-97 4,484,729
2 0.115 Liar Liar 21-Mar-97 6,845,975Toy Story 24-Nov-95 6,698,992Space Jam 15-Nov-96 6,228,174
3 0.161 Toy Story 2 26-Nov-99 11,297,016How The Grinch Stole Christmas 17-Nov-00 10,356,276How The Grinch Stole Christmas 24-Nov-00 9,669,470
4 0.134 Harry Potter And The Sorcerer'S Stone 16-Nov-01 15,953,113Harry Potter And The Chamber Of Secrets 15-Nov-02 15,207,829Austin Powers In Goldmember 26-Jul-02 12,576,797
5 0.132 Star Wars: Episode 2 - Attack Of The Clones 17-May-02 13,774,150Star Wars Episode I: The Phantom Menace 21-May-99 12,758,065Batman Forever 16-Jun-95 12,134,352
6 0.160 Spider-Man 3-May-02 19,766,629Spider-Man 10-May-02 12,292,173Planet Of The Apes 27-Jul-01 12,108,297
7 0.112 Lost World: Jurassic Park 23-May-97 15,715,204Mummy Returns 4-May-01 12,038,699Independence Day 5-Jul-96 11,363,861
8 0.068 Jurassic Park 3 20-Jul-01 8,970,255Air Force One 25-Jul-97 8,089,870Scary Movie 7-Jul-00 7,856,525
9 0.048 Saving Private Ryan 24-Jul-98 6,519,425Sleepy Hollow 19-Nov-99 5,917,415Eraser 21-Jun-96 5,558,019
10 0.020 Hannibal 9-Feb-01 10,247,901Gladiator 5-May-00 6,459,929Hannibal 16-Feb-01 5,918,994
Missing A Perfect Murder 5-Jun-98 3,542,794A Perfect Murder 12-Jun-98 2,404,636Demon Knight 13-Jan-95 2,303,346
Appendix Table 1. Movie Blockbusters by Violence Level
Notes: The audience numbers are obtained from daily boxoffice revenue divided by the average price per ticket. The ratings of movie violence in Column (1)are from www.kids-in-mind.com. Column (2) reports the average share of audience captured by movies with violence rating j . Columns (3) through (5) report thetitle (Column (3)), the weekend (Column (4)), and the weekend audience (Column (5)) for the 3 movies with highest weekend sales in violence category j. Thelast category includes movies for which the violence rating is not available.
40


![arXiv:0805.0178v1 [physics.class-ph] 2 May 2008 · [2005, 2006a,b], Az´ema et al. [2007]). The issue of shape effect opens actually the door to a vast and substan-tial scientific](https://img.pdfslide.net/doc/110x75/605fefca81a393343a03b075/arxiv08050178v1-2-may-2008-2005-2006ab-azema-et-al-2007-the-issue.jpg)
![Washington Weekly Post. (Washington, DC) 1899-11-08 [p 4]. · of curing Imagined oj alleged evils have concluded that their apostasy has not been Justified They can see no substan-tial](https://img.pdfslide.net/doc/110x75/5ea687bfdd7e566997022146/washington-weekly-post-washington-dc-1899-11-08-p-4-of-curing-imagined-oj.jpg)