Embed Size (px)
Citation preview
Draft: 12/30/13
Does Student Engagement Affect Student Achievement in High School Economics Classes?
Jody Hoff Senior District Manager
Economic Education and Public Programs San Francisco Federal Reserve Bank
Jane S. Lopus Professor of Economics
Director, Center for Economic Education California State University, East Bay
Prepared for presentation at annual meetings of the Allied Social Science Association, January 2014, Philadelphia, PA. Thanks to Sara Larson for data assistance.
1
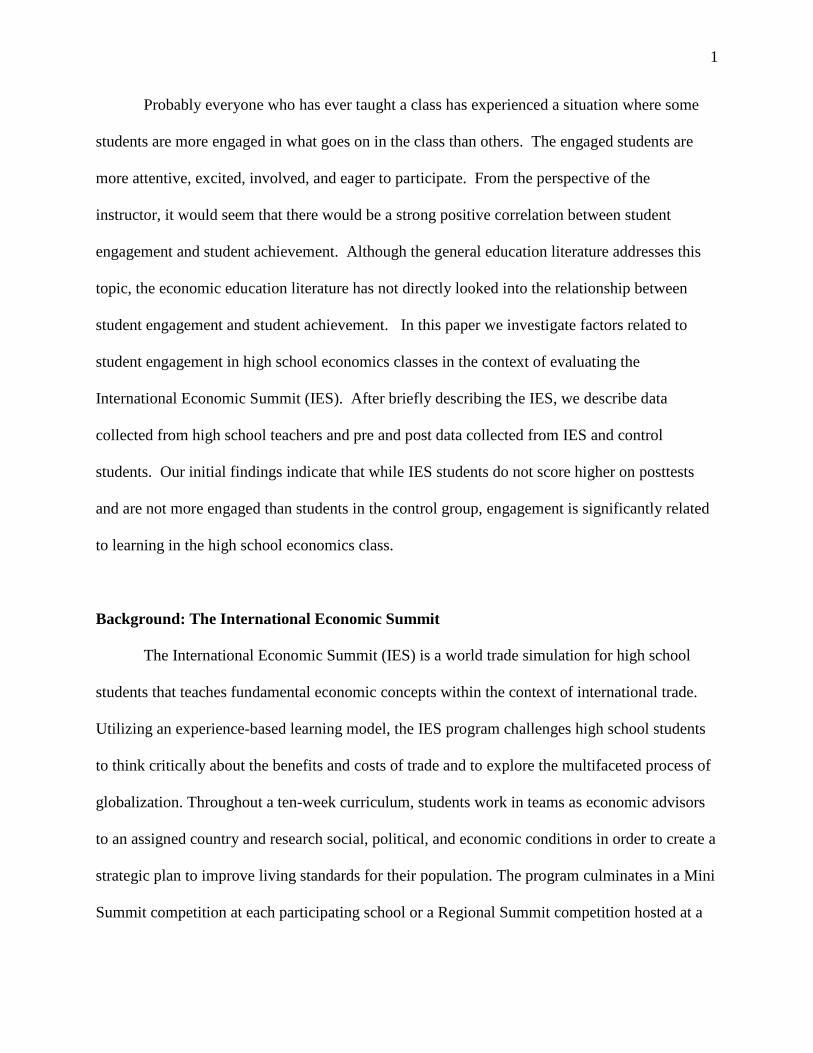
Probably everyone who has ever taught a class has experienced a situation where some
students are more engaged in what goes on in the class than others. The engaged students are
more attentive, excited, involved, and eager to participate. From the perspective of the
instructor, it would seem that there would be a strong positive correlation between student
engagement and student achievement. Although the general education literature addresses this
topic, the economic education literature has not directly looked into the relationship between
student engagement and student achievement. In this paper we investigate factors related to
student engagement in high school economics classes in the context of evaluating the
International Economic Summit (IES). After briefly describing the IES, we describe data
collected from high school teachers and pre and post data collected from IES and control
students. Our initial findings indicate that while IES students do not score higher on posttests
and are not more engaged than students in the control group, engagement is significantly related
to learning in the high school economics class.
Background: The International Economic Summit
The International Economic Summit (IES) is a world trade simulation for high school
students that teaches fundamental economic concepts within the context of international trade.
Utilizing an experience-based learning model, the IES program challenges high school students
to think critically about the benefits and costs of trade and to explore the multifaceted process of
globalization. Throughout a ten-week curriculum, students work in teams as economic advisors
to an assigned country and research social, political, and economic conditions in order to create a
strategic plan to improve living standards for their population. The program culminates in a Mini
Summit competition at each participating school or a Regional Summit competition hosted at a
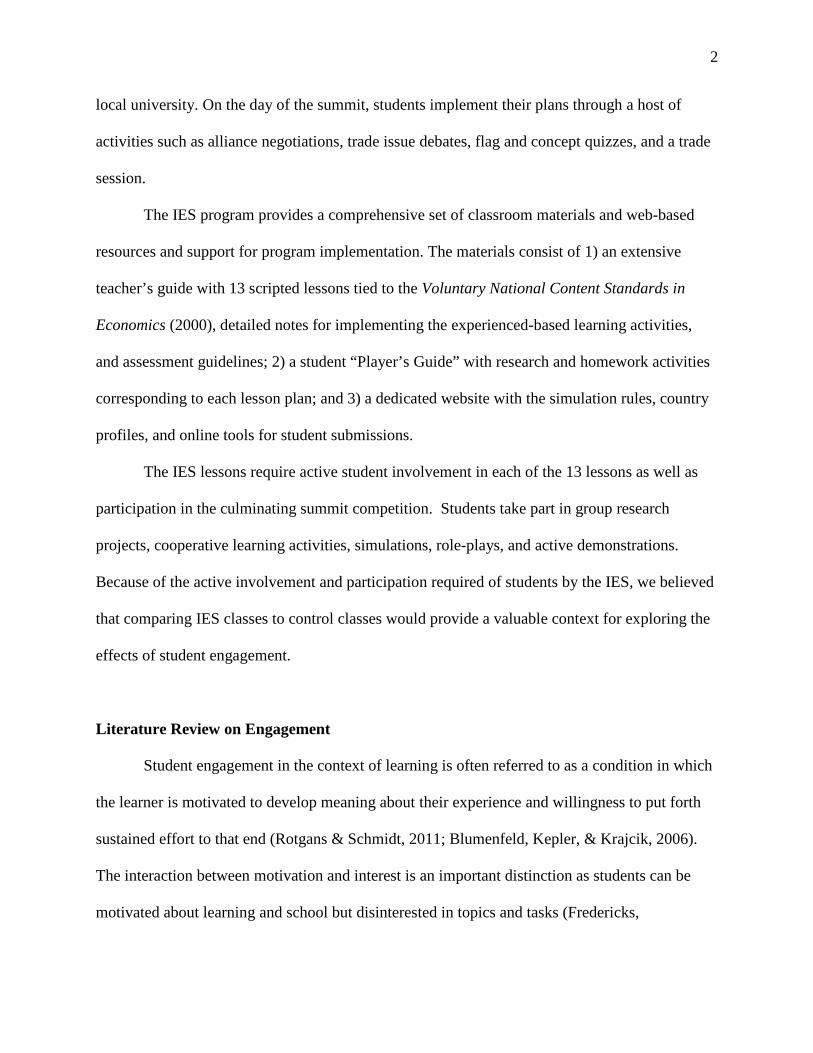
2
local university. On the day of the summit, students implement their plans through a host of
activities such as alliance negotiations, trade issue debates, flag and concept quizzes, and a trade
session.
The IES program provides a comprehensive set of classroom materials and web-based
resources and support for program implementation. The materials consist of 1) an extensive
teacher’s guide with 13 scripted lessons tied to the Voluntary National Content Standards in
Economics (2000), detailed notes for implementing the experienced-based learning activities,
and assessment guidelines; 2) a student “Player’s Guide” with research and homework activities
corresponding to each lesson plan; and 3) a dedicated website with the simulation rules, country
profiles, and online tools for student submissions.
The IES lessons require active student involvement in each of the 13 lessons as well as
participation in the culminating summit competition. Students take part in group research
projects, cooperative learning activities, simulations, role-plays, and active demonstrations.
Because of the active involvement and participation required of students by the IES, we believed
that comparing IES classes to control classes would provide a valuable context for exploring the
effects of student engagement.
Literature Review on Engagement
Student engagement in the context of learning is often referred to as a condition in which
the learner is motivated to develop meaning about their experience and willingness to put forth
sustained effort to that end (Rotgans & Schmidt, 2011; Blumenfeld, Kepler, & Krajcik, 2006).
The interaction between motivation and interest is an important distinction as students can be
motivated about learning and school but disinterested in topics and tasks (Fredericks,
3
Blumenfeld & Paris, 2004). A high level of student engagement involves a combination of
directed motivation and sustained effort in a learning environment (Appleton, Christenson, Kim
& Reschly, 2006).
Student engagement appears to be a multidimensional construct with three primary
divisions that include behavioral, emotional, and cognitive engagement (Fredericks, Blumenfeld
& Paris, 2004). Behavior engagement is represented by involvement in learning tasks, effort,
persistence, and class participation. Emotional engagement includes the affective reactions to
peers, teachers, the classroom, and school. Cognitive engagement involves investment in
learning, learning goals, self-regulation, and planning (Rotgans & Schmidt, 2011).
Student engagement has been shown to be a relevant construct in explaining differences
in student achievement in large, cross-sectional studies (Willms, 2000) and at the school and
classroom level (Covington, 2002). These studies suggest that student engagement is a possible
predictor of student achievement in a variety of settings (Walker, Green, & Mansell, 2006).
Design of Study
If student engagement is predicative of subsequent academic achievement, then what
types of instructional strategies, programs, projects, and classroom and school characteristics
promote student engagement? Our study was designed to explore different student
characteristics, teacher characteristics, instructional strategies and background demographics that
might relate to student engagement and to academic achievement. We hypothesized that the IES
program would correlate with engagement across all three dimensions at levels greater than in
the traditional classroom setting. We also hypothesized that the greater degree of engagement
would result in higher levels of student achievement.
4
In 2006, the Federal Reserve Bank of San Francisco (FRBSF) acquired the rights to
implement the IES program throughout the nine-state 12th District1 including producing
materials, developing a web site, training teachers, and running regional large group events. By
2010, FRBSF had trained approximately 500 teachers in the IES program and reached over
100,000 students. In an effort to understand the impact of the program on student knowledge of
economic content, FRBSF decided to undertake an evaluation of the IES program from fall 2011
through spring 2013. Because the study involves human subjects, we received full approval
from the Institutional Review Board at California State University, East Bay.
In designing the study we faced a number of common challenges related to evaluation of
economic education programs including attempting to recruit an unbiased sample of students and
teachers, identifying valid control groups, and choosing or developing valid pre and post test
instruments. In particular, we wanted our study to provide a useful approach to the measure of
student engagement in the high school economics classroom and its effects on student
achievement. Identifying and measuring factors that influence student engagement in high
school economics classes is perhaps new in the field of economic education.
Selection of Teachers and Students: Because each of the nine states within the 12th
District has its own set of economic content standards and course requirements, recruiting from
throughout the District would introduce variation that we could not easily control. As an
example, Arizona, California, and Idaho require a capstone course in economics for high school
graduation but the other states in the 12th District do not. In addition, because of the variation in
state standards and inclusion of these standards across a variety of courses, any type of
comparison across state boundaries would be difficult. To control for this variation, our sample
1 The nine states in the 12th District are Alaska, Arizona, California, Hawaii, Idaho, Nevada, Oregon, Utah, and Washington.
5
for the study includes only California teachers and students. Limiting the sample to California as
opposed to including other states offers advantages in that California has a large and ethnically
diverse population with rural, urban and suburban school settings. Further, while it would be
interesting to compare engagement and achievement across a variety of social studies courses,
we limited our sample to high school economics classes to add additional controls to the study.
The design of our study was intended to involve a comparison between a traditional
model of high school economics instruction and the use of the IES program. For the treatment or
experimental group, we initially randomly selected 25 IES teachers from the pool of 165 active
IES economics teachers within the state of California. Email recruiting messages were sent to
each of the 25 teachers describing the research study and requesting their participation in the
pilot during the fall 2011 semester. Teachers chosen to participate in the experimental group
agreed to use the IES curriculum and simulation during fall 2011 and to conduct a brief online
pre and posttest assessment and questionnaire with their students.
For the control group, we initially randomly selected 25 schools from the California
Department of Education 2011 school database. The control group recruiting involved contacting
the Social Studies Department chair at the selected schools and requesting the name of an
economics teacher who might be interested in serving in our control group and who was not
using the IES. A subsequent recruiting call was made to the named economics teacher to
introduce the research study. Once a verbal confirmation was established, an email with all the
study details was sent to each of the control group teachers.
Eighteen teachers from throughout California initially agreed to participate in the fall
2011 pilot study, with a final cohort of five experimental and three control groups submitting
6
pretest and questionnaire data for fall 2011.2 All participating teachers were provided with
explicit instructions for administering the pretest and pre-class questionnaire and sent a link to
access them online. The experimental group was initially expected to complete the IES program
during the course of the fall semester and the control group students would participate in their
regular economics curriculum during the fall semester. Each teacher was offered a $300
consulting fee upon completion of the posttest assessment and questionnaires by both their
students and themselves.
Later it was determined that some of the randomly selected teachers were unable or chose
not to complete the study, so other IES teachers were invited to participate. Some experimental
and control teachers did so during more than one semester between fall 2011 and spring 2013.
Our resulting database consists of 16 teachers and 748 students who completed the pretest,
posttests, and questionnaires. Thirteen teachers (605 students) used the IES and three teachers
(143 students) were in the control group.
Design of Pre and Post Tests and Surveys: The online pretest consisted of a subset of
20 questions from Form B of the 40-question Test of Economic Literacy (TEL; Walstad and
Rebeck 2001). The posttest consisted of parallel questions from the TEL Form A. The 20
questions were selected to correspond to each of the 20 Voluntary National Content Standards in
Economics.3 In the cases where more than one TEL question existed for a given standard, the
pretest question was randomly selected from the available questions. Twenty questions were
used rather than the full 40-question TEL to save time for students and to likely increase the
2 The teachers who initially agreed to participate but later dropped out did so for a number of reasons, the most common being changes in teaching assignments. 3 The exception to each pretest question corresponding to one of the Voluntary National Standards is that TEL does not have a Form B question for Standard 17 (government failure, special interest groups). The corresponding Form B question is classified under Standard 5 (voluntary exchange & trade).
7
probability that students would complete the instruments. Teachers were asked to administer the
tests in a lab setting to monitor students to ensure that they did their own work.
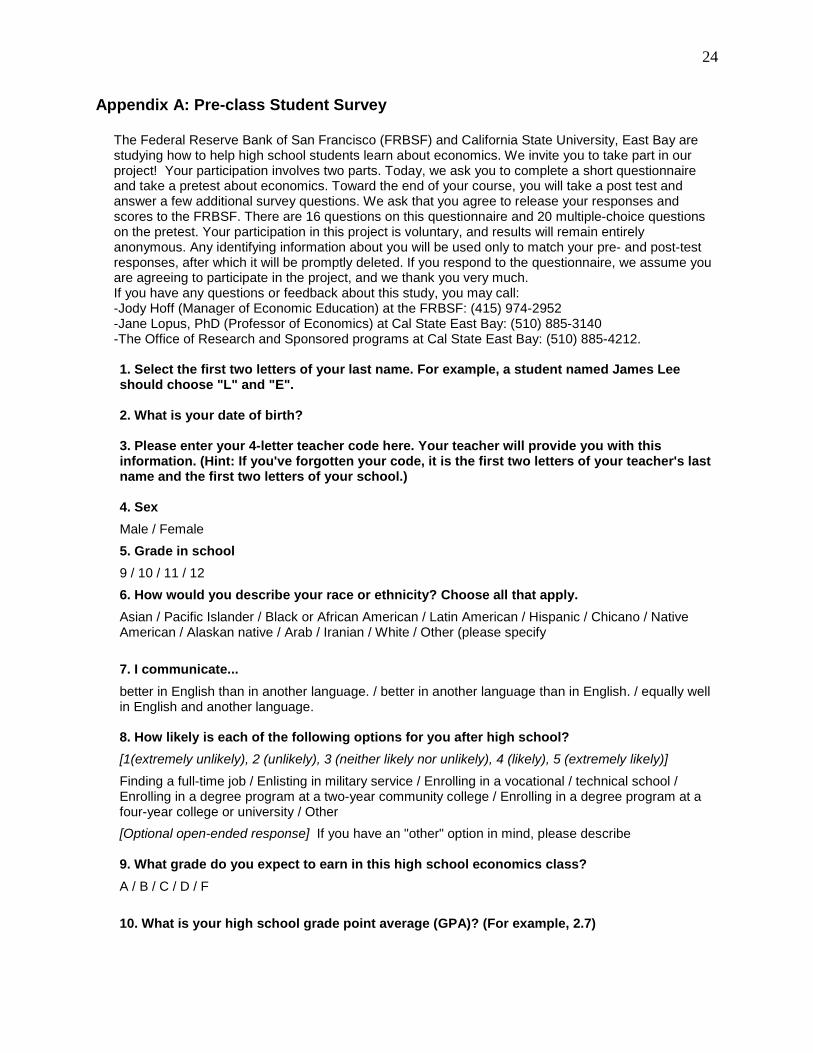
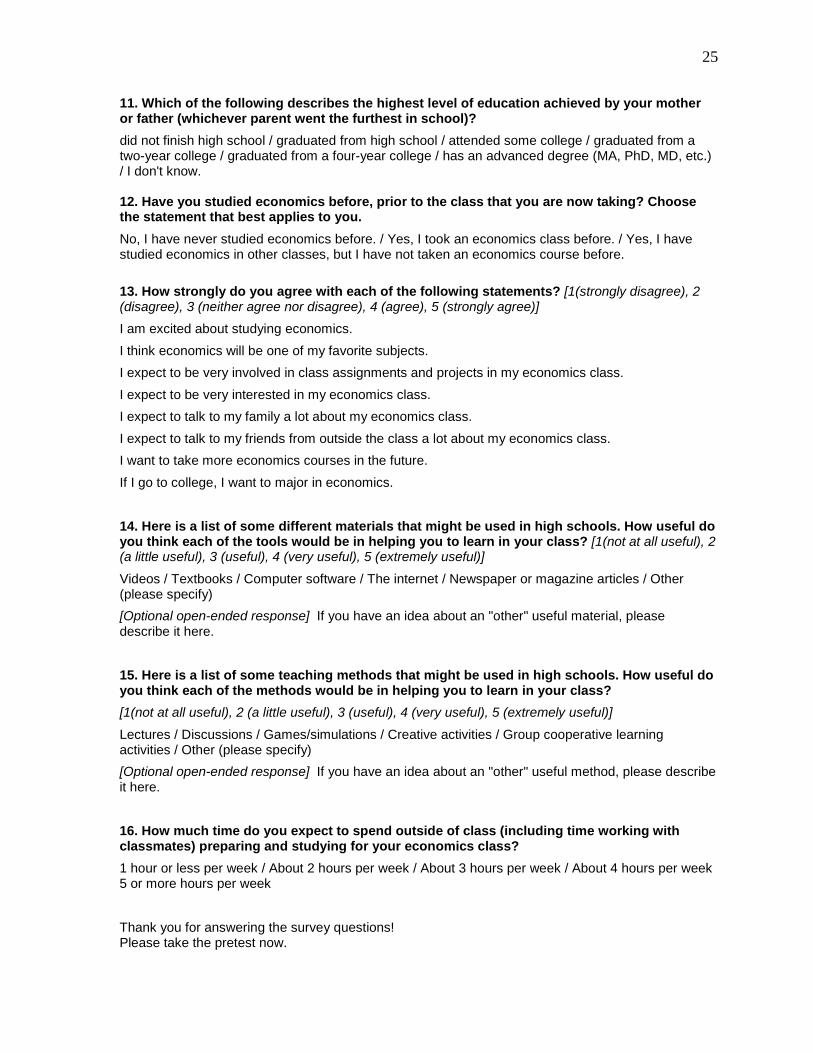
The pretest was accompanied by a 17-question online survey that included questions
about student demographics, learning styles, and factors addressing engagement. The pre-class
student survey or questionnaire is attached to this paper as Appendix A. Information is collected
relating to age, sex, grade in school, race or ethnicity, preferred language, plans after high
school, high school GPA, parent's education, and prior economics studied. Question 13 on the
pre-class survey was designed to capture information about expected engagement before the
class began. The questions related to engagement included those asking about excitement to
study economics, involvement in projects and assignments, interest, and plans to talk to family
and friends about the class. Anticipated involvement addresses cognitive engagement; attitudes
toward economics (anticipated excitement and interest) address affective engagement and
behavioral engagement is addressed by discussing the course with family and friends outside of
class and by a self-assessment of the student’s classroom behavior.
The post-class student survey is attached as Appendix B. The first five questions are
included to match pre and post responses. The remaining questions are related to engagement,
and most are parallel to questions on the pre-class student survey. The parallel nature of the
questions will allow comparison of expected engagement before the class with self-reported
engagement after the class.4 New questions added to the post-class survey address other factors
related to engagement by asking students about enjoyment of school and economics, whether
they used studying strategies to try to learn economics, and if they were having trouble studying
economics, they tried to figure out why.
4 The comparison of pre and post student engagement and investigating the relationship between teacher engagement and student engagement are topics for a future paper and are not addressed in this paper.
8
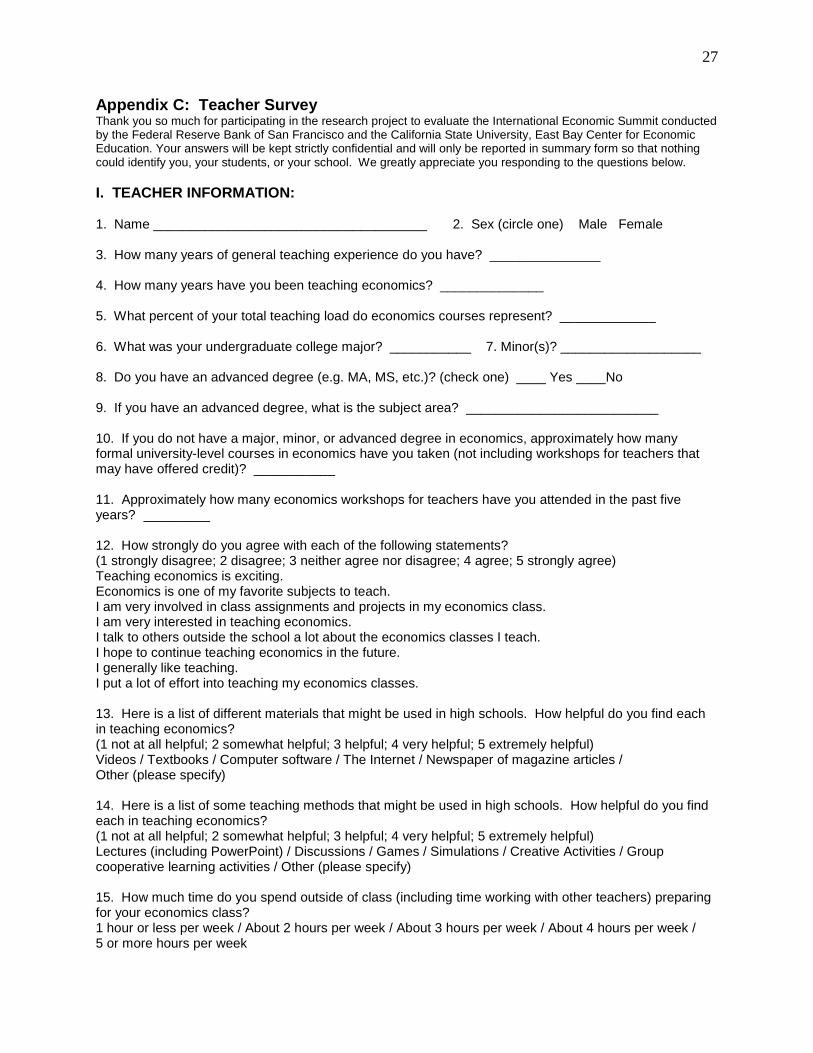
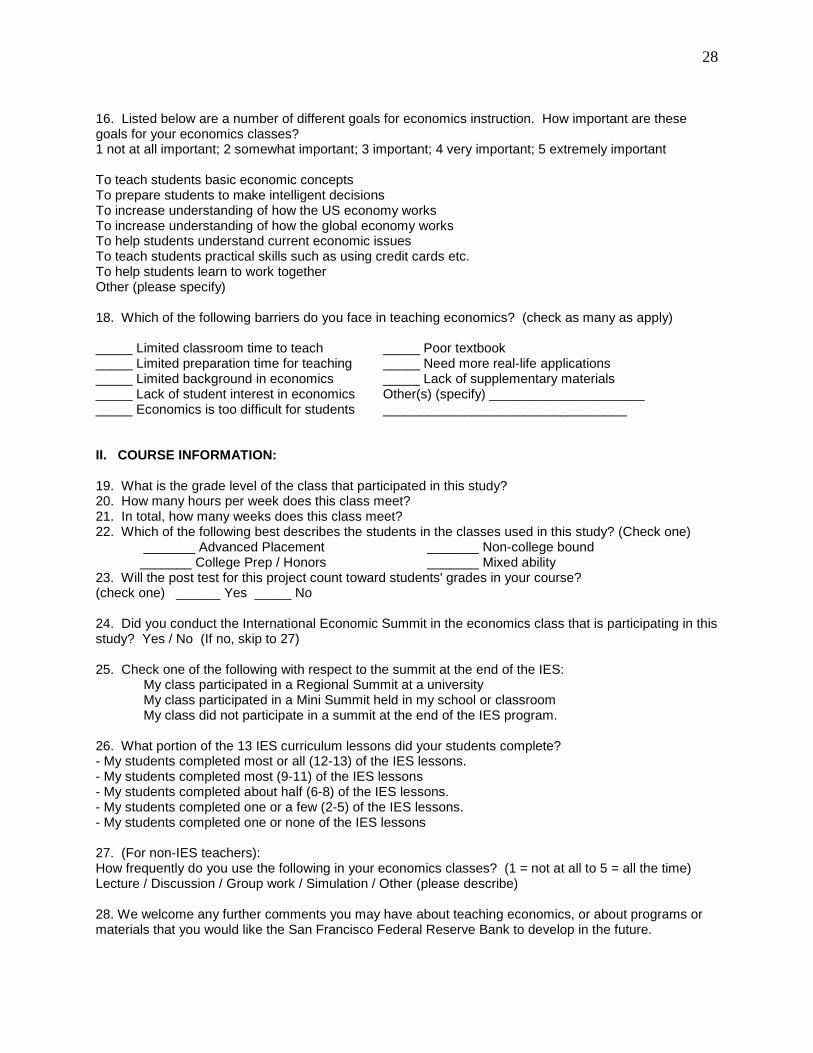
Teachers were also asked to respond to an online questionnaire containing 26 questions
(control teachers) or 27 questions (experimental teachers). The teacher survey is attached as
Appendix C. We asked for information about teaching experience and background in
economics, teaching style, and goals and barriers to teaching economics. In question 12 we
address teacher engagement in the economics class by asking questions similar to those asked to
students relating to excitement, involvement, and interest in teaching economics. Because we
were also assessing the effect of the IES curriculum on student achievement, we asked
experimental teachers how much of the IES curriculum was covered in the class in the study.
We asked control teachers about the conduct and structure of their class to determine what
teaching methods were emphasized.
Engagement Model and Confirmatory Factor Analysis
Confirmatory Factory Analysis (CFA) was used to assess the hypothesized factor
structure of the nine engagement questions included in the student pretest questionnaire. CFA is
a theory-driven technique designed to confirm the structure of an existing model (Brown, 2006,
Schmitt, 2011; Williams, Eaves & Cox, 2002). For the pilot study we included a small set of
questions to measure student’s expectations about their level of engagement in studying
economics. Models of student engagement suggest a multidimensional structure and following
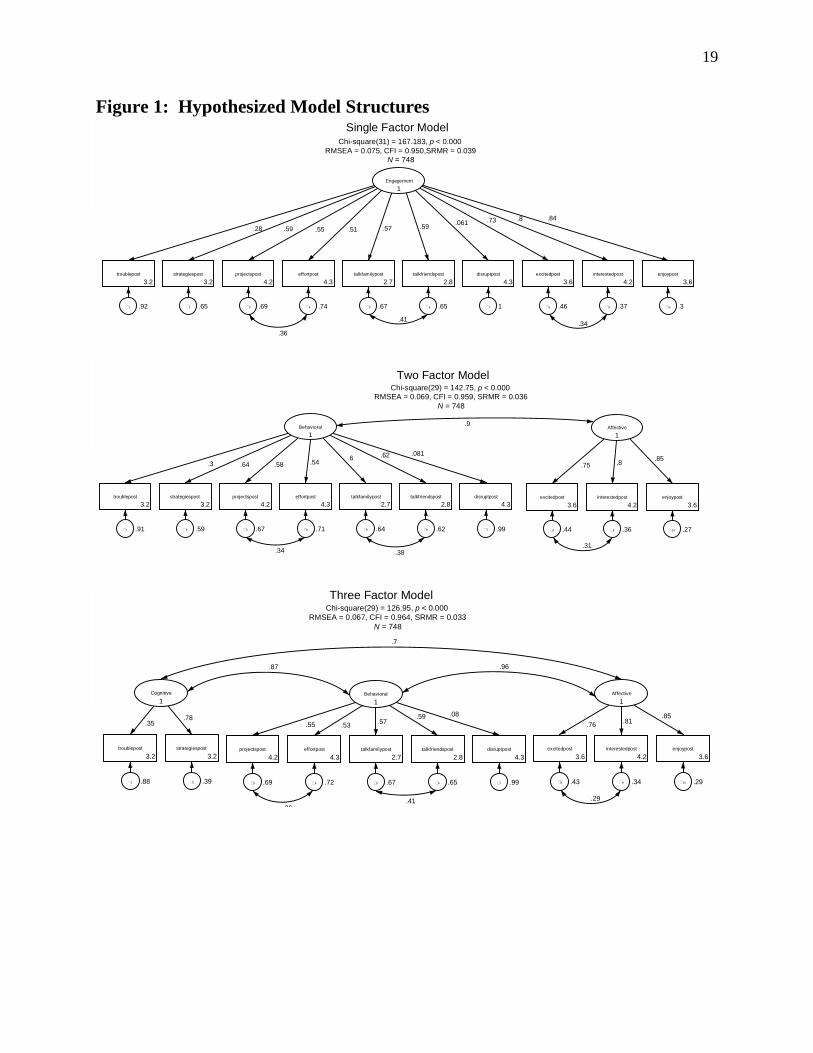
this literature, we developed three plausible models to submit to a confirmatory factor analysis.
The first model hypothesized a single dimension for student engagement, the second model
hypothesized two dimensions, with the third model hypothesizing three dimensions. Using
previous research and existing theory, we hypothesized that the three factor model would provide
9
the best fit for the data. CFA was used to determine which of the three models of engagement
represented the best fit for the post test data. The theoretical models are presented in Figure 1.
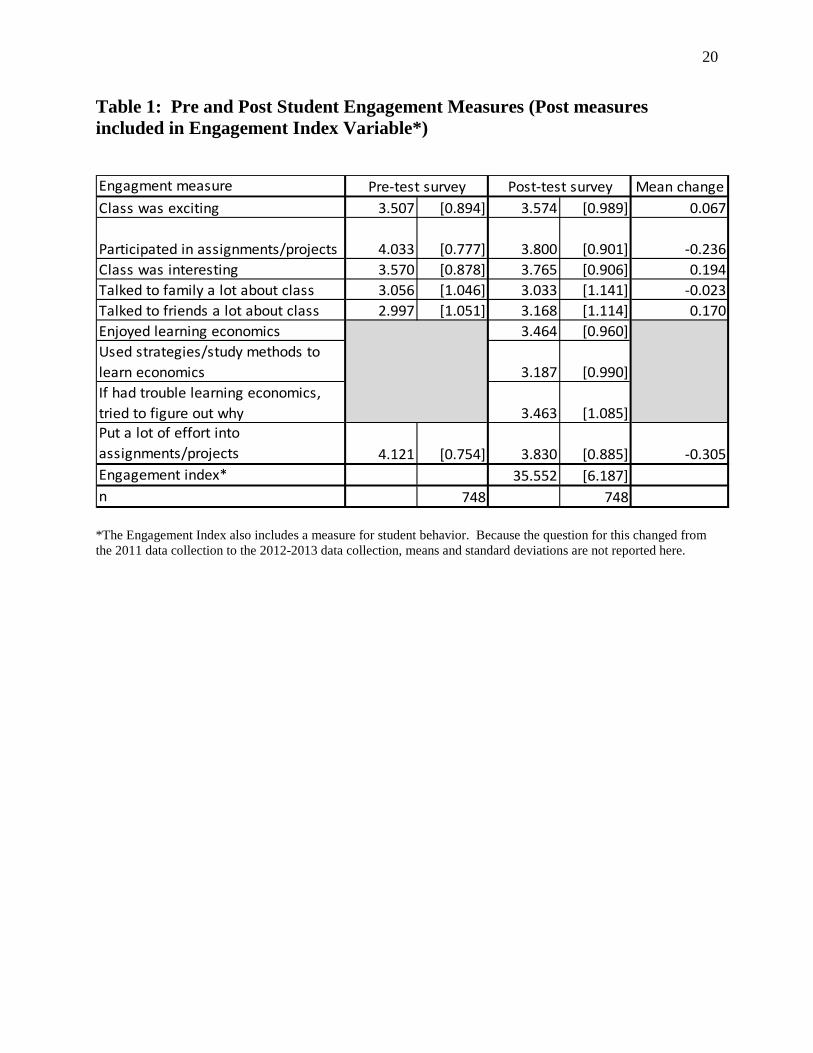
The engagement section of the post student questionnaire consisted of ten questions
measured on a five-point Likert scale. The means and standard deviations are shown in Table 1.
To assess the internal consistency of the ten items, Crohbach’s alpha was computed for the entire
set and for the three subsets indicated by the three-factor theoretical model. The coefficient alpha
for the full set of engagement questions equaled .82, indicating good reliability (Gregory, 2011).
The alphas for the three subsets of affective, behavioral, and cognitive engagement were .86, .63,
and .42, respectively.
Three models were tested using CFA to evaluate construct validity using Stata 13.0
(StataCorp, 2011). Model 1 represented a single factor model in which student engagement is
considered to be one-dimensional construct. The full set of engagement questions were used to
estimate Model 1. Model 2 represents a two-factor structure and split the ten engagement
questions into two subsets hypothesized to represent the constructs of affect and behavior. Model
3 represented a three-factor model of engagement dividing the engagement questions into three
subsets hypothesized to form the constructs of affect, behavior, and cognition.
The results of the confirmatory factor analysis were analyzed using several criteria as
recommended in the CFA literature (Jackson, Gillaspy & Purc-Stephenson, 2009; Schmitt,
2011). Several statistical tests exist to determine the goodness of fit for a given model and best
practices suggest using multiple criteria to evaluate the relative strength of a model (Williams,
Eaves & Cox, 2002). We selected five measures on which to evaluate our three models that
included the traditionally reported chi-squared likelihood ratio statistic, the comparative fit
index(CFI), the root mean square error of approximation (RMSEA), and the standardized root
10
square mean residual (SRMS). The use of the chi-squared test for evaluating model fit is
somewhat problematic due to the sensitivity of chi-squared to sample size, however it
demonstrates the changes in model fit for the three specifications. Acceptable values for the four
other criteria include: RMSEA values between .05 and .08; CFI > .90, SRMR < .08; and CD >
.95.
Model 3 provides the best fit of the data. The chi-square statistic for Model 3 (χ2 =
126.95, p < .000).showed improvement when compared to Model 1 (χ2 = 167.18, p < .001) and
Model 2 (χ2 = 142.75, p < .000), note that the significance level of the test is not interpreted due
to the large sample size (Schmitt, 2011; Williams, Eaves & Cox, 2002). The RMSEA lower
bound value = .067 indicated a reasonably close fit for Model 3, and the CFI = .96, SRMR of
.033 support the hypothesized three factor model. Standardized parameter and goodness of fit
statistics for all three models are provided in Figure 2.
Data Analysis and Findings
Engagement Index: To capture the effects of engagement we developed an additive
index of engagement including 10 of the student engagement measures across the different
engagement dimensions.5 This computed index is introduced here as a sample of an engagement
index and represents only one of many possible combinations and weights of engagement
measures. Nine of the ten measures included in the engagement index are shown in Table 1.
Although pre and post responses to these nine engagement questions are shown in the table, only
post-class responses are included in the engagement index variable.
5 While this approach comports with the single-factor model described above, the improvement of the three-factor model over the one-factor model was not enough of an improvement to incorporate into the regression analysis at this time.
11
The pre and post comparisons show that student excitement and interest increased,
indicating that students were more excited and interested in their economics class than they
expected to be. On the other hand, students’ post-class surveys indicate that they participated
less in class assignments and put forth less effort than they expected. Students also talked to
their friends about their economics class more than they expected and talked to their families less
than expected.
In addition to the nine variables in Table 1, the pre and post-class questions addressing
student classroom behavior as measured by disruption questions was included in the engagement
index. However, this question was changed on the survey after 20116, so the responses were
combined and recoded to represent poor (disruptive) behavior = 1 and good (non-disruptive
behavior) = 5. Values for the final computed engagement index variable ranged from 10 (not
engaged) to 50 (very engaged) with an average of 35.6.
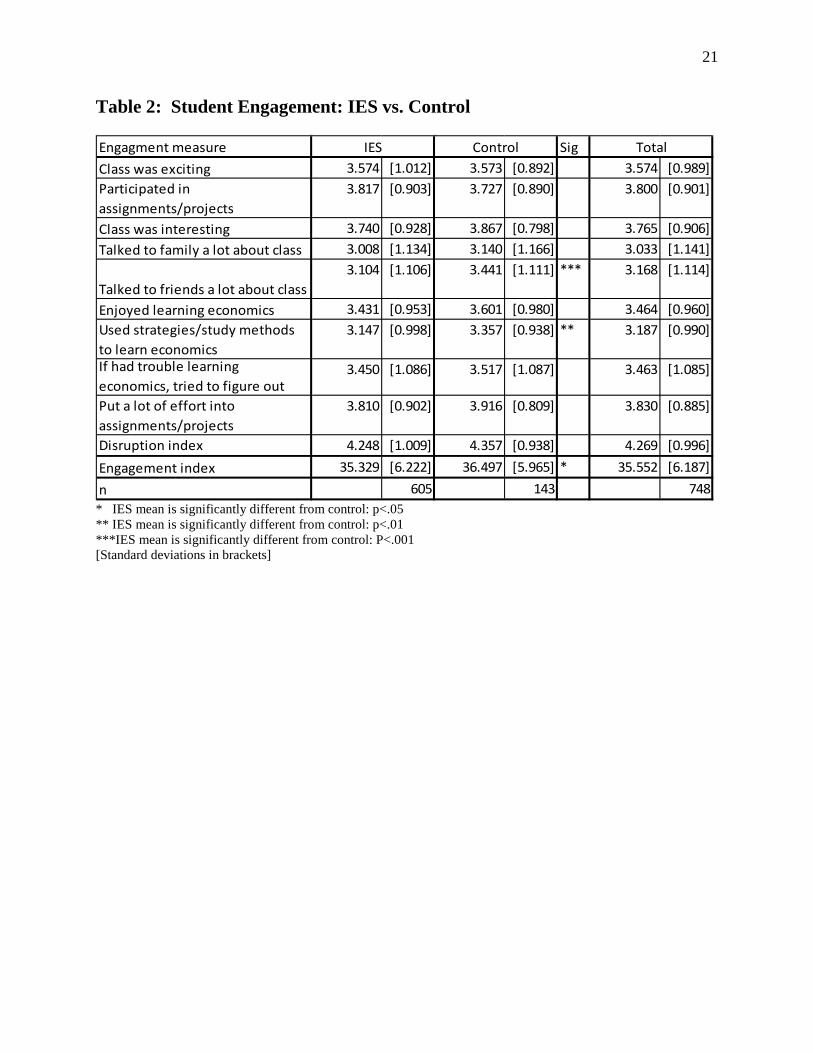
Five other survey questions potentially related to student engagement were not included
in the engagement index, including whether economics was a favorite subject, whether students
planned to take more economics in the future, whether students generally liked school, and how
much time students spent out of class preparing and studying economics. Post-class favorite
subject was not included on the theory that a student who loves e.g. physics and wants to study
the natural sciences in college could still be highly engaged in his/her economics class. Also, as
shown in Table 2, IES students were significantly more likely than control students to indicate
that they were likely to attend a four-year college or university. A desire to take future
economics and to major in economics were not included in the engagement index because the
6 In 2011, students were asked to what extent they agreed with the statement “At some point in the semester, I was a disruption in class on purpose” with responses ranging from 1: strongly agree to 5: strongly disagree. In 2012 – 2013 students were asked to identify their behavior in class with responses ranging from 1: always disrupt class to 5: never disrupt class.” Although these were combined into a single disruption measure, it should be noted that the responses indicate that the 2012-2013 students reported that they were less disruptive than the 2011 cohort.
12
only way high school seniors (96 percent of the sample) could do so would be by attending
college. Including these measures in the engagement index could therefore bias the index against
the control students. “Like school” was not included in this index on the theory that high school
seniors may not like school in general at that point, but may still be highly engaged in their
economics class. And time spent outside of class was not included on the theory that this could
capture efforts needed by weaker students to keep up with their peers rather than engagement.
Table 2 shows the ten engagement measures included in the index divided to show the
measures for IES students, for control students, and the totals. Overall, student engagement was
significantly higher among control students than among IES students. Looking at the individual
measures making up the engagement index, we see that control students were significantly
likelier than IES students to talk a lot about their economics class to friends outside of class and
to use strategies and study methods that would help them learn economics if they were having
trouble. Other engagement measures in the index were not significantly different between IES
and control students.
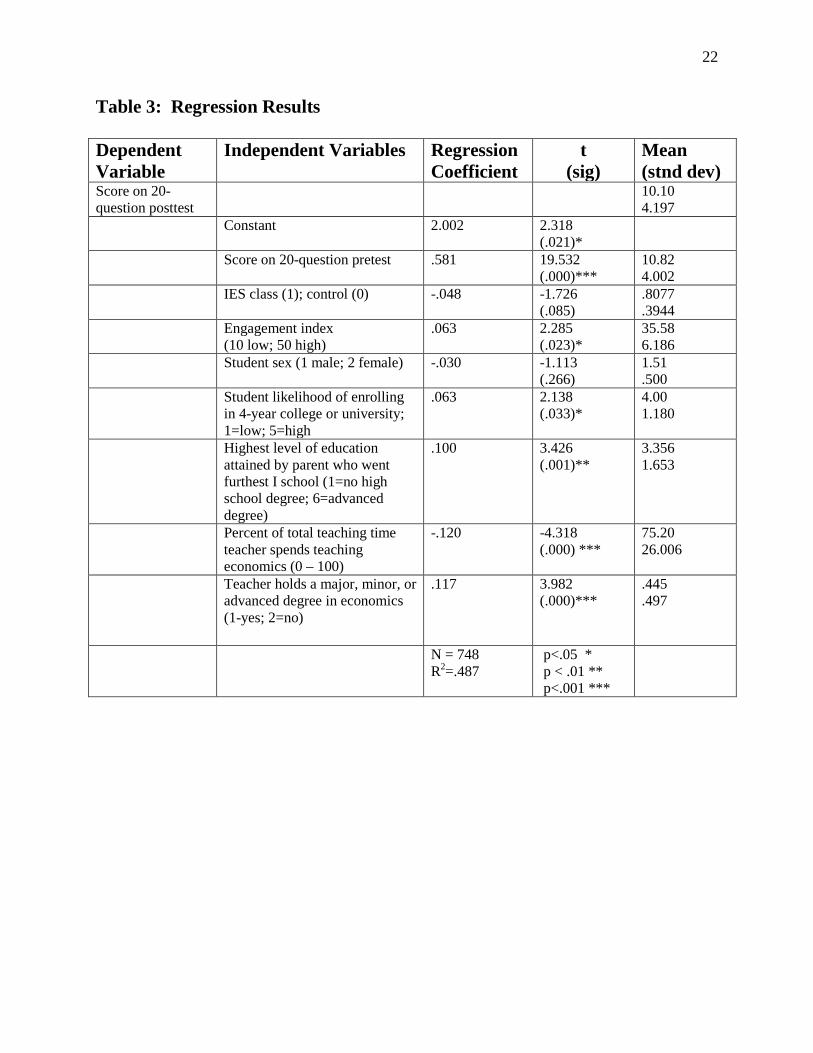
Regression Analysis: While factors affecting engagement are interesting in and of
themselves, what is important for education policy is the effect of engagement on student
learning. To investigate this relationship we developed a standard education production function
model and estimated an ordinary least squares regression equation. Our analysis regresses the
pretest score, post-class student engagement, the IES, and student, teacher, and demographic
variables on the posttest score. These results, with descriptive statics and variable definitions,
are shown in Table 3. We find several expected results and some unexpected results.
The pretest score is highly correlated to the posttest score, as expected, indicating that
students who entered their economics classes with more knowledge also scored higher on the
13
posttest. However, we note that the average posttest score (10.10 questions correct) was lower
than the average pretest score (10.82 questions correct). This “unlearning” difference is
statistically significant. We suspect that because the tests were conducted online and teachers
did not use the results in their grading, students may not have taken the posttest seriously. A
preliminary analysis indicates that unlearning occurs for about 51 percent of IES students and 49
percent of control students and across teachers. Unfortunately this may also cast doubt on the
validity of other student survey answers as well. Further investigation into student responses
will involve looking at student response patterns to try to unravel what is going on with respect
to the lower posttest scores.
We next note that the IES students did not score higher on the posttest than the students
in control classes who did not participate in the IES. Although not significant at the .05 level,
the correlation between IES and the posttest score is robustly negative with posttest scores, and is
significant at the .10 level. While further study is needed, from survey responses we know that
the control teachers, while not conducting the IES, did conduct other simulations and utilized
other active learning methodologies. Thus this finding with regard to the IES does not indicate
that activities and simulations per se lead to less student learning in economics.
The engagement index is statistically significantly related to student posttest scores, while
holding constant for the IES and other factors. This finding is potentially important and can lead
to further analysis of factors affecting engagement. Running the regression with individual
components of post-class engagement found that the individual engagement measures were
generally not significant when controlling for other engagement measures7. That the additive
7 Exceptions are the question “If I am having trouble in my economics class, I try to figure out why” and the question relating to disrupting class. Students who were not disruptive and who tried to figure out why they were having problems scored better on the posttest, holding constant for other engagement measures.
14
index is significant but not the individual components is expected in that the individual
engagement measures are highly correlated to each other.
Student characteristics in the model include sex, likelihood of enrolling in a four-year
college or university, and parent education. As shown in Table 3, the findings for these student
control variables are generally as expected according to the economic education literature. (See,
for example, Walstad, Journal of Economic Literature, 1992.) Female students score lower, but
not significantly so, than their male counterparts. Students who plan to attend a university after
college (as opposed to entering the labor market, the military, or enrolling in a two-year college),
a proxy for student ability, score significantly higher on the post test. Parent education, serving
as a proxy for socioeconomic status, is significant as well.
The findings shown that are related to control variables for teachers are perhaps
unexpected, but do correspond to a recent study looking at teacher effects on learning in high
school economics (Valetta, Hoff and Lopus, forthcoming). The students of teachers for whom
economics represents a higher percentage of their teaching load score significantly lower on the
posttest, and students of teachers who have a degree in economics also score significantly lower
on the posttest. As postulated by Valetta et al, this may be due to a “lost in translation” effect
where teachers who have studied economics may aim their teaching at too high a level, thus not
connecting with their high school students. It may also be that those with degrees in economics
who go into high school teaching may not have been the best economics students themselves.
Table 4 further investigates factors affecting student engagement by looking at
correlation coefficients and significance levels for some student characteristics and some teacher
characteristics with the engagement index. The student engagement index was positively
correlated with likelihood of attending a four-year university after high school, GPA, and liking
15
school. Students who expected higher grades in the economics class had higher engagement
scores, as did females and students in lower grade levels (although this number is very small).
Student engagement was higher in classrooms in which the teacher was very interested in
teaching economics, talked to others outside school about the economics class, and generally
liked teaching.
Although not shown in the table, student engagement was significantly positively related
to virtually all preferred learning methods, indicating that students who found games, software,
the internet, creative activities, textbooks, group learning, lectures, discussions, and/or articles to
be useful in learning economics were more engaged. This is perhaps an indication that engaged
students find different teaching strategies to be useful in general. Student ethnicity was only
very weakly and not significantly correlated with engagement, with white and black students
slightly less engaged and Hispanic and Asian students slightly more engaged. Parental education
and whether the student spoke English as his or her first language were likewise not significant
predictors of a student’s post-test engagement.
Conclusions
This report has described the research design and central findings of a study designed to
measure the effects of student engagement on student achievement in high school economics
classes, in the context of evaluating the International Economic Summit. The IES is a world
trade simulation for high school students conducted through the Federal Reserve Bank of San
Francisco. The literature on engagement finds engagement to be multi-dimensional with
cognitive, affective, and behavioral dimensions. Our data consist of a matched sample of 16
teachers and 748 students in California economics classes who participated in the study between
16
fall, 2011 and spring, 2013. Thirteen teachers and 605 students were in the IES experimental
group and three teachers and 143 students were in the control group.
Results of a regression analysis indicate that an index of student engagement does affect
student achievement, but that the IES does not. While the significance of the engagement index
is interesting and an important finding for this study, further analysis on measures of engagement
is warranted. One topic for future study is the relationship between student engagement and
teacher engagement. This is possible given the data from this study since parallel engagement
questions were asked of both teachers and students. It would also be interesting to look further
into the classroom environment factors and teaching styles that affect student engagement.
Despite possible problems with the data in that student posttest scores are significantly
lower than pretest scores, we believe that this study represents an important step in investigating
and measuring the relationship between student engagement and student learning. Further data
analysis can attempt to identify and promote the curricula, materials, and teaching approaches
that encourage engagement in high school economics classes. This could lead to policy
prescriptions for how to improve student learning through engagement.
17
REFERENCES Appleton, J., Christenson, S.L., Kim, D., & Reschly, A. (2006). Measuring cognitive and psychological engagement: Validation of the Student Engagement Instrument. Journal of School Psychology, 44, 427-445. Blumenfeld, P.C., Kempler, T.M., & Krajcik, J.S. (2006). Motivation and cognitive engagement in learning environments. In R.K. Sawyer (Ed.), The Cambridge handbook of the learning sciences. New York: Cambridge University Press. Covington, M. (2002). Rewards and intrinsic motivation: A needs-based, developmental perspective. In F. Pajares & T. Urdan (Eds.), Academic Motivation of Adolescents (pp. 169-193). Greenwich, Connecticut: Information Age. Fredericks, J., Blumenfeld, P. & Paris, A. (2004). School engagement: Potential of the concept, state of evidence. Review of Educational Research, 74(1), pp. 59-105. Gregory, R. J. (2011). Psychological testing: History, principles, and applications (6th ed.). Boston: Allyn & Bacon. Jackson, D., Gillaspy, J. & Purc-Stephenson, R. (2009). Reporting practices in confirmatory factor analysis: An overview and some recommendations. Psychological Methods, 14(1), 6-23. Paris, H., Van den Brouche, S. (2008). Measuring the cognitive determinants of speeding: An application of the theory of planned behavior. Transportation Research Part F, Traffic Psychology & Behavior, 11(3), 168-180.
Rotgans, J., & Schmidt, H. (2011). Cognitive engagement in the problem-based learning classroom. Advances in Health Sciences Education, 16(4), 465-479.
Schreiber, J., Nora, A., Stage, F., Barlow, E. & King, J. (2006). Reporting structural equation modeling and confirmatory factor analysis results: A review. Journal of Educational Research, 99(6), 323-337. Schmitt, T. (2011). Current methodological consideration in exploratory and confirmatory factor analysis. Journal of Psychological Assessment, 29(4), 304-321. Valetta, Rob, Jody Hoff and Jane Lopus. (forthcoming) Lost in Translation? Teacher Training and Outcomes in High School Economics Classes, Contemporary Economic Policy. Voluntary National Content Standards in Economics (2000). Council on Economic Education, New York, NY.
Walker, C., Greene, B. & Mansell, R. (2006). Identification with academics, intrinsic/extrinsic motivation, and self-efficacy as predictors of cognitive engagement. Learning & Individual Differences, 16, 1-12.
18
Walstad, William B. Economics Instruction in High Schools. Journal of Economic Literature, Vol. 30, No. 4 (Dec. 1992), pp. 2019-2051. Education in U.S. High Schools.
Walstad, William B. and Ken Rebeck. 2001. Test of Economic Literacy, Third Edition. National Council on Economic Education: new York, New York. Williams, T., Eaves, R. & Cox, C. (2002). Confirmatory factor analysis of an instrument designed to measure affective and cognitive arousal. Educational and Psychological Methods, 62(2), 264-283. Williams, J. (2000). Student Engagement at School: A Sense of Belonging and Participation. Results from PISA 2000. OECD.
19
Figure 1: Hypothesized Model Structures
Engagement
1
troublepost
3.2
1 .92
strategiespost
3.2
2 .65
projectspost
4.2
3 .69
effortpost
4.3
4 .74
talkfamilypost
2.7
5 .67
talkfriendspost
2.8
6 .65
disruptpost
4.3
7 1
excitedpost
3.6
8 .46
interestedpost
4.2
9 .37
enjoypost
3.6
10 .3
.28 .59 .55
.36
.51 .57 .59
.41
.061 .73 .8
.34
.84
Chi-square(31) = 167.183, p < 0.000RMSEA = 0.075, CFI = 0.950,SRMR = 0.039
N = 748
Single Factor Model
Behavioral
1
troublepost
3.2
1 .91
strategiespost
3.2
2 .59
projectspost
4.2
3 .67
effortpost
4.3
4 .71
talkfamilypost
2.7
5 .64
talkfriendspost
2.8
6 .62
disruptpost
4.3
7 .99
Affective
1
excitedpost
3.6
8 .44
interestedpost
4.2
9 .36
enjoypost
3.6
10 .27
.3 .64 .58 .54
.34
.6 .62
.38
.081
.9
.75
.31
.8 .85
Chi-square(29) = 142.75, p < 0.000RMSEA = 0.069, CFI = 0.959, SRMR = 0.036
N = 748
Two Factor Model
Cognitive
1
troublepost
3.2
1 .88
strategiespost
3.2
2 .39
Behavioral
1
projectspost
4.2
3 .69
effortpost
4.3
4 .72
talkfamilypost
2.7
5 .67
talkfriendspost
2.8
6 .65
disruptpost
4.3
7 .99
Affective
1
excitedpost
3.6
8 .43
interestedpost
4.2
9 .34
enjoypost
3.6
10 .29
.35.78
.87
.55 .53
36
.57.59
.41
.08
.7
.96
.76
.29
.81.85
Chi-square(29) = 126.95, p < 0.000RMSEA = 0.067, CFI = 0.964, SRMR = 0.033
N = 748
Three Factor Model
20
Table 1: Pre and Post Student Engagement Measures (Post measures included in Engagement Index Variable*) Engagment measure Mean changeClass was exciting 3.507 [0.894] 3.574 [0.989] 0.067
Participated in assignments/projects 4.033 [0.777] 3.800 [0.901] -0.236Class was interesting 3.570 [0.878] 3.765 [0.906] 0.194Talked to family a lot about class 3.056 [1.046] 3.033 [1.141] -0.023Talked to friends a lot about class 2.997 [1.051] 3.168 [1.114] 0.170Enjoyed learning economics 3.464 [0.960]Used strategies/study methods to learn economics 3.187 [0.990]If had trouble learning economics, tried to figure out why 3.463 [1.085]Put a lot of effort into assignments/projects 4.121 [0.754] 3.830 [0.885] -0.305Engagement index* 35.552 [6.187]n 748 748
Pre-test survey Post-test survey
*The Engagement Index also includes a measure for student behavior. Because the question for this changed from the 2011 data collection to the 2012-2013 data collection, means and standard deviations are not reported here.
21
Table 2: Student Engagement: IES vs. Control Engagment measure SigClass was exciting 3.574 [1.012] 3.573 [0.892] 3.574 [0.989]Participated in assignments/projects
3.817 [0.903] 3.727 [0.890] 3.800 [0.901]
Class was interesting 3.740 [0.928] 3.867 [0.798] 3.765 [0.906]Talked to family a lot about class 3.008 [1.134] 3.140 [1.166] 3.033 [1.141]
Talked to friends a lot about class3.104 [1.106] 3.441 [1.111] *** 3.168 [1.114]
Enjoyed learning economics 3.431 [0.953] 3.601 [0.980] 3.464 [0.960]Used strategies/study methods to learn economics
3.147 [0.998] 3.357 [0.938] ** 3.187 [0.990]
If had trouble learning economics, tried to figure out
3.450 [1.086] 3.517 [1.087] 3.463 [1.085]
Put a lot of effort into assignments/projects
3.810 [0.902] 3.916 [0.809] 3.830 [0.885]
Disruption index 4.248 [1.009] 4.357 [0.938] 4.269 [0.996]Engagement index 35.329 [6.222] 36.497 [5.965] * 35.552 [6.187]n 605 143 748
IES Control Total
* IES mean is significantly different from control: p<.05 ** IES mean is significantly different from control: p<.01 ***IES mean is significantly different from control: P<.001 [Standard deviations in brackets]
22
Table 3: Regression Results Dependent Variable
Independent Variables Regression Coefficient
t (sig)
Mean (stnd dev)
Score on 20-question posttest
10.10 4.197
Constant 2.002 2.318 (.021)*
Score on 20-question pretest .581 19.532 (.000)***
10.82 4.002
IES class (1); control (0) -.048 -1.726 (.085)
.8077
.3944 Engagement index
(10 low; 50 high) .063 2.285
(.023)* 35.58 6.186
Student sex (1 male; 2 female) -.030 -1.113 (.266)
1.51 .500
Student likelihood of enrolling in 4-year college or university; 1=low; 5=high
.063 2.138 (.033)*
4.00 1.180
Highest level of education attained by parent who went furthest I school (1=no high school degree; 6=advanced degree)
.100 3.426 (.001)**
3.356 1.653
Percent of total teaching time teacher spends teaching economics (0 – 100)
-.120 -4.318 (.000) ***
75.20 26.006
Teacher holds a major, minor, or advanced degree in economics (1-yes; 2=no)
.117 3.982 (.000)***
.445
.497
N = 748 R2=.487
p<.05 * p < .01 ** p<.001 ***

23
Table 4: Student Engagement and Student and Teacher Characteristics
Correlation with engagement index is significant: * p < .05 ** p < .01 *** p < .001
24
Appendix A: Pre-class Student Survey
The Federal Reserve Bank of San Francisco (FRBSF) and California State University, East Bay are studying how to help high school students learn about economics. We invite you to take part in our project! Your participation involves two parts. Today, we ask you to complete a short questionnaire and take a pretest about economics. Toward the end of your course, you will take a post test and answer a few additional survey questions. We ask that you agree to release your responses and scores to the FRBSF. There are 16 questions on this questionnaire and 20 multiple-choice questions on the pretest. Your participation in this project is voluntary, and results will remain entirely anonymous. Any identifying information about you will be used only to match your pre- and post-test responses, after which it will be promptly deleted. If you respond to the questionnaire, we assume you are agreeing to participate in the project, and we thank you very much. If you have any questions or feedback about this study, you may call: -Jody Hoff (Manager of Economic Education) at the FRBSF: (415) 974-2952 -Jane Lopus, PhD (Professor of Economics) at Cal State East Bay: (510) 885-3140 -The Office of Research and Sponsored programs at Cal State East Bay: (510) 885-4212.
1. Select the first two letters of your last name. For example, a student named James Lee should choose "L" and "E". 2. What is your date of birth? 3. Please enter your 4-letter teacher code here. Your teacher will provide you with this information. (Hint: If you've forgotten your code, it is the first two letters of your teacher's last name and the first two letters of your school.)
4. Sex Male / Female 5. Grade in school 9 / 10 / 11 / 12 6. How would you describe your race or ethnicity? Choose all that apply. Asian / Pacific Islander / Black or African American / Latin American / Hispanic / Chicano / Native American / Alaskan native / Arab / Iranian / White / Other (please specify 7. I communicate... better in English than in another language. / better in another language than in English. / equally well in English and another language. 8. How likely is each of the following options for you after high school? [1(extremely unlikely), 2 (unlikely), 3 (neither likely nor unlikely), 4 (likely), 5 (extremely likely)] Finding a full-time job / Enlisting in military service / Enrolling in a vocational / technical school / Enrolling in a degree program at a two-year community college / Enrolling in a degree program at a four-year college or university / Other [Optional open-ended response] If you have an "other" option in mind, please describe 9. What grade do you expect to earn in this high school economics class? A / B / C / D / F 10. What is your high school grade point average (GPA)? (For example, 2.7)
25
11. Which of the following describes the highest level of education achieved by your mother or father (whichever parent went the furthest in school)? did not finish high school / graduated from high school / attended some college / graduated from a two-year college / graduated from a four-year college / has an advanced degree (MA, PhD, MD, etc.) / I don't know.
12. Have you studied economics before, prior to the class that you are now taking? Choose the statement that best applies to you. No, I have never studied economics before. / Yes, I took an economics class before. / Yes, I have studied economics in other classes, but I have not taken an economics course before. 13. How strongly do you agree with each of the following statements? [1(strongly disagree), 2 (disagree), 3 (neither agree nor disagree), 4 (agree), 5 (strongly agree)]
I am excited about studying economics. I think economics will be one of my favorite subjects. I expect to be very involved in class assignments and projects in my economics class. I expect to be very interested in my economics class. I expect to talk to my family a lot about my economics class. I expect to talk to my friends from outside the class a lot about my economics class. I want to take more economics courses in the future. If I go to college, I want to major in economics. 14. Here is a list of some different materials that might be used in high schools. How useful do you think each of the tools would be in helping you to learn in your class? [1(not at all useful), 2 (a little useful), 3 (useful), 4 (very useful), 5 (extremely useful)]
Videos / Textbooks / Computer software / The internet / Newspaper or magazine articles / Other (please specify) [Optional open-ended response] If you have an idea about an "other" useful material, please describe it here. 15. Here is a list of some teaching methods that might be used in high schools. How useful do you think each of the methods would be in helping you to learn in your class? [1(not at all useful), 2 (a little useful), 3 (useful), 4 (very useful), 5 (extremely useful)]
Lectures / Discussions / Games/simulations / Creative activities / Group cooperative learning activities / Other (please specify) [Optional open-ended response] If you have an idea about an "other" useful method, please describe it here. 16. How much time do you expect to spend outside of class (including time working with classmates) preparing and studying for your economics class? 1 hour or less per week / About 2 hours per week / About 3 hours per week / About 4 hours per week 5 or more hours per week Thank you for answering the survey questions! Please take the pretest now.

26
Appendix B: Post-class Student Survey (IRB information not included) 1. Select the first two letters of your last name. 2. What is your date of birth? 3. Please enter your 4-letter teacher code here. 4. Sex Male / Female 5. Grade in school 9 / 10 / 11 / 12 6. What grade do you expect to earn in this high school economics class? A / B / C / D / F 7. How strongly do you agree with each of the following statements? [1(strongly disagree), 2 (disagree), 3 (neither agree nor disagree), 4 (agree), 5 (strongly agree)] My economics class was exciting. Economics is one of my favorite subjects. I regularly participated in class assignments and projects in my economics class. My economics class was interesting. I talked to my family a lot about my economics class. I talked to my friends from outside of class a lot about my economics class. I want to take more economics courses in the future. If I go to college, I want to major in economics. I generally like school. I enjoyed learning economics. If I am having trouble learning economics, I try to figure out why. I put a lot of effort into class assignments and projects in my economics class. At some point this semester, I was a disruption in class on purpose. I use specific strategies or ways of studying to help me learn economics. [Optional open-ended response] Brief description of my strategies or ways of studying: 8. How much time did you spend outside of class (including time working with classmates) preparing and studying for your econom ics clas 1 hour or less per week / About 2 hours per week / About 3 hours per week / About 4 hours per week / 5 or more hours per week 9. Which statement best describes your attendance in your economics class? I did not miss any classes. I attended regularly, but I missed from 1 - 3 classes. I attended somewhat regularly, but I missed from 4 - 10 classes. I missed from 11 - 20 classes. I missed more than 20 classes. Thank you for answering the survey questions! Please take the posttest now.
27
Appendix C: Teacher Survey Thank you so much for participating in the research project to evaluate the International Economic Summit conducted by the Federal Reserve Bank of San Francisco and the California State University, East Bay Center for Economic Education. Your answers will be kept strictly confidential and will only be reported in summary form so that nothing could identify you, your students, or your school. We greatly appreciate you responding to the questions below. I. TEACHER INFORMATION: 1. Name _____________________________________ 2. Sex (circle one) Male Female 3. How many years of general teaching experience do you have? _______________ 4. How many years have you been teaching economics? ______________ 5. What percent of your total teaching load do economics courses represent? _____________ 6. What was your undergraduate college major? ___________ 7. Minor(s)? ___________________ 8. Do you have an advanced degree (e.g. MA, MS, etc.)? (check one) ____ Yes ____No 9. If you have an advanced degree, what is the subject area? __________________________ 10. If you do not have a major, minor, or advanced degree in economics, approximately how many formal university-level courses in economics have you taken (not including workshops for teachers that may have offered credit)? ___________ 11. Approximately how many economics workshops for teachers have you attended in the past five years? _________ 12. How strongly do you agree with each of the following statements? (1 strongly disagree; 2 disagree; 3 neither agree nor disagree; 4 agree; 5 strongly agree) Teaching economics is exciting. Economics is one of my favorite subjects to teach. I am very involved in class assignments and projects in my economics class. I am very interested in teaching economics. I talk to others outside the school a lot about the economics classes I teach. I hope to continue teaching economics in the future. I generally like teaching. I put a lot of effort into teaching my economics classes. 13. Here is a list of different materials that might be used in high schools. How helpful do you find each in teaching economics? (1 not at all helpful; 2 somewhat helpful; 3 helpful; 4 very helpful; 5 extremely helpful) Videos / Textbooks / Computer software / The Internet / Newspaper of magazine articles / Other (please specify) 14. Here is a list of some teaching methods that might be used in high schools. How helpful do you find each in teaching economics? (1 not at all helpful; 2 somewhat helpful; 3 helpful; 4 very helpful; 5 extremely helpful) Lectures (including PowerPoint) / Discussions / Games / Simulations / Creative Activities / Group cooperative learning activities / Other (please specify) 15. How much time do you spend outside of class (including time working with other teachers) preparing for your economics class? 1 hour or less per week / About 2 hours per week / About 3 hours per week / About 4 hours per week / 5 or more hours per week
28
16. Listed below are a number of different goals for economics instruction. How important are these goals for your economics classes? 1 not at all important; 2 somewhat important; 3 important; 4 very important; 5 extremely important To teach students basic economic concepts To prepare students to make intelligent decisions To increase understanding of how the US economy works To increase understanding of how the global economy works To help students understand current economic issues To teach students practical skills such as using credit cards etc. To help students learn to work together Other (please specify) 18. Which of the following barriers do you face in teaching economics? (check as many as apply) _____ Limited classroom time to teach _____ Poor textbook _____ Limited preparation time for teaching _____ Need more real-life applications _____ Limited background in economics _____ Lack of supplementary materials _____ Lack of student interest in economics Other(s) (specify) _____________________ _____ Economics is too difficult for students _________________________________ II. COURSE INFORMATION: 19. What is the grade level of the class that participated in this study? 20. How many hours per week does this class meet? 21. In total, how many weeks does this class meet? 22. Which of the following best describes the students in the classes used in this study? (Check one) _______ Advanced Placement _______ Non-college bound _______ College Prep / Honors _______ Mixed ability 23. Will the post test for this project count toward students' grades in your course? (check one) ______ Yes _____ No 24. Did you conduct the International Economic Summit in the economics class that is participating in this study? Yes / No (If no, skip to 27) 25. Check one of the following with respect to the summit at the end of the IES: My class participated in a Regional Summit at a university My class participated in a Mini Summit held in my school or classroom My class did not participate in a summit at the end of the IES program. 26. What portion of the 13 IES curriculum lessons did your students complete? - My students completed most or all (12-13) of the IES lessons. - My students completed most (9-11) of the IES lessons - My students completed about half (6-8) of the IES lessons. - My students completed one or a few (2-5) of the IES lessons. - My students completed one or none of the IES lessons 27. (For non-IES teachers): How frequently do you use the following in your economics classes? (1 = not at all to 5 = all the time) Lecture / Discussion / Group work / Simulation / Other (please describe) 28. We welcome any further comments you may have about teaching economics, or about programs or materials that you would like the San Francisco Federal Reserve Bank to develop in the future.