Embed Size (px)
Citation preview

RUSSIAN RESEARCH CENTER
THE INSTITUTE OF ECONOMIC RESEARCH
HITOTSUBASHI UNIVERSITY
Kunitachi, Tokyo, JAPAN
Центр Российских Исследований
RRC Working Paper Series No. 91
Does the Currency Crisis Veil the Impact of Economic Sanctions under an Authoritarian Regime?An Inquiry into Russia
Yoshisada SHIDA
June 2021
ISSN 1883-1656

1
Does the Currency Crisis Veil the Impact of Economic
Sanctions under an Authoritarian Regime?
An Inquiry into Russia†
Yoshisada SHIDA‡
Abstract
This paper examines the concurrent shocks of the sanctions and the currency crisis on the
Russian economy. It focuses on the commonalities and differences in the impact
transmission channels and their interrelationship. The analyses using enterprise interview
surveys revealed that the sanctions produced sufficient perceivable business damage that
spread through restricted financing. Their negative impact was catalyzed by the currency
crisis. These findings show that the impact of the sanctions cannot be hidden from
corporate managers even at the height of the harsh currency crisis, possibly undermining
the citizens’ support for the authoritarian regime.
JEL Classifications: M2 F51 P20 R11
Keywords: economic sanctions, financial sanctions, Russia, currency crisis, authoritarian
regime, extended ordered probit models
† This study was financially supported by the Japan Society for the Promotion of Science (Grant No.
19KK0036) and the Slavic-Eurasian Research Center’s joint usage and research program.
‡ Economic Research Institute of Northeast Asia. 13th Floor, Bandaijima Building, Bandaijima 5-1,
Chuo-ku, Niigata City, 950-0078, Japan. E-mail: shida.yoshisada.2 [at] erina.or.jp.

2
Does the Currency Crisis Veil the Impact of Economic
Sanctions under an Authoritarian Regime?
An Inquiry into Russia
Yoshisada SHIDA
1. Introduction
Unilateral and multilateral economic sanctions are both traditional and recent instruments
of foreign policy. As senders, the US and the European Union are increasingly relying on
them to pursue their diplomatic goals while also triggering reciprocal actions from the
target (Felbermayr et al., 2020). As sanctions object to target countries’ policies and either
force them to change or contain such policies, it is no coincidence that conflicts occur
among countries that do not share common values or interests. Hence, frequent targets of
sanctions are non-democratic and authoritarian regimes.
Following Hufbauer et al. (2007), research has discussed the success or failure
of the political goals of coercive measures, but has not been limited to it. As sanctions
have unintended consequences, studies have covered various aspects. Sanctions
accompanied by perceived economic damage in target countries may provoke unrest
among the population, possibly undermining the political stability of and support bases
for the incumbent leadership. Impacts on the economy, public opinion, and political
authority, in terms of their extents, ranges, and the channels through which they spread to
the target countries have also been major points of focus in the research (Peksen, 2019;
Hufbauer and Jung, 2020; Felbermayr et al., 2021, etc.).
The intensified use of sanctions against authoritarian regimes in contemporary
times has added value to the scholarship because the impacts of sanctions can be
weakened in such contexts. Such regimes are more likely to seem tough in response to
the interventions externally, and pursue strong attitudes domestically. Authoritarian
governments can mobilize what they own more fully in order to mitigate the impacts than
democratic countries. They may also avert public criticism from their poor economic
management by scapegoating sanctions. Sanctions may also provoke backfire-effects like
nationalistic “rallying around the flag” behavior and blame-shifting, and veil the
3
responsibility of the outcomes as well. All of these can contribute toward the weakened
political impact of sanctions (Lektzian and Souva, 2007; Allen, 2008; Escriba-Folch and
Wright, 2010; Grossman et al., 2018; Frye, 2019; Alexeev and Hale, 2020).
These arguments are particularly relevant to the Russian case. In response to the
Crimean crisis in 2014 and subsequent events, Western countries have been imposing
economic sanctions, followed by Russia’s countermeasures. Since then, Russia has
continued to fuel the erosion of its foreign relations, and this has led to escalated sanctions.
Russia initially demonstrated its resilience economically and politically. Although
moderate and with a temporal interruption, the economy kept growing and Putin’s
approval ratings increased sharply right after the imposition of the sanctions.1
A significant oil price reduction, a sharp currency depreciation, and the structural
problems of resource dependency, coupled with the remaining after-effects of the global
financial crisis, simultaneously affected the economy negatively (e.g., Connolly, 2016;
Gurvich and Prilepskiy, 2018; Dabrowski, 2019). The overlaps and interactions among
these factors constitute the basic features of the recent economic slowdown and their
respective policy measures sometimes conflicted with each other (Mau, 2016; Korotin et
al., 2019). Thus, it is difficult to assess the direct impact of the sanctions separately. This
complexity is an unfortunate issue for the government to tackle. Meanwhile, it may in
fact be fortunate because other factors may mask the sanctions. Milov (2017) criticized
the view that blames oil prices and currency shocks as propaganda to make the economy
appear resilient and sanctions appear less effective. This may favor sender countries
because they may attribute a recession to sanctions even if it is not attributable (Ashford,
2016).
Russia is an unprecedented target of sanctions as an authoritarian country and
global superpower. It offers a unique opportunity to examine the effectiveness of
international sanctions. Along with repeated escalation, the economic costs of sanctions
transcend the targeted countries and sectors (Korhonen et al., 2018; Åslund and
Snegovaya, 2021). The IMF (2019) estimated the gap between actual and pre-sanction
predicted Russia’s growth rates at 0.2% points on average for 2014–2018. Putin himself
1 According to the Levada Center’s survey, Putin’s approval ratings jumped from 61% in
November 2013 to 88% in October 2014. https://www.levada.ru/en/ratings/ (accessed on May 11, 2021).

4
reluctantly admitted to the crippling nature of the sanctions, and he now strives to mitigate
them in the face of increasing country-wide social unrest (Vatansever, 2020; Åslund and
Snegovaya, 2021).
The sanctions against Russia attracted the attention of several researchers.
Macroeconometric studies that used time-series data concluded that sanctions had
marginal or no impacts (Dreger et al., 2016; Tuzova and Qayum, 2016; Prilepskiy, 2019).
Some compared sanctions and oil price shocks (Dreger et al., 2016; Kholodilin and
Netsunajev, 2019; Pestova and Mamonov, 2019), but did not investigate how their
possible interrelationship affected the economy. Studies have employed a variety of data
and approaches such as high-frequency data on stock market indices, exchange rates, and
event news (Ankudinov et al., 2017; Hoffmann and Neuenkirch, 2017; Stone, 2017;
Naidenova and Novikova, 2018; Korotin et al., 2019; Aganin, 2020); long-term scenario
analysis (Benzell and Lagarda, 2017); advanced approaches including nighttime light
data (Brock, 2019) and textual analysis of firms’ reports (Davydov et al., 2021); and the
impact on neighboring countries (Bayramov et al., 2020), among others.
Research using microdata is rather limited. Golikova and Kuznetsov (2017)
found that half the companies surveyed encountered sanctions-related risks. Crozet and
Hinz (2020) and Crozet et al. (2021) confirmed that sanctions and counter-sanctions
harmed trade with Russia. Ahn and Ludema (2020) demonstrated that the sanctions led
to a reduction in the revenue and asset values of targeted companies. These issues
highlight the negative impact of sanctions, but pay little attention to other factors and the
interrelationship with sanctions. From a political perspective, Frye (2019), Alexeev and
Hale (2020), and Peeva (2020) examined the impact of sanctions on citizens’ political
behavior, but not on the economy itself. Sanctions, without actual or perceived economic
damage, may not affect political behavior. We are more concerned about how much
sanctions can affect the economy really and whether their impacts are different from other
shocks. In this sense, we fill the gap left behind by earlier research by focusing on macro
and micro perspectives on the one hand and economics and politics on the other hand.
We aim to assess the impact of sanctions comparatively with other concurrent
shocks, disentangle the differences and commonalities among the impact transmission
channels, and explore their interrelated impacts on the economy. The last aspect pertains
to whether an authoritarian leader’s blame-shifting would work. We examine whether

5
other shocks can mitigate or intensify the impact of sanctions or vice versa. These three
aspects remain to be thoroughly examined both at the macro and micro levels. The study
used data of a firm interview survey that was conducted in late 2015. The survey asked
742 executive managers of Russian joint-stock and limited liability companies with over
50 employees each to assess the impact of events that occurred almost simultaneously,
namely sanctions against Russia, Russia’s countermeasures, the Chinese stock market
turbulence, and the sharp depreciation of the ruble, which was closely related to the oil
price movement. We investigated the factors that determined the impact assessment of
each shock using an ordered probit estimator and an extended ordered probit model with
an ordinal endogenous covariate. This paper contributes to the literature on whether firm
managers under an authoritarian regime perceive the impact of sanctions against the
government’s allegations, while emphasizing on whether they can differentiate the
concurrent impacts and how their perceptions of the impact are intertwined with each
other.
The main findings are as follows. First, we found that the economic sanctions
produced sufficient perceivable business damage. Second, the shock of the sanctions
spread through restricted financial channels. Third, the negative assessment of the
sanctions increased in association with those of the currency crisis. Overall, we found
differences, commonalities, and interrelationships among the impacts of the sanctions and
the currency crisis. The sanctions had their own transmission channels that the currency
crisis did not have, and their impacts spread to almost the entire economy. At the same
time, both shocks reinforced each other. An increased negative view of the currency crisis
did not reduce the probability of the negative assessment of the sanctions. These findings
show that the impact of the sanctions could not be hidden from corporate managers even
at the height of the harsh currency collapse, probably undermining the citizens’ support
for the authoritarian regime, and that is why Russia is in a difficult situation and moving
farther and farther along the path of economic slowdown.
The rest of this paper is organized as follows. The next section reviews the
previous literature and addresses issues we tackle in this study. Section 3 assesses the
impact of sanctions and compares it with other shocks using the survey data. Section 4
describes the data and the estimation strategy and interprets the results. Finally, we
summarize the study and present its policy implications.

6
2. Literature review
For over a decade, Russia has been in a crisis that can be deemed a new “normal”
(Dabrowski, 2019). The global financial crisis in 2007 followed by the European debt
crisis hit the Russian economy very hard and disrupted its high-growth economic model
(Mau, 2016). After a short period of recovery, in 2014, external shocks concurrently
struck the economy. A significant decline in oil prices and the imposition of sanctions hurt
the economy seriously and led to a currency crisis.
Besides various estimates of the impact of sanctions (Gurvich and Prilepskiy,
2018; Prilepskiy, 2019), we retrospectively found a 2.7% point drop in annual growth
rates between before and after the sanctions were imposed, for the year 2014–2015, with
five successive negative quarterly growth points from 2015Q1 to 2016Q1, for the first
time since 2010.2 This gap should not be considered the consequence of the sanctions
alone, because the concurrent shocks produced intertwined effects that led to the
under/over-valuation of sanctions. This section reviews the literature on the extent and
the way in which the simultaneous shocks affected the Russian economy, while focusing
on two interrelated aspects: (i) the financial sanctions and (ii) the collapse of the ruble
caused by two external shocks.
2.1 The impact of economic sanctions
In early 2014, Russia’s annexation of Crimea aroused a strong protest from western
countries.3 With subsequent events including the Malaysian Airlines Flight 17 incident,
intensified military conflicts in Eastern Ukraine, and the unfulfilled Minsk II agreement,
sender countries expanded the scope of the sanctions they imposed. The US responded
with a tougher bill to the alleged elections interference and cyberattacks, which tightened
the conditions for the lifting of sanctions and made it practically impossible in a short
2 Growth rates for 2014–2015 were 0.7% and -2.0%, respectively (accessed on May 18, 2021:
https://rosstat.gov.ru/accounts). Rosstat revised the estimates several times. Preliminary figures
appeared in the annual statistical yearbook for 2016, and were 0.7% and -3.7%, respectively,
thus producing a 4.4% points difference (https://gks.ru/bgd/regl/b16_13/Main.htm). 3 See CRS (2020) and the US and the EU’s websites: https://www.state.gov/ukraine-and-russia-
sanctions/; https://www.consilium.europa.eu/en/policies/sanctions/ukraine-crisis/.

7
period (Countering Russian Influence in Europe and Eurasia Act of 2017 (CRIEEA). P.L.
115–44, Title II). Attempted assassinations of former Russian citizens, the Syrian conflict,
and the Alexei Navalny poisoning case led to escalated sanctions according to the
Chemical and Biological Weapons Control and Warfare Elimination Act of 1991 (P.L.
102-182, Title III). In 2021, the Nord Stream 2 pipeline was also under the threat of the
US sanctions (Protecting Europe’s Energy Security Act of 2019). At the time of writing,
Russia was under US sanctions for several executive orders codified by the CRIEEA,
Global Magnitsky Act, etc. The EU also imposed sanctions in coordination with the US.
It started with restrictive measures targeting individuals and extended to economic
sanctions in 2014. The US’ Sectoral Sanctions Identifications (SSI) and Specially
Designated Nationals and Blocked Persons (SDN), and the EU’s restrictive measures list
the targets of the sanctions, which is continuously expanded on. As of May 2021, 449
entities and 175 individuals were subject to US sanctions, and 177 persons and 48 entities
were included in the EU’s list.4
The characteristic features of anti-Russian sanctions are their narrow scope.
Senders targeted specific companies in finance, energy, and military industries. The
companies on the list were barred from financial transactions with a certain maturity. The
export of technology and services related to the deep waters, Arctic Oceans, and shale oil
to major energy companies was banned. The “smart” sanctions did not concern ordinary
citizens. However, the effects may extend to the entire economy as restricted access to
the international financial market forms another feature of these sanctions. The targets
included only large state banks, but they held almost half the total assets in the banking
sector and received most of the Central Bank financing, meaning that most of the financial
system was subject to sanctions (IMF, 2014; Orlova, 2016). Russian companies, heavily
dependent on foreign currency-denominated debts, faced difficulties in (re)financing after
the sanctions began (Dreyer and Popescu, 2014; Shirov et al., 2015; Bitkov and Manuilov,
2018). Foreign authorities strengthened the monitoring of international transactions,
which resulted in delays and deterioration in business. Thus, foreign companies became
more cautious while dealing with their Russian partners (Ashford, 2016).
Political, economic, and geopolitical uncertainties affected Russia’s reputation
4 See the sanctions lists (accessed on May 17, 2021): https://sanctionssearch.ofac.treas.gov/;
http://www.consilium.europa.eu/en/policies/sanctions/ukraine-crisis/.

8
and increased its risk premium for financing and interest rates (Ulyukaev and Mau, 2015;
Tuzova and Qayum, 2016). Large companies returned to domestic markets in these
circumstances, which increased domestic financing costs for SMEs (Zakirova and
Zakirova, 2018; Pestova and Mamonov, 2019). Thus, the sanctions may have had a wide
range of direct and indirect adverse effects on all of Russia’s business.
Research shows variations in assessing sanctions. Macroeconomic studies have
generally supported the view that sanctions harmed the Russian economy but only slightly
(Dreger et al., 2016; Tuzova and Qayum, 2016; Prilepskiy, 2019, etc.). Instead, they
emphasized other factors. For example, Gurvich and Prilepskiy (2018) stated that the
impact of oil prices was 3.3 times as large as that of sanctions and argued that the effect
of sanctions would weaken over time. Bond et al. (2015) and Korhonen et al. (2018)
considered declining oil prices and accompanying currency depreciation the most
damaging. Various VAR estimations confirmed that the impacts of sanctions on growth,
inflation, and exchange rates were smaller than oil prices (Dreger et al., 2016; Tuzova and
Qayum, 2016; Bali, 2018; Prilepskiy, 2019; Bali and Nady Rapelanoro, 2020).
In contrast, micro-evidence presented a different picture, suggesting that
sanctions have an extensive impact on a wide range of areas of the economy. An opinion
survey conducted by the Levada Center in November 2014 showed that one-third of those
interviewed considered the sanctions the leading cause of the prevailing economic
slump.5 According to opinion surveys conducted by the Pew Research Center in 2015 and
2017, half the Russians believed that the sanctions affected the economy (Simmons et al.,
2015; Vice, 2017). 6 Golikova and Kuznetsov (2017) analyzed the risk perception of
companies and found that half the companies surveyed felt sanctions-associated risks.
Shida (2020) confirmed similar responses from other companies. Naidenova and
Novikova (2018) revealed that the announcement of introducing sanctions affected the
stock prices of 40 companies listed on the Moscow stock market negatively. Using firm-
level data, Ahn and Ludema (2020) demonstrated authentic evidence proving that targeted
5 45% and 30% of the respondents mentioned the falling oil prices and annexation costs,
respectively. See The Levada Center: https://www.levada.ru/2014/11/28/vliyanie-sanktsij-na-potreblenie/.
6 The Pew Research Center’s survey in 2015 asked what caused the most harm to the economy. Those who indicated the sanctions and falling oil prices accounted for 33%. The share of those who thought that the sanctions had a major effect was 45% in 2015 and 43% in 2017.

9
companies had reduced their revenue and asset values because of the sanctions.
2.2 The ruble collapse during the declining oil prices and the sanctions
Whereas both external shocks had different origins, they interrelatedly caused a deep
ruble depreciation from 2014 onward (Dabrowski, 2019). The Brent oil price (per barrel)
declined by 44.2% from USD 112 in June 2014 to USD 62 in December 2014, with the
subsequent decline to USD 31 in January 2016.7 In parallel, the exchange rate against the
US dollar went up by 33.3% from 34 rubles in June 2014 to 45 rubles in November 2014,
and then to 77 rubles in February 20168. This accelerated and peaked in the middle of
both these external shocks. This persistent substantial currency depreciation, often
accompanied by a reduction in international reserves is considered a currency crisis
(Leaven and Valencia, 2008; Dabrowski, 2016; Johnson and Woodruff, 2017). To
intervene in the forex market, the Central Bank of Russia (CBR) reduced international
reserves by USD 124 billion (-27.7%) in one year for 2014.9
Currency depreciation has negative and positive effects: it increases import
goods prices, induces inflation, and reduces the population’s purchasing power, which, in
turn, results in decreased domestic demand. It increases the costs of foreign debt
repayments, possibly damaging business. It also raises the price competitiveness of
domestic producers, thus stimulating the supply side of the economy, which may
contribute toward the increased net export and offset the reduced demand. The influence
of currency depreciation encompasses the entire population and its aggregate
macroeconomic impact is weighed in the balance between these effects.
In the Russian context, the oil price shock and the sanctions worked together to
depreciate the currency. In 2014–2015, as a resource-dependent economy, Russia
underwent a significant reduction in export incomes from mineral resources (-37.4%),
which led to a decline in oil and gas revenues as part of the federal budget (-21.1%).10 At
7 The US Energy Information Administration’s website (accessed on May 17, 2021):
https://www.eia.gov/dnav/pet/pet_pri_spt_s1_m.htm. 8 The IFS Database (accessed on May 17, 2021): https://data.imf.org/?sk=4c514d48-b6ba-49ed-
8ab9-52b0c1a0179b. 9 The CBR website (accessed on 26 May, 2021): https://www.cbr.ru/eng/hd_base/mrrf/mrrf_m/. 10 Rosstat’s export data and Minfin’s data on the consolidated federal budget (accessed on 26 May,
2021): https://rosstat.gov.ru/folder/11193; https://minfin.gov.ru/ru/statistics/conbud/.

10
the same time, the sanctions confronted large state banks and companies with the need to
deleverage foreign debts by selling foreign assets. Both shocks damaged Russia’s
economic prospects and indirectly weakened foreign businesses in Russia and direct
investments from abroad. In this state of uncertainty, households began to change rubles
into foreign currency (Mironov, 2015; Ashford, 2016; Dabrowski, 2016; Bitkov and
Manuilov, 2018).
Russia’s external debts decreased by 18.1% from USD 733 million in June 2014
to USD 600 million in December 2014, and then to USD 520 million in March 2016; FDI
inflows into Russia decreased by 68.2% from USD 69 in 2013 to USD 22 million in 2014,
and then to USD 7 million in 2015; only for the fourth quarter of 2014, did USD 76 billion
of private capital in net term flow from Russia, which is 252% larger than that of the
second quarter of the same year.11 Prilepskiy (2019) considered the impact of sanctions
the main cause of the reduced gross capital inflow, including FDI. Åslund and Snegovaya
(2021) also emphasized that the reduced inflow and increased outflow of capital were the
consequences of the sanctions, and not the oil price shock.
All these factors contributed toward the ruble collapse and affected the economy
in an interrelated fashion (Tyll et al., 2018). Dreger et al. (2016) emphasized the dominant
role of oil prices in ruble depreciation, whereas Kholodilin and Netsunajev’s (2019)
structural VAR estimations showed that the sanctions impacted the growth rates directly
and indirectly through the impact on exchange rates. Pestova and Mamonov (2019), based
on medium-sized Bayesian VAR models, showed that the financial sanctions substantially
affected growth with modest restraining effects on consumption and investment and more
marked effects on the exchange rate. They stated that “the impact of the effect more than
negligible but less than devastating. […] imply that an economic crisis would have
happened independent of financial sanctions” (p. 21). Wang et al.’s (2019) panel data
analysis of 23 countries presented the impact of sanctions on exchange rate volatility
through trade and financial channels, which manifested as reduced trade revenue and
restrictions on investment, asset, credit, and financing trigger inflation and the financial
outflow, which, in turn, resulted in increased exchange rate volatility. Previous research
has not fully considered the depreciation effect at the micro-level.
11 CBR’s data on external debts, foreign direct investments, and financial transactions of the
private sector (accessed on May 17, 2021): https://www.cbr.ru/eng/statistics/macro_itm/svs/.

11
Reviewing related literature in Sections 2.1 and 2.2, we address the remaining
issues to be explored in the following sections. First, the impact assessment of sanctions
is contrastive based on macro and micro approaches, and the latter has paid less attention
to other factors. Second, the differences and commonalities among the impacts of various
shocks on the economy are not evident. The relationship between sanctions and exchange
rate volatility and how they influence economic actors in a combined and/or distinct
manner have not been explored sufficiently in the literature. From the micro-level
perspective, there arises a question as to whether the population can distinguish between
the impacts of sanctions and other shocks. This is closely connected to how well
authoritarian leadership can manage the population’s perception of the effect of sanctions.
3. An impact assessment of sanctions and other external shocks on business: An overview
of the Economic Research Institute of Northeast Asia (ERINA) enterprise survey
The probability of the success of sanctions depends on their effectiveness in the early
phase, and it declines in the long run (Dizaji and Bergeijk, 2013). In the Russian case, the
first two years under the sanctions regime was the most acute phase, when the economic
crisis deepened and significant deleveraging of foreign debts took place (Pestova and
Mamonov, 2019). Critical issues for the Russian leadership at this point in time were
whether the population had detected the impact of the sanctions in its initial stages and
whether the ruble collapse had veiled it. Thus, we focus on the early period of the
sanctions, namely 2014–2015.
We used data from the enterprise survey conducted by ERINA in the fourth
quarter of 2015. The survey targeted joint-stock and limited liability companies with over
50 employees in select regions in Russia. 12 A total of 742 executive managers (top
management or senior officials) who were competent to evaluate the prevailing state of
the company and respond to questions objectively were interviewed. The survey
investigated how they assessed various shocks to their management activities. Those
interviewed were asked to grade the impact of the shocks on a five-point scale that ranged
12 The survey investigated the regional economic heterogeneity between eastern and western
Russia, thus covering two different but comparable regions. The selection of regions and companies were based on their economic sizes, population, number of enterprises, industries, etc. GfK Russia, a market-research company based in Moscow, conducted face-to-face interviews (Arai and Iwasaki, 2018).
12
from definitely negative to definitely positive.
The shocks examined in this survey included: (1) the economic sanctions against
Russia, (2) Russia’s counter-sanctions, (3) a significant depreciation of the ruble (from
the end of 2014 to August 2015), and (4) the Chinese stock market turbulence (in summer
2015). Russia’s counter-sanctions barred the import of food and agricultural products
from sender countries, which resulted in shortages and inflation. During the Chinese stock
market turbulence, one-third of the market value of A-shares on the Shanghai Stock
Exchange were lost in a month.
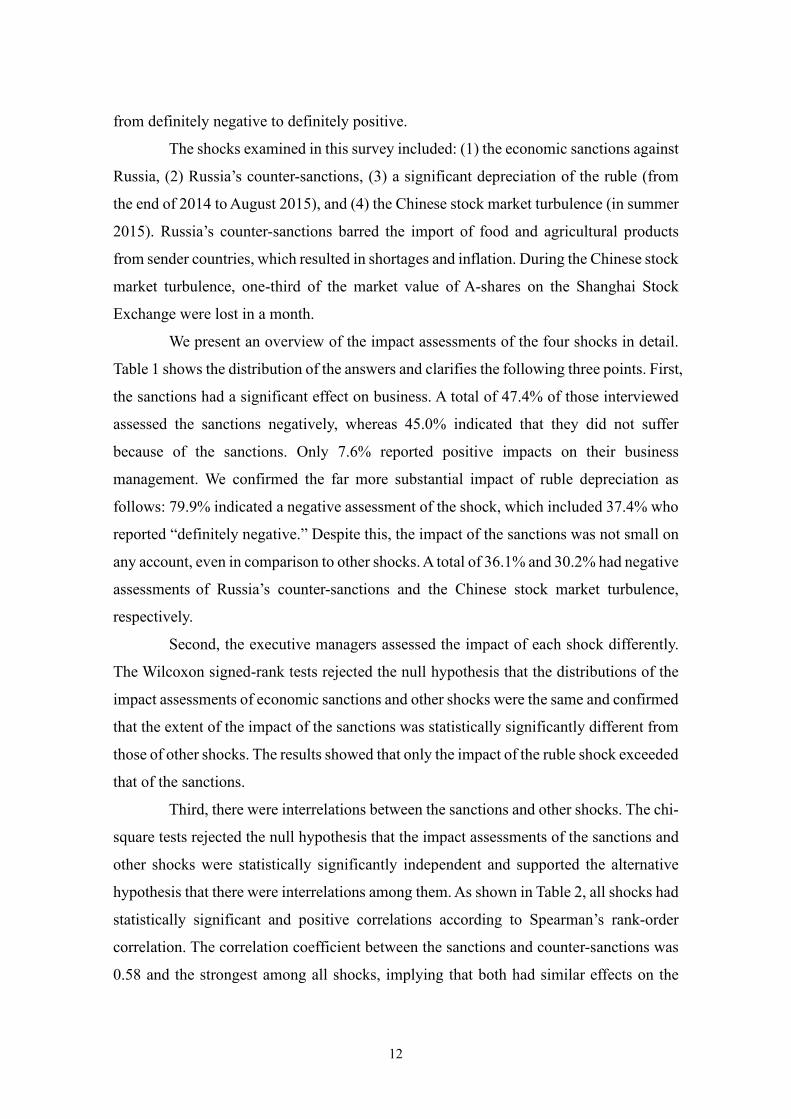
We present an overview of the impact assessments of the four shocks in detail.
Table 1 shows the distribution of the answers and clarifies the following three points. First,
the sanctions had a significant effect on business. A total of 47.4% of those interviewed
assessed the sanctions negatively, whereas 45.0% indicated that they did not suffer
because of the sanctions. Only 7.6% reported positive impacts on their business
management. We confirmed the far more substantial impact of ruble depreciation as
follows: 79.9% indicated a negative assessment of the shock, which included 37.4% who
reported “definitely negative.” Despite this, the impact of the sanctions was not small on
any account, even in comparison to other shocks. A total of 36.1% and 30.2% had negative
assessments of Russia’s counter-sanctions and the Chinese stock market turbulence,
respectively.
Second, the executive managers assessed the impact of each shock differently.
The Wilcoxon signed-rank tests rejected the null hypothesis that the distributions of the
impact assessments of economic sanctions and other shocks were the same and confirmed
that the extent of the impact of the sanctions was statistically significantly different from
those of other shocks. The results showed that only the impact of the ruble shock exceeded
that of the sanctions.
Third, there were interrelations between the sanctions and other shocks. The chi-
square tests rejected the null hypothesis that the impact assessments of the sanctions and
other shocks were statistically significantly independent and supported the alternative
hypothesis that there were interrelations among them. As shown in Table 2, all shocks had
statistically significant and positive correlations according to Spearman’s rank-order
correlation. The correlation coefficient between the sanctions and counter-sanctions was
0.58 and the strongest among all shocks, implying that both had similar effects on the

13
business. The sanctions and the ruble collapse had a positive but weak relationship as the
correlation coefficient was 0.42. The relationship was also asymmetric. As many as
35.3% respondents assessed the ruble collapse as having a negative impact and the
sanctions as having no or positive impact. Only 3.3% reflected that the sanctions had a
negative impact and the ruble collapse had no impact. It follows that the companies that
experienced pain from the sanctions were inclined to consider the ruble collapse harmful,
too, but the opposite was not necessarily true. The Chinese stock market turbulence was
weakly correlated with other shocks.
We found that several shocks affected Russian businesses differently and
interrelatedly with each other. The four shocks we examined were exogenous for
companies that occurred almost simultaneously. Anti-Russian sanctions and Russia’s
countermeasures had institutional frameworks (institutional shocks) with different origins
(domestic or abroad). The Chinese stock market turbulence and ruble depreciation
occurred in the financial market (financial shocks), also in different locations.
[Tables 1 and 2 here]
4. Regression analysis: Strategy and results
Considering the argument in the previous section, we can naturally expect the following
two hypotheses. First, four external shocks with different profiles differed in the
transmission channels in terms of how they affected the perceptions of the respondents.
Second, the currency crisis affected the assessment of the sanctions. We explore these
issues in this section.
4.1 Estimation strategy and data
We identified the factors that determined the impact assessment of each shock in three
steps. First, we applied the same estimation model to all shocks and compared their results
to address the commonalities and differences among them. Thus, we introduced the
economic sanctions imposed on Russia (sanction), Russia’s counter-sanctions
(antisanction), the Chinese stock market turbulence in 2015 (chinastock), and the sharp
depreciation of the ruble in 2014−2015 (rublerate), as dependent variables. Their impacts
on general management activities were ordinal variables assessed on five grades that

14
ranged from 0=“definitely positive” to 4=“definitely negative,” with 2=“no impact.” We
used them as dependent variables for each estimation and employed an ordered probit
estimator using robust standard errors as follows:
𝑦𝑦 = 𝜇𝜇 + ∑𝛽𝛽𝛽𝛽 + 𝜀𝜀 (1),
where 𝑦𝑦 is a dependent variable, 𝜇𝜇 is a constant term, 𝛽𝛽 is an independent variable and 𝛽𝛽
is its coefficient, and 𝜀𝜀 is an error term. We also applied the ordered logit and ordinary
least squares (OLS) estimators to exact specifications.
Next, we examined their interrelationship and determined whether the estimation
results were derived after controlling the impact assessment of the other external shocks.
For this, one of the other shocks (which was not used as a dependent variable) was
incorporated as an additional explanatory variable in the estimation of sanction, and vice
versa, as follows:
𝑦𝑦 = 𝜇𝜇 + ∑𝛽𝛽𝛽𝛽 + 𝛾𝛾(𝑡𝑡ℎ𝑒𝑒 𝑜𝑜𝑡𝑡ℎ𝑒𝑒𝑒𝑒 𝑠𝑠ℎ𝑜𝑜𝑜𝑜𝑜𝑜) + 𝜀𝜀 (2)
For comparison, we used the same explanatory variables in all estimations.
The four shocks occurred almost simultaneously and did not have causal
relationships. Instead, they probably had intertwined relationships, as those interviewed
assessed the impact of one shock in conjunction with that of another. Thus, we next
inquired into the endogenous relationship among the shocks for which we used an
extended ordered probit model with an ordinal endogenous covariate: antisanction,
rublerate, and chinastock were treated as endogenous variables in each sanction model.
The opposite relationships were also examined in the same manner.13
Table 3 presents the data, definitions, and descriptive statistics employed.
Following Golikova and Kuznetsov (2017) and Shida (2020), we used various
explanatory variables, which we divided into four categories. The first pertained to basic
characteristics that reflect the legal and organizational features of a company, namely state
(ownsta) and foreign (ownfor) ownership ratios, dummy variables for joint-stock (jsc)
and listed (listed) companies, and the size of the company measured by the number of
employees (comsiz). They are all categorical variables.
The second pertained to industry dummies with four groups: mining,
13 antisanction was instrumented by a dummy variable for primary industry; rublerate by the
impact assessment of the global financial crisis; chinastock by a dummy variable for foreign trade operations; and sanction by a dummy variable for state procurement.

15
manufacturing, utilities (electricity, gas, and water supply), construction, and tertiary
(trade, transport, and communication).
The third group concerned external financing sources that referred to the main
financing source before the sanctions were imposed. No external source was a default
category. External sources were classified into the following categories: banking, budget
expenditures from federal, regional, and municipal governments (budget), and other.
Banking was divided into large banks located in capital cities (major bank), and regional
and foreign banks. As some major banks like Sberbank and capital banks in Moscow and
St. Petersburg were on the target list of sanctions, this variable had the potential to serve
as a signal of financial sanctions. The category titled other included private funds and
financing from associated companies (holding or group companies other than financial
institutions).
Finally, we controlled the geographical factors of the business. Trade partners’
regions were considered: Ukraine, the Commonwealth of Independent States (CIS)
excluding Ukraine, European countries (Europe), the US and Canada (US and Canada),
Asian countries (Asia), and the rest of the world (RoW). The company’s location at the
federal subject level was also considered through the use of regional dummy variables.
[Table 3 here]
4.2 Results
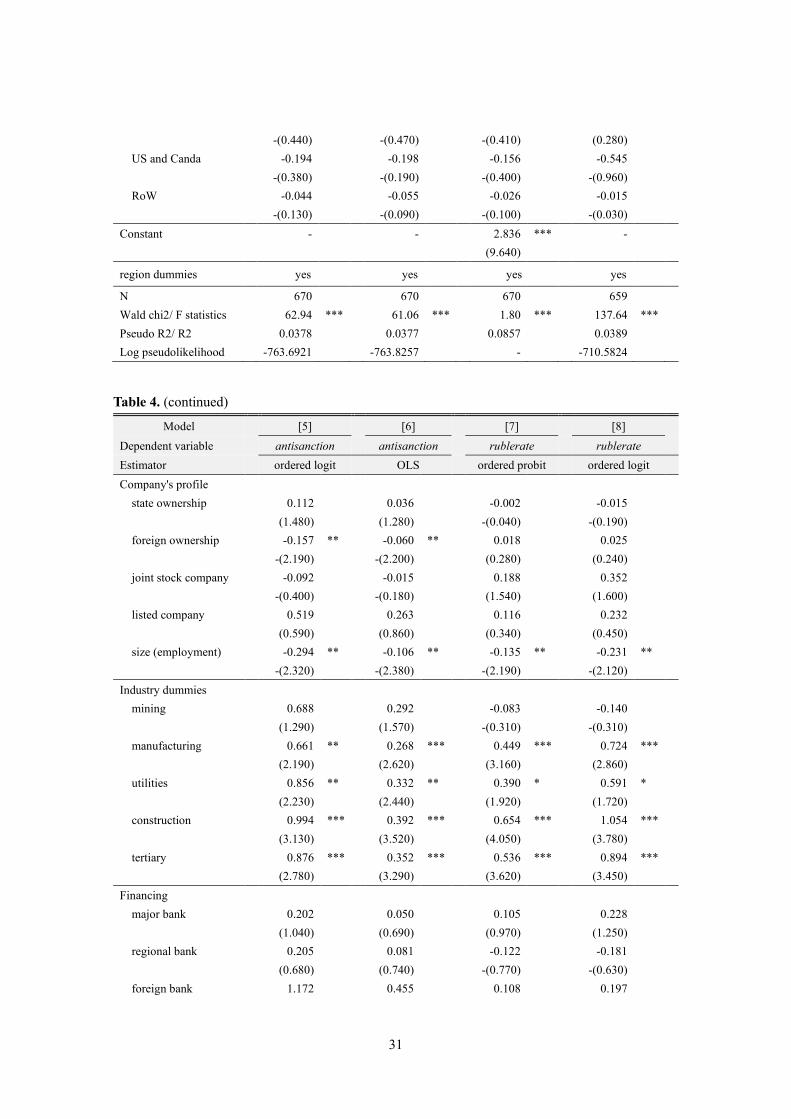
1) Determinants of the impact assessment of shocks: Differences and commonalities
Table 4 shows the estimation results based on equation (1) in Section 4.1. Using an
ordered probit estimator, we identified the factors that determined the impact assessment
of four shocks, including the economic sanctions (models [1], [4], [7], and [10]). The
different estimators, namely the ordered logit (models [2], [5], [8], and [11]), and OLS
(models [3], [6], [9], and [12]), provided supporting results. The determining factors
differed based on the shocks.
The first and essential finding related to financing. The external financing
channels had a statistically significantly harmful impact on the sanctions assessment of
the company (coefficients with positive signs). Companies’ financing from the major
bank, including targeted financial sources like Sberbank and other major state banks

16
located in the metropolitan cities assessed the sanctions negatively. Those that relied on
the budget expenditures (budget) and private funds (other) suffered as a result of sanctions,
too. These effects were not found in other shocks. These factors did not affect antisanction
(except for model [4]), rublerate, and chinastock.
Second, whether they were senders or not, trade partners did not matter for the
impact assessment of the sanctions. Statistically significant impacts were reported in other
shock assessments. For example, foreign trade with Chinese partners affected chinastock
negatively.
Third, we found a similarity in the estimation results. The industry factors
affected sanction, antisanction, and rublerate similarly. Companies that worked in the
manufacturing, construction, and service sectors suffered more when the shock occurred.
Larger companies suffered lesser as a result of the sanctions, Russia’s countermeasures,
and the currency crisis.
These three findings explain the difference and commonalities between the
impact transmission channels of both the sanctions and other shocks. It follows that the
sanctions affected the Russian economy through the financial channels and the executive
managers of the company perceived the sanctions separately and differently from the
currency crisis.
[Table 4 here]
2) The impact relationship between the sanctions and other shocks
Next, we incorporated each shock as a dependent variable into the baseline model to
examine the impact of three shocks on sanction. Table 5 reports the results. The results
confirmed the consistency between Tables 4 and 5. The executive managers noted that
the sanctions affected their management activities through financial restrictions on major
banks, and the country of the trade partner did not influence their assessment. Other
shocks also affected the assessment of the sanctions in a statistically significant manner,
implying that the more negatively executive managers assessed the other shocks, the more
negatively they evaluated the impact of sanctions.
[Table 5 here]

17
The impact of the sanctions on the three shocks was examined separately (Table
6). In all models, the coefficients of sanctions were statistically significant and positive.
Among the respondents, those who had a negative assessment of the sanctions tended to
perceive the impact of other shocks negatively.
Tables 4 and 6 are similar in terms of the trade partners’ regions. The sanctions
and counter-sanctions as institutional shocks, and the Chinese stock market turbulence
and the ruble depreciation as financial shocks, differed in several ways. The results show
that the shocks were interrelated although they had different transmission channels for
their impacts.
[Table 6 here]
3) Endogenous relationships among shocks and the magnitude of their impacts
Table 7 presents the results from the extended ordered probit models with ordinal
endogenous covariates. The results show that the financial restrictions on large banks
formed the essential feature of the sanctions against Russia that the other shocks did not
share in common, even while considering the endogeneity issue.
As models [2] and [4] show, the sanctions (sanction) and the currency crisis
(rublerate) had an endogenous association with each other and reinforced their negative
assessments. The error correlation estimates support the endogeneity hypothesis. In
contrast, antisanction and sanction did not have meaningful impacts on sanction (model
[1]) and chinastock (model [6]), respectively.
[Table 7 here]
Finally, we measured the marginal effects of shocks on the sanctions assessment,
corresponding to models [1]–[3] in Table 7. Figure 1 depicts the calculated average
marginal effects with a 95% confidence interval. The horizontal axis (x) corresponds to
the impact assessment of each shock (independent variable). For example, “def. negative”
shown on the horizontal axis in Figure 1 (b) corresponds to those who assessed the ruble
depreciation (rublerate) as having a “definitely negative” impact. The vertical axis (y) in

18
the figure shows the probability of impact assessment of the sanctions (sanction).
Compared to those who assessed rublerate as having a “definitely positive” impact (a
baseline outcome), those with a “definitely negative” assessment were 60.0 and 8.0%
points more likely to assess sanction as having “definitely negative” (red line) and a
“rather negative” impact (blue line), respectively. Those who assessed rublerate as having
a “rather negative” impact were 31.6 and 27.9% points more likely to value sanction as
having “definitely negative” (red line) and “rather negative” impacts (blue line),
respectively. Those with a “rather positive” assessment on rublerate were 22.0% points
less likely to assess sanction as “definitely positive” (yellow line).
Figure 2 depicts the calculated average marginal effects of sanction on other
shock assessments, corresponding to models [4]–[6] in Table 7. Those who assessed
sanction as having “definitely negative” and “rather negative” impacts mostly perceived
rublerate as having a “definitely negative” impact, with 98.5 and 67.5% points larger than
the baseline outcome, respectively (red line).
In sum, the sanctions had peculiar transmission channels to affect businesses,
and their negative assessments of the impact in most cases accompanied the negative
evaluation of the currency crisis.
[Figures 1 and 2 here]
5. Conclusions
Using data from an interview survey of 742 companies conducted in late 2015, we
quantitatively assessed the impact of economic sanctions on the management activities of
Russian companies. We paid particular attention to the commonalities and differences
between the transmission channels and the interrelation among the sanctions and other
shocks that occurred simultaneously. We found that the sanctions had a non-negligible
impact on the economy, which is consistent with the literature and evidence drawn using
micro data. We also confirmed the argument in the literature using macro time-series data
that the ruble depreciation had a stronger impact than did the sanctions.
We found differences among the channels that transmitted the impact of the
shocks. The sanctions were one of the economic tools with an institutional framework
aimed at an entire nation and had a geographically uniform impact, whereas financial

19
shocks from the Chinese stock market turbulence and ruble depreciation had different
effects on businesses. The impact assessments differed based on the trading partners’
region. In contrast, the external financing sources were partly subject to the sanctions and
affected only its impact assessment.
We confirmed that the shocks reinforced each other despite differences in the
transmission channels of their impacts, which made it difficult to disentangle the impacts
of the shocks from the perspective of the executive managers at the firm level. This means
that the currency crisis and sanctions worked in the same direction to generate perceivable
damage for businesses. However, the former neither reduced the probability of the
negative assessment of the latter nor obscured the negative effect of financial restrictions
on targeted entities. Thus, we expect that the economic pain of the sanctions will finally
connect with a lower level of effectiveness of blame-shifting (scapegoating), thus
undermining the legitimacy of the Putin administration. The oil price shocks do not mask,
but rather fuel the perceived damages caused by the sanctions. Drawing from the Russian
experience, it is clear that citizens or at least business-persons can perceive the impact of
various shocks separately. At the same time, their perceptions are not independent of each
other. Although authoritarian leaderships strive to blame the external shocks, their efforts
do not always work as expected and hardly mask the vulnerability to the sanctions.
As Dabrowski (2019) pointed out, Russia’s leadership, which successfully
attributed the economic slump to oil prices and insisted on its invulnerability to foreign
political pressure was confronted with significant challenges. Russia’s international
environment has continued to deteriorate, and it faces very severe conditions in which the
lifting of sanctions can hardly be expected. Under these circumstances, the sanctions will
continuously hurt both businesses and the economy. The impact of sanctions is
strengthened by the effect of other existing negative factors. The enhanced ruble
depreciation, associated with a decline in oil prices, will leave the business management
of Russian companies vulnerable to the impact of sanctions. They will also become
vulnerable to changes in economic parameters if they suffer as a result of restricted access
to the international capital market. Therefore, economic sanctions against Russia,
especially financial ones, remain severe issues for the future in practical terms.

20
Reference
Aganin, Artem D. (2020). “Russian Stock Index Volatility: Oil and Sanctions,” Voprosy
ekonomiki, No. 2, pp. 86–100.
Ahn, Daniel P., and Rodney D. Ludema (2020). “The Sword and the Shield: The
Economics of Targeted Sanctions,” European Economic Review, Vol. 135.
https://doi.org/10.1016/j.euroecorev.2020.103587.
Alexeev, Mikhail A., and Henry E. Hale (2020). “Crimea Come What May: Do Economic
Sanctions Backfire Politically?” Journal of Peace Research, Vol. 57 (2), pp. 344–359.
Allen, Susan Hannah (2008). “The Domestic Political Costs of Economic Sanctions.” The
Journal of Conflict Resolution, Vol. 52 (6), pp. 916–944.
Ankudinov, Andrei, Rustam Ibragimov, and Oleg Lebedev (2017). “Sanctions and
Russian Stock Market,” Research in International Business and Finance, Vol. 40, pp.
150–162.
Arai, Hirofumi, and Ichiro Iwasaki (2018), “Market Quality in the Russian Far East from
the Viewpoint of Company Management: Preliminary Report on Microeconomic
Comparative Analysis with European Regions,” ERINA Discussion Paper, No. 1602-
e, November (revised version).
Ashford, Emma (2016). “Not-So-Smart Sanctions: The Failure of Western Restrictions
against Russia,” Foreign Affairs, Vol. 95 (1), pp. 114–123.
Åslund, Anders, and Maria Snegovaya (2021). The Impact of Western Sanctions on Russia
and How They Can Be Made Even More Effective. Atlantic Council, May 3, 2021:
https://www.atlanticcouncil.org/in-depth-research-reports/report/the-impact-of-
western-sanctions-on-russia/.
Bali, Morad (2018). “The Impact of Economic Sanctions on Russia and its Six Greatest
European Trade Partners: A Country SVAR Analysis”, Finansy i bizness, Vol. 14, No.
2, pp. 45−67.
Bali, Morad, and Nady Rapelanoro (2020). “International Economic Sanctions:
Multipurpose Index Modelling in the Ukrainian Crisis”, EconomiX, 2020-8.
Bayramov, Vugar, Nabi Rustamli, and Gulnara Abbas (2020). “Collateral damage: the
Western Sanctions on Russia and the Evaluation of Implications for Russia’s Post-
communist Neighbourhood,” International Economics, Vol. 162, pp. 92–109.
Benzell, Seth G., and Guillermo Lagarda (2017). “Can Russia Survive Economic

21
Sanctions?” Asian Economic Papers, Vol. 16 (3), pp. 78 – 120.
Bitkov, Viktor Pavlovich, and Konstantin Evgen’evich Manuilov (2018). “Vliyanie
sanktsii na finansovyi rynok Rossii,” Problemy natsional’noi strategii, No. 3 (43), pp.
137−155.
Brock, Gregory (2019). “A Remote Sensing Look at the Economy of a Russian Region
(Rostov) Adjacent to the Ukrainian Crisis,” Journal of Economic Modeling, Vol. 41,
pp. 416–431.
Bond, Ian, Christian Odendahl, and Jennifer Rankin (2015). Frozen: The Politics and
Economics of Sanctions against Russia, Center for European Reform, March.
Connolly, Richard (2016), “The Empire Strikes Back: Economic Statecraft and the
Securitisation of Political Economy in Russia,” Europe-Asia Studies, Vol. 68, No. 4,
pp. 750–773.
Congressional Research Service (CRS) (2020). US Sanctions on Russia. R54515. January
17, 2020.
Crozet, Matthieu, and Julian Hinz (2020). “Friendly fire: The trade impact of the Russia
sanctions and counter-sanctions,” Economic Policy, Vol. 35 (101), pp. 97–146.
Crozet, Matthieu, Julian Hinz, Amrei Stammann, and Joschka Wanner (2021). “Worth the
Pain? Firms’ Exporting Behavior to Countries under Sanctions,” European Economic
Review, Vol. 134. https://doi.org/10.1016/j.euroecorev.2021.103683.
Dabrowski, Marek (2016). “Currency Crises in Post-Soviet Economies – A Never Ending
Story?” Russian Journal of Economics, Vol. 2, pp. 306–326.
Dabrowski, Marek (2019). “Factors Determining Russia’s Long-Term Growth Rate,”
Russian Journal of Economics, Vol. 5 (2019), pp. 328–353.
Davydov, Denis, Jukka Sihvonen, and Laura Solanko (2021). Who Cares about
Sanctions? Observations from Annual Reports of European Firms, BOFIT Discussion
Papers, No. 5.
Dizaji, Sajjad Faraji, and Peter A G van Bergeijk (2013). “Potential Early Phase Success
and Ultimate Failure of Economic Sanctions: a VAR Approach with an Application to
Iran,” Journal of Peace Research, Vol. 50 (6), pp. 721–736.
Dreger, Christian, Konstantin Kholodilin, Dirk Ulbricht, and Jarko Fidrmuc (2016).
“Between the Hammer and the Anvil: The Impact of Economic Sanctions and Oil
Prices on Russia’s Ruble,” Journal of Comparative Economics, Vol. 44, No. 2, pp.
22
295–308.
Dreyer, Iana, and Nicu Popescu (2014). “Do Sanctions against Russia Work?” European
Union Institute for Security Studies Briefs, No. 35¸ December.
Escribà-Folch, Abel, and Joseph Wright (2010). “Dealing with Tyranny: International
Sanctions and the Survival of Authoritarian Rulers,” International Studies Quarterly,
Vol. 54 (2), pp. 335–359.
Felbermayr, Gabriel, Aleksandra Kirilakha, Constantinos Syropoulos, Erdal Yalcin, and
Yoto Yotov (2020). “The Global Sanctions Data Base,” European Economic Review,
Vol. 129. https://doi.org/10.1016/j.euroecorev.2020.103561.
Felbermayr, Gabriel, T. Clifton Morgan, Constantinos Syropoulos, and Yoto V. Yotov
(2021). “Understanding Economic Sanctions: Interdisciplinary Perspectives on
Theory and Evidence,” European Economic Review, Vol. 135:
https://doi.org/10.1016/j.euroecorev.2021.103720.
Frye, Timothy (2019). “Economic Sanctions and Public Opinion: Survey Experiments
from Russia,” Comparative Political Studies, Vol. 52 (7), pp. 967–994.
Golikova, Victoria, and Boris Kuznetsov (2017). “Perception of Risks Associated with
Economic Sanctions: The Case of Russian Manufacturing,” Post-Soviet Affairs, Vol.
33 (1), pp. 49–62.
Grossman, Guy, Devorah Manekin, and Yotam Margalit (2018). “How Sanctions Affect
Public Opinion in Target Countries: Experimental Evidence From Israel,”
Comparative Political Studies, Vol. 51 (14), pp. 1823–1857.
Gurvich, Evsey, and Ilya Prilepskiy (2018). “Western Sanctions and Russian Reponses:
Effects after Three Years,” in: Torbjon Becker and Susanne Oxenstierna, eds., The
Russian Economy under Putin, London and New York: Routledge.
Hoffman, Manuel, and Matthias Neuenkirch (2017). “The pro-Russian Conflict and Its
Impact on Stock Returns in Russia and the Ukraine,” International Economics and
Economic Policy, Vol. 14, pp. 61–73.
Hufbauer, Gary C., Jeffrey J. Schott, Kimberly A. Elliott, and Barbara Oegg (2007).
Economic Sanctions Reconsidered, 3rd edition, Washington, D.C.: Peterson Institute
for International Economics.
Hufbauer, Gary C., and Euijin Jung (2020). “What’s New in Economic Sanctions?”
European Economic Review, Vol. 130(C).

23
https://doi.org/10.1016/j.euroecorev.2020.103572
International Monetary Fund (IMF) (2014). Russian Federation: 2014 Article IV
Consultation, IMF Country Report No. 14/175.
International Monetary Fund (IMF) (2015). Russian Federation: 2015 Article IV
Consultation, IMF Country Report No. 15/211.
International Monetary Fund (IMF) (2019). Russian Federation: 2019 Article IV
Consultation, IMF Country Report No. 19/260.
Johnson, Juliet, and David Woodruff (2017). “Currency Crises in Post-Soviet Russia,”
The Russian Review, Vol. 76, pp. 612–634.
Kholodilin, Konstantin A, and Aleksei Netsunajev (2019). “Crimea and Punishment: The
Impact of Sanctions on Russian Economy and Economies of the Euro Area,” Baltic
Journal of Economics, Vol. 19 (1), pp. 35–51.
Korhonen, Iikka, Heli Simola, and Laura Solanko (2018). “Sanctions and
Countersanctions – Effects on Economy, Trade and Finance,” Focus on European
Economic Integration, Oesterreichische Nationalbank (Austrian Central Bank), Issue
Q3−18, pp. 68−76.
Korotin, Vladimir, Maxim Dolgonosov, Victor Popov, Olesya Korotina, and Inna
Korolkova (2019). “The Ukrainian Crisis, Economic Sanctions, Oil Shock and
Commodity Currency: Analysis Based on EMD Approach,” Research in International
Business and Finance, Vol. 48, pp. 156–168.
Leaven, Luc, and Fabian Valencia (2008). Systemic Banking Crises: A New Database.
IMF Working Paper, WP/08/224.
Lektzian David, and Mark Souva (2007). “An Institutional Theory of Sanctions Onset
and Success,” Journal of Conflict Resolution, Vol. 51 (6), pp. 848–871.
Mau, Vladimir (2016). “Between Crises and Sanctions: Economic Policy pf the Russian
Federation,” Post-Soviet Affairs, Vol. 32 (4), pp. 350−377.
Milov, Vladimir (2017). “Why Sanctions Matter,” The American Interest, August 14,
2017: https://www.the-american-interest.com/2017/08/14/why-sanctions-matter/.
Mironov, Valeriy (2015). “Russian Devaluation in 2014–2015: Falling into the Abyss or
a Window of Opportunity?” Russian Journal of Economics, Vol. 1 (3), pp. 217–239.
Naidenova, Julia, and Anastasia Novikova (2018). “The Reaction of Russian Public
Companies’ Stock Price to Sanctions against Russia,” Journal of Corporate Financial
24
Research, Vol. 12 (3), pp. 27–38.
Orlova, Nataliya V. (2016), “Financial Sanctions: Consequences for Russia’s Economy
and Economic Policy,” Problems of Economic Transition, Vol. 58, No. 3, pp. 203–
217.
Peksen, Drusrun (2019). “When Do Imposed Economic Sanctions Work? A Critical
Review of the Sanctions Effectiveness Literature,” Defence and Peace Economics,
Vol. 30 (6), pp. 635–647.
Peeva, Aleksandra (2020). “Did Sanctions Help Putin?”
https://www.dropbox.com/s/45gnyklttpc05zr/Did%20sanctions%20help%20Putin.p
df?dl=0 (Earlier version: No 2019/7, Discussion Papers from Free University Berlin,
School of Business & Economics).
Pestova, Anna, and Mikhail Mamonov (2019). “Should We Care? The Economic Effects
of Financial Sanctions on the Russian Economy,” BOFIT Discussion Papers, 13.
Prilepskiy, I.V. (2019). “Financial Sanctions: Impact on Capital Flows and GDP Growth
in Russia,” Journal of the New Economic Association, Vol. 43 (3), pp. 163–172. (in
Russian)
Simmons, Katie, Bruce Stokes, and Jacob Pushter (2015). “NATO Publics Blame Russia
for Ukrainian Crisis, but Reluctant to Provide Military Aid. 2. Russian Public
Opinion: Putin Praised, West Panned,” Pew Research Center Global Attitudes &
Trends, 2015 June 10: https://www.pewglobal.org/2015/06/10/2-russian-public-
opinion-putin-praised-west-panned/.
Shida, Yoshisada (2020). “Russian Business under Economic Sanctions: Is There
Evidence of Regional Heterogeneity?” Post-Communist Economies, Vol. 49 (2), pp.
227–275.
Shirov, A.A, A.A. Yantovskii, and V.V. Potapenko (2015). “Evaluation of the Potential
Effect of Sanctions on the Economic Development of Russia and the European Union,”
Studies on Russian Economic Development, Vol. 26 (4), pp. 317–326.
Stone, M. (2017). “The Response of Russian Security Prices to Economic Sanctions:
Policy Effectiveness and Transmission,” U.S. Department of State Office.
https://2009-2017.state.gov/e/oce/rls/papers/262748.htm
Tuzova, Yelena, and Faryal Qayum (2016). “Global Oil Glut and Sanctions: The Impact
of Putin’s Russia,” Energy Policy, Vol. 90, pp. 140–151.

25
Tyll, Ladislav, Karel Pernica, and Markéta Arltová (2018). “The Impact of Economic
Sanctions on Russian Economy and the RUB/USD Exchange Rate,” Journal of
International Studies, Vol. 11 (1), pp. 21–33.
Ulyukaev, Alexey, and Vladimir Mau (2015). “Ot ekonomicheskogo krizisa k
ekonomicheskomu rostu, ili kak ne dat’ krizisu prevratit’sia v stagnatsiiu,” Voprosy
ekonomiki, No. 4 (2015), pp. 5–19.
Vatansever, Adnan (2020). “Put over a barrel? “Smart” sanctions, petroleum and statecraft
in Russia,” Energy Research & Social Science.
https://doi.org/10.1016/j.erss.2020.101607.
Vice, Margaret (2017). “Russians Remain Confident in Putin’s Global Leadership. 2.
Russians’ take on the economy and problems at home,” Pew Research Center Global
Attitudes & Trends, 2017 June 20: https://www.pewglobal.org/2017/06/20/russians-
take-on-economy-and-problems-at-home/.
Wang, Yiwei, Ke Wang, and Chun-Ping Chang (2019). “The Impacts of Economic
Sanctions on Exchange Rate Volatility,” Economic Modelling, Vol. 82, pp. 58–65.
Zakirova, Diliara Farilovna, and El’vira Farilovna Zakirova (2018). “Otsenka vliianiia
ekonomicheskikh sanktsii na bankovskuiu sistemu Rossiiskoi Federatsii,” Aktual’nyi
problemy ekonomiki i prava, Vol. 12 (1), pp. 19–32.

26
Table 1. Impact assessment of various macroeconomic shocks on a company’s management activity
anti-Russian sanctions
Russia’s countermeasures
Ruble collapse (late 2014 to summer 2015)
Chinese stock market turbulence
(summer 2015)
number share (%) number share (%) number share (%) number share (%) Extent of the impact:
definitely negative impact 77 10.6 45 6.3 273 37.4 37 5.4 negative impact 267 36.8 213 29.8 310 42.5 178 25.8 no impact 327 45.0 387 54.2 99 13.6 447 64.8 positive impact 48 6.6 63 8.8 32 4.4 23 3.3 definitely positive impact 7 1.0 6 0.8 16 2.2 5 0.7 hard to answer 16 - 28 - 12 - 52 - total 742 100.0 742 100.0 742 100.0 742 100.0
Interrelation with the impact of anti-Russian sanctions:
test of independence(1): Chi-2 - 717.645 *** 295.071 *** 152.061 ***
Wilcoxon signed-rank test (2): z - -6.158 *** 14.972 *** -5.264 *** Notes:
1) The chi-square test of independence examines the null hypothesis (H0) that the impact assessments of economic sanctions and other
shocks are independent. ***, **, and * denote statistical significance at the 1%, 5%, and 10% levels, respectively.
2) The Wilcoxon signed-rank test examines the null hypothesis (H0) that distributions of the impact assessments of economic sanctions
and other shocks are the same. ***, **, and * denote statistical significance at the 1%, 5%, and 10% levels, respectively.
Source: The author’s compilation based on the ERINA enterprise survey.

27
Table 2. Interrelation among the impact assessments of various macroeconomic shocks
[1] [2] [3] [4] [1] Anti-Russian sanctions 1.00 [2] Russia’s countermeasures 0.58 *** 1.00 [3] Ruble collapse 0.42 *** 0.24 *** 1.00
[4] Chinese stock market turbulence 0.31 *** 0.36 *** 0.15 *** 1.00
Note:
Spearman rank correlation with Bonferroni’s correction. ***, **, and * denote statistical
significance at the 1%, 5%, and 10% levels, respectively.
Source: The author’s compilation based on the ERINA enterprise survey.

28
Table 3 Definitions and descriptive statistics of variables used in the estimation
variable definition obs. standard deviation min max median mean
Impact assessment of shocks on company's management behavior (1)
sanction Anti-Russian sanctions 726 0.81 0 4 2 2.49
antisanction Russia's countermeasures 714 0.76 0 4 2 2.32
rublerate Ruble collapse (late 2014 to summer 2015) 730 0.94 0 4 3 3.08
chinastock Chinese stock market turbulence (summer 2015) 690 0.66 0 4 2 2.32
Independent variables
ownsta (2) Ratio of state ownership participation 690 1.05 0 5 0 0.31
ownfor (2) Ratio of foreign investors' ownership 703 0.73 0 5 0 0.14
jsc Dummy variable for joint stock companies 742 0.44 0 1 0 0.26
listed Dummy variable for listed stock companies 742 0.13 0 1 0 0.02
comsiz Number of employees in the natural logarithm form 742 0.87 3.91 8.61 4.38 4.67
industry dummies (3) Industrial classifications of the company 742 1.82 1 6 4 4.04
external financing (4) Categorical variable for a main external financing source of the company 742 1.30 0 5 0 0.85
foreign trade partner (5) Dummy for business with countries below
ukraine Ukraine 733 0.15 0 1 0 0.02
cis CIS countries (excluding Ukraine) 733 0.33 0 1 0 0.13
europe European countries 733 0.39 0 1 0 0.19
asia Asian countries 733 0.32 0 1 0 0.11
uscanada US and Canada 733 0.11 0 1 0 0.01
row Rest of the world 733 0.07 0 1 0 0.01

29
Notes:
(1) The impacts of the shock on management activities are assessed as follows: 0=definitely positive; 1=rather positive; 3=no impact;
4=rather negative; and 5=definitely negative.
(2) This ordinal variable takes the following values according to the ownership share: 0=0%; 1=10% or less; 2=10.1-25%; 3=25.1-50%;
4=50.1-75%; and 5=75% or more.
(3) These dummies are categorical variables that take the following values according to industrial classification: 1=primary; 2=mining;
3=manufacturing; 4=utilities; 5=construction; and 6=tertiary sector.
(4) This variable takes the following values based on the main source of external financing: 0=no external financing; 1=major bank
(Sberbank and other major banks located in Moscow or St. Petersburg); 2=regional bank; 3=foreign bank; 4=budget (budgets and
extra-budgetary funds); and 5=other (investment, private pension funds, financing from non-financial organizations such as partner
companies and the same holding and company groups, and other non-financial companies).
(5) Dummy variables take the value of 1 if the company is engaged in trade with the country listed (multiple choice).
Source: The author’s compilation based on the ERINA enterprise survey.

30
Table 4. Estimation results: Determinants of the impact assessment of various shocks
Model [1] [2] [3] [4] Dependent variable sanction sanction sanction antisanction Estimator ordered probit ordered logit OLS ordered probit Company's profile
state ownership 0.044 0.076 0.031 0.059 (0.970) (0.910) (0.940) (1.430)
foreign ownership -0.088 * -0.177 ** -0.061 * -0.090 ** -(1.880) -(2.320) -(1.850) -(2.160)
joint stock company 0.048 0.030 0.037 -0.023 (0.390) (0.140) (0.420) -(0.200)
listed company 0.429 0.816 0.305 0.374 (1.140) (1.190) (1.120) (0.850)
size (employment) -0.172 ** -0.308 ** -0.122 ** -0.165 ** -(2.540) -(2.330) -(2.480) -(2.490)
Industry dummies mining 0.398 0.572 0.286 0.435
(1.470) (1.150) (1.470) (1.580)
manufacturing 0.470 *** 0.756 *** 0.337 *** 0.407 *** (3.150) (2.640) (3.060) (2.700)
utilities 0.497 ** 0.778 * 0.352 ** 0.512 ** (2.260) (1.910) (2.200) (2.530)
construction 0.692 *** 1.144 *** 0.489 *** 0.603 *** (4.260) (3.740) (4.110) (3.680)
tertiary 0.516 *** 0.871 *** 0.367 *** 0.528 *** (3.380) (3.030) (3.300) (3.360)
Financing major bank 0.239 ** 0.480 ** 0.170 ** 0.073
(2.220) (2.500) (2.180) (0.690)
regional bank 0.101 0.110 0.067 0.118 (0.640) (0.370) (0.580) (0.730)
foreign bank -0.013 0.006 -0.020 0.696 * -(0.040) (0.010) -(0.080) (1.650)
budget 0.544 * 0.936 * 0.386 * 0.428 (1.830) (1.840) (1.770) (1.230)
other 0.473 ** 0.876 ** 0.338 ** 0.270 (2.210) (2.420) (2.210) (1.380)
Trade partner Ukraine -0.011 -0.141 -0.012 -0.554 *
-(0.040) -(0.260) -(0.050) -(1.910)
CIS (excl. Ukraine) -0.092 -0.162 -0.063 -0.172 -(0.610) -(0.580) -(0.580) -(1.000)
Asia 0.170 0.327 0.122 0.258 (1.040) (1.070) (1.020) (1.560)
Europe -0.076 -0.148 -0.051 0.050
31
-(0.440) -(0.470) -(0.410) (0.280)
US and Canda -0.194 -0.198 -0.156 -0.545 -(0.380) -(0.190) -(0.400) -(0.960)
RoW -0.044 -0.055 -0.026 -0.015
-(0.130) -(0.090) -(0.100) -(0.030) Constant - - 2.836 *** -
(9.640)
region dummies yes yes yes yes
N 670 670 670 659 Wald chi2/ F statistics 62.94 *** 61.06 *** 1.80 *** 137.64 ***
Pseudo R2/ R2 0.0378 0.0377 0.0857 0.0389
Log pseudolikelihood -763.6921 -763.8257 - -710.5824
Table 4. (continued) Model [5] [6] [7] [8]
Dependent variable antisanction antisanction rublerate rublerate Estimator ordered logit OLS ordered probit ordered logit Company's profile
state ownership 0.112 0.036 -0.002 -0.015 (1.480) (1.280) -(0.040) -(0.190)
foreign ownership -0.157 ** -0.060 ** 0.018 0.025 -(2.190) -(2.200) (0.280) (0.240)
joint stock company -0.092 -0.015 0.188 0.352 -(0.400) -(0.180) (1.540) (1.600)
listed company 0.519 0.263 0.116 0.232 (0.590) (0.860) (0.340) (0.450)
size (employment) -0.294 ** -0.106 ** -0.135 ** -0.231 ** -(2.320) -(2.380) -(2.190) -(2.120)
Industry dummies mining 0.688 0.292 -0.083 -0.140
(1.290) (1.570) -(0.310) -(0.310)
manufacturing 0.661 ** 0.268 *** 0.449 *** 0.724 *** (2.190) (2.620) (3.160) (2.860)
utilities 0.856 ** 0.332 ** 0.390 * 0.591 * (2.230) (2.440) (1.920) (1.720)
construction 0.994 *** 0.392 *** 0.654 *** 1.054 *** (3.130) (3.520) (4.050) (3.780)
tertiary 0.876 *** 0.352 *** 0.536 *** 0.894 *** (2.780) (3.290) (3.620) (3.450)
Financing major bank 0.202 0.050 0.105 0.228
(1.040) (0.690) (0.970) (1.250)
regional bank 0.205 0.081 -0.122 -0.181 (0.680) (0.740) -(0.770) -(0.630)
foreign bank 1.172 0.455 0.108 0.197

32
(1.410) (1.580) (0.200) (0.190)
budget 0.809 0.299 0.007 -0.086 (1.370) (1.240) (0.020) -(0.180)
other 0.415 0.178 0.249 0.506 (1.170) (1.320) (1.040) (1.170)
Trade partner Ukraine -1.079 * -0.359 * 0.052 0.041
-(1.880) -(1.850) (0.160) (0.070)
CIS (excl. Ukraine) -0.288 -0.111 0.135 0.304 -(0.830) -(0.940) (0.840) (1.090)
Asia 0.594 ** 0.172 -0.075 -0.149 (1.980) (1.520) -(0.490) -(0.540)
Europe 0.107 0.030 -0.168 -0.285 (0.310) (0.240) -(0.990) -(0.920)
US and Canda -1.251 -0.350 0.051 0.233 -(1.190) -(0.890) (0.100) (0.260)
RoW 0.135 -0.022 -0.711 * -1.343 *
(0.160) -(0.070) -(1.670) -(1.820) Constant - 2.638 *** - -
(9.840)
region dummies yes yes yes yes
N 659 659 675 675 Wald chi2/ F statistics 119.31 *** 4.02 *** 337.15 *** 266.02 ***
Pseudo R2/ R2 0.038 0.0833 0.0521 0.0558
Log pseudolikelihood -711.2547 - -784.9688 -781.9124
Table 4. (continued) Model [9] [10] [11] [12]
Dependent variable rublerate chinastock chinastock chinastock Estimator OLS ordered probit ordered logit OLS Company's profile
state ownership 0.006 0.112 *** 0.203 *** 0.058 ** (0.160) (2.740) (2.680) (2.500)
foreign ownership 0.020 -0.034 -0.080 -0.020 (0.400) -(0.600) -(0.770) -(0.660)
joint stock company 0.168 * -0.093 -0.163 -0.045 (1.670) -(0.750) -(0.700) -(0.680)
listed company 0.084 -0.241 -0.237 -0.109 (0.280) -(0.530) -(0.210) -(0.430)
size (employment) -0.112 ** -0.058 -0.111 -0.032 -(2.170) -(0.880) -(0.910) -(0.910)
Industry dummies mining -0.083 -0.927 ** -1.625 ** -0.478 **
-(0.310) -(2.420) -(2.060) -(2.190)
manufacturing 0.382 *** -0.030 0.001 -0.012
33
(2.920) -(0.210) (0.000) -(0.160)
utilities 0.358 ** 0.055 0.096 0.051 (2.050) (0.210) (0.190) (0.370)
construction 0.541 *** 0.325 * 0.671 ** 0.171 * (3.880) (1.930) (2.180) (1.840)
tertiary 0.449 *** 0.158 0.310 0.098 (3.330) (1.050) (1.060) (1.190)
Financing major bank 0.047 0.075 0.184 0.044
(0.510) (0.650) (0.870) (0.690)
regional bank -0.093 -0.093 -0.226 -0.054 -(0.730) -(0.550) -(0.690) -(0.600)
foreign bank 0.044 0.461 0.917 0.243 (0.110) (0.940) (0.960) (0.830)
budget 0.078 -0.171 -0.344 -0.086 (0.350) -(0.630) -(0.660) -(0.630)
other 0.164 -0.131 -0.236 -0.075 (0.860) -(0.610) -(0.570) -(0.630)
Trade partner Ukraine 0.078 -0.239 -0.427 -0.145
(0.280) -(0.880) -(0.800) -(1.020)
CIS (excl. Ukraine) 0.095 -0.363 ** -0.630 * -0.181 ** (0.720) -(2.100) -(1.900) -(2.010)
Asia -0.082 0.552 *** 1.069 *** 0.307 *** -(0.660) (3.030) (3.320) (2.960)
Europe -0.195 0.121 0.208 0.056 -(1.340) (0.590) (0.580) (0.480)
US and Canda 0.042 -0.655 -1.524 -0.289 (0.090) -(0.970) -(0.970) -(0.810)
RoW -0.688 -0.534 -0.931 -0.261
-(1.600) -(1.460) -(1.350) -(1.290) Constant 3.404 *** - - 2.189 ***
(11.110) (10.210)
region dummies yes yes yes yes
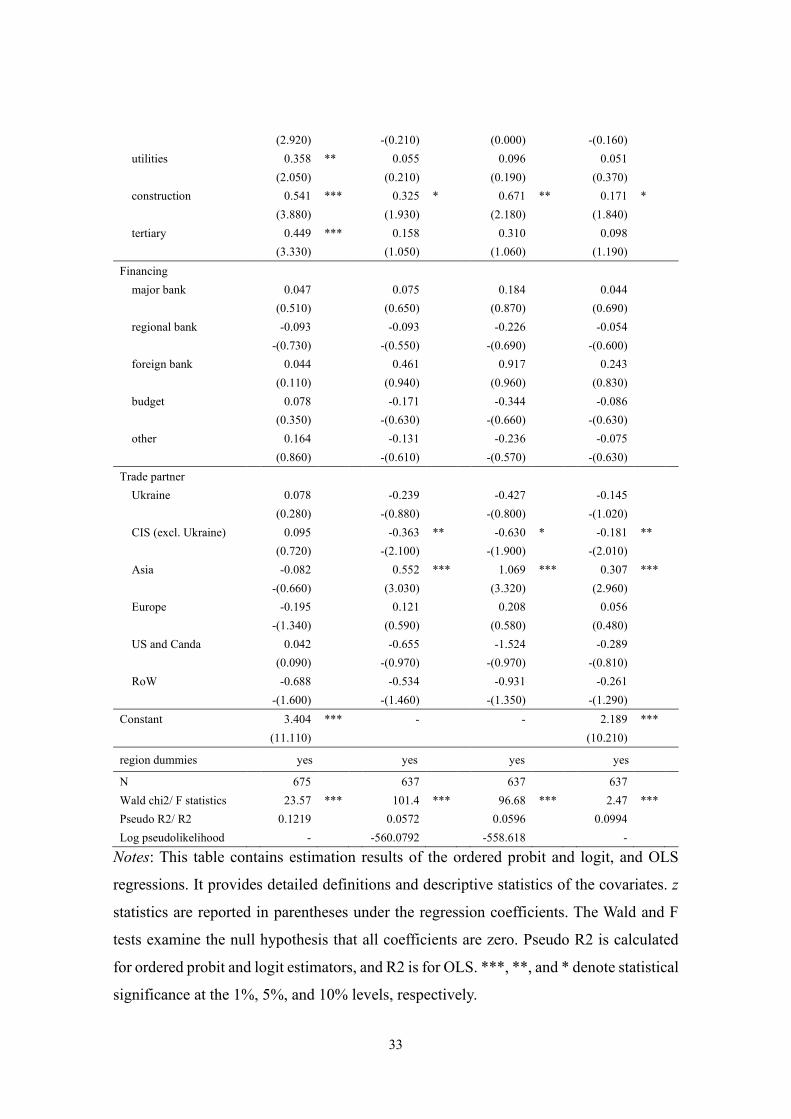
N 675 637 637 637 Wald chi2/ F statistics 23.57 *** 101.4 *** 96.68 *** 2.47 ***
Pseudo R2/ R2 0.1219 0.0572 0.0596 0.0994
Log pseudolikelihood - -560.0792 -558.618 -
Notes: This table contains estimation results of the ordered probit and logit, and OLS
regressions. It provides detailed definitions and descriptive statistics of the covariates. z
statistics are reported in parentheses under the regression coefficients. The Wald and F
tests examine the null hypothesis that all coefficients are zero. Pseudo R2 is calculated
for ordered probit and logit estimators, and R2 is for OLS. ***, **, and * denote statistical
significance at the 1%, 5%, and 10% levels, respectively.

34
Table 5 Estimation Results: Impact of Various Shocks on the Sanctions Assessment
Model [1] [2] [3] Dependent variable sanction sanction sanction Estimator ordered probit ordered logit OLS Other Shock
antisanction 1.029 *** 2.074 *** 0.588 *** (10.400) (11.600) (13.770)
rublerate
chinastock
Company's profile
state ownership 0.028 0.044 0.017 (0.590) (0.550) (0.600)
foreign ownership -0.045 -0.067 -0.024 -(0.790) -(0.730) -(0.760)
joint stock company 0.106 0.260 0.064 (0.880) (1.260) (0.930)
listed company 0.304 0.553 0.155 (0.890) (0.890) (0.830)
size (employment) -0.126 * -0.229 * -0.071 * -(1.940) -(1.940) -(1.890)
Industry dummies mining 0.184 0.287 0.103
(0.740) (0.750) (0.750)
manufacturing 0.292 * 0.520 ** 0.163 * (1.910) (2.030) (1.850)
utilities 0.269 0.492 0.144 (1.170) (1.240) (1.110)
construction 0.401 ** 0.741 *** 0.222 ** (2.470) (2.580) (2.370)
tertiary 0.282 * 0.636 ** 0.160 * (1.830) (2.400) (1.840)
Financing major bank 0.209 * 0.432 ** 0.124 *
(1.920) (2.260) (1.960)
regional bank 0.034 0.029 0.018 (0.210) (0.110) (0.200)
foreign bank -0.543 * -1.057 * -0.306 * -(1.720) -(1.720) -(1.700)
budget 0.350 0.517 0.202 (0.930) (0.980) (0.910)
other 0.376 0.626 0.217 (1.280) (1.330) (1.290)
Trade partner

35
Ukraine 0.385 0.706 0.213 (1.080) (1.120) (1.020)
CIS (excl. Ukraine) 0.032 -0.032 0.015 (0.200) -(0.110) (0.160)
Asia 0.019 -0.154 0.009 (0.110) -(0.510) (0.080)
Europe -0.095 -0.058 -0.051 -(0.520) -(0.170) -(0.480)
US and Canda 0.060 -0.018 0.035 (0.120) -(0.020) (0.120)
RoW -0.093 -0.076 -0.060
-(0.280) -(0.140) -(0.310) Constant - - 1.351 ***
(5.230)
region dummies yes yes yes
N 657 657 657 Wald chi2/ F statistics 186.54 *** 202.75 *** 9.94 ***
Pseudo R2/ R2 0.1942 0.2155 0.3694
Log pseudolikelihood -624.1596 -607.6911 -
Table 5. (continued) Model [4] [5] [6]
Dependent variable sanction sanction sanction Estimator ordered probit ordered logit OLS Other Shock
antisanction
rublerate 0.601 *** 1.078 *** 0.376 *** (10.190) (9.530) (10.560)
chinastock
Company's profile
state ownership 0.050 0.091 0.030 (1.100) (1.090) (1.020)
foreign ownership -0.109 ** -0.206 ** -0.067 ** -(2.150) -(2.220) -(2.110)
joint stock company -0.054 -0.115 -0.029 -(0.440) -(0.520) -(0.360)
listed company 0.446 0.908 0.284 (1.150) (1.330) (1.150)
size (employment) -0.132 ** -0.217 * -0.082 * -(1.970) -(1.670) -(1.890)
Industry dummies mining 0.506 * 0.775 0.317 *

36
(1.790) (1.480) (1.760)
manufacturing 0.286 * 0.448 0.181 * (1.810) (1.520) (1.780)
utilities 0.325 0.498 0.204 (1.420) (1.170) (1.370)
construction 0.457 *** 0.733 ** 0.285 *** (2.660) (2.330) (2.570)
tertiary 0.312 ** 0.492 * 0.194 * (1.980) (1.670) (1.920)
Financing major bank 0.259 ** 0.463 ** 0.162 **
(2.470) (2.390) (2.390)
regional bank 0.166 0.346 0.105 (1.040) (1.140) (1.020)
foreign bank -0.035 0.033 -0.026 -(0.100) (0.050) -(0.120)
budget 0.593 * 1.168 ** 0.369 * (1.770) (2.020) (1.700)
other 0.427 * 0.856 ** 0.280 * (1.790) (2.130) (1.850)
Trade partner Ukraine -0.041 -0.099 -0.030
-(0.140) -(0.190) -(0.160)
CIS (excl. Ukraine) -0.144 -0.300 -0.089 -(0.930) -(1.040) -(0.900)
Asia 0.186 0.348 0.118 (1.180) (1.180) (1.160)
Europe 0.036 0.003 0.022 (0.210) (0.010) (0.200)
US and Canda -0.240 -0.065 -0.156 -(0.390) -(0.050) -(0.370)
RoW 0.331 0.519 0.217
(0.950) (0.780) (0.960) Constant - - 1.566 ***
(5.370)
region dummies yes yes yes
N 666 666 666 Wald chi2/ F statistics 164.91 *** 150.32 *** 5.11 ***
Pseudo R2/ R2 0.1255 0.122 0.2587
Log pseudolikelihood -690.0154 -692.8094 -
Table 5. (continued) Model [7] [8] [9]
Dependent variable sanction sanction sanction

37
Estimator ordered probit ordered logit OLS Other Shock
antisanction
rublerate
chinastock 0.566 *** 1.121 *** 0.370 ***
(6.200) (6.560) (6.560) Company's profile
state ownership -0.005 -0.011 -0.003 -(0.110) -(0.140) -(0.100)
foreign ownership -0.079 -0.161 * -0.050 -(1.340) -(1.700) -(1.320)
joint stock company 0.082 0.124 0.055 (0.660) (0.580) (0.660)
listed company 0.475 0.839 0.314 (1.280) (1.200) (1.240)
size (employment) -0.131 * -0.226 * -0.085 * -(1.910) -(1.750) -(1.860)
Industry dummies mining 0.756 ** 1.215 ** 0.493 **
(2.480) (2.340) (2.440)
manufacturing 0.428 *** 0.741 ** 0.279 *** (2.740) (2.510) (2.650)
utilities 0.482 ** 0.856 ** 0.313 ** (2.180) (2.140) (2.140)
construction 0.594 *** 0.967 *** 0.385 *** (3.480) (3.040) (3.320)
tertiary 0.502 *** 0.940 *** 0.326 *** (3.130) (3.180) (3.070)
Financing major bank 0.289 *** 0.569 *** 0.189 **
(2.560) (2.840) (2.510)
regional bank 0.199 0.339 0.127 (1.230) (1.140) (1.180)
foreign bank -0.170 -0.303 -0.107 -(0.650) -(0.660) -(0.640)
budget 0.666 ** 1.271 ** 0.436 ** (2.180) (2.430) (2.110)
other 0.488 * 0.962 ** 0.325 ** (1.940) (2.400) (1.980)
Trade partner Ukraine 0.048 -0.070 0.027
(0.130) -(0.100) (0.110)
CIS (excl. Ukraine) -0.086 -0.153 -0.052 -(0.520) -(0.500) -(0.470)

38
Asia -0.001 -0.092 -0.001 (0.000) -(0.280) -(0.010)
Europe -0.106 -0.185 -0.072 -(0.570) -(0.540) -(0.570)
US and Canda 0.373 0.813 0.243 (0.870) (1.110) (0.870)
RoW 0.035 0.120 0.019
(0.090) (0.170) (0.070) Constant - - 1.909 ***
(6.090)
region dummies yes yes yes
N 633 633 633 Wald chi2/ F statistics 97.82 *** 103.67 *** 3.26 ***
Pseudo R2/ R2 0.0803 0.0877 0.1699
Log pseudolikelihood -674.5016 -669.1095 -
Notes: This table contains estimation results of the ordered probit and logit, and OLS
regressions. It provides detailed definitions and descriptive statistics of the covariates. z
statistics are reported in parentheses under the regression coefficients. The Wald and F
tests examine the null hypothesis that all coefficients are zero. Pseudo R2 is calculated
for ordered probit and logit estimators, and R2 is for OLS. ***, **, and * denote statistical
significance at the 1%, 5%, and 10% levels, respectively.

39
Table 6. Estimation results: Impact of the sanctions on the other shock assessment
Model [1] [2] [3] Dependent variable antisanction antisanction antisanction Estimator ordered probit ordered logit OLS Sanctions 0.985 *** 1.996 *** 0.529 ***
(9.980) (10.950) (13.310) Company's profile
state ownership 0.036 0.069 0.016 (0.860) (0.850) (0.690)
foreign ownership -0.055 -0.102 -0.029 -(1.070) -(0.980) -(1.050)
joint stock company -0.091 -0.246 -0.044 -(0.810) -(1.220) -(0.740)
listed company 0.151 0.352 0.100 (0.370) (0.540) (0.460)
size (employment) -0.068 -0.125 -0.036 -(1.110) -(1.130) -(1.090)
Industry dummies mining 0.268 0.427 0.146
(1.080) (0.940) (1.110)
manufacturing 0.199 0.271 0.098 (1.270) (1.050) (1.200)
utilities 0.292 0.445 0.152 (1.350) (1.240) (1.350)
construction 0.312 * 0.409 0.155 * (1.830) (1.370) (1.680)
tertiary 0.308 * 0.359 0.157 * (1.880) (1.220) (1.760)
Financing major bank -0.059 -0.124 -0.032
-(0.550) -(0.620) -(0.550)
regional bank 0.078 0.175 0.045 (0.490) (0.600) (0.530)
foreign bank 0.910 ** 1.728 ** 0.476 ** (2.270) (2.370) (2.120)
budget 0.154 0.471 0.099 (0.350) (0.840) (0.420)
other 0.020 0.067 0.006 (0.070) (0.140) (0.040)
Trade partner Ukraine -0.694 ** -1.252 ** -0.359 **
-(2.170) -(2.020) -(2.100)
CIS (excl. Ukraine) -0.167 -0.224 -0.084 -(0.890) -(0.660) -(0.820)
Asia 0.196 0.494 * 0.113

40
(1.130) (1.650) (1.190)
Europe 0.114 0.004 0.048 (0.600) (0.010) (0.450)
US and Canda -0.470 -1.219 -0.259 -(0.860) -(1.310) -(0.860)
RoW 0.028 0.177 0.015
(0.060) (0.220) (0.060) Constant - - 1.104 ***
(4.980)
region dummies yes yes yes
N 657 657 657 Wald chi2/ F statistics 188.1 *** 184.6 *** 8.74 ***
Pseudo R2/ R2 0.2017 0.2203 0.3685
Log pseudolikelihood -589.2185 -575.5031 -
Table 6. (continued) Model [4] [5] [6]
Dependent variable rublerate rublerate rublerate Estimator ordered probit ordered logit OLS Sanctions 0.728 *** 1.273 *** 0.500 ***
(11.050) (10.650) (11.150) Company's profile
state ownership -0.020 -0.072 -0.009 -(0.460) -(0.970) -(0.270)
foreign ownership 0.065 0.109 0.051 (0.970) (0.990) (1.080)
joint stock company 0.202 0.412 * 0.161 * (1.620) (1.890) (1.760)
listed company -0.101 -0.158 -0.077 -(0.280) -(0.260) -(0.280)
size (employment) -0.056 -0.089 -0.051 -(0.930) -(0.820) -(1.130)
Industry dummies mining -0.285 -0.479 -0.224
-(1.000) -(0.960) -(0.900)
manufacturing 0.286 * 0.496 * 0.229 * (1.900) (1.850) (1.900)
utilities 0.232 0.344 0.198 (1.070) (0.920) (1.200)
construction 0.374 ** 0.614 ** 0.295 ** (2.210) (2.110) (2.280)
tertiary 0.368 ** 0.626 ** 0.276 ** (2.420) (2.310) (2.260)
Financing

41
major bank -0.001 0.007 -0.043 -(0.010) (0.030) -(0.530)
regional bank -0.178 -0.386 -0.138 -(1.100) -(1.290) -(1.180)
foreign bank 0.071 0.187 0.041 (0.140) (0.190) (0.110)
budget -0.235 -0.523 -0.088 -(0.710) -(0.910) -(0.380)
other 0.048 0.198 0.000 (0.180) (0.420) (0.000)
Trade partner Ukraine 0.028 0.035 0.071
(0.090) (0.060) (0.300)
CIS (excl. Ukraine) 0.187 0.386 0.119 (1.170) (1.340) (1.010)
Asia -0.114 -0.229 -0.111 -(0.760) -(0.830) -(1.060)
Europe -0.145 -0.234 -0.169 -(0.870) -(0.770) -(1.350)
US and Canda 0.165 0.681 0.114 (0.250) (0.620) (0.230)
RoW -0.810 * -1.560 * -0.669 *
-(1.800) -(1.890) -(1.700) Constant - - 1.979 ***
(6.480)
region dummies yes yes yes
N 666 666 666 Wald chi2/ F statistics 255.44 *** 242.57 *** 10.89 ***
Pseudo R2/ R2 0.1376 0.1402 0.2861
Log pseudolikelihood -706.8529 -704.7119 -
Table 6. (continued) Model [7] [8] [9]
Dependent variable chinastock chinastock chinastock Estimator ordered probit ordered logit OLS Sanctions 0.506 *** 0.988 *** 0.246 ***
(6.620) (6.650) (6.660) Company's profile
state ownership 0.110 *** 0.207 *** 0.054 ** (2.750) (2.810) (2.560)
foreign ownership -0.008 -0.031 -0.006 -(0.120) -(0.240) -(0.170)
joint stock company -0.114 -0.220 -0.047 -(0.910) -(0.900) -(0.750)
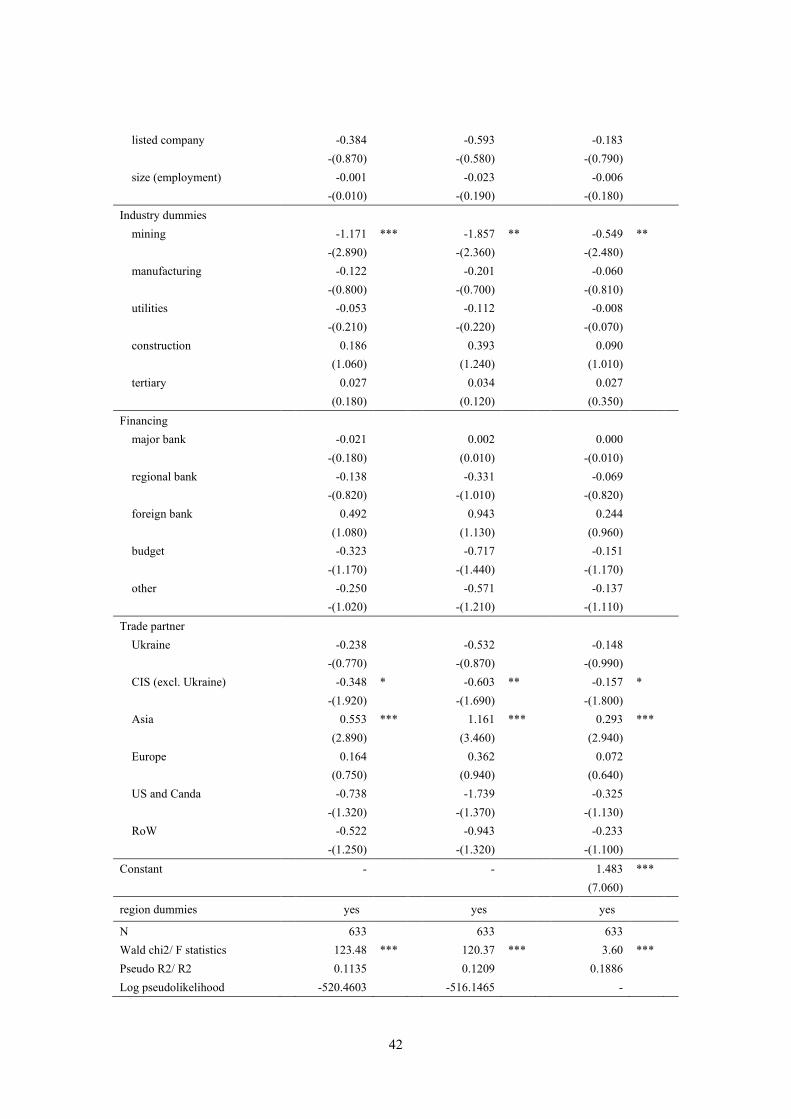
42
listed company -0.384 -0.593 -0.183 -(0.870) -(0.580) -(0.790)
size (employment) -0.001 -0.023 -0.006 -(0.010) -(0.190) -(0.180)
Industry dummies mining -1.171 *** -1.857 ** -0.549 **
-(2.890) -(2.360) -(2.480)
manufacturing -0.122 -0.201 -0.060 -(0.800) -(0.700) -(0.810)
utilities -0.053 -0.112 -0.008 -(0.210) -(0.220) -(0.070)
construction 0.186 0.393 0.090 (1.060) (1.240) (1.010)
tertiary 0.027 0.034 0.027 (0.180) (0.120) (0.350)
Financing major bank -0.021 0.002 0.000
-(0.180) (0.010) -(0.010)
regional bank -0.138 -0.331 -0.069 -(0.820) -(1.010) -(0.820)
foreign bank 0.492 0.943 0.244 (1.080) (1.130) (0.960)
budget -0.323 -0.717 -0.151 -(1.170) -(1.440) -(1.170)
other -0.250 -0.571 -0.137 -(1.020) -(1.210) -(1.110)
Trade partner Ukraine -0.238 -0.532 -0.148
-(0.770) -(0.870) -(0.990)
CIS (excl. Ukraine) -0.348 * -0.603 ** -0.157 * -(1.920) -(1.690) -(1.800)
Asia 0.553 *** 1.161 *** 0.293 *** (2.890) (3.460) (2.940)
Europe 0.164 0.362 0.072 (0.750) (0.940) (0.640)
US and Canda -0.738 -1.739 -0.325 -(1.320) -(1.370) -(1.130)
RoW -0.522 -0.943 -0.233
-(1.250) -(1.320) -(1.100) Constant - - 1.483 ***
(7.060)
region dummies yes yes yes
N 633 633 633 Wald chi2/ F statistics 123.48 *** 120.37 *** 3.60 ***
Pseudo R2/ R2 0.1135 0.1209 0.1886
Log pseudolikelihood -520.4603 -516.1465 -

43
Notes: This table contains estimation results of the ordered probit and logit, and OLS
regressions. It provides detailed definitions and descriptive statistics of the covariates. z
statistics are reported in parentheses under the regression coefficients. The Wald and F
tests examine the null hypothesis that all coefficients are zero. Pseudo R2 is calculated
for ordered probit and logit estimators, and R2 is for OLS. ***, **, and * denote statistical
significance at the 1%, 5%, and 10% levels, respectively.

44
Table 7. Estimation results: Extended ordered probit models with endogenous variables Model [1] [2] [3]
Dependent variable sanction sanction sanction Estimator ordered probit ordered probit ordered probit Endogenous variable antisanction rublerate chinastock
rather positive 0.568 0.663 ** -0.669 (0.580) (2.370) -(1.270)
no impact 1.488 1.757 *** 0.948 (0.760) (6.710) (1.600)
rather negative 2.361 2.644 *** 2.503 *** (0.820) (10.090) (3.790)
definitely negative 3.192 4.222 *** 4.056 ***
(0.840) (15.160) (5.750) Company's profile
state ownership 0.034 0.047 -0.055 (0.540) (1.090) -(1.250)
foreign ownership -0.051 -0.048 -0.028 -(0.690) -(0.730) -(0.440)
joint stock company 0.107 -0.052 0.155 (0.830) -(0.440) (1.300)
listed company 0.357 0.497 0.498 (0.830) (1.390) (1.460)
size (employment) -0.139 -0.027 -0.056 -(1.280) -(0.430) -(0.880)
Industry dummies mining 0.230 0.418 ** 0.430 *
(0.600) (2.010) (1.950)
manufacturing 0.335 0.166 0.303 *** (1.200) (1.550) (2.670)
utilities 0.308 0.254 0.341 ** (0.920) (1.480) (1.960)
construction 0.442 0.292 ** 0.424 *** (1.550) (2.320) (3.200)
tertiary 0.330 0.257 ** 0.368 *** (1.180) (2.270) (3.170)
Financing major bank 0.206 * 0.232 *** 0.201 **
(1.860) (2.830) (2.410)
regional bank 0.034 0.172 0.175 (0.220) (1.550) (1.570)
foreign bank -0.540 -0.025 -0.095 -(1.150) -(0.080) -(0.280)
budget 0.358 0.475 * 0.561 ** (1.030) (1.940) (2.130)
other 0.375 * 0.312 ** 0.349 **

45
(1.730) (2.030) (2.020)
Trade partner Ukraine 0.395 0.082 0.107
(1.190) (0.380) (0.440)
CIS (excl. Ukraine) 0.035 -0.188 -0.096 (0.220) -(1.670) -(0.800)
Asia 0.011 0.031 -0.127 (0.070) (0.300) -(1.100)
Europe -0.098 -0.014 -0.171 -(0.600) -(0.120) -(1.380)
US and Canda 0.047 0.360 0.259 (0.110) (1.100) (0.710)
RoW -0.103 0.062 0.087
-(0.170) (0.150) (0.190)
region dummies yes yes yes
N 657 611 633 Wald chi2 60.18 ** 742.7 *** 487.17 ***
Log pseudolikelihood -1348.26 -1331.49 -1245.10
Error correlation 0.13 -0.80 *** -0.78 ***
Table 7. (continued) Model [4] [5] [6]
Dependent variable antisanction rublerate chinastock Estimator ordered probit ordered probit ordered probit Endogenous variable sanction sanction sanction
rather positive 1.579 *** 1.791 *** 0.369 (5.430) (6.050) (0.380)
no impact 3.436 *** 3.121 *** 0.689 (10.790) (10.580) (0.370)
rather negative 5.070 *** 4.530 *** 1.437 (15.070) (15.020) (0.520)
definitely negative 6.455 *** 6.302 *** 1.626
(19.110) (18.990) (0.440) Company's profile
state ownership -0.048 -0.061 0.115 * -(1.160) -(1.470) (1.760)
foreign ownership 0.022 0.086 -0.006 (0.380) (1.490) -(0.070)
joint stock company -0.014 0.144 -0.120 -(0.130) (1.290) -(0.840)
listed company -0.376 -0.396 -0.370 -(1.140) -(1.190) -(0.750)
size (employment) 0.103 * 0.072 -0.011 (1.710) (1.180) -(0.100)

46
Industry dummies mining 0.200 -0.129 -1.307 ***
(1.320) -(0.800) -(3.890)
manufacturing 0.095 0.121 -0.115 (1.350) (1.580) -(0.700)
utilities 0.062 0.108 -0.035 (0.540) (0.880) -(0.140)
construction 0.091 0.195 ** 0.261 (1.100) (2.110) (1.380)
tertiary 0.122 * 0.158 ** 0.030 (1.720) (1.970) (0.180)
Financing major bank -0.038 -0.041 -0.066
-(0.720) -(0.700) -(0.540)
regional bank 0.077 -0.079 -0.201 (1.050) -(0.970) -(1.190)
foreign bank 0.438 * 0.136 0.471 (1.830) (0.560) (0.960)
budget 0.093 -0.166 -0.363 (0.550) -(0.900) -(0.920)
other 0.118 0.041 -0.294 (1.100) (0.360) -(1.240)
Trade partner Ukraine -0.403 ** 0.110 -0.178
-(2.380) (0.640) -(0.470)
CIS (excl. Ukraine) -0.090 0.067 -0.399 -(1.240) (0.790) -(2.270)
Asia 0.101 -0.090 0.541 *** (1.420) -(1.120) (3.390)
Europe 0.049 -0.109 0.289 (0.640) -(1.230) (1.570)
US and Canda -0.141 0.112 -0.853 -(0.690) (0.500) -(1.580)
RoW -0.022 -0.380 -0.560
-(0.080) -(1.210) -(0.810)
region dummies yes yes yes
N 649 658 626 Wald chi2 1075.98 *** 1076.04 *** 88.75 ***
Log pseudolikelihood -1315.19 -1457.42 -1221.74
Error correlation -0.95 *** -0.93 *** -0.01
Notes: This table contains estimation results of the extended ordered probit regressions
introducing an endogenous variable. Models [1]–[3] introduce antisanction, rublerate,
and chinastock as endogenous variables, respectively: antisanction is instrumented by a

47
dummy variable for the primary industry; rublerate by the impact assessment of the
global financial crisis; chinastock by a dummy variable for foreign trade operations.
Models [4]–[6] introduce sanction as an endogenous variable that is instrumented by a
dummy variable for state procurement. z statistics are reported in parentheses under the
regression coefficients. The Wald test examines the null hypothesis that all coefficients
are zero. The error correlations represent estimates of the correlation between equations
for the outcomes and endogenous covariates, thus examining the null hypothesis of the
exogeneity of the covariate. ***, **, and * denote statistical significance at the 1%, 5%,
and 10% levels, respectively.

48
Figure 1. Marginal effects of various shocks on sanctions assessment
Note: Average marginal effects of other shocks on sanctions assessment (with a 95% confidence
interval) are based on estimation results [1] ((a) antisanction), [2] ((b) rublerate) and [3] ((c)
chinastock) on Table 7. They depict the correspondence of the magnitude of the impact assessment of
sanctions and other shocks. The vertical axis (y) measures the magnitude of the impact of each shock
on the sanctions assessment. The horizontal axis (x) corresponds to the extent of the impact assessment
of each shock (independent variable): “rather positive,” “no impact,” “rather negative,” and “definitely
negative,” where “definitely positive” is the base outcome. Each line in the figure corresponds to the
impact assessment of sanction; red line: the impact of the sanctions is assessed as having a “definitely
negative” impact on the company management; blue line – “rather negative;” black line – “no impact;”
green line – “rather positive;” and yellow line – “definitely positive.”
(a) the impact of antisanction on sanction (b) the impact of rublerate on sanction
(c) the impact of chinastock on sanction
-1.2
50
1.25
rather positive no impact rather negative def.negative
-1.2
50
1.25
rather positive no impact rather negative def.negative
-1.2
50
1.25
rather positive no impact rather negative def.negative
predict (definitely positive) predict (rather positive)predict (no impact) predict (rather negative)predict (definitely negative)
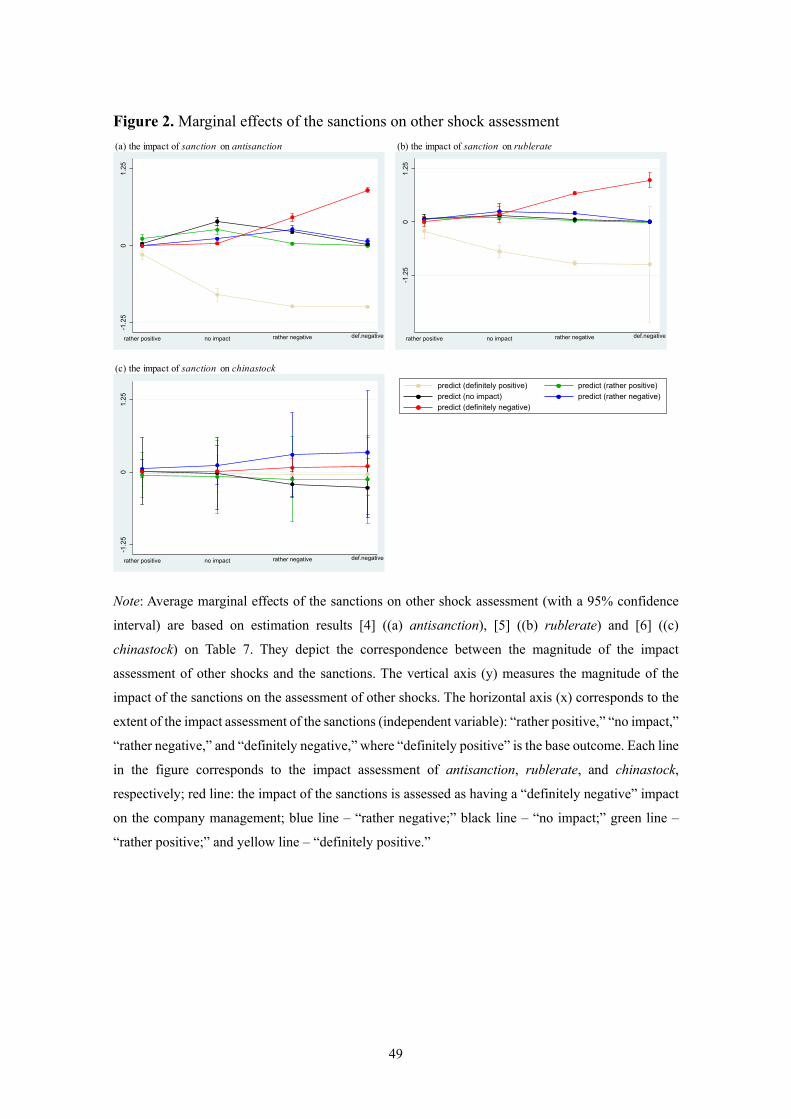
49
Figure 2. Marginal effects of the sanctions on other shock assessment
Note: Average marginal effects of the sanctions on other shock assessment (with a 95% confidence
interval) are based on estimation results [4] ((a) antisanction), [5] ((b) rublerate) and [6] ((c)
chinastock) on Table 7. They depict the correspondence between the magnitude of the impact
assessment of other shocks and the sanctions. The vertical axis (y) measures the magnitude of the
impact of the sanctions on the assessment of other shocks. The horizontal axis (x) corresponds to the
extent of the impact assessment of the sanctions (independent variable): “rather positive,” “no impact,”
“rather negative,” and “definitely negative,” where “definitely positive” is the base outcome. Each line
in the figure corresponds to the impact assessment of antisanction, rublerate, and chinastock,
respectively; red line: the impact of the sanctions is assessed as having a “definitely negative” impact
on the company management; blue line – “rather negative;” black line – “no impact;” green line –
“rather positive;” and yellow line – “definitely positive.”
(a) the impact of sanction on antisanction (b) the impact of sanction on rublerate
(c) the impact of sanction on chinastock
-1.2
50
1.25
rather positive no impact rather negative def.negative
-1.2
50
1.25
rather positive no impact rather negative def.negative
-1.2
50
1.25
rather positive no impact rather negative def.negative
predict (definitely positive) predict (rather positive)predict (no impact) predict (rather negative)predict (definitely negative)